


Liquid Discharges from Nuclear Installations in 2024
Executive Summary
This report presents the 2024 data for liquid radioactive discharges from nuclear installations along with temporal trends for the period 1989 - 2024. On this basis, an assessment has been made for the discharges from the nuclear sector which comprises the following sub-sectors;
- nuclear power stations;
- nuclear fuel reprocessing plants;
- nuclear fuel fabrication and enrichment plants;
- research and development facilities;
- decommissioning facilities and management of legacy radioactive wastes activities.
Discharges are reported as total alpha, tritium and total beta (excluding tritium) in terabecquerels per year (TBq/y).
The overall trend in 2024 is a steady continuing reduction in the majority of reported discharges which reflects the longer-term trend.
The total discharges of alpha activity from all nuclear installations in 2024 were around 0.1 TBq which is a small decrease of 0.02 TBq over the previous year. Discharges of total alpha in 2024 are only about 3.2% of the 1989 peak and the lowest year on record.
Discharges from the fuel reprocessing sub-sector contributed 42% and the decommissioning sub-sector contributed over fifty percent for the second consecutive year with 53% of the overall total alpha discharge in 2024. The single largest contributor of alpha discharges in 2024 was decommissioning related discharges from Sellafield at 51% of the total.
The total discharge of tritium from all nuclear facilities in 2024 was similar to 2023 at 11,900 TBq, a decrease of approximately 8% on the 2021 & 2022 results. Discharges of tritium are still being dominated by those from the reprocessing sector with 82% of the total from all installations coming from La Hague.
Discharges of total beta activity (excluding tritium) from all nuclear installations have decreased markedly since 1989 (930 TBq) to 2024 (9.2 TBq). In 2024 total beta discharges decreased by around 4% from the previous year to about 9.6 TBq and represents the lowest recorded levels since 1989. Historically, total beta discharges have been dominated by discharges from the reprocessing plants and the nuclear fuel fabrication plant at Springfields to a lesser extent. In 2024, the contribution of the reprocessing sub-sector increased slightly from 36% in 2023 to 44% of the total but this is still much lower than the peak contribution of this sub-sector (81% in 2007).
The contribution of decommissioning discharges in 2024 was lower than 2023 which means this is the second highest contributing sub-sector in 2024 (40% of all installations). Discharges from decommissioning, and the management of historical or legacy waste, in 2024 was 3.8 TBq.
Introduction
Work to prevent and reduce pollution from ionising radiation in the North-East Atlantic was first undertaken within the framework of the former 1974 Convention for the Prevention of Marine Pollution from Land-based Sources (the “Paris Convention”) and then under the 1992 Convention for the Protection of the Marine Environment of the North-East Atlantic (the “OSPAR Convention”), which replaces the Paris Convention and establishes the OSPAR Commission.
At the first Ministerial Meeting of the OSPAR Commission (20-24 July 1998, Sintra, Portugal), an OSPAR Strategy for Radioactive Substances was adopted to guide the future work of the OSPAR Commission on protecting the marine environment of the North-East Atlantic against radioactive substances arising from human activities. This strategy was revised at the third Ministerial Meeting of the OSPAR Commission (23-24 September 2010, Bergen, Norway), where the Strategy of the OSPAR Commission for the Protection of the Marine Environment of the North-East Atlantic 2010-2020 (the “North-East Strategy”) was adopted. In 2021, the North-East Atlantic Environment Strategy (NEAES) 2030 was agreed in Cascais, Portugal to cover the period 2020 - 2030.
The NEAES sets out OSPAR’s vision, objectives, strategic directions, and action for the period up to 2030. In Part I, the new Strategy sets out its 12 strategic objectives. Strategic Objective 3 commits OSPAR Contracting Parties to Prevent pollution by radioactive substances in order to safeguard human health and to protect the marine environment with the ultimate aim of achieving and maintaining concentrations in the marine environment at near background values for naturally occurring radioactive substances and close to zero for human made radioactive substances.
Strategic objective 3 is supported by 4 operational objectives setting targets and further details of how Strategic Ojective 3 will be achieved. These are:
- S3.O1: On an ongoing basis OSPAR will further prevent, progressively reduce or, where that is not practicable, minimise discharges of radioactive substances through the application of Best Available Techniques (BAT), taking into account technical feasibility, radiological impact and legitimate uses of the sea.
- S3.O2: By 2025 OSPAR will identify and consider any obstacles in achieving further reductions in environmental concentrations of radioactive substances in the marine environment and examine possible solutions where appropriate.
- S3.O3: By 2025 OSPAR will identify the different types of loss of radioactive substances that may contribute to pollution of the marine environment. By 2027 OSPAR will determine if any additional measures are required to prevent such pollution, to the extent that such pollution is not already the subject of effective measures agreed by other international organisations or prescribed by other international conventions.
- S3.O4: By 2028 OSPAR will, following the outcome of the Quality Status report 2024, address, where appropriate, any uncertainties by reviewing and updating methodologies to better determine the possible impact of releases, emissions and losses of radioactive substances on marine ecosystems.
The NEAES 2030 provides a means for achieving a clean, healthy and biologically supportive North-East Atlantic Ocean, which is productive, used sustainably and resilient to climate change and ocean acidification. The OSPAR Commission will continue to monitor and assess the status of the OSPAR maritime area ensuring that data collection and assessment programmes are kept under continuous review. The effective use and management of data and information is required to support the production of robust assessments.
To this end, the Radioactive Substances Committee (RSC) continues the annual collection of data on discharges of radionuclides from the nuclear sector. Regular reporting is required in order to review progress towards the radioactive strategic and operational objectives of the NEAES 2030.
Programmes and Measures
Since the mid 1980s, liquid discharges of radioactive substances from nuclear installations have been addressed first under the former Paris Convention and then under the OSPAR Convention. The following relevant measures are applicable under the OSPAR Convention:
- PARCOM Recommendation 88/4 on Nuclear Reprocessing Plants
- OSPAR Recommendation 2018/01 on Radioactive Discharges 1
- PARCOM Recommendation 94/8 Concerning Environmental Impact Resulting from Discharges of Radioactive Discharges 2
- OSPAR Decision 2000/1 on Substantial Reductions and Elimination of Discharges, Emissions and Losses of Radioactive Discharges, with Special Emphasis on Nuclear Reprocessing.
The OSPAR Fifth Periodic Evaluation of the Progress in Implementing the OSPAR Radioactive Substances Strategy, published in 2022 (OSPAR publication 2016/687), has also informed this report.
1 The implementation of this Recommendation requires an assessment to be carried out as to whether BAT is being applied in nuclear installations. Contracting Parties submit national reports that also contain discharge data on a regular basis thereby using the Guidelines for the submission of information about, and the assessment of, the application of BAT in nuclear facilities (reference number: 2004-03).
2 Assessments of the effect and relative contributions of remobilised historical discharges and current discharges of radioactive substances, including wastes, on the marine environment have been published in the Quality Status Report 2000 published by the OSPAR Commission in 2000 (ISBN 0 946956 52 9) and in the MARINA II Report published by the European Commission (EC, 2003).
Annual Reporting
In 1985, Contracting Parties to the former Paris Convention initiated reporting on liquid discharges from nuclear installations. These data have subsequently been submitted annually by Contracting Parties, collated by the Secretariat and, following examination by the Expert Assessment Panel (EAP) of the OSPAR Radioactive Substances Committee, published by the OSPAR Commission in the form of annual reports. At first annual reports were published as part of the OSPAR Commission's general Annual Report, and from 1991 onwards they are published in the form of Annual OSPAR Reports on Liquid Discharges from Nuclear Installations in the OSPAR maritime area. From 1998 onwards, the annual reports also contain an assessment of liquid discharges which include a description of the trends from 1989 until the date of the latest report. Over time, reporting requirements and formats for data collection as regards nuclear installations have been regularly reviewed and updated in the light of experience and ongoing work under the OSPAR Commission. With a view to harmonising the way in which data and information are being established and reported, the OSPAR Commission adopted in 1996 a set of reporting formats for the annual Collection of Data on Liquid Discharges from Nuclear Installations, which were updated in 2010 to include a guide to generate “total-α” and “total β” discharge data. There was a further update of the set of reporting formats in 2013 (OSPAR Agreement: 2013-10) which were revised in 2021.
RSC decided at its annual meeting in 2006, that for data from 2005 onwards, discharges arising from decommissioning and the recovery and conditioning of legacy wastes should be reported separately from operational nuclear discharges. The discharges from such activities were reported as “Exceptional Discharges” and appear in this report in a separate table.
Parameters Monitored and Reported
Tables 1-8 of this report contain data on total-α (Table 1), tritium (Table 2), total-β (Table 3), and individual radionuclides (Tables 4-8). Figures 1-3 of this report show trends in discharges of total-α activity, tritium and total-β activity respectively.
Total-α and total-β values are useful as they will encompass the contribution to the overall activity from a wide range of radionuclides which, individually, would be difficult to measure or could be below detection limits. However, total-α and total-β values provide limited information about the potential harm and, as such, information should be based on the characteristics of individual radionuclides. Tritium is reported separately.
There is currently little consistency in the approach adopted by Contracting Parties in the assessment of total-α and total-β quantities. Consequently, for the purposes of this report total-α quantities include measurements that are strictly gross-α. The calculation of total-β varies between Contracting Parties. For example, in some cases it is the sum of individual radionuclide measurements and in other cases gross-β measurements are used.
Total-α represents the measured radioactivity of α-particle emitting radionuclides. These particles are emitted as a result of the decay of certain radionuclides, the so-called α emitters. Typically, the total liquid discharges of α-emitters from all nuclear sites represent mainly Pu 239, Pu-240 and Am-241 and, to a lesser extent, Th-230, Pu 238 and some other nuclides. Total-β represents the sum of the measured radioactivity of β-particle emitting radionuclides. These particles are emitted as a result of the decay of certain radionuclides, the so-called β-emitters. On average, the total liquid discharges of β-emitters from all nuclear sites represent mainly Ru-106, Sr-90, Pu-241, Cs-137, Tc-99 and, to a lesser extent, a range of other radionuclides. Total-β in this report excludes tritium, which is reported separately.
Tritium (H-3) is an isotope of hydrogen that emits low-energy radiation in the form of β-particles. Tritium is discharged from most nuclear power plants, reprocessing plants and some research and development facilities.
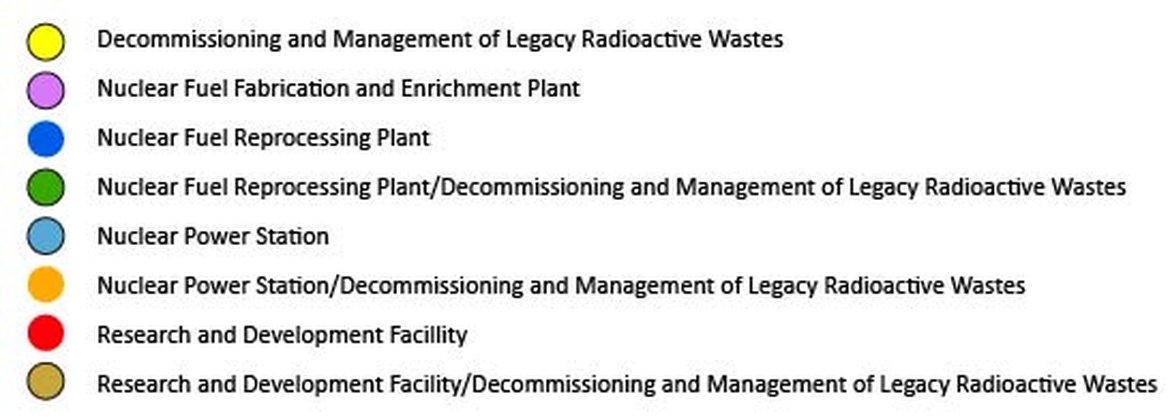
Location of Nuclear Facilities in OSPAR countries discharging directly or indirectly to the OSPAR maritime area in 2024. Available via https://odims.ospar.org/en/submissions/ospar_discharges_nuclear_2024_07/
| Belgium | Denmark | France | Germany | Norway | Portugal | Spain | Sweden | Switzerland | The Netherlands | United Kingdom | Grand Total | |
|---|---|---|---|---|---|---|---|---|---|---|---|---|
| Decommissioning and Management of Legacy Radioactive Wastes | 1 | 1 | 13 | 1 | 1 | 13 | 30 | |||||
| Nuclear Fuel Fabrication and Enrichment Plants | 1 | 1 | 1 | 2 | 5 | |||||||
| Nuclear Fuel Reprocessing Plants/Decommissioning and Management of Legacy Radioactive Wastes | 1 | 1 | 2 | |||||||||
| Nuclear Power Stations | 2 | 14 | 6 | 2 | 1 | 4 | 1 | 8 | 38 | |||
| Nuclear Power Stations/Decommissioning and Management of Legacy Radioactive Wastes | 1 | 1 | ||||||||||
| Research and Development Facilities | 1 | 1 | 4 | 2 | 1 | 1 | 2 | 12 | ||||
| Grand Total | 3 | 1 | 18 | 24 | 2 | 1 | 4 | 1 | 6 | 4 | 24 | 88 |
Assessment of the liquid radioactive discharges from nuclear installations in 2024
Introduction
Table 1, Table 2 and Table 3 summarise liquid radioactive discharges from nuclear installations for the period 1989 – 2024 (i.e., 36 years of discharge data); data are taken from the OSPAR Annual Reports on Liquid Discharges from Nuclear Installations (discharge data have been rounded to two significant figures in this assessment report. Data from 1995 have been submitted to Contracting Parties for verification and correction). These annual reports have been required from the Contracting Parties after the signature of the OSPAR Convention in 1992 in order to quantify the "land-based sources" of radioactive substances which may reach the OSPAR maritime area and to identify their trends. Reported discharges include data on operational discharges from nuclear power stations, nuclear fuel reprocessing plants, nuclear fuel fabrication and enrichment plants, and research and development facilities. Since 2005, discharges associated with the recovery of historical or legacy waste and decommissioning are reported separately for some sites. These have previously been known as ‘exceptional’ discharges. In 2014 the Contracting Parties agreed to apply the definitions for ‘operational’ and ‘exceptional’ discharges adopted at RSC 2013 and these definitions were included in the guidance to the revised reporting formats for discharges made since 2013. During OSPAR 2024 it was agreed that the term ‘exceptional’ discharges would be dropped and would now just be known as ‘decommissioning’ discharges. Such differentiation is becoming particularly important where the magnitude of discharges associated with the recovery of historical and legacy wastes and decommissioning is clearly evident. In recent years, the contribution of decommissioning discharges has increased to become one of the main contributors of discharges from nuclear installations.
Table 1 gives discharges of total alpha activity; Table 2 gives tritium discharges and Table 3 gives discharges of total beta activity (excluding tritium) in terabecquerels per year (TBq/y) for each sub-sector. The tables also give the percentage contributions from each sub-sector. Figure 1, Figure 2 and Figure 3 show the trends in annual discharges of total alpha, tritium and total beta (excluding tritium) for the period 1989 to 2024. Figure 1, Figure 2 and Figure 3 therefore shows the achievements of the OSPAR Convention since it has been signed in 1992.
Figure 4, Figure 5 and Figure 6 gives the same discharges data but for the period 1995 to 2024 only. Figure 4, Figure 5 and Figure 6 therefore shows the achievements of the OSPAR Strategy adopted in 1998.
Trends in total alpha discharges
Table 1 and Figure 1 show the total alpha activity discharged from 1989 to 2024. The total discharges of alpha activity from all nuclear installations in 2024 were around 0.1 TBq which is a small decrease of 0.02 TBq over the previous year. Discharges of total alpha in 2024 are only about 3.2% of the 1989 peak and the lowest year on record.
Discharges from the fuel reprocessing sub-sector contributed 42% and the decommissioning sub-sector contributed over fifty percent for the second consecutive year with 53% of the overall total alpha discharge in 2024.
The single largest contributor of alpha discharges in 2024 was decommissioning related discharges from Sellafield at 51% of the total. Correspondingly, operational alpha discharges from Sellafield reduced from 25% of the total in 2022 to 4% of the total in 2024, indicating an increasing focus to decommissioning at the Sellafield site. Operational alpha discharges from La Hague were 38% of the total in 2024.
Discharges from decommissioning activities is again, for the fourth year the largest contributor to total alpha discharges from nuclear installations. The longer term trend for decommissioning discharges is a steady increase as the number of facilities in decommissioning has grown, followed by a corresponding reduction in the number of operational facilities in other sub-sectors.
Discharges of alpha emitters from the fuel fabrication and enrichment sub-sector have seen a steady decrease from 0.0106 TBq in 2020 to 0.005 TBq in 2024, a 47% reduction over 4 years. Most of the discharges of total alpha from this sub-sector are from the Springfields fuel fabrication plant in the UK.
Discharges of alpha activity from nuclear power plants and research and development facilities in 2024 were a very small fraction of the total discharge (approx. 0.1 0/0).
Alpha discharges measured from the nuclear power sub-sector in 2024 were at the lowest recorded since 1989 with only 0.00002 TBq discharged.
NF = All Nuclear Facilities
RP = Reprocessing Plants
NPP = Nuclear Power Plants
NFFEP = Nuclear Fuel Fabrication and Enrichment Plants
RDF = Research and Development Facilities
Decom = Decommissioning
% = % of all installations
| Year | All | RP | % | NPP | % | NFFEP | % | RDF | % | Decom | % |
|---|---|---|---|---|---|---|---|---|---|---|---|
| 1989 | 3.10E+00 | 2.70E+00 | 86.00 | - | - | 4.10E-01 | 13.00 | 3.00E-02 | 0.96 | ||
| 1990 | 2.40E+00 | 2.20E+00 | 91.00 | - | - | 2.10E-01 | 9.00 | 2.00E-02 | 0.82 | ||
| 1991 | 2.40E+00 | 2.30E+00 | 93.00 | - | - | 1.50E-01 | 6.00 | 3.00E-02 | 1.23 | ||
| 1992 | 1.80E+00 | 1.70E+00 | 93.00 | - | - | 1.00E-01 | 5.00 | 3.00E-02 | 1.63 | ||
| 1993 | 2.90E+00 | 2.70E+00 | 94.00 | - | - | 8.00E-02 | 3.00 | 1.00E-01 | 3.47 | ||
| 1994 | 1.40E+00 | 1.10E+00 | 81.00 | - | - | 1.60E-01 | 12.00 | 1.00E-01 | 7.35 | ||
| 1995 | 6.95E-01 | 4.70E-01 | 67.65 | 1.07E-03 | 0.15 | 1.29E-01 | 18.57 | 9.47E-02 | 13.62 | ||
| 1996 | 5.33E-01 | 3.16E-01 | 59.31 | 1.29E-03 | 0.24 | 1.25E-01 | 23.41 | 9.08E-02 | 17.04 | ||
| 1997 | 3.79E-01 | 2.28E-01 | 60.02 | 4.14E-04 | 0.11 | 1.24E-01 | 32.60 | 2.76E-02 | 7.27 | ||
| 1998 | 4.35E-01 | 2.21E-01 | 50.81 | 5.28E-04 | 0.12 | 1.99E-01 | 45.82 | 1.41E-02 | 3.25 | ||
| 1999 | 4.18E-01 | 1.73E-01 | 41.24 | 3.01E-04 | 0.07 | 2.42E-01 | 57.94 | 3.11E-03 | 0.74 | ||
| 2000 | 3.35E-01 | 1.56E-01 | 46.50 | 6.55E-04 | 0.20 | 1.77E-01 | 52.71 | 2.00E-03 | 0.60 | ||
| 2001 | 4.13E-01 | 2.47E-01 | 59.80 | 2.85E-04 | 0.07 | 1.64E-01 | 39.68 | 1.84E-03 | 0.45 | ||
| 2002 | 6.15E-01 | 3.89E-01 | 63.23 | 3.32E-04 | 0.05 | 2.23E-01 | 36.31 | 2.53E-03 | 0.41 | ||
| 2003 | 6.17E-01 | 4.30E-01 | 69.64 | 1.11E-03 | 0.18 | 1.82E-01 | 29.46 | 4.45E-03 | 0.72 | ||
| 2004 | 4.87E-01 | 3.08E-01 | 63.38 | 3.76E-04 | 0.08 | 1.77E-01 | 36.30 | 1.18E-03 | 0.24 | ||
| 2005 | 5.22E-01 | 2.70E-01 | 51.67 | 1.35E-04 | 0.03 | 2.51E-01 | 48.05 | 1.42E-04 | 0.03 | 1.17E-03 | 0.23 |
| 2006 | 3.11E-01 | 2.30E-01 | 73.91 | 7.67E-05 | 0.02 | 8.03E-02 | 25.81 | 1.28E-04 | 0.04 | 6.63E-04 | 0.21 |
| 2007 | 1.69E-01 | 1.42E-01 | 84.02 | 5.49E-05 | 0.03 | 2.62E-02 | 15.52 | 1.35E-04 | 0.08 | 5.88E-04 | 0.35 |
| 2008 | 1.73E-01 | 1.47E-01 | 84.89 | 1.33E-04 | 0.08 | 2.22E-02 | 12.79 | 9.15E-05 | 0.05 | 3.81E-03 | 2.20 |
| 2009 | 1.91E-01 | 1.70E-01 | 89.07 | 6.68E-05 | 0.03 | 1.71E-02 | 8.97 | 6.41E-05 | 0.03 | 3.61E-03 | 1.89 |
| 2010 | 1.85E-01 | 1.60E-01 | 86.15 | 4.59E-05 | 0.02 | 2.10E-02 | 11.35 | 6.50E-05 | 0.04 | 4.51E-03 | 2.43 |
| 2011 | 1.68E-01 | 1.43E-01 | 84.90 | 4.84E-05 | 0.03 | 2.20E-02 | 13.09 | 7.99E-05 | 0.05 | 3.25E-03 | 1.93 |
| 2012 | 1.88E-01 | 1.62E-01 | 86.07 | 5.37E-05 | 0.03 | 2.37E-02 | 12.63 | 9.27E-05 | 0.05 | 2.30E-03 | 1.22 |
| 2013 | 1.98E-01 | 1.48E-01 | 74.64 | 4.22E-05 | 0.02 | 1.60E-02 | 8.10 | 5.86E-05 | 0.03 | 3.41E-02 | 17.21 |
| 2014 | 2.11E-01 | 1.81E-01 | 85.61 | 3.90E-05 | 0.02 | 1.44E-02 | 6.83 | 7.56E-05 | 0.04 | 1.58E-02 | 7.50 |
| 2015 | 2.33E-01 | 1.91E-01 | 82.17 | 4.16E-05 | 0.02 | 2.29E-02 | 9.85 | 1.38E-04 | 0.06 | 1.84E-02 | 7.91 |
| 2016 | 2.92E-01 | 2.47E-01 | 84.52 | 3.40E-05 | 0.01 | 1.50E-02 | 5.15 | 1.16E-04 | 0.04 | 3.00E-02 | 10.28 |
| 2017 | 2.22E-01 | 1.32E-01 | 59.37 | 3.11E-05 | 0.01 | 1.81E-02 | 8.19 | 8.37E-05 | 0.04 | 7.18E-02 | 32.39 |
| 2018 | 1.87E-01 | 9.52E-02 | 50.87 | 3.31E-05 | 0.02 | 7.83E-03 | 4.19 | 1.14E-04 | 0.06 | 8.40E-02 | 44.87 |
| 2019 | 1.90E-01 | 1.10E-01 | 57.63 | 2.51E-05 | 0.01 | 9.84E-03 | 5.18 | 1.29E-04 | 0.07 | 6.84E-02 | 36.03 |
| 2020 | 1.51E-01 | 7.31E-02 | 48.41 | 2.60E-05 | 0.02 | 1.06E-02 | 7.02 | 1.82E-04 | 0.12 | 6.63E-02 | 43.91 |
| 2021 | 1.60E-01 | 7.52E-02 | 46.97 | 2.84E-05 | 0.02 | 8.71E-03 | 5.44 | 8.82E-05 | 0.06 | 7.61E-02 | 47.53 |
| 2022 | 1.13E-01 | 5.19E-02 | 45.89 | 5.37E-05 | 0.05 | 6.15E-03 | 5.44 | 7.41E-05 | 0.07 | 5.49E-02 | 48.55 |
| 2023 | 1.23E-01 | 4.91E-02 | 39.98 | 2.19E-05 | 0.02 | 5.96E-03 | 4.85 | 8.37E-05 | 0.07 | 6.76E-02 | 55.08 |
| 2024 | 1.02E-01 | 4.28E-02 | 41.96 | 2.13E-05 | 0.02 | 5.03E-03 | 4.93 | 1.56E-04 | 0.15 | 5.40E-02 | 52.94 |
Hover mouse cursor over the figure to see values. Click legend elements to include/exclude from figure.
Trends in tritium discharges
Table 2 and Figure 2 show the discharges of tritium, a weak beta emitter with a low radiological impact. The total discharge of tritium from all nuclear facilities in 2024 was similar to 2023 at 11,900 TBq, a decrease of approximately 8% on the 2021 & 2022 results.
Discharges of tritium are still being dominated by those from the reprocessing sector with 82% of the total from all installations coming from La Hague), generally levels of tritium have fluctuated in accordance with spent fuel reprocessing rates and in 2024 tritium discharges were broadly similar to those in 2022 and 2023 from this sub-sector.
During 2024 the discharge of tritium by nuclear power stations contributed about 18% of the total tritium discharges from the nuclear sector. UK’s reactors (mainly Advanced Gas-cooled Reactors) contributed about 52% (1140 TBq) of the total tritium discharged from power stations. The Pressurised Water Reactors in France contributed about 37% (793 TBq) of the total from power stations in 2024.
Tritium discharges arising from decommissioning facilities have been recorded separately since 2006 and continue to be a relatively small and variable contribution depending upon decommissioning projects and campaigns. Discharges in 2024 were 9.7 TBq, which are the second lowest since 2012. This is around 0.08 % of the total across all sub-sectors.
Discharges from other sub-sectors were very small.
NF = All Nuclear Facilities
RP = Reprocessing Plants
NPP = Nuclear Power Plants
NFFEP = Nuclear Fuel Fabrication and Enrichment Plants
RDF = Research and Development Facilities
Decom = Decommissioning
% = % of all installations
| NF | RP | % | NPP | % | NFFEP | % | RDF | % | Decom | % | |
|---|---|---|---|---|---|---|---|---|---|---|---|
| 1989 | 8.00E+03 | 5.80E+03 | 7.20E+01 | 2.20E+03 | 2.70E+01 | - | - | 6.10E+01 | 7.60E-01 | ||
| 1990 | 7.20E+03 | 5.00E+03 | 6.90E+01 | 2.20E+03 | 3.00E+01 | - | - | 1.00E+02 | 1.40E+00 | ||
| 1991 | 8.80E+03 | 6.50E+03 | 7.40E+01 | 2.30E+03 | 2.60E+01 | - | - | 3.20E+01 | 3.70E-01 | ||
| 1992 | 7.70E+03 | 5.00E+03 | 6.50E+01 | 2.70E+03 | 3.50E+01 | - | - | 2.40E+01 | 3.10E-01 | ||
| 1993 | 1.10E+04 | 7.50E+03 | 6.80E+01 | 3.40E+03 | 3.10E+01 | - | - | 8.80E+01 | 8.10E-01 | ||
| 1994 | 1.30E+04 | 9.80E+03 | 7.60E+01 | 3.00E+03 | 2.40E+01 | - | - | 1.20E+02 | 9.10E-01 | ||
| 1995 | 1.51E+04 | 1.23E+04 | 8.17E+01 | 2.74E+03 | 1.82E+01 | 0.00E+00 | 0.00E+00 | 2.62E+01 | 1.74E-01 | ||
| 1996 | 1.68E+04 | 1.35E+04 | 8.02E+01 | 3.31E+03 | 1.96E+01 | 0.00E+00 | 0.00E+00 | 1.77E+01 | 1.05E-01 | ||
| 1997 | 1.81E+04 | 1.45E+04 | 8.03E+01 | 3.53E+03 | 1.96E+01 | 0.00E+00 | 0.00E+00 | 1.75E+01 | 9.70E-02 | ||
| 1998 | 1.62E+04 | 1.28E+04 | 7.91E+01 | 3.37E+03 | 2.08E+01 | 0.00E+00 | 0.00E+00 | 1.46E+01 | 9.02E-02 | ||
| 1999 | 1.89E+04 | 1.54E+04 | 8.18E+01 | 3.39E+03 | 1.80E+01 | 0.00E+00 | 0.00E+00 | 4.97E+01 | 2.63E-01 | ||
| 2000 | 1.61E+04 | 1.28E+04 | 7.93E+01 | 3.32E+03 | 2.06E+01 | 0.00E+00 | 0.00E+00 | 1.07E+01 | 6.63E-02 | ||
| 2001 | 1.60E+04 | 1.22E+04 | 7.62E+01 | 3.81E+03 | 2.38E+01 | 0.00E+00 | 0.00E+00 | 8.29E+00 | 5.17E-02 | ||
| 2002 | 1.89E+04 | 1.52E+04 | 8.04E+01 | 3.69E+03 | 1.95E+01 | 0.00E+00 | 0.00E+00 | 1.41E+01 | 7.45E-02 | ||
| 2003 | 1.97E+04 | 1.58E+04 | 8.02E+01 | 3.89E+03 | 1.97E+01 | 0.00E+00 | 0.00E+00 | 2.00E+01 | 1.02E-01 | ||
| 2004 | 2.07E+04 | 1.71E+04 | 8.25E+01 | 3.57E+03 | 1.72E+01 | 0.00E+00 | 0.00E+00 | 4.19E+01 | 2.03E-01 | ||
| 2005 | 1.85E+04 | 1.51E+04 | 8.14E+01 | 3.41E+03 | 1.84E+01 | 3.10E-02 | 1.68E-04 | 1.12E+01 | 6.07E-02 | 9.39E+00 | 5.07E-02 |
| 2006 | 1.56E+04 | 1.22E+04 | 7.81E+01 | 3.39E+03 | 2.17E+01 | 3.25E-06 | 2.08E-08 | 7.86E+00 | 5.03E-02 | 1.69E+01 | 1.08E-01 |
| 2007 | 1.56E+04 | 1.26E+04 | 8.10E+01 | 2.91E+03 | 1.87E+01 | 3.10E-02 | 1.99E-04 | 1.75E+01 | 1.12E-01 | 2.49E+01 | 1.60E-01 |
| 2008 | 1.12E+04 | 8.97E+03 | 8.04E+01 | 2.17E+03 | 1.94E+01 | 0.00E+00 | 0.00E+00 | 8.89E+00 | 7.97E-02 | 1.09E+01 | 9.73E-02 |
| 2009 | 1.36E+04 | 1.06E+04 | 7.84E+01 | 2.93E+03 | 2.16E+01 | 0.00E+00 | 0.00E+00 | 4.69E+00 | 3.45E-02 | 1.83E+00 | 1.35E-02 |
| 2010 | 1.42E+04 | 1.13E+04 | 7.99E+01 | 2.84E+03 | 2.00E+01 | 0.00E+00 | 0.00E+00 | 1.42E+01 | 1.00E-01 | 2.88E+00 | 2.03E-02 |
| 2011 | 1.40E+04 | 1.10E+04 | 7.84E+01 | 3.02E+03 | 2.15E+01 | 0.00E+00 | 0.00E+00 | 5.03E+00 | 3.59E-02 | 6.02E+00 | 4.30E-02 |
| 2012 | 1.58E+04 | 1.27E+04 | 7.99E+01 | 3.14E+03 | 1.99E+01 | 0.00E+00 | 0.00E+00 | 2.73E+00 | 1.73E-02 | 2.76E+01 | 1.75E-01 |
| 2013 | 1.82E+04 | 1.48E+04 | 8.12E+01 | 3.39E+03 | 1.87E+01 | 0.00E+00 | 0.00E+00 | 5.94E+00 | 3.27E-02 | 2.81E+01 | 1.55E-01 |
| 2014 | 1.71E+04 | 1.40E+04 | 8.21E+01 | 3.04E+03 | 1.78E+01 | 0.00E+00 | 0.00E+00 | 6.08E+00 | 3.55E-02 | 1.71E+01 | 1.00E-01 |
| 2015 | 1.81E+04 | 1.52E+04 | 8.41E+01 | 2.83E+03 | 1.56E+01 | 0.00E+00 | 0.00E+00 | 4.04E+00 | 2.23E-02 | 5.24E+01 | 2.90E-01 |
| 2016 | 1.77E+04 | 1.43E+04 | 8.10E+01 | 3.33E+03 | 1.88E+01 | 0.00E+00 | 0.00E+00 | 2.99E+00 | 1.69E-02 | 3.38E+01 | 1.91E-01 |
| 2017 | 1.64E+04 | 1.32E+04 | 8.04E+01 | 3.18E+03 | 1.94E+01 | 0.00E+00 | 0.00E+00 | 3.40E+00 | 2.07E-02 | 2.29E+01 | 1.40E-01 |
| 2018 | 1.59E+04 | 1.27E+04 | 7.98E+01 | 3.18E+03 | 2.00E+01 | 0.00E+00 | 0.00E+00 | 1.89E+00 | 1.19E-02 | 2.29E+01 | 1.44E-01 |
| 2019 | 1.60E+04 | 1.36E+04 | 8.51E+01 | 2.67E+03 | 1.67E+01 | 0.00E+00 | 0.00E+00 | 3.48E+00 | 2.18E-02 | 1.36E+01 | 8.47E-02 |
| 2020 | 1.40E+04 | 1.16E+04 | 8.29E+01 | 2.83E+03 | 2.02E+01 | 0.00E+00 | 0.00E+00 | 5.50E+00 | 3.93E-02 | 1.21E+01 | 8.64E-02 |
| 2021 | 1.30E+04 | 1.02E+04 | 7.85E+01 | 2.40E+03 | 1.85E+01 | 0.00E+00 | 0.00E+00 | 4.17E+00 | 3.21E-02 | 9.70E+00 | 7.46E-02 |
| 2022 | 1.28E+04 | 1.06E+04 | 8.30E+01 | 2.15E+03 | 1.68E+01 | 0.00E+00 | 0.00E+00 | 3.06E+00 | 2.39E-02 | 2.90E+01 | 2.27E-01 |
| 2023 | 1.15E+04 | 9.51E+03 | 8.24E+01 | 2.02E+03 | 1.75E+01 | 0.00E+00 | 0.00E+00 | 4.38E+00 | 3.80E-02 | 8.63E+00 | 7.48E-02 |
| 2024 | 1.19E+04 | 9.80E+03 | 8.23E+01 | 2.10E+03 | 1.76E+01 | 0.00E+00 | 0.00E+00 | 2.76E+00 | 2.32E-02 | 9.66E+00 | 8.11E-02 |
Hover mouse cursor over the figure to see values. Click legend elements to include/exclude from figure.
Trends in total beta discharges
Table 3 and Figure 3 show that the discharges of total beta activity (excluding tritium) from all nuclear installations have decreased markedly since 1989 (930 TBq) to 2024 (9.2 TBq). In 2024 total beta discharges decreased by around 4% from the previous year to about 9.6 TBq and represents the lowest recorded levels since 1989.
Historically, total beta discharges have been dominated by discharges from the reprocessing plants and the nuclear fuel fabrication plant at Springfields to a lesser extent. In 2024, the contribution of the reprocessing sub-sector increased slightly from 36% in 2023 to 44% of the total but this is still much lower than the peak contribution of this sub-sector (81% in 2007). This was due to higher reported total beta discharges from both Sellafield and La Hague in 2024.
The contribution of decommissioning discharges in 2024 was lower than 2023 which means this is the second highest contributing sub-sector in 2024 (40% of all installations). Discharges from decommissioning, and the management of historical or legacy waste, in 2024 was 3.8 TBq.
In 2024 power plants were the third largest contributor (16%) of total beta discharges after reprocessing and decommissioning. The discharge of 1.5TBq was the joint lowest recorded since 1989.
Discharges from the Nuclear Fuel Fabrication sub-sector remained as the smallest contributor to total beta discharges.
NF = All Nuclear Facilities
RP = Reprocessing Plants
NPP = Nuclear Power Plants
NFFEP = Nuclear Fuel Fabrication and Enrichment Plants
RDF = Research and Development Facilities
Decom = Decommissioning
% = % of all installations
| NF | RP | % | NPP | % | NFFEP | % | RDF | % | Decom | % | |
|---|---|---|---|---|---|---|---|---|---|---|---|
| 1989 | 9.30E+02 | 6.90E+02 | 74 | 7.60E+00 | 1 | 1.10E+02 | 12 | 1.20E+02 | 12.8 | NaN | NaN |
| 1990 | 4.90E+02 | 3.80E+02 | 78 | 1.00E+01 | 2 | 9.20E+01 | 19 | 4.50E+00 | 0.9 | NaN | NaN |
| 1991 | 2.30E+02 | 1.80E+02 | 78 | 3.80E+00 | 2 | 3.90E+01 | 17 | 6.30E+00 | 2.8 | NaN | NaN |
| 1992 | 2.70E+02 | 1.30E+02 | 50 | 8.90E+00 | 3 | 1.20E+02 | 45 | 6.60E+00 | 2.5 | NaN | NaN |
| 1993 | 2.50E+02 | 1.70E+02 | 67 | 1.10E+01 | 4 | 6.30E+01 | 25 | 8.20E+00 | 3.2 | NaN | NaN |
| 1994 | 3.20E+02 | 2.00E+02 | 61 | 2.80E+00 | 1 | 1.10E+02 | 36 | 9.10E+00 | 2.8 | NaN | NaN |
| 1995 | 3.69E+02 | 2.43E+02 | 66 | 7.25E+00 | 2 | 1.12E+02 | 30 | 7.20E+00 | 1.9 | NaN | NaN |
| 1996 | 3.35E+02 | 1.69E+02 | 51 | 8.70E+00 | 3 | 1.50E+02 | 45 | 6.52E+00 | 1.9 | NaN | NaN |
| 1997 | 3.17E+02 | 1.67E+02 | 53 | 9.11E+00 | 3 | 1.40E+02 | 44 | 1.05E+00 | 0.3 | NaN | NaN |
| 1998 | 2.69E+02 | 1.12E+02 | 42 | 6.29E+00 | 2 | 1.50E+02 | 56 | 6.81E-01 | 0.3 | NaN | NaN |
| 1999 | 2.60E+02 | 1.26E+02 | 48 | 6.02E+00 | 2 | 1.28E+02 | 49 | 4.17E-01 | 0.2 | NaN | NaN |
| 2000 | 1.74E+02 | 9.77E+01 | 56 | 4.59E+00 | 3 | 7.13E+01 | 41 | 5.00E-01 | 0.3 | NaN | NaN |
| 2001 | 2.33E+02 | 1.41E+02 | 61 | 6.40E+00 | 3 | 8.51E+01 | 36 | 4.61E-01 | 0.2 | NaN | NaN |
| 2002 | 2.37E+02 | 1.25E+02 | 53 | 5.61E+00 | 2 | 1.06E+02 | 45 | 4.52E-01 | 0.2 | NaN | NaN |
| 2003 | 2.01E+02 | 9.69E+01 | 48 | 6.88E+00 | 3 | 9.70E+01 | 48 | 5.35E-01 | 0.3 | NaN | NaN |
| 2004 | 1.63E+02 | 8.64E+01 | 53 | 4.26E+00 | 3 | 7.13E+01 | 44 | 5.99E-01 | 0.4 | NaN | NaN |
| 2005 | 1.63E+02 | 5.44E+01 | 33 | 4.31E+00 | 3 | 1.03E+02 | 63 | 8.77E-02 | 0.1 | 1.32E+00 | 1 |
| 2006 | 6.19E+01 | 3.66E+01 | 59 | 3.72E+00 | 6 | 2.07E+01 | 33 | 6.36E-02 | 0.1 | 8.96E-01 | 1 |
| 2007 | 3.66E+01 | 2.96E+01 | 81 | 3.22E+00 | 9 | 2.99E+00 | 8 | 1.34E-01 | 0.4 | 6.24E-01 | 2 |
| 2008 | 2.82E+01 | 2.09E+01 | 74 | 1.52E+00 | 5 | 4.58E+00 | 16 | 6.71E-02 | 0.2 | 1.18E+00 | 4 |
| 2009 | 2.80E+01 | 2.15E+01 | 77 | 2.09E+00 | 7 | 3.27E+00 | 12 | 2.06E-02 | 0.1 | 1.08E+00 | 4 |
| 2010 | 2.43E+01 | 1.53E+01 | 63 | 3.24E+00 | 13 | 4.45E+00 | 18 | 2.99E-02 | 0.1 | 1.23E+00 | 5 |
| 2011 | 2.77E+01 | 1.84E+01 | 67 | 3.32E+00 | 12 | 4.99E+00 | 18 | 2.15E-02 | 0.1 | 8.94E-01 | 3 |
| 2012 | 2.20E+01 | 1.25E+01 | 57 | 4.20E+00 | 19 | 4.54E+00 | 21 | 2.96E-02 | 0.1 | 7.43E-01 | 3 |
| 2013 | 2.18E+01 | 1.08E+01 | 49 | 4.64E+00 | 21 | 2.71E+00 | 12 | 2.13E-02 | 0.1 | 3.65E+00 | 17 |
| 2014 | 2.07E+01 | 1.09E+01 | 53 | 3.74E+00 | 18 | 2.94E+00 | 14 | 1.44E-02 | 0.1 | 3.10E+00 | 15 |
| 2015 | 1.97E+01 | 1.23E+01 | 62 | 3.38E+00 | 17 | 1.84E+00 | 9 | 1.07E-02 | 0.1 | 2.18E+00 | 11 |
| 2016 | 2.33E+01 | 1.09E+01 | 47 | 5.53E+00 | 24 | 1.71E+00 | 7 | 9.11E-03 | 0.0 | 5.17E+00 | 22 |
| 2017 | 2.27E+01 | 1.23E+01 | 54 | 5.52E+00 | 24 | 8.40E-01 | 4 | 1.16E-02 | 0.1 | 4.08E+00 | 18 |
| 2018 | 1.70E+01 | 7.37E+00 | 43 | 3.61E+00 | 21 | 2.80E-01 | 2 | 8.58E-03 | 0.1 | 5.75E+00 | 34 |
| 2019 | 1.40E+01 | 6.62E+00 | 47 | 3.15E+00 | 23 | 1.10E-01 | 1 | 1.15E-02 | 0.1 | 4.32E+00 | 31 |
| 2020 | 1.34E+01 | 6.95E+00 | 52 | 2.22E+00 | 17 | 2.51E-01 | 2 | 2.74E-02 | 0.2 | 3.94E+00 | 29 |
| 2021 | 1.40E+01 | 7.17E+00 | 51 | 1.77E+00 | 13 | 4.78E-02 | 0 | 2.72E-04 | 0.0 | 5.00E+00 | 36 |
| 2022 | 1.22E+01 | 6.48E+00 | 53 | 1.57E+00 | 13 | 1.33E-02 | 0 | 8.10E-03 | 0.1 | 4.15E+00 | 34 |
| 2023 | 1.01E+01 | 3.61E+00 | 36 | 1.65E+00 | 16 | 4.33E-03 | 0 | 2.49E-03 | 0.0 | 4.79E+00 | 48 |
| 2024 | 9.60E+00 | 4.25E+00 | 44 | 1.50E+00 | 16 | 1.02E-03 | 0 | 1.26E-02 | 0.1 | 3.83E+00 | 40 |
Hover mouse cursor over the figure to see values. Click legend elements to include/exclude from figure.
Figures 4 to 6 give the same discharges data but for the period 1995 to 2024 only. Figures 4 to 6 therefore show the achievements of the OSPAR Strategy adopted in 1998.
Hover mouse cursor over the figure to see values. Click legend elements to include/exclude from figure.
Hover mouse cursor over the figure to see values. Click legend elements to include/exclude from figure.
Hover mouse cursor over the figure to see values. Click legend elements to include/exclude from figure.
Acknowledgement
This report has been prepared by the Expert Assessment Panel of the OSPAR Radioactive Substances Committee (RSC), led by Mr Andrew Pynn (United Kingdom) with the support of the OSPAR Secretariat.
This section presents information on the location of the nuclear installations and data and information on liquid discharges for each OSPAR Contracting Party under the following categories of nuclear installations draining into the OSPAR Maritime Area:
| Table 1: Nuclear Power sub-sector |
| Table 2: Nuclear Fuel Reprocessing sub-sector |
| Table 3: Nuclear Fuel Fabrication and Enrichment sub-sector |
| Table 4: Nuclear Research and Development sub-sector |
| Table 5: Discharges associated with decommissioning activities that may include historical and legacy wastes. |
Further detailed information with respect to individual plants is presented in endnotes after the entire set of tables.
The columns, headings and abbreviations used in the tables correspond to the reporting requirements set out in the current reporting format (OSPAR Agreement No. 2013/10).
| AGR | Advanced Gas Cooled Reactor |
| GCR | Gas Cooled Reactor |
| UNGG | Natural Uranium Gas Graphite (French equivalent for GCR) |
| PWR | Pressurised Water Reactor |
| THTR | Thorium High Temperature Reactor |
| BWR | Boiliing Water Reactor |
| NA | Not Applicable |
| NI | No Information |
| ND | Not Detectable |
| Ag | Silver | Gd | Gadolinium | Rh | Rhodium |
| Am | Americium | I | Iodine | Ru | Ruthenium |
| Ba | Barium | Mn | Manganese | S | Sulphur |
| Be | Beryllium | Na | Sodium | Sb | Antimony |
| C | Carbon | Nb | Niobium | Se | Selenium |
| Ce | Cerium | Ni | Nickel | Sr | Strontium |
| Cm | Curium | Np | Neptunium | Tc | Technetium |
| Co | Cobalt | Pm | Promethium | Th | Thorium |
| Cr | Chromium | Pr | Praeseodynium | U | Uranium |
| Cs | Caesium | Pu | Plutonium | Y | Yttrium |
| Eu | Europium | Ra | Radium | Zn | Zinc |
| Fe | Iron | Rb | Rubidium | Zr | Zirconium |
All data have been entered in the tables using continental decimal system. The data values are expressed in scientific number format, e.g. 0.0009 as 9.0E-04.
All data can be viewed and downloaded via: https://odims.ospar.org/en/submissions/ospar_discharges_nuclear_2024_07/
| Country / Code | Name of installation | Type | Discharging into |
|---|---|---|---|
| Belgium | |||
| BE1 | Doel | NPS | Schelde |
| BE2 | Tihange | NPS | Meuse |
| BE3 | Mol | RDF | River Mol-Neet |
| Denmark | |||
| DK1 | Risø | DMLRW | Kattegat through Roskilde Fjord |
| France | |||
| FR1 | Belleville | NPS | Loire |
| FR3 | Cattenom | NPS | Mosel |
| FR4 | Chinon | NPS | Loire |
| FR5 | Chooz | NPS/ | FR5 |
| DMLRW | Meuse | DMLRW | Meuse |
| FR6 | Dampierre en-Burly | NPS | Loire |
| FR7 | Fessenheim | NPS | Rhine |
| FR8 | Flamanville | NPS | Channel |
| FR9 | Golfech | NPS | Garonne |
| FR10 | Gravelines | NPS | North Sea |
| FR11 | Nogent-sur-Seine | NPS | Seine |
| FR12 | Paluel | NPS | Channel |
| FR13 | Penly | NPS | Channel |
| FR14 | Saint Laurent | NPS | Loire |
| FR15 | La Hague | NFRP/ | FR15 |
| DMLRW | English Channel | DMLRW | English Channel |
| FR16 | Civaux | NPS | Vienne |
| FR17 | Fontenay-aux-Roses | DMLRW | Seine |
| FR18 | Le Blayais | NPS | Gironde Estuary |
| FR19 | Saclay | RDF | Etang de Saclay |
| Germany | |||
| DE1a | Biblis A | DMLRW | Rhine |
| DE1b | Biblis B | DMLRW | Rhine |
| DE2 | Brokdorf | NPS | Elbe |
| DE3 | Brunsbüttel | DMLRW | Elbe |
| DE4 | Grafenrheinfeld | NPS | Main |
| DE5 | Grohnde/Emmerthal | NPS | Weser |
| DE8a | Krümmel/Geesthacht | DMLRW | Elbe |
| DE8b | Geesthacht | RDF | Elbe |
| DE9a | Lingen/Emsland | NPS | Ems |
| DE9b | Lingen | DMLRW | Ems - via municipal sewer system |
| DE10 | Mülheim-Kärlich | DMLRW | Rhine |
| DE11a | Neckar-westheim 1 | DMLRW | Neckar |
| DE11b | Neckar-wesheim 2 | NPS | Neckar |
| DE12 | Obrigheim | DMLRW | Neckar |
| DE13a | Philippsburg KKP1 | DMLRW | Rhine |
| DE13b | Philippsburg KKP2 | NPS | Rhine |
| DE14 | Rheinsberg | DMLRW | Havel |
| DE15 | Stade | DMLRW | Elbe |
| DE16 | Rodenkirchen-Unterweser | DMLRW | Weser |
| DE17 | Würgassen/Beverungen | DMLRW | Weser |
| DE18 | Karlsruhe | RDF | Rhine |
| DE19 | Gronau | NFFEP | Vechte, IJsselmeer |
| DE24 | HMI Berlin | RDF | Havel |
| DE25 | Jülich | RDF | Rur |
| DE26 | Mainz | ||
| The Netherlands | |||
| NL1 | Borssele | NPS | Scheldt Estuary |
| NL3 | Almelo | NFFEP | Municipal sewer system |
| NL4 | Delft | RDF | Sewage system |
| NL5 | Petten | RDF | North Sea |
| Norway | |||
| NO1 | Halden | RDF | River Tista (Skagerrak) |
| NO2 | Kjeller | RDF | River Nitelva (Skagerrak) |
| Portugal | |||
| PT1 | Campus de Sacavém | RDF | Tagus River |
| Spain | |||
| ES1 | Almaraz | NPS | Tagus |
| ES2 | José Cabrera | DMLRW | Tagus |
| ES3 | Trillo | NPS | Tagus |
| ES4 | Juzbado | NFFEP | River Tormes - Duero |
| Sweden | |||
| SE2 | Ringhals 1-4 | NPS | Kattegat |
| Switzerland | |||
| CH1 | Beznau | NPS | Aare |
| CH2 | Gösgen | NPS | Aare |
| CH3 | Leibstadt | NPS | Rhine |
| CH4 | Mühleberg | NPS | Aare |
| CH5 | Paul Scherrer Institute | RDF | Aare |
| CH6 | ZWILAG Würenlingen | DMLRW | Aare |
| United Kingdom | |||
| UK1 | Berkeley | DMLRW | Severn Estuary |
| UK2 | Bradwell | DMLRW | North Sea |
| UK4 | Chapelcross | DMLRW | Solway Firth |
| UK5a | Dungeness A | DMLRW | English Channel |
| UK5b | Dungeness B | NPS | English Channel |
| UK6 | Hartlepool | NPS | North Sea |
| UK7a | Heysham 1 | NPS | Morecambe Bay |
| UK7b | Heysham 2 | NPS | Morecambe Bay |
| UK8a | Hinkley Point A | DMLRW | Severn Estuary |
| UK8b | Hinkley Point B | NPS | Severn Estuary |
| UK9a | Hunterston A | DMLRW | Firth of Clyde |
| UK9b | Hunterston B | NPS | Firth of Clyde |
| UK10 | Oldbury | DMLRW | Severn Estuary |
| UK11a | Sizewell A | DMLRW | North Sea |
| UK11b | Sizewell B | NPS | North Sea |
| UK12 | Torness | NPS | North Sea |
| UK13 | Trawsfynydd | DMLRW | Trawsfynydd lake |
| UK14 | Wylfa | DMLRW | Irish Sea |
| UK15 | Sellafield | NFRP and DMLRW | Irish Sea |
| UK16 | Capenhurst | NFFEP | Irish Sea via Rivacre Brook and Mersey Estuary |
| UK17 | Springfields | NFFEP | Irish Sea via River Ribble |
| UK18 | Dounreay | DMLRW | Pentland Firth |
| UK19 | Harwell | DMLRW | River Thames |
| UK20 | Winfrith | DMLRW | Weymouth Bay (English Channel) |
NPS: Nuclear Power Stations
NFRP: Nuclear Fuel Reprocessing Plants
RDF: Research and Development Facilities
NFFEP: Nuclear Fuel Fabrication and Enrichment Plants
DMLRW: Decommissioning and Management of Legacy Radioactive Wastes
EC, 2003. Update of the MARINA Project on the radiological exposure of the European Community from radioactivity in North European marine waters. European Commission 2003.
OSPAR, 2006. Revised First Periodic Evaluation of Progress towards the Objective of the OSPAR Radioactive Substances Strategy (JAMP product RA-1). Publication 302/2006. ISBN 1-905859-40-6. http://www.ospar.org/documents?v=7053
OSPAR, 2009. Towards the Radioactive Substances Strategy objectives - Third Periodic Evaluation. Publication 455/2009.ISBN 978-1-906840-95-2. http://www.ospar.org/documents?v=7135
OSPAR, 2016. Towards the Radioactive Substances Strategy objectives - Fourth Periodic Evaluation. Publication 687/2016.ISBN 978-1-911458-17-3
http://www.ospar.org/documents?v=35337