


Feeder Report 2026 - Production and Consumption of Plastics
Executive Summary
Global plastics production has shown a consistent year-on-year increase, reaching 400,4 million tonnes in 2022 — up from 370,5 million tonnes in 2018 — reflecting sustained worldwide demand. Production in the European Union (EU) 27 Member States plus Norway, Switzerland, and the United Kingdom (EU27+3) stood at approximately 58,8 million tonnes in 2022, with Germany, Belgium, the Netherlands, France, and Spain accounting for the largest shares. Packaging remains the dominant end-use, comprising approximately 39% of all plastics demand, followed by building and construction (22,9%) and automotive uses (8,3%). Almost 80% of plastics are derived from fossil-fuel feedstocks; bio-based plastics represent a small but growing market at approximately 1% of global production. The European plastics industry is a significant economic sector, generating approximately €365 billion in turnover and employing over 1,5 million people across more than 51700 companies in 2023.
Of the 32,3 million tonnes of post-consumer plastic waste collected across the EU27+3 in 2022, 23,5% was sent to landfill (a decrease from 2018), 49,6% to energy recovery (an increase), and 26,9% to recycling (an increase). Packaging constitutes the largest single waste stream, at 57,3% of total post-consumer plastic waste. Exports of plastic waste outside the EU27+3 have been reduced by 58% between 2016 and 2022, reflecting tightening international trade restrictions. OSPAR countries with landfill bans recorded very low rates of plastics disposal to landfill (0–2%), while Spain (39%), Portugal (36%), and France (28%) had the highest landfill proportions.
Plastic pollution causes severe harm to marine wildlife through entanglement and ingestion, with negative economic consequences for coastal tourism and fisheries estimated at up to €630 million annually across the EU. Plastics account for more than 70% of items recorded in OSPAR beach surveys, and are the most common material recovered in seafloor trawl surveys. Microplastics — both primary (such as pre-production pellets and microbeads) and secondary (from fragmentation of larger items including tyres, textiles, and fishing gear) — represent an increasing concern due to their ubiquity, longevity, and risks to ecosystem and human health, including evidence of accumulation in human blood, lungs, placentas, and brain tissues. Pre-production pellets (nurdles) remain among the largest contributors to marine microplastic pollution, with significant maritime spill incidents documented in recent years including the Toconao (2023) and Solong/Stena Immaculate collision (2025) in the North Sea. Nanoplastics are emerging as a further area of concern, given their capacity to cross biological barriers and transport adsorbed pollutants within organisms.
OSPAR's second Regional Action Plan for Marine Litter (RAP ML 2, 2022–2030, Agreement 2022-05) provides the primary framework for addressing both land-based and sea-based plastic pollution sources across the region. At the June 2025 Ministerial meeting, OSPAR adopted Decision 2025-02 preventing the release of expanded polystyrene and other foamed plastics from pontoons and buoys, and Recommendation 2025-02 on best environmental practice. A significant body of EU legislation is also in place and evolving: the Packaging and Packaging Waste Regulation (PPWR, 2025) introduces design-for-recycling requirements and minimum recycled-content standards; the REACH restriction on intentionally added microplastics (2023) represents the world's first broad regulatory restriction in this area; the Pellet Regulation (adopted December 2025) introduces mandatory risk management plans, handling and auditing requirements across the supply chain; and the revised Urban Wastewater Treatment Directive (2024) mandates fourth-stage treatment to remove micropollutants including microplastics. Early outcomes from the Single-Use Plastics Directive show encouraging declines in SUP-related litter, and average lightweight carrier bag consumption fell 14% between 2021 and 2022. At the international level, OSPAR Contracting Parties are engaged in UN negotiations toward a legally binding global plastics treaty. Industry-led initiatives, including Operation Clean Sweep and Fishing for Litter, complement regulatory measures, though independent evaluations caution that voluntary action alone remains insufficient and that collective ambition still falls short of what is needed to meet 2025 and 2030 goals.
The most effective outcomes are observed where regulatory bans and restrictions, mandatory reporting, industry certification, and targeted national measures are integrated. Continued investment in robust indicators, independent auditing, enhanced transport safety, and strengthened enforcement will be essential if significant and measurable reductions in plastic pollution in the OSPAR Maritime Area are to be achieved.
Introduction
1.1 This report deals with the production, use and disposal of plastics in the OSPAR Maritime Area1 . It describes general measures relating to litter prevention and management, including specific measures relating to marine litter. Separate feeder reports are available on shipping, aquaculture, fisheries, agriculture and waste water, which cover initiatives to address plastic litter from those sources.
1.2 Distribution of plastic litter in the OSPAR Maritime Area is not covered in this feeder report and is addressed in a separate part of the Intermediate Assessment 2029 (IA 2029).
Production and Economy
2.1 This section gives information on the production of plastics, their uses, and the global growth in plastics.
2.2 Plastics have been in use for over 100 years, but since the 1950s there has been a rapid growth in their production and consumption. This is due to the properties of plastics, such as a high strength to weight ratio, impermeability to liquids, resistance to physical and chemical degradation, and their versatility suiting a wide variety of applications. Societal and environmental uses include: protecting and preserving food; use in vehicles, where their lighter weight lowers fuel consumption; medical uses; and water savings through their use in infrastructure. At the same time, plastic production and consumption, littering and mismanaged waste lead to environmental and socioeconomic impacts such as harm to wildlife and habitats, human health implications, greenhouse gas emissions, loss of resources (e.g. by the accidental or operational loss of plastic pellets) and leakage and pollution, including from microplastics (and the degradation of plastics into microplastics and smaller nanoplastics).Plastics in the ocean impact ecosystem health, including harm to wildlife especially through entanglement or ingestion with severe implications for animal welfare, and economic impacts on sectors such as coastal tourism and fisheries (Schulz and Werner, 2022). The longevity of plastics in the environment, and uncertainty about the magnitude of their impact, including that of substances of concern that are present within the plastics, and the significant amounts that have been introduced into the environment relatively recently, mean that they merit particular attention (Villarrubia-Gómez et al., 2024).
2.3 Annual analyses from the trade association PlasticsEurope summarise plastics production, industrial demand, and the trade balance between the European Union (EU) 27 Member States plus Norway. Switzerland and the United Kingdom (EU 27+3) and the rest of the world. Unless otherwise stated, data throughout this report is taken from Plastics Europe, 2019-2024. It is noted that, whilst this data covers the majority of OSPAR Contracting Parties, it does not include data from Iceland. Therefore, data from outside these sources have been included and referenced where possible, however such comprehensive (or directly comparable) analysis is not as readily available.
The Scale of Production and Consumption
2.4 Plastics production in 2022 across the EU27+3 was approximately 58,8 million tonnes. This is slightly more than in 2020 (57,7 million tonnes), but lower than in 2021 (60,8 million tonnes), and 2018 (62,3 million tonnes). Global plastics production, meanwhile, reached 400,4 million tonnes in 2022, with a consistent year-on-year increase from 370,5 million tonnes in 2018, indicating that worldwide demand continues to increase. Europe’s share of global plastics production has fallen from 28% in 2002 to 14% in 2022, with North America and China accounting for 17% and 32% respectively. Europe’s producers are under significant competitiveness pressures for a number of reasons, including high energy prices, a more stringent regulatory framework and limited access to raw materials.
2.5 Germany was responsible for the highest proportion of European plastics production in 2022, with 13 million tonnes, which equates to 22,1% of the total plastics production from the EU27+3. Of other OSPAR countries, the largest proportions were from Belgium (12,4%), the Netherlands (10,5%), France (9,4%), Spain (9,0%), and the United Kingdom (4,4%)
2.6 In 2021, data shows that demand for plastics from converters (manufacturers of plastic products) in the EU27+3 was 50,3 million tonnes, representing an increase from 48,9 million tonnes in 2020, and slightly lower than in 2018 (51,5 million tonnes) and 2019 (50,9 million tonnes). Similarly to the distribution of plastic production across the EU 27+3 countries, Germany accounted for nearly one quarter of total demand in 2021 (23,2%). Of other OSPAR countries covered within the Plastics Europe datasets, the largest proportions of total demand were from France (9,4%), Spain (7,5%), the United Kingdom (6,9%), Belgium (4,5%) and the Netherlands (4,2%).
Dominant Plastic Types and Their Primary Uses
2.7 Packaging materials remained the most dominant end-use market for plastics in 2022, comprising approximately 39% of all uses. This was followed by building and construction (22,9%), “other” (15,6%), automotive uses (8,3%), electrical and electronics (5,7%), agriculture, farming, and gardening (4,4%), and homeware, leisure and sports (4,1%). These proportions are similar to those observed in previous years.
2.8 Regarding the types of polymers produced for new plastics, the largest proportions in 2023 (as visualised in Figure 1) were:
- polypropylene (15,7%): uses include food wrapping, hinged caps (i.e. bottlecaps), microwave containers, pipes, and automotive parts;
- low density polyethylene and linear low-density polyethylene (13,1%): uses include “reusable” bags2 , trays and containers, agricultural film, and food packaging;
- polyvinyl-chloride (8,4%): uses include window frames, floor and wall covering; piles and insulation;
- high and medium density polyethylene (8,3%): uses include toys, milk bottles, shampoo bottles, and pipes;
- polyurethane (5,5%): uses include insulation, pillows and mattresses;
- polystyrene/expanded polystyrene (5,2%): uses include food packaging, building insulation and electronics.
- polyethylene terephthalate (4,7%): uses includes textiles, bottles for water and soft drinks.
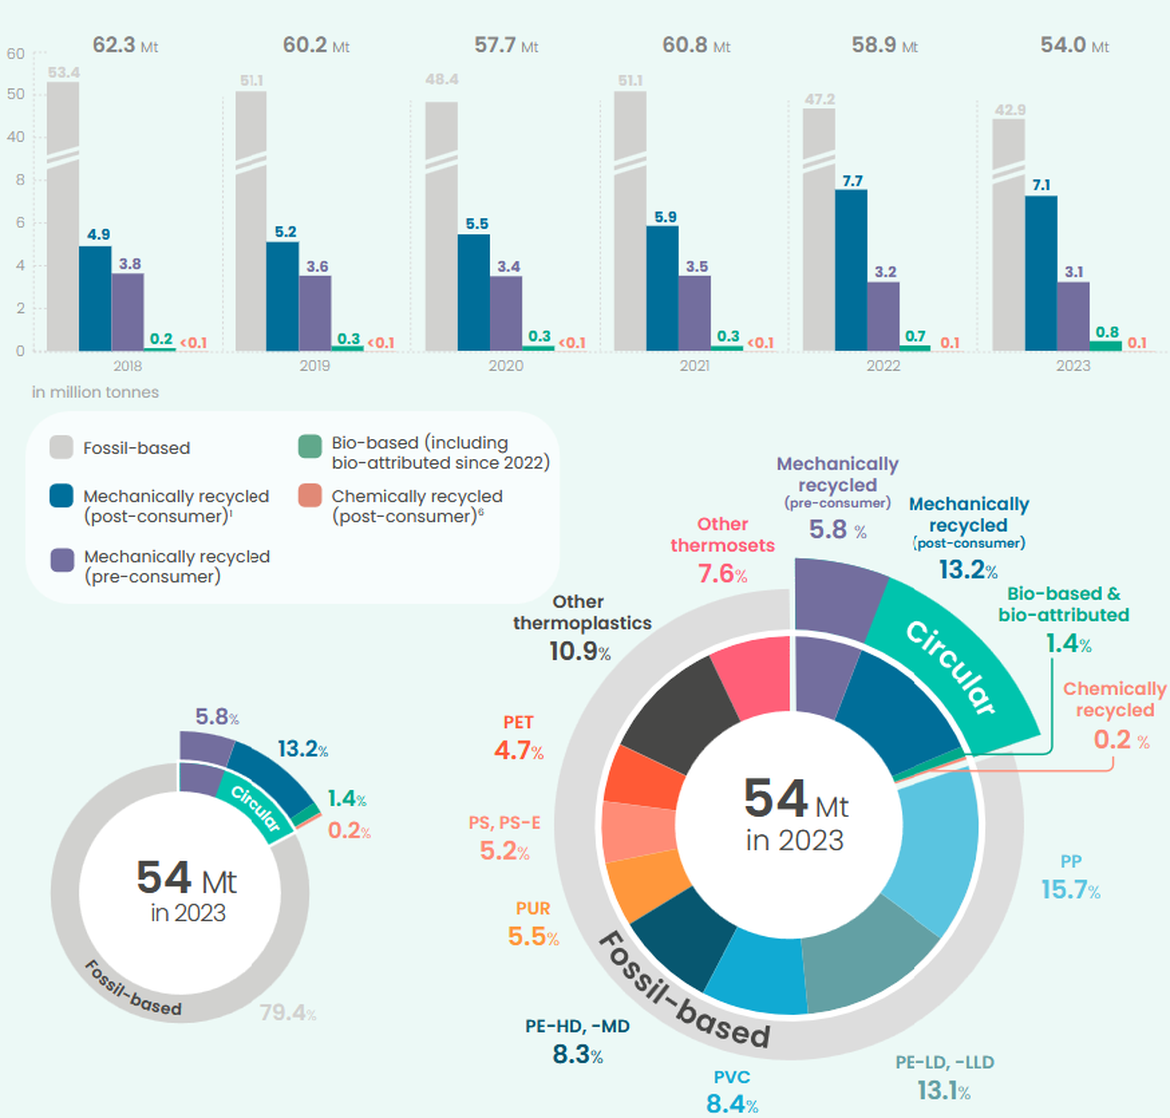
Figure 1: Proportions of the types of polymers produced for new plastics within the EU27+3. Taken from Plastics Europe (2024b)
2.9 The vast majority of plastics (almost 80%) are derived from fossil-fuel feedstocks. However, there is growing interest in plastics produced from renewable raw materials, such as biomass or organic waste. According to European Bioplastics, global production capacity for bio-based plastics was 2,18 million tonnes in 2023, representing just over 1% of total global plastics production. While this share is small, the market is growing as brands and consumers seek alternatives (European Bioplastics, 2024). Whether bio-based plastics offer a more sustainable alternative depends on a full life cycle assessment, including factors like land use, water consumption, and end-of-life options. Such an assessment should include the environmental and monetary costs of plastics leaked or released into the environment, with regards to both conventional and bio-based plastics.
2.10 Many bio-based plastics substitute for conventional plastics and have similar properties. However, bio-based plastics cannot fully replace fossil plastics on their own. Their wider use is limited by competition for biomass from other sectors, constraints on land availability, and potential negative effects on biodiversity, making environmental assessments highly complex and uncertain.
2.11 It should also be noted that bio-based plastics are not the same as biodegradable plastics, which (in certain conditions) can be broken down to water, naturally occurring gases (primarily carbon dioxide) and biomass (European Commission, 2018a). However, evidence suggests that biodegradable plastics can also degrade into microplastics rather than fully mineralising (Napper and Thompson, 2019). In addition, biodegradable plastics may also be fossil-based, such as Poly(butylene adipate-co-terephthalate) (PBAT).
2.12 Recycling also poses difficulties, particularly for biodegradable plastics, which risk disrupting established recycling systems. As highlighted in the Swedish Environmental Protection Agency -funded report Bioråvara till plast ((Brännström et al., 2022), bio-based plastics should therefore be seen as one part of a broader transition strategy that also requires reducing overall plastic use in accordance with the waste hierarchy, improving recycling technologies, and ensuring sustainable resource management.
The Plastics Economy: Employment, Turnover, and Trade
2.13 While production and converter demand provide a picture of internal plastics flows in the EU27+3, these do not fully capture the role of international trade in raw polymers and finished plastic products. PlasticsEurope estimates show that Europe has traditionally maintained a positive trade balance in plastics, exporting significant volumes of both raw resins and converted products. However, this balance has been narrowing in recent years, reflecting growing competitive pressures, higher energy costs, and increased imports of finished goods from Asia.
2.14 Whilst the monetary trade value of plastics has remained positive, since 2022, the EU27+3 has seen a shift to becoming a net importer of plastics and plastic products. However, this margin remains narrow, with the EU27+3 exporting 13,1 million tonnes of plastic for production in 2024, compared to the import of 13,3 million tonnes.
2.15 The European plastics industry remains a significant economic sector. In 2023, it generated a turnover of approximately €365 billion and employed over 1,5 million people across more than 51 700 companies, primarily comprising plastics converters, recyclers, and machinery manufacturers.
2.16 Of all of the OSPAR countries for which there is data, Germany remains the largest hub for employment and value added in plastics manufacturing. The 2020 figures for the number of enterprises, persons employed, and total value added for the manufacture of plastic products are given in Table 1 (data from Eurostat, 2025a)
| Manufacture of plastics in primary form | Manufacture of plastic products | |||||
|---|---|---|---|---|---|---|
| Number of enterprises | Persons employed | Value added at factor cost (million Euro) | Number of enterprises | Persons employed | Value added at factor cost (million Euro) | |
| Belgium | 88 | 7 262 | 1 452 | 685 | 24 054 | 2 393,2 |
| Denmark | 17 | 289 | 30,4 | 434 | 11 966 | 1 138,2 |
| Germany | 428 | 42 921 | 4 993 | 6 514 | 365 123 | 23 814,2 |
| Ireland | n/a | n/a | n/a | 401 | 8 385 | 626,3 |
| Spain | 314 | 11 487 | 1 363,4 | 3 514 | 77 505 | 4 688,2 |
| France | 143 | 1 190 | 1 132,5 | 2 667 | 116 160 | 8 132 |
| Luxembourg | 2 | n/a | n/a | 18 | 2 676 | 237,7 |
| Netherlands | 147 | 10 194 | 1 966,2 | 1 326 | 30 402 | 2 871,9 |
| Portugal | 46 | 1 767 | 199,8 | 967 | 23 790 | 1 042,4 |
| Finland | 19 | 1 714 | 242,5 | 468 | n/a | n/a |
| Sweden | 30 | 4 339 | 786,8 | 962 | 18 254 | 1 404,4 |
| Iceland | 0 | 0 | 0 | 29 | 299 | 17,8 |
| Norway | 9 | 682 | 113,1 | 269 | 4 036 | 349,1 |
| Switzerland | n/a | n/a | n/a | 496 | 21 106 | 2 605 |
| United Kingdom | n/a | n/a | n/a | n/a | n/a | n/a |
Within Table 1, “n/a” refers to data that was not available.
Generation and Management of Plastic Waste
3.1 This section focuses on the generation and treatment of plastic waste within the EU27+3, as well as for OSPAR countries where available.
Waste Management Pathways: Recycling, Energy Recovery, and Landfill
3.2 An estimated total of 32,3 million tonnes of post-consumer plastic waste were collected across the EU27+3 in 2022. This represents a continued increase from the 29,5 million tonnes collected in 2020, 29 million tonnes in 2018, and 27,1 million tonnes in 2016. Of this waste:
- 7,6 million tonnes (23,5%) were sent to landfill. This represents a decrease from the 8,1 million tonnes (27,8%) in 2018.
- 16 million tonnes (49,6%) were sent for energy recovery (i.e. incineration). This represents an increase from the 13,9 million tonnes (47,8%) in 2018
- 8,7 million tonnes (26,9%) were sent for recycling. This represents an increase from the 7,1 million tonnes (24,4%) in 2018.
3.3 Of the plastics that were recycled, 41,2% were used in building and construction; 30,8% in packaging; and, 13,2% in “agriculture, farming, and gardening”. Data is not available on the percentage of recycled plastics used in the fisheries/maritime industries specifically, but it is anticipated to fall within the “other” category, which comprises 8,8% of plastics sent for recycling from the EU27+3.
3.4 However, the above figures do not reflect the fate of all plastic waste. An unknown share is released or leaked into the environment, either voluntarily or involuntarily.
3.5 Belgium had the highest rate of recycled post-consumer plastics (39%), followed by Spain (38%), the Netherlands (38%), Germany (37%), Sweden (34%), Denmark (34%), and Norway (30%). Notably OSPAR countries with landfill bans on plastic waste (Belgium, the Netherlands, Germany, Denmark, Norway, Switzerland, Luxembourg, and Finland) recorded 0-2% of plastics being sent to landfill3 , with the exception of Luxembourg, which sent 8% of plastic waste to landfill. Conversely, the highest proportions of plastic waste being sent to landfill across OSPAR countries were in Spain (39%), Portugal (36%), and France (28%).
A Spotlight on Plastic Packaging Waste
3.6 Due to its typically short lifespan, high consumption volumes, and the prevalence of portable 'on-the-go' formats that are more susceptible to improper disposal, packaging remains the largest single source of plastic waste. In 2022 57,3% of post-consumer plastic waste in the EU27+3 came from packaging. This accounted for 18,5 million tonnes of waste, which is an increase from the 17,8 million tonnes in 2018. Of this waste
- 3,2 million tonnes (17,3%) was sent to landfill. This is a decrease from the 3,9 million tonnes in 2018.
- 8,3 million tonnes (44,9%) was sent for energy recovery. This is the same volume as in 2018, but a slight increase from the 8 million tonnes in 2020.
- 7 million tonnes (37,8%) was sent for recycling. This is an increase from the 5,7 million tonnes in 2018.
3.7 Of OSPAR countries included within the PlasticsEurope reporting (i.e. the EU27+3), Belgium had the highest proportion of recycled plastic packaging waste (56%), with France having the lowest proportion (23%). These proportions are shown in Figure 2.
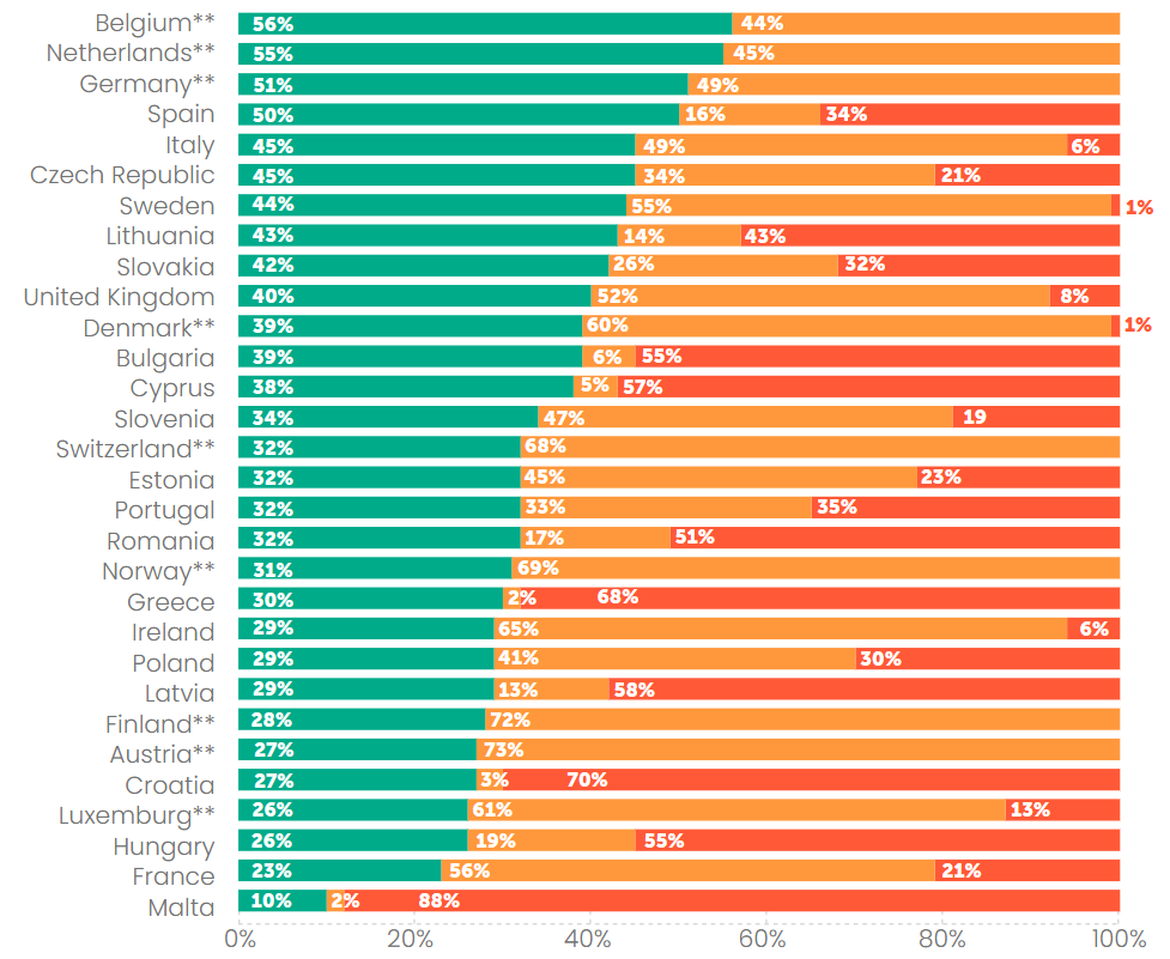
Figure 2: Post-consumer plastics waste management in the EU27+3 by country in 2022. Taken from PlasticsEurope (2024).
**countries with landfill bans
3.8 Eurostat has information on packaging waste generated in the majority of OSPAR countries, including per capita waste generation and the proportion of packaging waste recycled or recovered (Eurostat, 2025b; Eurostat, 2025c). Details from 2019 to 20234 are in the figures below.
Figure 3: Plastic packaging recycling rates in OSPAR countries, 2018 to 2023. *refers to the share of recycled plastic packaging waste in all generated plastic packaging waste. No data available for CH or UK.
Figure 4: Per capita generation of plastic packaging waste in OSPAR countries, 2019 to 2023. No data available for CH or UK.
The European Plastic Waste Trade and Export Dynamics
3.9 The EU has historically exported a significant portion of its plastic waste for recycling to other countries. However, import restrictions in destination countries (such as China), trade restrictions for plastics waste outside the Organisation for Economic Co-operation and Development (OECD), and the need for recycled plastics in Europe have altered these flows. Importantly, this landscape is continuing to change: under the new Waste Shipments Regulation (EU) 2024/1157, the EU will impose a temporary ban on exports of plastic waste to non-OECD countries from 21 November 2026. Even shipments of clean, non-hazardous plastic waste (B3011) will require prior notification and consent from May 2026, with stricter auditing and traceability obligations phased in by May 2027. Non-OECD countries that wish to resume imports after the moratorium will need to apply to the European Commission and demonstrate that they can manage waste in an environmentally sound manner. These measures mark a decisive shift away from permissive export practices towards stricter control, intended to ensure that exported plastics are treated responsibly and to incentivise greater recycling capacity within Europe.
3.10 Exports of plastic waste outside of the EU27+3 have been reduced by 58% between 2016 and 2022. 1,1 million tonnes of plastic waste was exported in 2022, which is the same volume as was exported in 2021, but a marked decrease from the 2,6 million tonnes exported in 2016. The main destination for these exports in 2022 were Turkey (0,35 million tonnes), Malaysia (0,14 million tonnes), and Indonesia (0,13 million tonnes).
Environmental Pressures and Impacts
4.1 Plastic waste enters the sea through varied and diffuse routes. Major land-based sources include storm water discharges, sewer overflows, releases from industrial and wastewater treatment plants, littering, wastes released from dumpsites near the coast or riverbanks, illegal dumping, industrial activities, improper transport, poor waste management, consumer cosmetic products, paint, synthetic infill in artificial turf pitches, synthetic sandblasting media, and polyester and acrylic fibres from textiles and tire wear. Major sea-based sources are commercial and recreational fishing (including abandoned, lost or otherwise discarded fishing gear), shipping, and aquaculture. Additionally, plastics contained in offshore chemicals, paints and coatings used in offshore installations; on vessels; and in recreational boating also contribute to the problem.
4.2 According to a 2021 UNEP report, at least 14 million tonnes of plastic end up in the ocean every year (UNEP 2021). Other recent research estimated that approximately 1,1 – 4,9 million tonnes of plastic particles were afloat in the world's oceans as of 2019 (Eriksen et al., 2023). This pollution causes severe harm to wildlife through entanglement and ingestion and has negative economic impacts on sectors like tourism and fisheries.
4.3 Macro-litter, particularly larger plastic items such as packaging, fishing gear, and consumer products, remains a significant pressure on marine ecosystems alongside microplastics. According to the OSPAR Quality Status Report (QSR) 2023 Marine Litter Thematic Assessment, plastics account for the vast majority of marine litter items recorded in the OSPAR Maritime Area, with beach surveys showing that plastics routinely represent more than 70% of total items, and seafloor monitoring confirming plastics as the most common material encountered in trawl surveys. The impacts of macro-litter on marine life are wide-ranging. Wildlife can become entangled in ropes, nets, and straps, leading to injury, impaired movement, or death; while ingestion of larger plastics by seabirds, turtles, and marine mammals can cause internal injuries, blockages, and reduced feeding success. The OSPAR report on harm to biota from marine litter synthesises this evidence, concluding that both entanglement and ingestion are prevalent and have measurable negative effects on populations of fulmars, seals, cetaceans, and turtles across the North-East Atlantic (OSPAR, 2021).
4.4 Macro-litter also imposes significant socio-economic pressures. Coastal municipalities face high costs for beach cleaning, while fisheries lose revenue from gear damage, reduced catches, or contaminated landings. A 2014 EU assessment estimated that marine litter costs the European Union up to €630 million annually, with the tourism and fisheries sectors particularly affected (Newman et al., 2015).
4.5 The marine litter indicator assessments published in the OSPAR Quality Status Report 2023 found that plastics are the most common litter type recovered by trawls across the Greater North Sea and Celtic Seas, while fulmar monitoring shows that over 50% of birds examined exceed the OSPAR threshold for plastic ingestion. Plastic items represent 94% of the litter collected in beach litter surveys, with a median of 194 items/100 m of beach (OSPAR, 2023). Taken together, these indicators demonstrate that plastic macro-litter continues to exert pervasive and measurable impacts on ecosystems, species, and human activities across the North-East Atlantic.
The Pervasive Threat of Microplastics
4.6 Microplastics, plastic and rubber particles less than 5 mm in size (as defined in OSPAR, 2017), are an area of increasing concern due to their ubiquity, longevity and risks to ecosystem and human health. An OSPAR assessment published in 2017 (OSPAR, 2017) categorised microplastics into the following categories:
- Primary Microplastics: These are plastics intentionally manufactured to be small. Key sources entering include pre-production pellets lost during transport, conversion and manufacturing ('nurdles'), rubber granules from artificial turf, and microbeads from cosmetics (now largely banned under EU law).
- Secondary Microplastics: These are created from the fragmentation and breakdown of larger plastic and rubber items. Synthetic fibres shed from clothing during washing and use are a significant source, along with the wearing down of tyres (and roadwear), degradation of littered items like bags, bottles, and fishing nets, and the general use of items such as paint and tyres (and roadwear) that is broken down.
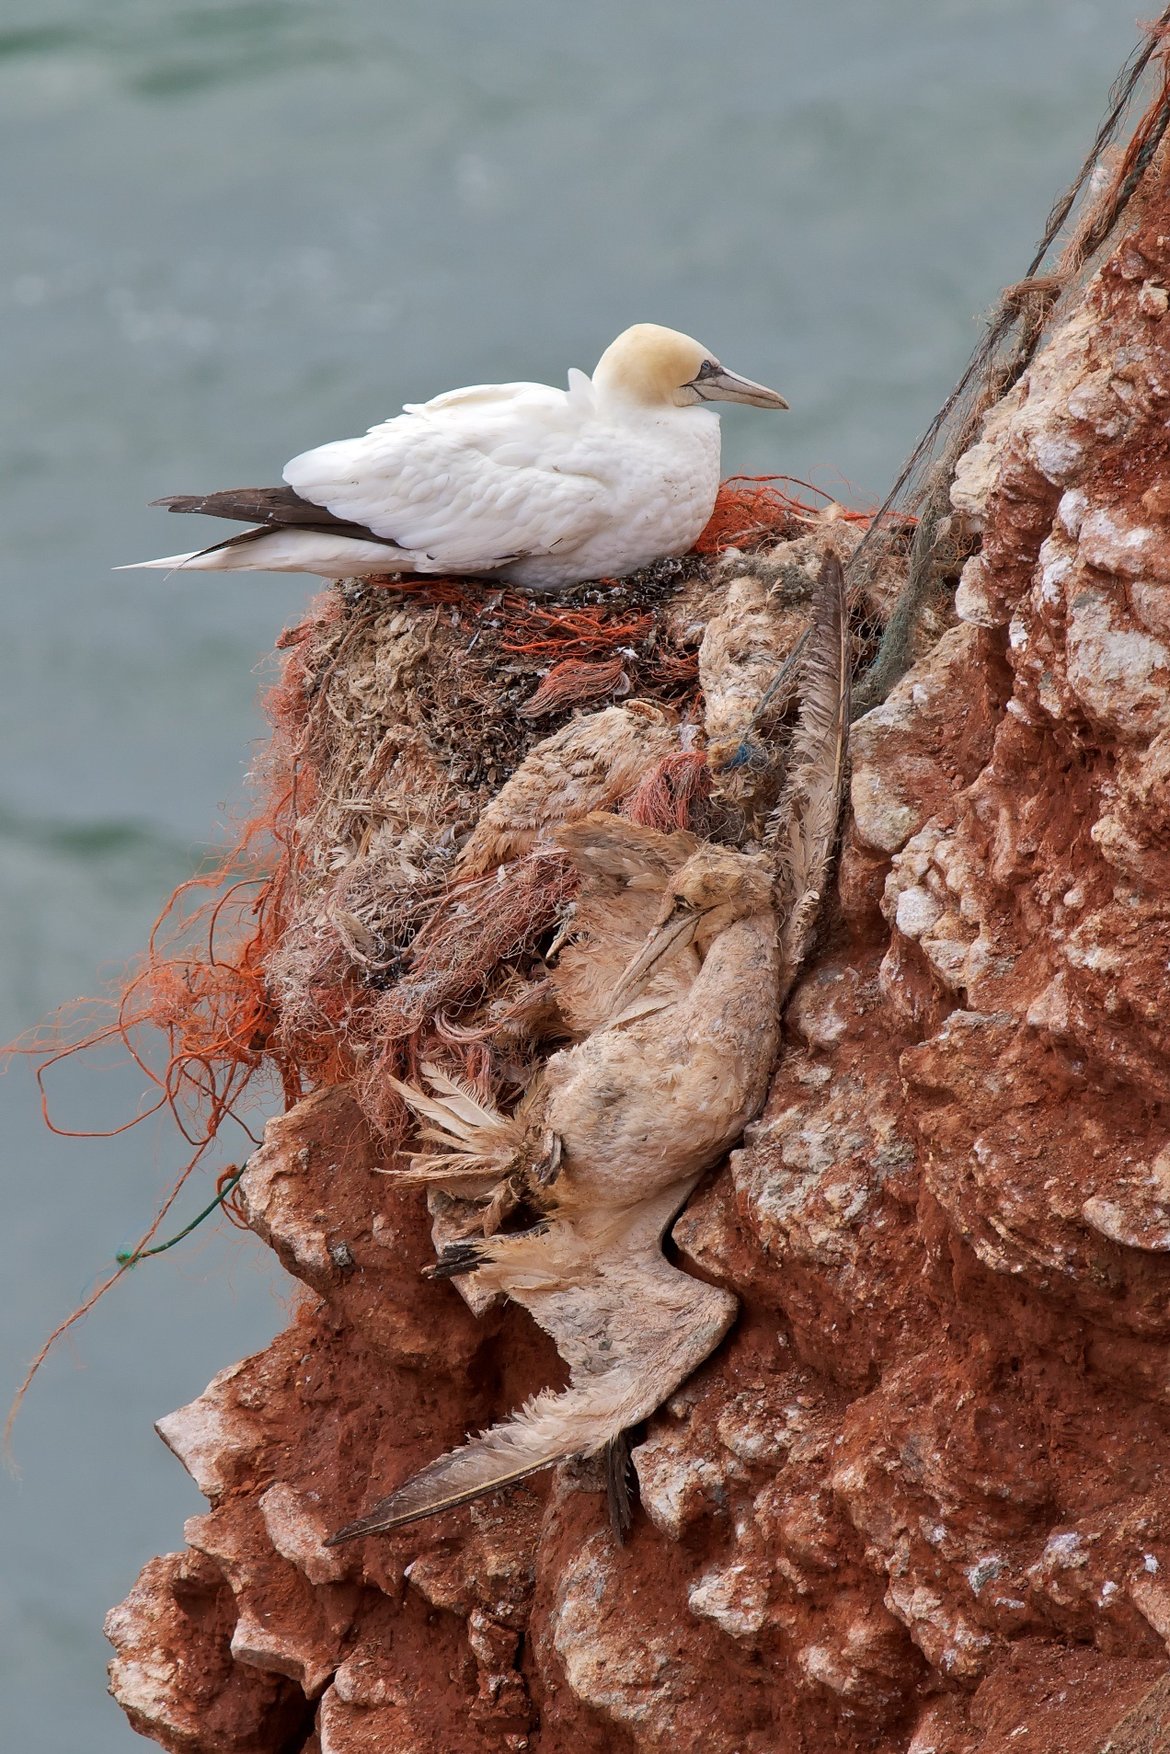
The impacts of macro-litter on marine life are wide-ranging. Wildlife can become entangled in ropes, nets, and straps, leading to injury, impaired movement, or death (©Peter Quint)
4.7 The OSPAR assessment (OSPAR, 2017) discussed methodologies for assessing the amount of microplastics entering OSPAR catchments. Figure 5 is taken from that assessment.
Figure 5: Sources of microplastics entering OSPAR catchments. Unit: Tonnes/year (Source OSPAR 2017)
4.8 As of the mid-2020s, plastics pellets (nurdles) remain one of the largest contributors to microplastic pollution in marine environments. According to a press release from the European Council of the EU, it is estimated that between 52 000 and 184 000 tonnes of pellets were lost into the environment across the EU in 2019 (Council of the EU, 2025).
4.9 Recent years have seen multiple large maritime pellet spills:
- In late 2023, the Toconao lost containers off the coast of Galicia, Spain, resulting in the loss of 25 000 kg of plastic pellets (Cocozza et al., 2025).
- The Trans Carrier incident of February 2020 released over 10 tonnes of nurdles into the North Sea, affecting coasts from Norway to Sweden (Norwegian Coastal Authority, 2020).
- In May 2021, the X-Press Pearl container ship disaster spilled over 11 000 tonnes of pellets, 18km off the west coast of Sri Lanka. (Cedre, 2025).
- In March 2025, the Solong and the Stena Immaculate collided in the North Sea, which resulted in over 10 000 kg of plastic pellets being washed up along the United Kingdom coastline (Nurdlehunt, 2025).
4.10 More research is being undertaken on the human effects of microplastics intake. Microplastics have already been found in human blood, lungs, placentas and brain tissues. Microplastics are a major emerging pollutant of concern as the chemical compounds within them can pose a risk to human health, as can the presence of the plastic particles themselves. Research on health impacts of microplastics is ongoing.
4.11 In addition to microplastics, nanoplastics (typically defined as plastic particles <1 µm) are emerging as a critical focus of research. Studies have shown that nanoplastics may aggregate more readily than microplastics, affecting their transport, sedimentation, and bioavailability in aquatic systems (Pradel et al., 2023). In toxicological assays, nanoplastics and microplastics have induced oxidative stress, inflammation, cytotoxicity, and immune disruption in cell and animal models, with potential for endocrine and developmental effects (Feng et al., 2023). Because of their smaller size and capacity to cross biological barriers, nanoplastics raise heightened concerns for internal tissue exposure and chemical transport (e.g. adsorbed pollutants) within organisms (Lai et al., 2022).
Impacts of the COVID-19 Pandemic on Plastic Litter
4.12 The COVID-19 pandemic created a new and sudden challenge, leading to a surge in the use of single-use personal protective equipment (PPE). Items such as face masks and gloves were improperly disposed of in vast numbers and quickly became a common sight in beach litter surveys, adding a new and potentially medically contaminated stream to plastic pollution (e.g., Patrício Silva et al., 2020).
The Response: Measures to Combat Plastic Pollution
OSPAR action
5.1 The first OSPAR Regional Action Plan on Marine Litter (RAP ML, Agreement 2014-01) implemented between 2014 and 2021, was a robust effort focusing on reducing marine litter through national and regional measures across the North–East Atlantic. Building on the work of the first RAP ML, OSPAR RAP ML 2 was adopted in June 2022 and has an implementation period between 2022 and 2030. The RAP ML 2 contains 25 common actions to address both land-based and sea-based sources. An interim review of progress (OSPAR, 2025) reported that two actions were complete, 14 were on track, six were slightly delayed, one was not on track, and two still in the holding pen (summarised in Table 2). Since adoption, RAP ML 2 has delivered 17 products, including four key OSPAR measures:
- Recommendation 2024/03 - amending Rec. 2019/01 on the reduction of marine litter through the Implementation of Sustainability Education Programmes for Fishers;
- Agreement 2019-08 (2024 update) - OSPAR Guidelines on the reduction of marine litter through Sustainability Training Programmes for fishers;
- Recommendation 2024/04 on the management of expanded polystyrene (EPS) and extruded polystyrene (XPS) fish boxes in ports, to prevent release of EPS/XPS into the marine environment; and,
- Agreement 2024-10 Best Practice for the reduction and life cycle management of expanded polystyrene (EPS) and extruded polystyrene (XPS), as a means to reduce EPS and XPS becoming marine litter
Table 2: Overview of status of RAP ML 2 actions and status (taken from OSPAR, 2025)
Key: Green = action on track; Amber = action progressing with some delay but with no major issues or problems expected in supporting the delivery of the NEAES 2030 operational objectives; Red = task is not on track and requires the attention of HOD; Blue = action complete; Grey = action in the holding pen
| Operational Objective | NEAES Task Number | RAP ML 2 action number | Action title |
|---|---|---|---|
| S4.O1 | S4.O1.T3 | A.2.1 | Prevent the release of bio-carriers to the marine and riverine environment |
| S4.O1.T4 | A.2.2 | Reduce macro litter losses in wastewater treatment systems | |
| S4.O1.T5 | A.5.1 | Prevent inputs of microplastics from selected land-based sources in the marine environment | |
| S4.O1.T6 | A.5.2 | Reduce microplastic contamination from artificial grass | |
| S4.O1.T7 | B.1.1 | Harmonise practises related to the provision and use of Port Reception Facilities | |
| S4.O1.T8 | B.2.1 | Manage end-of-life recreational vessels | |
| S4.O1.T9 | C.1.1 | Prevent microplastic pollution resulting from plastic pellet, powder and flake loss | |
| S4.O1.T10 | C.2.1 | Understand the location of litter accumulations | |
| S4.O2 | S4.O2.T1 | C.3.1 | Improve evidence base on harm in relation to marine litter |
| S4.O2.T2 | C.4.1 | Bridge the gap between monitoring and policy | |
S4.O3 | S4.O3.T1 | A.4.2 | Reduce the impact of expanded polystyrene and extruded polystyrene (EPS / XPS) in the marine environment – development of OSPAR products: |
S4.O3.T2 | A.1.1 | Prevent and reduce plastic waste by coastal municipalities and cities | |
S4.O3.T3 | A.4.1 | Define measures and strategies for the phasing out or restriction of use of single use plastics prone to become marine litter in complement to the EU SUP Directive | |
| S4.O4 | n/a | n/a | There are no actions under the RAP ML 2 relating to this operational objective |
S4.O5 | S4.O5.T1 | B.5.1 | Plastic materials in the marine environment |
S4.O6 | S4.O6.T1 | B.5.2 | Plastic substances contained in offshore chemicals |
S4.O7 | S4.O7.T1 | A.3.1 | Monitor, prevent and reduce riverine inputs of macro litter to the marine environment and share knowledge on micro litter monitoring |
S4.O8 | S4.O8.T1 | B.4.1 | Prevent, locate, retrieve and handle ALDFG |
S4.O8.T2 | B.4.3 | Promote practical solutions for reducing the impact of certain specific fishing related items, such as net cuttings and dolly rope | |
S4.O8.T3 | B.4.4 | Address recreational fishing as a source for marine litter | |
S4.O8.T4 | B.4.5 | Raise awareness and improve education in the fishing sector, including the strengthening of the OSPAR recommendations on Fishing for litter and on Sustainability Education Programmes for Fishers | |
S4.O8.T5 | B.4.7 | Prevent and reduce marine litter from aquaculture | |
S4.O8.T6 | B.4.2 | Stimulate circular design and developments in waste management of fishing and aquaculture gear | |
S5.O5 | S5.O5.T1 | B.4.6 | To identify and understand the main sources of entanglement of sea turtles in the Eastern Atlantic and to develop adequate management measures |
Holding pen | B.1.2 | Reduce microplastics from ship greywater discharges | |
Holding pen
| B.3.1 | Identify the need for measures to reduce the unintentional release of microplastics resulting from paint, anti-fouling paint and other marine coatings used by [commercial] marine vessels |
5.2 The RAP ML 2 serves as the main instrument to deliver the OSPAR North-East Atlantic Environment Strategy (OSPAR NEAES) Strategic Objective 4 and the related eight Operational Objectives on marine litter. These include reducing single-use plastics, controlling and, where possible, phasing out plastics from materials placed at sea for marine infrastructure developments, and curbing microplastics from relevant land-based and offshore sources and riverine inflows. It also emphasises tackling marine litter stemming from fishing and aquaculture activities and increasing coordination on monitoring and knowledge-sharing. The interim review noted good progress but also highlighted the need to better integrate monitoring and policy actions to fully understand the impacts of RAP ML 2 measures (OSPAR, 2025).
5.3 At the June 2025 Ministerial meeting, OSPAR strengthened its efforts by:
- Adopting OSPAR Decision 2025/02 to prevent the release of expanded polystyrene (EPS), extruded polystyrene (XPS), and other foamed plastic from pontoons and buoys, a legally-binding measure to prevent and eliminate plastic pollution from entering the OSPAR Maritime Area;
- Adopting OSPAR Recommendation 2025/02 on the application of best practice for reducing marine litter in the OSPAR Maritime Area;
- Approving new best environmental practice guidance tools, including best practices for reducing plastic biomedia loss from wastewater plants, and advancing knowledge on sources like dolly ropes;
- Launching a Progress Report on the implementation of RAP ML 2 to identify where OSPAR can add the most value moving forward.
5.4 OSPAR Decision 2025/02 to prevent the release of expanded polystyrene (EPS), extruded polystyrene (XPS), and other foamed plastic from pontoons and buoys builds on earlier outputs in 2024, including OSPAR Recommendation 2024/04 on the management of expanded polystyrene (EPS) and extruded polystyrene (XPS) fish boxes in ports, to prevent release of EPS/XPS into the marine environment and; Best Practice for the reduction and life cycle management of expanded polystyrene (EPS) and extruded polystyrene (XPS), as a means to reduce EPS and XPS becoming marine litter.
European Union Strategy and Legislation
5.5 The European Strategy for Plastics in a Circular Economy (European Commission, 2018a; European Commission, 2018b) remains the umbrella under which most legislative action has unfolded, but since 2020 a number of new regulations have been introduced.
5.6 The new Packaging and Packaging Waste Regulation (PPWR) was agreed on 19 December 2024 as Regulation (EU) 2025/40, with the regulation entering force on 11 February 2025, and applying from 12 August 2026. This regulation replaces the old directive and hard-wiring design-for-recycling, reuse targets in defined sectors, and minimum recycled-content requirements for plastic packaging. The PPWR also frames measures to curb unnecessary packaging and sets clearer, harmonised recyclability criteria, which had been a persistent bottleneck under the directive model.
5.7 Alongside packaging reform, the EU has enacted the world’s first broad restriction on intentionally added microplastics under REACH (Regulation (EC) No. 1907/2006 ‘Registration, Evaluation, Authorization and Restriction of Chemicals'). Commission Regulation (EU) 2023/2055, adopted in September 2023, restricts placing on the market of microplastics as such and in mixtures across a wide sweep of applications, with transitional periods tailored to sectors such as synthetic infill in artificial turf, cosmetics, detergents, fertilisers and medical devices.
5.8 The Single-Use Plastics (SUP) Directive has now largely bedded in. Bans on the use of products covered by the directive has been applied since 2021, while tethered-cap requirements for beverage containers and separate collection targets for bottles are being staged in. Early outcome signals are encouraging: the European Environment Agency’s (EEA) beach-litter indicator shows a steady decline in the share of SUP-related items in coastal litter since 2016, with an acceleration after 2020 in countries that implemented robustly (European Environment Agency, 2025); although causality is complex, the trend aligns with SUP measures and national carrier-bag policies (Wilts et al., 2019).
5.9 Carrier-bag policy performance (e.g. under EU Directive 2015/720) is now visible in EU statistics. Eurostat’s latest series reports average consumption of lightweight plastic carrier bags at 66,6 per person in 2022, down 14% versus 2021 and well below pre-directive baselines. Several Member States have already surpassed the directive’s indicative milestones (90 bags per person by 2019 and 40 by 2025), though heterogeneity remains. Where bag charges were applied broadly and early, reductions often exceeded 80%, an effect size corroborated in the peer-reviewed literature (Eurostat, 2024; Muposhi et al., 2022).
5.10 The 2020 Circular Economy Action Plan (European Commission, 2020a; 2020b) has been operationalised through dossiers beyond packaging. The Ecodesign for Sustainable Products Regulation (ESPR) and associated workplans are extending product-policy levers to durability, reparability and material efficiency, while the Commission’s 2022 policy framework on bio-based, biodegradable and compostable plastics clarifies when such materials can deliver genuine environmental benefits. The framework stresses fit-for-purpose use, appropriate collection and treatment infrastructure, and avoidance of misleading claims (European Commission 2024, Tumu et al., 2023).
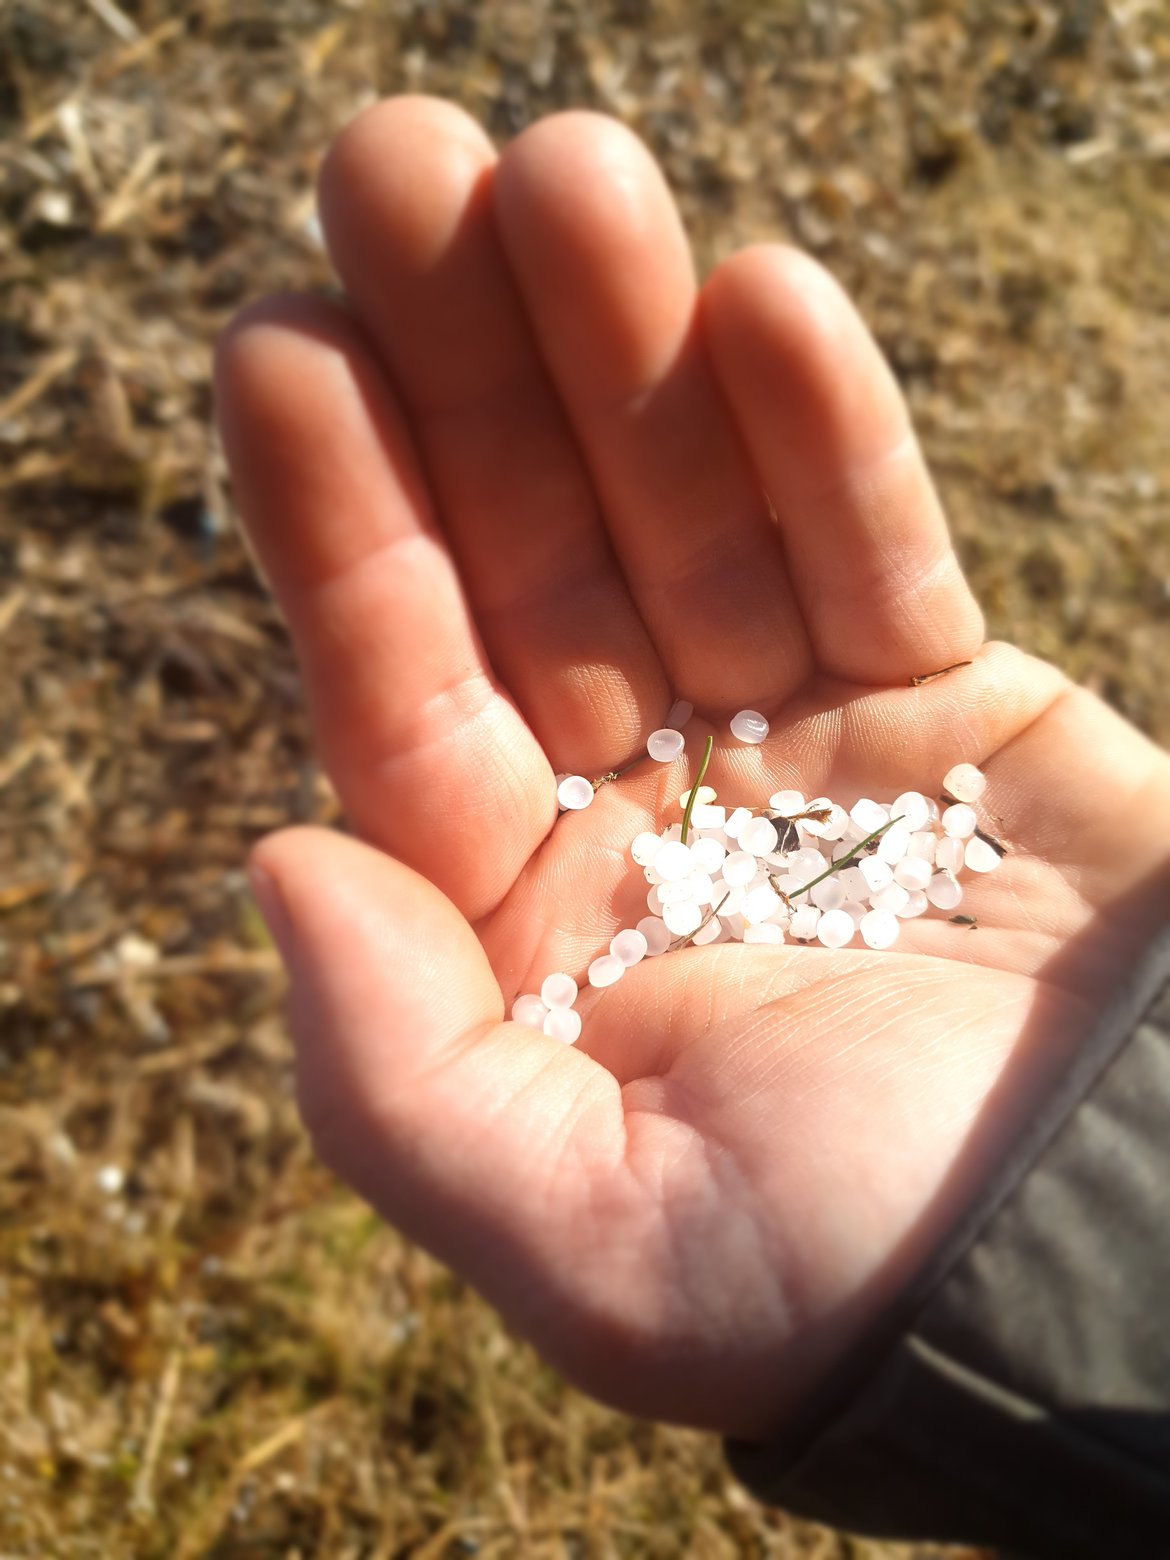
In April 2025, the Council and European Parliament reached provisional agreement on a Regulation to prevent plastic pellet losses across the supply chain (©Tomas Eriksson)
5.11 In April 2025, the Council and European Parliament reached provisional agreement on a Regulation to prevent plastic pellet losses across the supply chain (European Council, 2025). This was adopted and entered into force on the 16 December 2025 as Regulation (EU) 2025/2365. This regulation obliges operators to implement risk management plans, include clean-up obligations for accidental losses, and impose packaging, training, handling, recording, and auditing requirements. Operators handling ≥1 500 tonnes annually must seek certification from independent third parties; smaller firms may use self-declarations. Maritime transport of pellets is included, addressing packaging, transport protocols, and traceability.
5.12 The Euro 7 Regulation mandates that the Commission adopt implementing acts for vehicle type-approval concerning tyre wear and may adopt a delegated act to set uniform tyre abrasion limits (covering passenger cars, vans, trucks, and buses). The Tyre Labelling Regulation also provides for future inclusion of abrasion information, once robust measurement methods are validated. These measurement methodologies are being developed under the UN World Forum on Harmonisation of Vehicle Regulations. Thus, tyre wear particles may be regulated in future via a combination of Euro 7, delegated acts under labelling rules, and global harmonisation via the UN task force.
5.13 The EU Zero Pollution Action Plan, launched in May 2021 under the European Green Deal, sets the ambition for 2050 to reduce pollution in air, water, and soil to levels no longer harmful to health or ecosystems (European Commission, 2021). For plastics, the Plan includes targets to halve plastic litter at sea and cut microplastic releases by 30% by 2030. It functions as a cross-cutting framework, embedding pollution prevention into EU policies, identifying gaps, and promoting coherence between climate, circular economy, chemicals, and industrial policies. The second Zero Pollution Monitoring and Outlook report was published in March 2025, offering updated trend analysis.
5.14 Directive (EU) 2019/883 on port reception facilities for the delivery of waste from ships, which replaced the earlier Directive 2000/59/EC, requires EU Member States to ensure that adequate port reception facilities are available and obliges ships calling at EU ports to deliver all waste ashore before departure. The Directive strengthens incentives for onshore waste delivery through a revised fee structure, integrates passive fishing for litter into port waste management plans, and tightens monitoring and enforcement through electronic reporting via SafeSeaNet and THETIS.
5.15 The revised Urban Wastewater Treatment Directive (Directive (EU) 2024/3019), which entered into force on 1 January 2025, introduces substantially strengthened treatment standards, including a mandatory fourth treatment stage at larger plants to remove micropollutants, including microplastics, not captured by conventional processes. The revised Directive also expands coverage to smaller agglomerations, introduces extended producer responsibility for quaternary treatment costs, and promotes energy neutrality and resource recovery from wastewater and sludge. It represents a significant tightening of the regulatory framework for land-based inputs to the aquatic environment.
UN Actions
5.16 OSPAR Contracting Parties engage actively in the ongoing UN negotiations toward a legally binding global plastics treaty. This treaty is being developed under the UN Environment Assembly (UNEA) process, aiming to span the full plastics lifecycle and beyond: including production, design, waste, leakages and releases and existing plastics pollution.
5.17 Parallel to this, the UN has hosted initiatives such as the Global Partnership on Marine Litter (GPML) and G20/G7 marine litter action plans, which encourage peer sharing of best practices and alignment of national policies.
IMO Actions
5.18 The IMO Action Plan to Address Marine Plastic Litter from Ships (adopted via MEPC.310(73)) seeks to eliminate plastic litter discharges from ships by 2025 and strengthen regulatory coherence under MARPOL Annex V, the London Convention/London Protocol, and broader ocean governance frameworks (IMO, 2019). The Action Plan includes over 30 priority actions ranging from gear marking (to identify ownership ), reporting of gear loss, enacting port reception improvements, to capacity building and gap analyses. As of 2024, IMO reported 12 actions completed, 13 underway, and 5 not yet initiated (IMO, 2024).
5.19 Additionally, the GloLitter Partnerships Project (IMO–FAO) supports capacity building, training, toolkits, and regional coordination to reduce ship-sourced marine litter.
National and Industry-led Actions
5.20 Many OSPAR countriesremain engaged with the New Plastics Economy Global Commitment. This initiative is led by the Ellen MacArthur Foundation (in collaboration with UNEP) which asks businesses, governments, and other organisations to align behind a common set of targets to eliminate plastic litter and pollution. According to the Global Commitment’s 2024 progress report, over one thousand organisations and more than fifty governments had become signatories or supporters. While the report describes notable corporate-level improvements, such as reductions in packaging weight and increases in recycled content, it also emphasizes that collective ambition still falls short of the scale modelled as necessary to meet 2025 and 2030 goals. In essence, the Global Commitment has succeeded in catalysing private-sector action and transparency, yet overall systemic transformation is not yet on track (Ellen MacArthur Foundation, 2024).
5.21 Operation Clean Sweep© (OCS), a voluntary awareness and best-practice programme that incorporates the Zero Pellet Loss initiative from PlasticsEurope, has grown significantly in Europe. OCS and related schemes list well over a thousand signatories across the value chain, and a certification scheme with third-party verification is now operational to confirm site-level implementation. Major European industry players have pledged to bring member companies and sites into compliance by the mid-2020s (OCS Europe, 2025). This certification marks a significant step beyond mere voluntary promotion by introducing an auditable layer, which can be referenced by regulators and purchasers. However, independent evaluations caution that coverage remains incomplete; container and shipping incidents, as well as diffuse handling losses, still occur. Without enhancements in transport safety, stronger enforcement, and harmonised reporting, certification alone will not eliminate all risks (OSPAR Commission, 2025; PlasticsEurope, 2023).
5.22 Another long-standing industry-government partnership is Fishing for Litter (FFL), which operates in several OSPAR countries. FFL enables fishers to bring ashore litter that is accidentally caught in nets during normal fishing operations, providing bags, port collection points, and disposal services free of charge. By 2024, programmes were active in countries such as the United Kingdom, the Netherlands, Germany, and Ireland, collectively removing thousands of tonnes of litter from the marine environment since their inception. The initiative not only reduces marine litter but also raises awareness within the fishing industry and coastal communities. OSPAR has supported the scheme through OSPAR Recommendation 2019/01 on the reduction of marine litter through the Implementation of Sustainability Training Programmes for Fishers and its subsequent amendments, encouraging wider uptake and harmonisation across the region. While participation remains voluntary, evidence suggests FFL is a cost-effective supplement to regulatory measures, demonstrating how sector-led stewardship can make a tangible contribution to cleaner seas (OSPAR, 2023a)
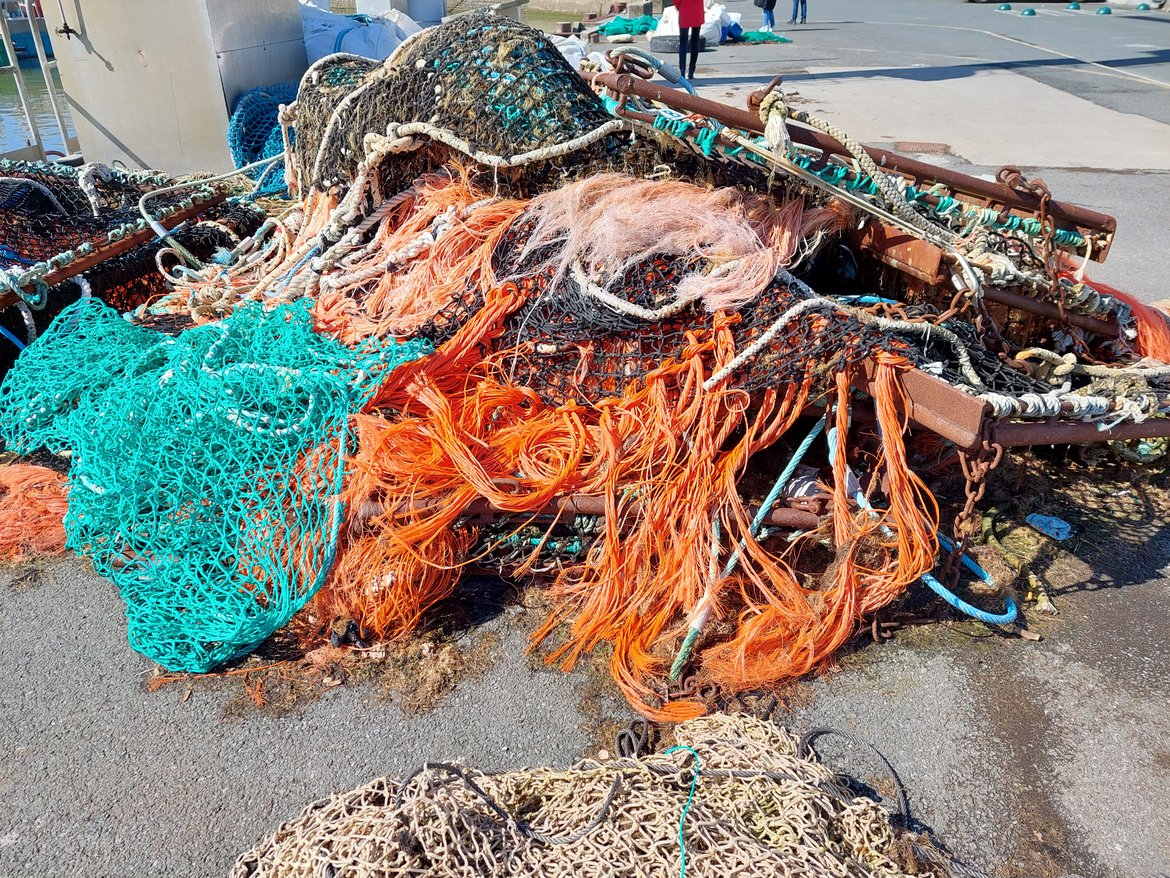
Fishing for Litter (FFL) operates in several OSPAR countries and it enables fishers to bring ashore litter that is accidentally caught in nets during normal fishing operations, providing bags, port collection points, and disposal services free of charge.
5.23 Several OSPAR Contracting Parties, such as Sweden, the Netherlands and Norway, have complemented international and industry activity with national legislation, guidelines, and pilot projects addressing microplastics, especially concerning artificial turf, pellet loss, tyre and textile emissions, and product-level measures (OSPAR Commission, 2023). These national efforts translate high-level EU rules and industry pledges into practical interventions and testing environments. The collective evidence by 2025 suggests that integrating regulatory bans and restrictions (e.g., REACH’s microplastics restriction), mandatory reporting and standards, industry certification (like OCS Europe), and national pilot initiatives yields the strongest prospects for measurable environmental outcomes. Conversely, where measures remain voluntary, progress tends to be inconsistent, hinging on local enforcement and market incentives. For “zero pellet loss” and significant reductions in microplastic emissions to materialise, continued investment in robust indicators, independent auditing, and the integration of transport safety into policy frameworks will be essential (Ellen MacArthur Foundation, 2024; European Commission, 2023b; OCS Europe, 2025).
Conclusions
Key messages6
6.1 Global plastics production reached 400,4 million tonnes in 2022, showing a consistent year-on-year increase since 2018, indicating rising worldwide demand. Production in the 27 EU Member States, Norway, Switzerland, and the United Kingdom (EU27+3) was approximately 58,8 million tonnes in 2022, fluctuating but lower than 2018 levels.
6.2 Packaging materials remain the most dominant end-use market for plastics, accounting for approximately 39% of all uses in 2022, followed by building and construction (22,9%) and automotive uses (8,3%). Almost 80% of plastics are derived from fossil-fuel feedstocks, though bio-based plastics represent a small but growing market.
6.3 In 2022, 32,3 million tonnes of post-consumer plastic litter were collected across the EU27+3. Of this, 23,5% was sent to landfill (a decrease from 2018), 49,6% was sent for energy recovery (an increase), and 26,9% was sent for recycling (an increase). Packaging constitutes the largest single source of plastic litter due to its typically short lifespan.
6.4 Microplastics represent an increasing concern due to their ubiquity, longevity, and risks to ecosystem and human health. They are categorised into primary microplastics (intentionally manufactured small plastics, e.g., nurdles, microbeads) and secondary microplastics (from fragmentation of larger items, e.g., synthetic fibres from clothing and degradation in the environment). Pre-production pellets ('nurdles') are a significant contributor to marine microplastic pollution, with major maritime spills documented.
6.5 The OSPAR Regional Action Plan for Marine Litter (RAP ML 2), covering 2022-2030, is a key initiative focusing on reducing marine litter from both land-based and sea-based sources, including plastic pellets, fishing gear, and urban wastewater. OSPAR strengthened its efforts in 2025 through the adoption of a series of measures from the RAP ML2, including OSPAR Decision 2025/02 to prevent the release of expanded polystyrene (EPS), extruded polystyrene (XPS), and other foamed plastic from pontoons and buoys; OSPAR Recommendation 2025/02 promoting best environmental practice, approving new best-practice guidance, and launching a Progress Report on RAP ML 2 implementation.
6.6 While legislative actions like the EU's Packaging and Packaging Waste Regulation (PPWR), REACH restriction on intentionally added microplastics, the pellets regulation, and the Single-Use Plastics (SUP) Directive show encouraging early outcomes, independent evaluations caution that collective ambition still falls short of the necessary scale to meet 2025 and 2030 goals. There remains a need for enhanced transport safety, stronger enforcement, harmonised reporting, continued investment in robust indicators and independent auditing, and an improved and appropriate waste management system.
Distribution and intensity of activity
6.7 Germany holds the highest proportion of plastics production in the EU27+3, at 22,1% in 2022 (13 million tonnes), and nearly one-quarter of total European demand for plastics from converters in 2021 (23,2%). Other OSPAR countries with significant production include Belgium (12,4%), the Netherlands (10,5%), France (9,4%), Spain (9,0%), and the United Kingdom (4,4%). The European plastics industry is a significant economic sector, employing over 1,5 million people across more than 51 700 companies in 2023, with Germany also being the largest hub for employment and value added in plastics manufacturing.
Trends
6.8 Global plastics production has demonstrated a consistent year-on-year increase, rising from 370,5 million tonnes in 2018 to 400,4 million tonnes in 2022. In contrast, plastics production within the EU27+3 has fluctuated in recent years, reaching 58,8 million tonnes in 2022, which is slightly higher than 2020 but lower than 2018 and 2021.
6.9 The collection of post-consumer plastic waste in the EU27+3 has also seen an increase, from 27,1 million tonnes in 2016 to 32,3 million tonnes in 2022. Within waste management, the proportion of plastic waste sent to landfill has decreased, while energy recovery and recycling rates have shown an upward trend.
6.10 Furthermore, exports of plastic waste outside the EU27+3 have been significantly reduced by 58% between 2016 and 2022. Encouragingly, early outcomes from the Single-Use Plastics (SUP) Directive show a steady decline in SUP-related items in coastal litter since 2016, and the average consumption of lightweight plastic carrier bags has fallen by 14% between 2021 and 2022.
Economic value
6.11 The European plastics industry plays a substantial economic role, generating an estimated turnover of approximately €365 billion and employing over 1,5 million people across more than 51 700 companies in 2023. Historically, the industry has maintained a positive trade balance for both raw materials and converted products. In 2020, Germany recorded the highest value added at factor cost for the manufacture of plastic products among OSPAR countries, at €23 814,2 million, highlighting its economic significance in the sector.
Pressures and impacts
6.12 Plastics generate a range of pressures and impacts, including greenhouse gas emissions, loss of resources, and pollution. In the marine environment these impacts manifest as harm to ecosystem health, injury to wildlife through entanglement or ingestion, and negative economic consequences for sectors like coastal tourism and fisheries.
6.13 Plastic litter enters the sea through diffuse land-based sources such as stormwater discharges, sewer overflows, tourism litter, illegal dumping, industrial activities, and consumer cosmetic products, as well as marine activities including shipping, fishing (e.g., abandoned fishing gear), and aquaculture. An estimated minimum of 14 million tonnes of plastic enters the ocean every year, with research suggesting over 170 trillion plastic particles were afloat globally as of 2019.
6.14 Microplastics, including pre-production pellets (nurdles), are a pervasive threat, with significant losses to the environment from incidents such as the Toconao, Trans Carrier, and X-Press Pearl maritime spills. The COVID-19 pandemic further exacerbated plastic pollution with a surge in improperly disposed single-use personal protective equipment (PPE).
Measures
6.15 OSPAR initiatives include the second Regional Action Plan for Marine Litter (RAP ML 2022-2030), which targets both land-based and sea-based sources, focusing on plastic pellets, fishing gear, and urban wastewater. Recent OSPAR efforts in 2025 involved adopting Decision 2025/02 to prevent the release of expanded polystyrene (EPS), extruded polystyrene (XPS), and other foamed plastic from pontoons and buoys, Recommendation 2025/02 to promote best environmental practices, and approving new guidance tools, such as those for reducing plastic biomedia loss from wastewater plants.
6.16 The European Union has enacted significant legislation, including the Packaging and Packaging Waste Regulation (PPWR), which mandates design-for-recycling, sets reuse targets, and introduces minimum recycled-content requirements. A broad restriction on intentionally added microplastics has also been implemented under REACH (Regulation (EU) 2023/2055), alongside an agreement for a regulation to prevent plastic pellet losses across the supply chain, which was adopted in 2025. The Single-Use Plastics (SUP) Directive has led to bans and targets for collection, showing encouraging early declines in SUP-related litter and reduced carrier bag consumption. The 2020 Circular Economy Action Plan further extends product policy levers to durability and material efficiency.
6.17 At the national and industry levels, OSPAR governments are engaged with the New Plastics Economy Global Commitment, and voluntary programmes like Operation Clean Sweep© (OCS) aim for zero pellet loss, with a certification scheme now operational. National guidelines and pilot projects in countries like Sweden, France, the Netherlands, and Norway complement these efforts by addressing microplastics and pellet loss from specific sources. The most effective outcomes are observed where regulatory bans, mandatory reporting, industry certification, and national initiatives are integrated.
Regional Summary
6.18 Within the OSPAR Maritime Area (specifically EU27+3 data), Germany leads in both plastics production (22,1%) and demand (23,2%). Other prominent OSPAR countries in terms of production include Belgium (12,4%), the Netherlands (10,5%), France (9,4%), Spain (9,0%), and the United Kingdom (4,4%). For plastic waste management, Belgium had the highest proportion of recycled post-consumer plastic (39%) among OSPAR countries in 2022, followed by Spain (38%), the Netherlands (38%), and Germany (37%). OSPAR countries with landfill bans, such as Belgium, the Netherlands, Germany, Denmark, and Norway, recorded very low proportions of plastics sent to landfill (0-2%), demonstrating effective waste diversion strategies. Conversely, Spain (39%), Portugal (36%), and France (28%) had the highest proportions of plastic waste sent to landfill. Overall plastic packaging recycling rates across OSPAR countries show variation between 2018 and 2023, as do per capita generation rates of plastic packaging waste.
References
Brännström, S., Lydig, S.G., Lidfeldt, M., Mawdsley, I., Strömberg, E. & Rydberg, T. (2022) Bioråvara till plast nuläge och trender. Naturvårdsverket, Ref Nr NV-07115-20-04. ISBN 978-91-7883-365-8. Available at: https://ivl.diva-portal.org/smash/get/diva2:1651150/FULLTEXT01.pdf
Cedre, Tallec, K. (2025) Plastic pellets: Loss prevention on industrial sites and response in the environment, 92 p. (Operational Guide). Available at: https://wwz.cedre.fr/en/download/check/11737/file/GPI_plasticpellets_filigrane.pdf
Cocozza, P., Scarrica, V.M., Rizzo, A., Serranti, S., Staiano, A., Bonifazi, G. & Anfuso, G. (2025) Microplastic pollution from pellet spillage: Analysis of the Toconao ship accident along the Spanish and Portuguese coasts. Marine Pollution Bulletin, Volume 211, 117430, ISSN 0025-326X, https://doi.org/10.1016/j.marpolbul.2024.117430
Council of the EU (2025) Press Release: Plastic pellet losses: Council and Parliament agree on new rules to reduce microplastic pollution. Available at: https://www.consilium.europa.eu/en/press/press-releases/2025/04/08/plastic-pellet-losses-council-and-parliament-agree-on-new-rules-to-reduce-microplastic-pollution/?utm_source=chatgpt.com
Ellen MacArthur Foundation (2024) The Global Commitment 2024 progress report. Ellen MacArthur Foundation. Available at: https://content.ellenmacarthurfoundation.org/m/528a7cd095787dec/original/The-Global-Commitment-2024-Progress-Report.pdf
Eriksen M, Cowger W, Erdle LM, Coffin S, Villarrubia-Gómez P, et al. (2023) A growing plastic smog, now estimated to be over 170 trillion plastic particles afloat in the world’s oceans—Urgent solutions required. PLOS ONE 18(3): e0281596. https://doi.org/10.1371/journal.pone.0281596
European Bioplastics (2024) Bioplastics Market Data. Available at: https://www.european-bioplastics.org/market/
European Commission (2018a). Commission Staff Working Document SWD(2018) 16 final accompanying the document Communication from the Commission to the European Parliament, the Council, the European Economic and Social Committee and the Committee of the Regions - A European Strategy for Plastics in a Circular Economy. Available at: https://eur-lex.europa.eu/legal-content/EN/TXT/PDF/?uri=CELEX:52018SC0016&from=EN
European Commission (2020a). Commission Staff Working Document. Leading the way to a global circular economy: state of play and outlook SWD (2020) 100 final. Available at: https://ec.europa.eu/environment/circular-economy/pdf/leading_way_global_circular_ economy.pdf
European Commission (2020b). Communication from the Commission to the European Parliament, the Council, the European Economic and Social Committee and the Committee of the Regions. A new Circular Economy Action Plan For a cleaner and more competitive Europe COM(2020) 98 final. Available at: https://ec.europa.eu/environment/circular-economy/pdf/new_circular_economy_action_plan.pdf and https://ec.europa.eu/environment/circular-economy/pdf/new_circular_economy_action_plan_annex.pdf
European Commission (2021) Zero Pollution Action Plan. Available at: https://environment.ec.europa.eu/strategy/zero-pollution-action-plan_en
European Commission (2023a) Commission Regulation (EU) 2023/2055 of 25 September 2023 amending Annex XVII to Regulation (EC) No 1907/2006 as regards synthetic polymer microparticles. Official Journal of the European Union. Available at: https://eur-lex.europa.eu/eli/reg/2023/2055/oj
European Commission (2023b) Restrictions — REACH: restriction of synthetic polymer microparticles. Single Market, Industry, Entrepreneurship and SMEs. Available at: https://single-market-economy.ec.europa.eu/sectors/chemicals/reach/restrictions/commission-regulation-eu-20232055-restriction-microplastics-intentionally-added-products_en
European Commission (2024) EU-wide end-of-waste criteria for plastic waste, Publications Office of the European Union, Luxembourg. Available at: https://data.europa.eu/doi/10.2760/9234350,
European Council (2025) Plastic pellet losses: Council and Parliament agree on new rules to reduce microplastic pollution. Available at: https://www.consilium.europa.eu/en/press/press-releases/2025/04/08/plastic-pellet-losses-council-and-parliament-agree-on-new-rules-to-reduce-microplastic-pollution/
European Environment Agency (2019). Preventing Plastic Waste in Europe. EEA Report 2/2019. Luxembourg: Publications Office of the European Union, 2019 ISBN 978-92-9480-194-4. Available at: https://www.eea.europa.eu/publications/preventing-plastic-waste-in-europe
European Environment Agency (2020a). Briefing on The Plastic Waste Trade in the Circular Economy (updated 23 July 2020). Available at: https://www.eea.europa.eu/themes/waste/resource-efficiency/the-plastic-waste-trade-in
European Environment Agency (2020b). Briefing on Biodegradable and Compostable Plastics – challenges and opportunities. Available at: https://www.eea.europa.eu/themes/waste/resource-efficiency/biodegradable-and-compostable-plastics-challenges
European Environment Agency (2025) Litter found on European sea beaches. Available at: https://www.eea.europa.eu/en/circularity/sectoral-modules/plastics/litter-found-on-european-beaches?activeTab=658e2886-cfbf-4c2f-a603-061e1627a515
European Union (1994). European Parliament and Council Directive 94/62/EC of 20 December 1994 on packaging and packaging waste. Available at: https://eur-lex.europa.eu/eli/dir/1994/62/oj
European Union (2015). Directive (EU) 2015/720 of the European Parliament and of the Council of 29 April 2015 amending Directive 94/62/EC as regards reducing the consumption of lightweight plastic carrier bags. Available at: https://eur-lex.europa.eu/eli/dir/2015/720/oj
European Union (2018a). Directive (EU) 2018/851 of the European Parliament and of the Council of 30 May 2018 amending Directive 2008/98/EC on waste. Available at: https://eur-lex.europa.eu/eli/dir/2018/851/oj
European Union (2018b). Directive (EU) 2018/852 of the European Parliament and of the Council of 30 May 2018 amending Directive 94/62/EC on packaging and packaging waste. Available at: https://eur-lex.europa.eu/eli/dir/2018/852/oj
European Union (2018c). Consolidated text: European Parliament and Council Directive 94/62/EC of 20 December 1994 on packaging and packaging waste. Available at: https://eur-lex.europa.eu/eli/dir/1994/62/2018-07-04
European Union (2019). Directive (EU) 2019/904 of the European Parliament and of the Council of 5 June 2019 on the reduction of the impact of certain plastic products on the environment. Available at: https://eur-lex.europa.eu/eli/dir/2019/904/oj
Eurostat (2024) Consumption of plastic carrier bags – estimates. Available at: https://ec.europa.eu/eurostat/statistics-explained/index.php?title=Consumption_of_plastic_carrier_bags_-_estimates
Eurostat (2025a). Annual detailed enterprise statistics for industry (NACE Rev. 2, B-E). Available at: https://ec.europa.eu/eurostat/databrowser/view/sbs_na_ind_r2__custom_17759519/default/table
Eurostat (2025b). Recycling rate of packaging waste by type of packaging. Data code cei_wm020 Available at: https://ec.europa.eu/eurostat/databrowser/view/cei_wm020__custom_17766129/default/table
Eurostat (2025c). Packaging waste by waste management operations and waste flow. Data code env_waspac Available at: https://ec.europa.eu/eurostat/databrowser/view/cei_pc050/default/table?lang=en
Feng, Y., Tu, C., Li, R., Wu, D., Yang, J., Xia, Y., Peijnenburg, W.J.G.M., Luo, Y. (2023) A systematic review of the impacts of exposure to micro- and nano-plastics on human tissue accumulation and health, Eco-Environment & Health, Volume 2, Issue 4, 2023, Pages 195-207, ISSN 2772-9850, https://doi.org/10.1016/j.eehl.2023.08.002
IMO (2019) Action Plan To Address Marine Plastic Litter From Ships. MEPC 73/19/Add.1. Annex 10. Available at: https://wwwcdn.imo.org/localresources/en/MediaCentre/HotTopics/DocumentsIMO%20marine%20litter%20action%20plan%20MEPC%2073-19-Add-1.pdf
IMO (2024) Follow-Up Work Emanating From The Action Plan To Address Marine Plastic Litter From Ships. MEPC 82/8/3. Available at: https://www.asoc.org/wp-content/uploads/2025/01/2024_IMOs-Action-Plan_-illegal-discharge-of-marine-plastic-litter-from-ships.pdf
Lai H, Liu X & Qu M. (2022) Nanoplastics and Human Health: Hazard Identification and Biointerface. Nanomaterials (Basel). 2022 Apr 11;12(8):1298. doi: 10.3390/nano12081298. PMID: 35458006; PMCID: PMC9026096. Availble at: https://pmc.ncbi.nlm.nih.gov/articles/PMC9026096/
Muposhi, A., Mpinganjira, M., Wait, M. (2022) Considerations, benefits and unintended consequences of banning plastic shopping bags for environmental sustainability: A systematic literature review. Waste Manag Res.;40(3):248-261. doi: 10.1177/0734242X211003965.
Napper, I.E. and R.C. Thompson. (2019) Environmental Deterioration of Biodegradable, Oxo-biodegradable, Compostable, and Conventional Plastic Carrier Bags in the Sea, Soil, and Open-Air Over a 3-Year Period. Environ Sci Technol, 2019. 53(9): p. 4775-4783
Newman, S., Watkins, E., Farmer, A., ten Brink, P., & Schweitzer, J.-P. (2015). The economics of marine litter. In: Bergmann, M., Gutow, L., Klages, M. (eds.), Marine Anthropogenic Litter. Springer, Cham. Available at: https://link.springer.com/chapter/10.1007/978-3-319-16510-3_14
Norwegian Coastal Authority (2020). Government Environmental Response to Accidental Release of Plastic Pellets. Webpage dated 16 June 2020 Available at: https://www.kystverket.no/en/EN_System/plastic-pellets-clean-up/
NurdleHunt (2025) News Bulletin: Plastic Pellet Spill in North Sea. Web article published 20th March 2025, last updated 21st April 2025. Available at: https://www.nurdlehunt.org.uk/news/spills/news-bulletin-plastic-pellet-spill-in-north-sea.html
OCS Europe (2025) OCS Europe — The solution / certification scheme. Operation Clean Sweep. Available at: https://www.opcleansweep.eu/the-solution/ocs-certification-scheme
OECD (2018). Improving Plastics Management: Trends, policy responses, and the role of international co-operation and trade ISSN 2309-7841. Available at: https://www.oecd.org/environment/waste/policy-highlights-improving-plastics-management.pdf
OSPAR (2015). Marine Litter Regional Action Plan. ISBN: 978-1-906840-86-0 Publication number 643/2014. Available at: https://www.ospar.org/documents?v=34422
OSPAR (2017). Assessment document of land-based inputs of microplastics in the marine environment. ISBN: 978-1-911458-45-6 Publication Number: 705/2017. Available at: https://www.ospar.org/documents?v=38018
OSPAR (2018). Background document on pre-production Plastic Pellets. ISBN 978-1-911458-50-0 Publication Number: 710/2018. Available at: https://www.ospar.org/documents?v=39764
OSPAR (2020). Action Plan for Marine Litter. Available at: https://www.ospar.org/work-areas/eiha/marine-litter/regional-action-plan
OSPAR (2021). Harm caused by Marine Litter to Biota: An OSPAR Thematic Assessment. OSPAR Commission, London.
OSPAR (2023) Production and Consumption of Plastics — OSPAR assessments and references to national guidance (e.g., Miljødirektoratet 2016; RIVM 2017; Swedish EPA 2021; CEN 2020). Available at: https://oap.ospar.org/en/ospar-assessments/quality-status-reports/qsr-2023/other-assessments/production-and-consumption-plastics/
OSPAR (2023a) Reporting on the implementation of OSPAR Recommendation 2016/01 on the reduction of marine litter through the implementation of Fishing for Litter initiatives. Available at: https://www.ospar.org/documents?v=51497
OSPAR (2025) Overview assessment report of Recommendation 2021/06 on the management of plastic pellets, flakes and powders and OCS Europe supervisory board membership. Available at: https://www.ospar.org/documents?v=63721
Patrício Silva, A.L, Prata, J.C., Walker, T.R., Duarte, A.C., Ouyang, W., Barcelò, D. & Rocha-Santos, T. (2020). Increased plastic pollution due to COVID-19 pandemic: Challenges and recommendations. Chemical Engineering Journal 405. Available at: https://www.sciencedirect.com/science/article/pii/S1385894720328114
PlasticsEurope (2011). Plastics – The Facts 2011. Available at: https://www.plasticseurope.org/en/resources/publications/115-plastics-facts-2011
PlasticsEurope (2019). Plastics – The Facts 2019. Available at: https://www.plasticseurope.org/application/files/9715/7129/9584/FINAL_web_version_Plastics_the_facts2019_14102019.pdf
PlasticsEurope (2020a). Plastics – The Facts 2020. Available at: https://www.plasticseurope.org/en/resources/publications/4312-plastics-facts-2020
PlasticsEurope (2020b). PlasticsEurope Operation Clean Sweep Report 2019. Available at: http://www.opcleansweep.eu/wp-content/uploads/2020/10/OCS-Progress-Report-2019-Web-LR-151020.pdf
PlasticsEurope (2023) Roadmap: our industry's roadmap for plastics in Europe to be circular and have net-zero greenhouse gas emissions by 2050. Available at: https://plasticseurope.org/wp-content/uploads/2023/11/1814354_Roadmap-copychange_112023.pdf
PlasticsEurope (2024) The Circular Economy for Plastics – A European Analysis. Available at: https://plasticseurope.org/knowledge-hub/the-circular-economy-for-plastics-a-european-analysis-2024/
PlasticsEurope (2024b) Plastics – The Fast Facts 2024. Available at: https://plasticseurope.org/wp-content/uploads/2024/11/PE_TheFacts_24_digital-1pager.pdf
Pradel, A., Catrouillet, C. & Gigault, J. (2023) The environmental fate of nanoplastics: What we know and what we need to know about aggregation, NanoImpact, Volume 29, 2023, 100453, ISSN 2452-0748, https://doi.org/10.1016/j.impact.2023.100453
Sewwandi, M., Hettithanthri, O., Egodage, S.M., Amarathunga, A.A.D. & Vithanage, M. (2022) Unprecedented marine microplastic contamination from the X-Press Pearl container vessel disaster, Science of The Total Environment, Volume 828, 154374, ISSN 0048-9697, https://doi.org/10.1016/j.scitotenv.2022.154374
Schulz, M. & Werner, S. (2022) Impacts of marine litter on biota in the OSPAR Maritime Area: A review of previous and current studies. OSPAR Quality Status Report 2023. Available at: http://oap-cloudfront.ospar.org/media/filer_public/06/42/06428816-e385-4f69-ac27-301a973ed053/p00888_marine_litter_biota_harm_review.pdf
Tumu, K., Vorst, K., Curtzwiler, G. (2023) Global plastic waste recycling and extended producer responsibility laws, Journal of Environmental Management, Volume 348, 119242, ISSN 0301-4797, Available at: https://doi.org/10.1016/j.jenvman.2023.119242.
United Nations Environment Programme (2021). Drowning in Plastics – Marine Litter and Plastic Waste Vital Graphics. Available at: https://iucn.org/sites/default/files/2024-05/plastic-pollution-issues-brief-may-2024-update.pdf
UNEP (2025) The New Plastics Economy Global Commitment. Available at: https://www.unep.org/new-plastics-economy-global-commitment
Villarrubia-Gómez, P., Carney Almroth, B., Eriksen, M., Ryberg, M., & Cornell, S. E. (2024). Plastics pollution exacerbates the impacts of all planetary boundaries. One Earth. https://doi.org/10.1016/j.oneear.2024.10.017
Wilts, H., Ioannis, B., Nelen, D., Le Blévennec, K., Meinel, U., Bahn-Walkowiak, B., Arnold, M., Mortensen, L., Reichel, A. & Montalvo, D. (2019). Preventing plastic waste in Europe. EEA Report No 02/2019 doi: 10.2800/812531.
Footnotes
1 Except where stated, data in this report are for entire countries, and do not separate out OSPAR regions
2 The term “reusable” is specified within PlasticsEurope’s reporting. However, it is worth noting that although these products may be reusable in theory, they are often used only once in practice.
3 It is likely that in regions with landfill bans, plastics are not intentionally sent to landfill. Selectively collected plastics go to recycling, and non-selectively collected streams are incinerated. However, small amounts of plastic may still reach landfill indirectly, for example as part of hazardous or residual waste streams, or as residues from other treatment processes.
4 Includes household, industrial and commercial packaging; this Eurostat data does not include Switzerland or the United Kingdom
5 The government signatory list in 2023 included France, United Kingdom, the Netherlands, Norway, and Portugal as signatories, with Spain and Belgium confirmed to commit. (UNEP, 2025)
6 The views expressed on key messages are those of the assessor and do not necessarily represent the views of the OSPAR Commission