

Distribution of Reported Impulsive Sounds in the Sea
Background
OSPAR endeavours to keep the introduction of energy, including underwater noise, at levels that do not adversely affect the marine environment. Sound is a by-product of human activities in the marine environment (e.g., shipping or construction) or is produced intentionally for the purposes of surveying the seabed or water column. Sound is referred to here as ‘noise’ only when it has the potential to cause negative impacts on marine life.
The introduction of anthropogenic sound became widespread with the advent of motorised shipping, and now has a wide range of sources. Anthropogenic sound sources are categorised as impulsive or continuous. This assessment addresses impulsive sound sources, which include percussive pile driving for inshore and offshore construction (Figure 1), seismic surveys (using airguns) to map subsea oil and gas deposits, explosions, and some sonar sources.
Impulsive sound sources have been observed to cause temporary displacement of small cetaceans (e.g., harbour porpoise), increased physiological stress in some fish species (e.g., European seabass), and developmental abnormalities in invertebrate larvae. In some cases, they may also be capable of causing more severe effects such as permanent auditory damage or blast injuries. While effects on individual animals have been shown for a number of species, there is uncertainty over whether and how the effects of sound on individuals are translated to the population or ecosystem scale. The purpose of this assessment is to assess the amount and distribution of impulsive sound sources across the OSPAR Maritime Area. This assessment quantifies anthropogenic pressure from impulsive sound in the OSPAR Maritime Area, covering data reported in the period 2015-2019. It updates the first multi-year assessment, conducted in 2019 and covering 2015-2017.

Figure 1: Pile driving operation with bubble curtain. © Trianel/Lang
Human activities introduce many types of energy into the marine environment including sound, light and other electromagnetic fields, heat, and radioactive energy. Of these, the most widespread and pervasive is underwater sound. It is likely that the amount of underwater sound has been increasing since the advent of steam driven ships, although there have been very few studies to quantify any such increase in the OSPAR Maritime Area.
Anthropogenic sound is commonly known as noise, but for the purposes of this assessment the term ‘noise’ is used only in relation to sound that has the potential to cause negative impacts on marine life. The term ‘sound’ is used to refer to the acoustic energy radiated from a vibrating object, with no particular reference to its function or potential effect. ‘Sounds’ include both meaningful signals and ‘noise’ which may have either no particular impact or may have a range of adverse effects. The term ‘noise’ is only used where adverse effects are specifically described, or when referring to specific technical distinctions such as ‘masking noise’ and ‘ambient noise’. (Van der Graaf et al., 2012).
Sound sources can be categorised as continuous or impulsive. Impulsive sounds are of short duration and with a rapid onset (e.g., explosions, pile driving, seismic airguns, sonar), while continuous sounds are long lasting and do not have pulse characteristics (e.g., shipping, dredging). Impulsive sounds may be repeated at intervals (e.g., pile driving), and at distance will become diffused and may have a more continuous nature. High-frequency sounds propagate less well in the marine environment than low-frequency sounds, which can travel far in waters that are sufficiently deep.
Marine organisms that are exposed to anthropogenic sound (e.g., harbour porpoise Phocoena phocoena, see Figure a; and European seabass, Dicentrarchus labrax; see Figure b) can be adversely affected over short timescales (acute effect) and over longer periods. Adverse effects may be subtle (e.g., temporary reduction in hearing sensitivity, physiological stress) or obvious (e.g., overt behavioural responses, death). While there is a growing body of literature on the potential effects of anthropogenic sound on individual animals (Williams et al., 2015; Duarte et al 2021), obtaining direct observations of the effects of anthropogenic sound on particular ecosystems or populations is challenging. As such, there is uncertainty over whether and how effects on individuals are translated to the population or ecosystem scale.
Descriptor 11 of the EU Marine Strategy Framework Directive (2008/56/EC) contains two Criteria of Good Environmental Status (GES) in European waters: D11C1 on “Anthropogenic impulsive sound in water” and D11C2 on “Anthropogenic continuous low-frequency sound in water”. At present, there are no threshold values for GES, although these are expected to be defined since the Commission Decision 2017/848 requires that “Member States shall establish threshold values for these levels through cooperation at Union level, taking into account regional or subregional specificities.” OSPAR has adopted Criterion D11C1 as an OSPAR Common Indicator, which is the subject of this assessment. This Common Indicator considers the pressure from impulsive noise (a second Common Indicator to assess the risk of impact is in preparation). The Indicator is based on the spatio-temporal distribution of low-frequency and mid-frequency impulsive sound sources within the OSPAR Maritime Area.
. © Solvin Zankl")
Figure a: Harbour porpoise (Phocoena phocoena). © Solvin Zankl
. © Citron")
Figure b: European seabass (Dicentrarchus labrax). © Citron
Data were obtained from the Impulsive Noise Registry, which was developed for OSPAR by ICES, in 2016, to hold data on activities that generate impulsive sound. The registry accords with the guidelines from the EU Technical Group on Underwater Noise (adopted by OSPAR in 2014; OSPAR Agreement 2014-08 (Monitoring Guidance for Underwater Noise in European Seas), and is maintained by ICES. Initially, this registry was supported by OSPAR alone, but is now also used by HELCOM and may be used by other Regional Seas Conventions in the future. Data have been uploaded for several countries and this process is expected to continue. The database collates the data in a standard format and in accordance with the data requirements for the OSPAR Impulsive Noise Indicator (OSPAR, 2014).
This assessment uses data from 2015-2019 (see Table a for a summary of the activity types each country reported for this period).
| Contracting Party | Year | Seismic Airgun Surveys | Pile Driving | Explosions | Sonar and Acoustic deterrents | Generic/ Source type not reported | No impulsive noise in year |
|---|---|---|---|---|---|---|---|
| Belgium | 2015 | X | |||||
| 2016 | X | X | |||||
| 2017 | X | X | |||||
| 2018 | X | X | |||||
| 2019 | X | ||||||
| Denmark | 2015 | X | X | ||||
| 2016 | X | X | X | ||||
| 2017 | X | X | X | X | |||
| 2018 | X | X | |||||
| 2019 | X | X | X | ||||
| France | 2015 | ||||||
| 2016 | 0 | X | X | ||||
| 2017 | 0 | X | X | ||||
| 2018 | X | ||||||
| 2019 | X | ||||||
| Germany | 2015 | 0 | X | ||||
| 2016 | 0 | X | |||||
| 2017 | 0 | X | X | ||||
| 2018 | X | X | |||||
| 2019 | X | ||||||
| Ireland | 2015 | ||||||
| 2016 | X | ||||||
| 2017 | X | X | |||||
| 2018 | X | X | |||||
| 2019 | X | ||||||
| Netherlands | 2015 | 0 | X | X | |||
| 2016 | 0 | X | |||||
| 2017 | X | 0 | X | ||||
| 2018 | X | X | |||||
| 2019 | X | ||||||
| Norway | 2015 | ||||||
| 2016 | |||||||
| 2017 | |||||||
| 2018 | |||||||
| 2019 | X | ||||||
| Portugal | 2015 | X | X | ||||
| 2016 | X | ||||||
| 2017 | X | X | |||||
| 2018 | X | ||||||
| 2019 | |||||||
| Sweden | 2015 | X | |||||
| 2016 | X | X | |||||
| 2017 | |||||||
| 2018 | X | ||||||
| 2019 | |||||||
| UK | 2015 | X | X | X | |||
| 2016 | X | X | X | X | X | ||
| 2017 | X | X | X | X | X | ||
| 2018 | X | X | X | X | X | ||
| 2019 | X | X | X | X |
The OSPAR Impulsive Noise Indicator is defined as follows:
Distribution in time and place of loud, low and mid frequency impulsive sounds – proportion of days and their distribution within a calendar year over areas of a determined surface, as well as their spatial distribution, in which anthropogenic sound sources exceed levels that are likely to entail significant impact on marine animals measured as Sound Exposure Level [SEL] (in dB re 1µPa2.s) or as peak Sound Pressure Level [SPLpeak] (in dB re 1 µPa peak) at one metre, measured over the frequency band 10 Hz to 10 kHz. (OSPAR, 2014)
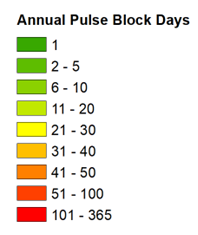
In other words, the Indicator records the number of days within a specified spatial unit in which anthropogenic impulsive sound occurred in a given calendar year. Only sound sources above a specified intensity level are included. These levels are detailed in the technical specification of the Impulsive Noise Indicator (OSPAR, 2014). The spatio-temporal unit used in the assessment is termed Pulse Block Day. The spatial component of the Pulse Block Day is the ICES statistical sub-rectangle, which is defined in a standard way throughout the OSPAR Maritime Area, and provides detailed resolution at the regional scale.
Issues encountered with spatial units
Several different spatial units are used by Contracting Parties to record impulsive sound activity. In some cases, point source data are provided, giving an unambiguous location for the activity, which can then be readily attributed to an ICES sub-rectangle for the purposes of the assessment. In other cases, activities are licensed within a specified area (e.g., UK oil and gas licensing blocks), and data are provided as polygons within which activity occurred. Polygon data presented a logistical challenge for this assessment because they do not align with ICES sub-rectangles and some Contracting Parties use differently sized polygons for different activities. For the purposes of this assessment, the ICES sub-rectangle which contained the centroid of the reported polygon was allotted the Pulse Block Day for that block (see Figure c).
 attributed to one day of sonar activity recorded in two UK oil and gas blocks (blue rectangles). Red dots indicate UK block centroids.")
Figure c: Pulse block days in ICES sub-rectangles (light grey boxes with number of Pulse Block Days within) attributed to one day of sonar activity recorded in two UK oil and gas blocks (blue rectangles). Red dots indicate UK block centroids.
This contrasts with a previous assessment (Intermediate Assessment 2017), in which all ICES sub-rectangles which overlapped with a given polygon of activity were considered to contain the Pulse Block Days allotted to that polygon. This resulted in a substantial over-estimation of spatial coverage, because even slight overlap with an adjacent ICES sub-rectangle resulted in the activity being recorded throughout that block. The current approach reduces the over-estimation in pressure footprint (e.g., from 180% to 120% of reported area in 2015), although in some cases up to 33% of the area of reported activity may be assigned to the adjacent block. Hence, if an activity (or part of) had occurred in that area, then the allotted sub-rectangle would not cover its original location. This does not change the total PBD spatial and temporal coverage. The original reported data is retained in the registry, which allows further methodological refinements to be made in future.
Issues encountered with source intensity
Although the intensity of sources was identified as important additional information for the OSPAR Impulsive Noise Indicator, this information is only available for some sound-generating activities. There may be reasons why actual source levels cannot be made available, for example reasons of national security (such as relating to operational naval sonars), in which case the source level is either not specified or only an indication of category is available. The decision as to whether source level (or an indication thereof) is made available is at the discretion of individual countries. It was decided not to include information on source intensity in this assessment until more reliable information is provided. Work to improve the quality of reporting and the robustness of the source intensity categories is ongoing.
Results
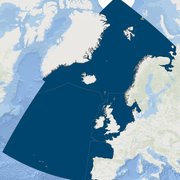
Data during 2015-19 were provided by Belgium, Denmark, France, Germany, Ireland, the Netherlands, Norway, Portugal, Sweden, and the UK within five sound source type categories (seismic airgun surveys, pile driving, explosions, sonar and acoustic deterrents, and generic, which includes sources such as non-airgun seismic surveys (sub-bottom profilers) and source type not reported). The distribution of these impulsive sound sources is assessed in Pulse Block Days, defined as the number of days in a calendar year in which impulsive sound activity occurred within a particular area (ICES statistical sub-rectangle). Figure 2 illustrates the distribution of total Pulse Block Days during 2015-2019, based on the currently available data in the OSPAR Impulsive Noise Registry. This visualisation represents a partial assessment, since data were not available for all activities and Contracting Parties during the assessment period.
Total Pulse Block Days reported for 2015. Available at: ODIMS
Total Pulse Block Days reported for 2018. Available at: ODIMS
Total Pulse Block Days reported for 2016. Available at: ODIMS
Total Pulse Block Days reported for 2019. Available at: ODIMS
Total Pulse Block Days reported for 2017. Available at: ODIMS
Figure 2: Total Pulse Block Days reported for 2015-2019
Impulsive sound sources were reported in all five OSPAR Regions (Figure 3). Levels of reported activity were highest in the North Sea, except during 2017 when the Atlantic region was highest due to seismic airgun activity (Figure 5).
Figure 3: Total Pulse Block Days per OSPAR Region reported for 2015-2019.
Figure 4: Total Pulse Block Days reported in the OSPAR Maritime Area during 2015-2019
In all years, seismic airgun activity was the predominant source type (Figure 6). Overall reported activity was highest in 2019, due in part to the inclusion of seismic airgun data from Norway for the first time (Figure 4; Figure 5). The proportion of pile driving Pulse Block Days reported as having noise abatement applied was lowest in 2016 (27%) and highest in 2018 (98%; Figure 7, Table 1).
Activity type of Pulse Block Days reported for 2015. Available at: ODIMS
Activity type of Pulse Block Days reported for 2018. Available at: ODIMS
Activity type of Pulse Block Days reported for 2016. Available at: ODIMS
Activity type of Pulse Block Days reported for 2019. Available at: ODIMS
Activity type of Pulse Block Days reported for 2017. Available at: ODIMS
Figure 5: Activity type of Pulse Block Days reported for 2015-2019
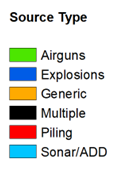
Figure 6: Activity type of Pulse Block Days reported for 2015-2019 in each OSPAR Region
Figure 7: Proportion of pile driving Pulse Block Days reported as having had noise abatement applied (abated) or not (unabated) during 2015-2019 in the OSPAR Maritime Area.
Proxy data for source intensity was reported for each source type (Figure 8). This data may be used in future assessments to estimate the severity of potential impact from each noise source.
Table 1: Number of pile driving Pulse Block Days reported as having had noise abatement applied (abated) or not (unabated) during 2015-2019 in the OSPAR Maritime Area
| 2015 | 2016 | 2017 | 2018 | 2019 | |
|---|---|---|---|---|---|
| Total piling PBDs | 263 | 423 | 377 | 208 | 24 |
| Unabated PBDs | 106 | 308 | 256 | 4 | 1 |
| Abated PBDs | 157 | 115 | 121 | 204 | 23 |
| % PDBs abated | 60 | 27 | 32 | 98 | 96 |
Figure 8: Reported source intensity for the airguns, explosions, generic, pile driving and sonar/ADD source types (total across all years)
There is a moderate confidence in the methodology used and low confidence in the data availability.
One reported event was removed from the data – a single-day event in 2018 categorised as Explosion which was reported as occurring within a German naval polygon. This reporting polygon is very large – the size of tens of ICES statistical sub-rectangles – and so it was considered anomalous to include this datum.
Within the ADD/sonar category, most of the reported activity is understood to be military sonar activity, while the Generic category is understood to be dominated by sub-bottom profiler geophysical surveys.
It is known that some activity occurs which is not yet being reported, such as the use of acoustic deterrent devices in aquaculture.
Conclusion
This assessment of the OSPAR Impulsive Noise Indicator shows the distribution and intensity of reported activity in the OSPAR Maritime Area during 2015-2019. Reported activity was dominated by seismic airgun surveys and was generally most prevalent in the North Sea region. Overall, reported seismic survey activity increased, due in part to improved reporting in 2019. There were also increases in reported explosions and generic source activity. Low levels of reported pile driving activity during 2019 may be due to incomplete reporting. Overall, there was an increase in reported activity reported in the OSPAR Maritime Area, driven by improved reporting in the Arctic region during 2019. More consistent reporting in future years should result in improved confidence in the comprehensiveness of assessments. In the meantime, this assessment represents a minimum level of impulsive noise activity occurring in the OSPAR Maritime Area. This assessment highlights the locations during 2015-2019 where marine animals, if present, may have been affected by impulsive noise. The occurrence of effects would also depend on the distribution and susceptibility of the marine organisms to sound exposure. The likelihood and consequences of the effects of impulsive noise is not assessed here. However, the Common Indicator on the risk of impact from anthropogenic impulsive sound seeks to describe the risk of such effects for individual species.
This assessment uses the Impulsive Noise Registry to assess the OSPAR Impulsive Noise Indicator, using data available from the first five years of reporting (2015-2019). Only partial data were provided by each of the contributing Contracting Parties (Belgium, Denmark, France, Germany, Ireland, the Netherlands, Norway, Portugal, Sweden, and the UK), so the assessment cannot be considered comprehensive. This assessment is pressure-based and describes the distribution of impulsive sound sources in the OSPAR Maritime Area. The use of Pulse Block Days provides a link between the activity reported in the Impulsive Noise Registry and the maps produced for this assessment.
Knowledge Gaps
To provide information on the intensity of activities, the definitions of the source intensity categories in the Registry should be reconsidered, including how to classify source intensity and how to address the reduction in source intensity from source mitigation technologies. Improved reporting in the future will also allow the assessment of cumulative effects.
This assessment is based on the data reported to the Impulsive Noise Registry, and it is known that there are activities which are unaccounted for due to lack of reporting (e.g., unlicensed activities such as the use of acoustic deterrent devices in fish farms, certain geophysical surveys and classified military sonar).
Issues have been identified with the definition of the source intensity categories used to classify the relative pressure exerted by different sources. The source level categories currently contained in the Registry are based on the advice of the EU Technical Group on Underwater Noise (Dekeling et al., 2014), and should be further developed to improve the categorisation across source type. A further limitation is that the effect of source mitigation measures (such as bubble curtains deployed to reduce sound output from pile driving activities) cannot readily be applied to the categories as they are currently defined. This limits the accuracy of the data reported in the OSPAR Impulsive Noise Registry, but could be addressed by redefining all source type categories according to sound source level.
The scope of this assessment is to assess human pressure on the marine environment from impulsive sound sources. Work to assess the risk of impact from impulsive sound sources on marine organisms is being undertaken through a separate OSPAR Common Indicator.
Dekeling, R.P.A., Tasker, M.L., Van der Graaf, A.J., Ainslie, M.A, Andersson, M.H., André, M., Borsani, J.F., Brensing, K., Castellote, M., Cronin, D., Dalen, J., Folegot, T., Leaper, R., Pajala, J., Redman, P., Robinson, S.P., Sigray, P., Sutton, G., Thomsen, F., Werner, S., Wittekind, D., Young, J.V., Monitoring Guidance for Underwater Noise in European Seas, JRC Scientific and Policy Report EUR 26555 EN, Publications Office of the European Union, Luxembourg, 2014. Available at: https://doi.org/doi.org/10.2788/27158
Duarte, C.M., Chapuis, L., Collin, S.P., Costa, D.P., Devassy, R.P., Eguiluz, V.M., Erbe, C., Gordon, T.A.C., Halpern, B.S., Harding, H.R., Havlik, M.N., Meekan, M., Merchant, N.D., Miksis-Olds, J.L., Parsons, M., Predragovic, M., Radford, A.N., Radford, C.A., Simpson, S.D., Slabbekoorn, H., Staaterman, E., Van Opzeeland, I.C., Winderen, J., Zhang, X., Juanes, F. (2021). The soundscape of the Anthropocene ocean. Science, 371(6529), eaba4658. Available at: https://doi.org/10.1126/science.aba4658
OSPAR (2014) Summary record of the meeting of the Environmental Impacts of Human Activities Committee (EIHA). EIHA 14/10/1-E
OSPAR Intermediate Assessment 2017
Van der Graaf AJ, Ainslie MA, André M, Brensing K, Dalen J, Dekeling RPA, Robinson S, Tasker ML, Thomsen F, Werner S (2012). European Marine Strategy Framework Directive - Good Environmental Status (MSFD GES): Report of the Technical Subgroup on Underwater noise and other forms of energy
Williams, R, et al. (2015) Impacts of anthropogenic noise on marine life: Publication patterns, new discoveries, and future directions in research and management. Ocean & Coastal Management 115, 17-24.
Contributors
Authors: Nathan D. Merchant, Niels Kinneging and Alexander Liebschner.
Supported by: Intersessional Correspondence Group on Underwater Noise (ICG-Noise), and OSPAR Environmental Impacts of Human Activities Committee (EIHA)
Citation
Merchant, N.D., Kinneging, N. and Liebschner, A. 2022. Distribution of Reported Impulsive Sounds in the Sea. In: OSPAR, 2023: The 2023 Quality Status Report for the Northeast Atlantic. OSPAR Commission, London. Available at: https://oap.ospar.org/en/ospar-assessments/quality-status-reports/qsr-2023/indicator-assessments/distribution-reported-impulsive-sounds-sea/
| Assessment type | Indicator Assessment |
|---|---|
| Summary Results | https://odims.ospar.org/en/submissions/ospar_imp_uw_noise_msfd_2022_06_001/ |
| SDG Indicator | 14.1 By 2025, prevent and significantly reduce marine pollution of all kinds, in particular from land-based activities, including marine debris and nutrient pollution |
| Thematic Activity | Biological Diversity and Ecosystems - Management of specific human pressures |
| Relevant OSPAR Documentation | OSPAR Agreement 2014-08 Monitoring Guidance for Underwater Noise in European Seas |
| Date of publication | 2022-06-30 |
| Conditions applying to access and use | https://oap.ospar.org/en/data-policy/ |
| Data Snapshot | https://odims.ospar.org/en/submissions/ospar_imp_uw_noise_dsnap_2022_06/ |
| Data Results | https://odims.ospar.org/en/submissions/ospar_imp_uw_noise_dres_2022_06/ |
| Data Source | https://www.ices.dk/data/data-portals/Pages/impulsive-noise.aspx |