

Feeder Report 2021 - Recreation and Tourism in the North-East Atlantic
Trends and Economic Size
To get an idea of the economic size of this sector, public information available was collected. Most recent figures of Gross Value Added (GVA) and employment in Full-Time Equivalent (FTE) are summarised in Table 1. In all OSPAR Regions recreation and tourism activities increased continuously over the last ten years. Especially Contracting Parties located in the Greater North Sea (Region II) and the Bay of Biscay and Iberian Coast (Region IV) showed a big increase in international tourist arrivals, but also in Regions with relatively low tourist arrivals - Arctic Waters (Region I) and Wider Atlantic (Region V) tourism is on the rise. Table 1 shows national figures with a focus on coastal areas. Within countries there are considerable variations on a regional and local level as the activity is often spatially concentrated in certain places. These numbers are to be treated with caution, as the Contracting Parties arrived at these numbers through different methods. However, this overview still helps to present an overview of the economic size of this sector.
It is expected that the COVID-19 outbreak in Europe will have considerable effect on this sector. To what extent, however, is still difficult to predict.
| Country/Region | Km of coastline | GVA | Employment | Year(s) of reference | Reference |
|---|---|---|---|---|---|
| Belgium | 98 | € 335,814 million € | 27,000 FTE | 2007, 2013 | Belgische Staat, 2018 |
| Denmark | 4.605 (Baltic and North Sea) | DKK 16,491 (Approx. € 2,215) | 32,537 FTE | - | Nielsen, Zhang, & Javakhishvili-Larsen, 2019 |
| Ireland | 4.577 | € 558 million | 16,000 FTE | 2018 | Hynes, Aymelek, Corless, & Evers, 2018 |
| UK | 17.381 | Approx. £4,5 billion (€ 5,49 billion) | Approx. 200 000 | 2016, 2012 | Coastal Communities Fund, 2016; Beatty, Fothergill, & Gore, 2014 |
| Portugal | 1.187 | 1,660 | 45,950 | 2010-2013 | INE, 2016 |
| Netherlands | 1.275 | € 2,654 million | 30,000 FTE | 2010, 2014 | Statistics Netherlands, 2016 |
| Norway | 28.953 (without islands) | NOK 45,4 billion (€ 4,88 billion | 88,400 | 2016 | Statistics Norway |
| France: Eastern Channel North Sea Basin | 1.022 | N/A | 23% of all coastal tourism jobs located here | 2013 | Direction interregionale de la Mer, 2019 |
| France: North Atlantic Western Channel Sea Basin | 2.700 | N/A | 40,458 jobs depending on coastal tourism | 2012 | Ministère de la Transition écologique et solidaire, 2019 |
| France: South Atlantic Sea Basin | 720 | N/A | 29,400 jobs in tourism (representing 60% of the maritime economy) | - | Direction interrégionale de la mer Sud-Atlantique, 2019 |
| Spain | - | 51,351.6 Mi € in Total Spain, around 22% in Spanish Atlantic Arc | 900,000 total Spain; around 22% in Spanish Atlantic Arc | 2009-2011 | Fernandez-Macho, et al., 2015 |
| Sweden | 13.500 (Baltic and North Sea) | SEK 95.1 billion | 165 400 | 2015 | Swedish Agency for Economic and Regional Growth, 2016 |
| Germany: Schleswig-Holstein | total German North Sea coast: 1.515 | Gross revenue: € 9,5 billion | 89.266 (in hospitality) | 2018 | Tourismusverband Schelswig-Holstein, 2019 |
| Germany: Lower Saxony | € 8.1 billion | 226.000 direct employees | 2018 | Niedersächsisches Ministerium für Wirtschaft, Arbeit und Verkehr, 2017 |
Pressure and Impact
A wide range of recreation and tourism activities take place along the North-East Atlantic, all exerting different pressures on the coastal and marine environment. The activities assessed included recreational boating, recreational fishing, marine wildlife watching, general beach recreation and tourism, and cruise tourism. To varying degrees these activities contribute to physical disturbance, physical damage, and physical loss. Furthermore, some contribute to pollution through contamination by hazardous substances, marine litter, underwater noise, nutrient and organic matter enrichment. Also, some activities contribute to biological disturbance through the introduction of invasive species.
Measures
Currently, OSPAR has no direct measures addressing the pressures and impacts exerted by recreation and tourism per se but has many initiatives which can be indirectly linked to it (e.g., marine litter action plans). As most OSPAR Contracting Parties are also Member States of the European Union, EU legislation was also addressed. The most relevant EU measures, which can be directly or indirectly linked to the recreation and tourism sector are the Marine Strategy Framework Directive (Directive 2008/56/EC) , The Habitats Directive (Council Directive 92/43/EEC) , Bathing Water Directive (Council Directive Directive 2006/7/EC) , Urban Waste Water Directive (Council Directive 91/271/EEC), Marine Spatial Planning Directive (Council Directive 2014/89/EU) . Also, certain key measures from the Single Use Plastic Directive (Council Directive 2019/904) which came into force in 2021, contribute to the efforts to reduce marine litter.
1 - Context
This assessment of tourism and recreational activities has been prepared by the Netherlands in its capacity as a Contracting Party of the OSPAR Convention. It is a contribution to the series of assessments of human activities under OSPAR’s Joint Assessment and Monitoring Programme (JAMP b14). As such, this assessment provides the basis for a feeder report on tourism and recreational activities contributing to OSPAR’s Quality Status Report 2023 and an OSPAR publication.
The first purpose is to assess the extent, intensity, and changes within the activity. Secondly, the effect of the activity – in terms of pressures and impacts - on the marine environment is described. This assessment will then enable OSPAR to take a view on whether further action is required and, if so, whether there is a need for OSPAR measures.
1.1 - OSPAR and the North-East Atlantic
This section will give a brief introduction into OSPAR Maritime Area and its sub-regions. A short overview of the characteristics of each sub-region will be presented. The details on developments on tourism and recreation in each sub-region will be presented in Section 2.3.
The Convention for the Protection of the Marine Environment of the North-East Atlantic (OSPAR), is dedicated to identifying potential threats in the North-East Atlantic Ocean and agrees measures to combat these threats on a collective and national level. It assesses the status of the marine environment based on internationally set goals and commitments by the participating governments. The OSPAR Commission is key in helping governments cooperate on a regional level. OSPAR’s goals are described in their North-East Atlantic Environment Strategy (NEAES), which is divided into 3 themes of clean seas, diverse and healthy seas, and productive and sustainably used seas.
Under OSPAR the North-East Atlantic is subdivided into 5 regional seas, seen in Figure 1. These are:
- Region I: Arctic Waters
- Region II: Greater North Sea
- Region III: Celtic Seas
- Region IV: Bay of Biscay and Iberian Coast
- Region V: Wider Atlantic

Figure 1: The North-East Atlantic; Source: OSPAR Commission 2020
Region I: Arctic Waters
Arctic Waters is the most northerly OSPAR region, characterised by its harsh climate and ice coverage. However, ecosystems of this region are still rich and the very low in population density, resulting in relatively small impacts of human activities. That said, the recreation and tourism industry in this region is growing rapidly (OSPAR Commission, 2020).
Region II: Greater North Sea
The Greater North Sea is surrounded by densely populated, highly industrialised countries and is one of the busiest Maritime Areas, where coastal zones are used intensively for recreation.
It is situated on the continental shelf of north-west Europe and comprises various marine landscapes including fjords, estuaries, sandbanks, bays, or intertidal mudflats. The climate is strongly influenced by the inflow of oceanic water from the Atlantic Ocean and by the large-scale westerly air circulation which frequently contains low pressure systems. Extreme weather conditions have a direct impact on hydrography, which is characterised by water exchange with surrounding ocean areas, and strong tides. Furthermore, the Greater North Sea is rich and complex in biological systems, containing a variety of fish, birds, and marine mammal species (OSPAR Commission, 2020).
Region III: Celtic Sea
The Celtic Seas region contains wide variations in coastal topography, from fjordic sea lochs, to sand dunes, bays, estuaries and numerous sandy beaches. The large range of habitats in the region supports a diverse fish fauna. Although traditional maritime activities, such as fishing, take place in the Celtic Seas, there is also ongoing development of tourism.
The current trend in tourism and recreation towards a diverse range of more individual pursuits (such as angling and surfing) on less developed parts of the coast can result in new pressures on natural habitats and water quality (OSPAR Commission, 2020).
Region IV: Bay of Biscay and Iberian Coast
The Bay of Biscay and the Iberian Coast extends from the coastlines of France, Portugal, and Spain. In this region, remarkable topographic features such as seamounts, banks and submarine canyons can be found. Furthermore, the coastline is highly diversified with estuaries, rias, and wetlands, which all support productive ecosystems.
The climate is strongly influenced by the inflow of oceanic water from the Atlantic Ocean and large storms occur regularly. The coastal strip has an increasingly high population density and one of the main human activities in the region is tourism (OSPAR Commission, 2020).
Region V: Wider Atlantic
Region V represents the deep waters of the North-East Atlantic, where human population in the region is restricted to the Azores Archipelago. Tourism is of considerable importance to the economy of the Azores. The growth of the cruise industry has resulted in a considerable increase in the size of cruise ships crossing the region and also inshore activities like whale-watching have increased (OSPAR Commission, 2020).
1.2 - The Joint Assessment and Monitoring Programme (JAMP) B14
The JAMP B14 project is a project aiming to conduct a thematic assessment of human activities causing pressures on the marine environment. The objective is to assess the extent and intensity of human activities, and their socio-economic drivers, contributing to the key pressures on the marine environment in the OSPAR Maritime Area. The foreseen output is a description of human activities with significant marine effects per OSPAR region, presenting information on scale and distribution of activity, economic value, trends, and measures to reduce potential impacts.
Next to human activities like the extraction of living resources and transport, tourism and leisure activities was identified as an activity with potential impacts on the marine environment.
Maritime activities are important for the economies of the OSPAR Contracting Parties in terms of Gross Value Added and employment. However, the consequences of these activities for the marine ecosystem can lead to direct costs for society, like loss in revenue from the tourism industry or the degradation of cultural heritage. On the other hand, many activities directly depend on the good condition of marine waters.
1.3 - Recreation and Tourism in the OSPAR Maritime Area
In 2018, Europe accounted for a 51% global share in international tourist arrivals, making it the world's most popular destination for tourists (World Tourism Organization, 2019). In the same year, half of the European tourist accommodation establishments were located in coastal areas (European Commission, 2020). Furthermore, in coastal areas tourism and recreational activities are growing substantially faster than other human activities (ECORYS, 2013). It was expected that tourism would grow further in 2020, however, the COVID-19 outbreak in Europe has put this industry under severe pressure. On one hand there are fewer bookings for tourism services, whereas on the other also “the industry is flooded with claims for refunds on cancellations and the non-performance of services” (European Commission, 2020, S. 105). Even though the European Commission and Member States are trying to mitigate the effects, the eventual economic impact remains to be seen.
Recreation and tourist activities fall under the category of human activities relevant for coastal areas. Tourism, as defined by the World Tourism Organization, is “a social, cultural and economic phenomenon which entails the movement of people to countries or places outside their usual environment for personal or business/professional purposes (...)”(World Tourism Organisation, 2020). According to International Recommendations for Tourism Statistics by the United Nations, a visitor “is a traveller taking a trip to a main destination outside his/her usual environment, for less than a year, for any main purpose (…) other than to be employed by a resident entity in the country or place visited. These trips taken by visitors qualify as tourism trips. Tourism refers to the activity of visitors” (United Nations, 2008, S. 10). Furthermore, “[a] visitor (…) is classified as a tourist (or overnight visitor) if his/her trip includes an overnight stay, or as a same-day visitor (or excursionist) otherwise (United Nations, 2008, S. 10).
Coastal tourism includes the full range of tourism that takes place in coastal zones and coastal waters, including the supporting infrastructure. When we consider ocean-based tourism like yacht cruising we can speak of maritime tourism, which is a closely related concept (Miller & Auyong, 1991). Another definition for coastal and maritime tourism, given by ECORYS, is as the following:
“Maritime tourism covers tourism that is largely water-based rather than land-based (…) but includes the operation of landside facilities, manufacturing of equipment, and services necessary for this segment of tourism.
Coastal tourism covers beach-based recreation and tourism (…), and non-beach related land-based tourism in the coastal area (…), as well as the supplies and manufacturing industries associated to these activities.“ (ECORYS, 2013, S. 12).
Generally, most economic activities taking place at sea are not yet fully in line with the different nomenclatures. This applies also to the recreation and tourism sector on and along the North-East Atlantic. Since it is no standard economic sector according to the definitions and categorisations used by the statistic offices, it is difficult to arrive at an OSPAR comprehensive analysis of the economic importance on and along the North-East Atlantic on the basis of the available information.
| By location | Coastal tourism | Covers tourism in the coastal area as well as the supplies and manufacturing industries associated to these activities. |
| Maritime Tourism | Covers tourism in the Maritime Area. | |
| By subsector | Beach-based | Covers beach-based recreation and tourism (e.g., sun bathing, walking in the beach, kite competitions, etc.), and non-beach related land-based tourism in the coastal area (all other tourism and recreation activities that take place in the coastal area for which the proximity of the sea is a condition), as well as the supplies and manufacturing industries associated to these activities. |
| Water-based | Covers tourism that is largely water-based rather than land-based (e.g., swimming, canoeing, surfing, windsurfing, sport fishing, diving, snorkelling, underwater cultural heritage, whale watching, seabirds watching, boating, yachting, nautical sports, etc.), but also includes the operation of landside facilities, manufacturing of equipment, and services necessary for this segment of tourism. |
1.4 - Aim of the report
The aim of the report is threefold: First, it aims to provide an overview of the current trends of recreation and tourism on and along the North-East Atlantic Ocean to get an overview of the scope of this human activity. Secondly, various activities taking place in the OSPAR contracting parties are described. This description directly gives the basis for the third point, where environmental pressures and impacts are assessed.
2 - Trends, Distribution and overall Intensity
In the first part of this section general trends and drivers relevant for the recreation and tourism sector will be outlined. Then, trends and drivers for each OSPAR Region will be described in more detail.
2.1 - Economic Value and General Trends of Recreation and Tourism in OSPAR
This section aims to summarise the economic value of the recreation and tourism sector for the whole OSPAR Maritime Area. First, tourist arrivals per sub-region and temporal developments are visualised. Secondly, it was intended to find data on GVA and FTE per OSPAR-Contracting Party, in line with the OSPAR Intermediate Assessment 2017. Furthermore, there is a section included on the valuation of Ecosystem Services applied to certain cases, to illustrate economic importance of an ecosystem in non-conventional terms.

Figure 2: Percentage share of arrivals at tourist accommodation establishments by NUTS2 for each OSPAR Region in 2018; Note: this graph does not include France, as there was too much missing data; Source: Eurostat, 2020
Almost half of all the arrivals in tourist accommodation establishments were within Region II, the Greater North Sea, making it the most popular destination within OSPARs Maritime Area. With 27% of all the arrivals, Region IV – the Bay of Biscay and the Iberian Coast - accommodates the second largest amount. Even though at the beginning of the decade Region III (Celtic Seas) experienced growth within the tourism sector, it slightly declined again till 2018. The share of arrivals at tourist accommodation establishments is relatively small for Region I (Arctic Waters) with 6% and Region V (Wider Atlantic) with less than 1% when compared to the other regions.

Figure 3: Arrivals in tourist accommodations establishments in OSPAR Regions 2010-2018, Source: Eurostat, 2020
In economic terms, it was intended to find numbers on GVA1 and Employment, preferably in FTE. What should be noted here is that the contracting parties did not calculate these numbers in the same way, therefore these numbers should be treated with caution. Furthermore, for some contracting parties regional information was found, whereas for others only national numbers could be found. This makes it difficult to fully assess the economic importance of recreation and tourism solely for OSPAR-relevant regions. Furthermore, as the infrastructure for coastal tourism is directly linked to other sectors like construction or port management, it is difficult to estimate GVA and employment numbers (EEA, 2019). In Table 2, the most recent numbers on GVA and employment found are included. As these are absolute numbers, for comparison the length of the coastline from the Contracting Parties was added as well.
| Country/Region | Km of coastline | GVA | Employment | Year(s) of reference | Reference |
|---|---|---|---|---|---|
| Belgium | 98 | € 335,814 million € | 27,000 FTE | 2007, 2013 | (Belgische Staat, 2018) |
| Denmark | 4.605 (Baltic and North Sea) | DKK 16,491 (Approx. € 2,215) | 32,537 FTE | - | Nielsen, Zhang, & Javakhishvili-Larsen, 2019 |
| Ireland | 4.577 | € 558 million | 16,000 FTE | 2018 | Hynes, Aymelek, Corless, & Evers, 2018 |
| UK | 17.381 | Approx. £4,5 billion (€ 5,49 billion) | Approx. 200 000 | 2016, 2012 | (Coastal Communities Fund, 2016) (Beatty, Fothergill, & Gore, 2014) |
| Wales | - | £ 24.5 million (€ 29,90 million) | N/A | - | Chambers, 2013 |
| Portugal | 1.187 | 1,660 | 45,950 | 2010-2013 | INE, 2016 |
| Netherlands | 1.275 | € 2,654 million | 30,000 FTE | 2010, 2014 | Statistics Netherlands, 2016 |
| Zeeland | - | N/A | Approx. 8,900 FTE | - | Kenniscentrum Kusttoerisme, 2018 |
| Norway (municipalities by the ocean) | 28.953 (without islands) | NOK 45,4 billion (€ 4,88 billion | 88,400 | 2016 | Statistics Norway |
| The North Sea-Skagerrak | - | NOK 14,2 billion (€ 1,53 billion) | 21,100 | 2016 | Statistics Norway |
| The Norwegian Sea | - | NOK 4,0 billion (€ 0,43 billion) | 7,100 | 2016 | Statistics Norway |
| The Barents Sea and Lofoten | - | NOK 3,7 billion (€ 0,40 billion) | 6,100 | 2016 | Statistics Norway |
| France: Eastern Channel North Sea Basin | 1.022 | N/A | 23% of all coastal tourism jobs located here | 2013 | Direction interregionale de la Mer, 2019 |
| France: North Atlantic Western Channel Sea Basin | 2.700 | N/A | 40,458 jobs depending on coastal tourism | 2012 | Ministère de la Transition écologique et solidaire, 2019 |
| France: South Atlantic Sea Basin | 720 | N/A | 29,400 jobs in tourism (representing 60% of the maritime economy) | - | Direction interrégionale de la mer Sud-Atlantique, 2019 |
| Spain | - | 51,351.6 Mi € in Total Spain, around 22% in Spanish Atlantic Arc | 900,000 total Spain; around 22% in Spanish Atlantic Arc | 2009 -2011 | Fernandez-Macho, et al., 2015 |
| Sweden | 13.500 (Baltic and North Sea) | SEK 95.1 billion | 165 400 | 2015 | Swedish Agency for Economic and Regional Growth, 2016 |
| Germany: Schleswig-Holstein | total German North Sea coast: 1.515 | Gross revenue: € 9,5 billion | 89.266 (in hospitality) | 2018 | (Tourismusverband Schelswig-Holstein, 2019) |
| Germany: Lower Saxony | € 8.1 billion | 226.000 direct employees | 2018 | (Niedersächsisches Ministerium für Wirtschaft, Arbeit und Verkehr, 2017) | |
| Iceland | 4.970 | N/A | N/A | - | - |
1The data on gross value added in the various tables are presented in euros. For Norway and UK both the euro figures and (between brackets) the original values are presented. For the conversion from original data to euros, the Eurostat exchange rates for annual data were used: http://appsso.eurostat.ec.europa.eu/nui/show.do
2.1.1 - Valuation as Ecosystem Service
One of OSPAR’s principles is the ecosystem approach, where an ecosystem is seen as a biological community of interacting organisms and their physical environments. Ecosystem service can be defined as “benefits people derive from ecosystems”, where one can distinguish between provisioning, regulating or cultural services. Cultural services are seen as non-material benefits relating to cultural and amenity services, such as recreation and tourism (Millennium Ecosystem Assessment Board, 2005). Tourism and recreation can be defined as a cultural service derived by an ecosystem. This approach can signal scarcity and quality of ecosystems, and can help policy makers to assess trade-offs and synergies. Furthermore, it can help in coastal management and can increase social efficiency of decision-making processes (Horlings, et al., 2020).
The Netherlands. Horlings, et al. (2020) conducted an experimental monetary valuation of ecosystem services and assets in the Netherlands. For this, they used the System of Environmental Economic Accounting – Experimental Ecosystem Accounting, which was developed by the UN, et al. (2014). Coastal dunes and beaches in the Netherlands were the types of ecosystems with the highest values per hectare: the coastal areas of Zeeland, Zuid-Holland and Noord-Holland as well as the Wadden Islands (Horlings, et al., 2020).
Spain. For Cadiz in South-West Spain, a case study on coastal management by Alves and colleagues (2017) was conducted by using a social benefit analysis deriving from coastal ecosystems. The study applied the Travel Cost Method (a revealed preferences method) to assess the non-market value or three Atlantic beaches in Cadiz, located in the South-West of Spain. The beaches assessed had different characteristics, namely a small artificial urban beach, an urban beach, and a semi-natural beach.
The artificial urban beach experiences severe erosion, which makes regular investments necessary. On the other hand, the semi-natural beach had really low investments, but as it is semi-natural, the system naturally adjusts through its dynamics. The study showed that the management strategy costs are far lower than user’s valuation, which in turn means that investments made by local coastal managers are economically justified. Still, one has to take into account which type of visitors go to which beach. For example, the semi-natural beach would require investments into the conservation of its natural assets, as people go there for these.
The study concluded that further investments are critical, if Cadiz would like to continue to attract beach visitors to the sites and thereby maintaining or increasing the city’s income from tourism and beach use (Alvas, Ballester, Rigall-I-Torrent, Ferreira, & Benavente, 2017). These findings show that non-market economic values (e.g., consumer surplus) are important components of the economic value, as they can represent the quality of life and leisure satisfaction rather than solely the on-site expenditure.
In general, revealed preferences methods help to infer economic values from observed behaviour, are suited for the valuation of natural parks, are relatively cheap and quick to implement. However, these methods do not allow the assessment of income and jobs generated by the tourism and recreation sector and tends to overestimate the visitor’s willingness to pay (WTP) for sites.
Norway. On behalf of the Norwegian Environmental Agency, the economic value of ecosystem services in case of the Oslofjord were estimated given rough assumptions regarding the use of the fjord and the related values. The Oslofjord is located in the South of Norway and is the most visited Norwegian fjord. Based on the current data they found, outdoor recreation activities were the most valuable ecosystem service among the services they quantified. The recreational value along the Oslofjord for walking along the beach and coast, boating and swimming in the sea is estimated at 25.7 billion NOK annually when using the hourly alternative cost for working (median wage net taxes). An annual cost of about 2.7 billion NOK are spent on municipal waste water treatment, illustrating the minimum willingness to pay by the society to achieve good sanitary conditions. The estimated WTP for waste water treatment along the Oslofjord – that ensures outdoor recreational activities – is estimated at 4.3 NOK/year. Considering the operational and capital costs for recreational boating is 2.6. billion NOK/year, this confirms the large WTP to access leisure activities in the fjord (NIVA, NINA, Menon Economics, SSB, 2019).
2.2 - Global Trends and Uncertainties
To be able to prepare an adequate strategy for the future of coastal and maritime tourism, one has to be aware of the main trends which directly or indirectly influence the recreation and tourism sector. In 2016, the European Commission published a report on challenges for a sustainable development of coastal and maritime tourism in Europe, where they also identified the key exogenous trends for this sector. The main factors are summarised in Table 4 together with its implications for the coastal and maritime tourism industry (European Commission, 2016).
| Exogenous Trend | Implication for Coastal and Maritime Tourism |
|---|---|
| Changes in demand patterns through time | More frequent but shorter trips throughout the year. This trend affected the coastal and maritime sector through a decline in total expenditure per visit. |
| An ageing society and evolutions in spending capacity | Between 1994-2014, individuals over 60 doubled globally and this trend is expected to continue till 2030; and this population group will remain important till 2050 (United Nations, 2014). This will require new services but also reduce seasonality (elderly often go to coastal regions in winter season). |
| An increase in ‘sustainable’ awareness and search for quality | Growing interest in ‘authentic experiences’; interest in experiencing local cultural, social and environmental characteristics while avoiding negative externalities. |
| Geopolitical threats raising safety concerns | Geopolitical tensions and south-north inequalities in coastal/island destinations in the Mediterranean (e.g., high number of refugees in Greece) and safety concerns in other parts of the world (e.g., zika virus in South Amerika) could have positive effects on other, ‘safer’ destinations within the EU. |
| Climate change and consequences for coastlines and islands | Increase of sea water levels, beach erosion, precipitation changes and weather instability could affect the sectors performance. Coastal regions are especially vulnerable, whereas northern coastal regions are less vulnerable than compared to southern ones. |
In early 2020, the COVID-19 pandemic reached Europe. As a result of the lockdown, the economy contracted rapidly. Although hard interventions on social life had taken place at the beginning of the crisis, restrictions gradually eased around May and June in various European countries. However, various industries, including catering, culture, sports, and travel were greatly limited in their activities in the second half of 2020. In the latest Blue Economy Report a preliminary assessment of the impact of the COVID-19 economic crisis on the Blue Economy was included, where the impact on coastal tourism is expected to be: “Very Large” in size, “Strong” in initial impact and “Very Lagged” in its recovery path. Especially coastal communities which are mainly composed of SMEs and micro-enterprises are vulnerable to economic, financial and political changes like this (European Commission, 2020). Therefore, it is at this moment hard to predict the total impact of the COVID-19 crisis on the tourism industry for the upcoming years. A report created before the crisis, however, expects coastal tourism to increase employment and GVA within the blue economy.
2.3 - Trends per Region
2.3.1 - Trends in Region I
The Arctic Waters
The most northerly OSPAR region is characterised by a cold climate and ice coverage. Even though this region is low in population density, the recreation and tourism sector is growing rapidly. Some communities take advantage of this trend and switch from traditional activities (e.g., fisheries) to new industry practices like whale-watching. There is an increasing interest for the ‘unspoiled’ nature in this region. Due to the warming climate, the tourism product is also sometimes sold as ‘last chance tourism’. To get the full potential, regions have to invest in proper infrastructure, but also have to face new challenges induced by climate change (e.g., permafrost melting).
Among all the visitors to the Arctic, tourists represent the largest group, next to a small number of researchers. Both cruise tours or more rustic “expedition” boats are operating in the Arctic waters. Also, often tourists come by plane to the coasts and island hubs and then roam around from there (Atkisson, Arnbom, Tesar, & Christensen, 2018).
Coastal Norway and Iceland experienced a rapid growth in cruise tourism in the years 2004-2014. Furthermore, the overnight stays by tourists increased strongly between 2000-2014, with coastal Norway having a plus of 286% and Iceland a plus of 34%. Svalbard, which belongs to Norway, also shows tremendous growth with a plus of 116% within the same time frame (Atkisson, Arnbom, Tesar, & Christensen, 2018). Iceland, however, suffered in 2019 from a record decline in arrivals, as a consequence of the low-cost airline Wow Air insolvency (European Travel Commission, 2019).
Industry practices in the Arctic waters are changing, as for instance some local communities are switching from the dependence on fisheries to the whale-watching industry. For example, Húsavík in Iceland used to be a fishing community but grew into one of the main whale-watching spots in Iceland (Einarsson, 2009) (Einarsson, 2011).

Figure 4: Trends in Artic Tourism; Source: Statistics Iceland, Statistics Norway via Atkisson, Arnbom, Tesar, & Christensen, 2018
The growth of both cruise tourism passengers and overnight stays by tourist happened first of all due to better accessibility of Arctic waters, but also because people are increasingly interested in the unique and relatively unspoilt nature. If well-planned and with proper tourism and infrastructure regulations in place, this could pose an opportunity to spread awareness about its intrinsic value of the Arctic and at the same time have economic development. Like this, the tourism industry in the Arctic waters can build a long-term economic basis while also preserving the resilience of ecosystems (Atkisson, Arnbom, Tesar, & Christensen, 2018).
To give more regional illustration: in the case of the Barents Sea and the Lofoten, Statistics Norway estimated the GVA and employment rates in the tourism sector. Comparing numbers from 2010 and 2016, there can be a strong increase observed within the tourism sector for this region (Faglig Forum, 2019b).
| Gross value added in the tourism sector | Employment in the tourism sector | |||||||
|---|---|---|---|---|---|---|---|---|
| 2010 | 2016 | 2010 | 2016 | |||||
| Billion NOK | % of Norway | Billion NOK | % of Norway | Employment | % of Norway | Employment | % of Norway | |
| Norway (all municipalities) | 32,2 | 45,4 | 74.200 | 88.400 | ||||
| The Barents Sea and Lofoten | 2,4 | 8% | 3,7 | 8% | 4.800 | 7% | 6.100 | 7% |
| The Norwegian Sea | 2,5 | 8% | 4 | 9% | 4.800 | 7% | 7.100 | 8% |
As the unique landscapes of the Arctic could potentially be strongly altered due to climate change, some tourists want to visit the area ‘before it’s lost’. In this context, tourist operators sell the experience in the Arctic as ‘last-chance tourism’. Polar bears are threatened by the steady decrease of sea ice and are an ‘iconic symbol’ of climate change and are therefore a typical example of last-chance tourism (Lemelin, 2005). In Svalbard, polar bears are protected by law, meaning that there is nothing like ‘polar bear safaris’ or similar activities possible in Svalbard. However, tourists can still spot them coincidentally during other activities (Visit Svalbard, 2020).
Another consequence of climate change in the Arctic are the expected increased shipping activities. The decrease of ice makes it possible that ships can use the Northern Sea Route, instead of the conventional route via the Suez Canal and Strait of Malacca (Lee & Song, 2014) (Zhang, Meng, & Ng, 2016). If increased shipping activities could interfere with the recreation sector in the Arctic is still unknown.
To sustain economic development, and therefore tourism activities, there is a need for investments in proper infrastructure for meeting basic needs. However, the impacts of climate change could pose some difficulties, as melting permafrost and coastal erosion may damage infrastructure (Berner, Symon, Arris, & Heal, 2005) (AMAP, 2011).
2.3.2 - Trends in Region II
The Greater North Sea
The Greater North Sea is surrounded by densely populated, highly industrialised countries and is one of the busiest maritime areas, where coastal zones are used intensively for recreation. In absolute terms, this region had the most tourist arrivals in the whole OSPAR Maritime Area.
Overall, there is an increasing growth within the recreation and tourism sector, which differs at regional and local levels. Many of the contracting parties observe a trend towards shorter, but more frequent vacations among visitors. Also, the sector of day-tourism is growing strongly and wellness tourism on the coast is gaining more popularity.
As some parts of this area are greatly urbanized, it is easily accessible, making it convenient to visit for recreation and tourism, as for example places in the Netherlands (Komossa, van der Zanden, Schulp, & Verburg, 2018)
Belgium
The Belgian coast offers on one hand housing, restaurants, shops, attractions, and museums, and on the other also ‘soft recreation’ opportunities, like walking, mountain biking and cycling, golf, and water sport facilities. In 2016, Belgium had 30 million overnight-stays and 17,6 million day-visitors (Westtoer apb, 2017). The Belgian tourism industry requires extensive infrastructure and is one of the key influences on urbanisation and infrastructure in the coastal areas. For example, Nieuwpoort - a marina - has been built, which can accommodate about 2.000 boats, making it the largest marina in Northern Europe. The Belgium State identified economic growth, sustainability trends, trends in nutrition and health, technological innovation (smart mobility, ICT) and climate change as the main drivers which influence tourism in Belgium (Belgische Staat, 2018).
Next to general recreational and tourism activities, recreational fishing made up a considerable part, where in 2016 a total of 806 recreational fishing boats are estimated. 90% of these boats have a berth in Nieuwpoort. It is estimated that these vessels together take approximately 9.500 fishing trips per year, adding up to 100.000 fishing hours at an individual level (Belgische Staat, 2018). The total kept catch is approximately 212.6 tons, with the three main species being shrimp, whiting and cod. All catches together represent 1% of the total recreational and commercial Belgium supply (Verleye & van Winsen, 2016).
For recreational activities there are no permit conditions in Belgium, however, appropriate assessments are required for recreational activities (e.g., sports) that may affect Natura 2000 sites. Furthermore, government policy costs associated with recreation are improvements and monitoring of marine conservation areas related to recreational activities and campaigns raising awareness about marine litter. In addition to that, coastal municipalities organise cleaning actions for their beaches during summer months. Moreover, to raise awareness for cleaner beaches, coastal municipalities sometimes organise workshops, educational games, exhibitions or workshops (Belgische Staat, 2018).
Denmark
In general, Denmark’s coastal and maritime tourism follows the growth trend of coastal and maritime tourism in the EU. The EU’s Blue Growth strategy identified the coastal and maritime tourism sector as a potential sector for growth. Therefore, in the future this sector may gain even increased importance due to regional and socioeconomic effects of coastal and maritime tourism (Nielsen, Zhang, & Javakhishvili-Larsen, 2019).
In Denmark, the coastal and maritime tourism sector makes up a large share of tourism revenue, namely 37%, giving it a significant regional and socioeconomic importance for Danish local economy (Nielsen, Zhang, & Javakhishvili-Larsen, 2019).
For a spatial representation of the tourist point of view, demand-side data was used for analysing coastal and maritime activities (Figure 5, a) and b)). Whereas domestic tourists tend to holiday in areas located at northern Zealand, Lolland-Falster and western coast of Jutland, foreign tourists mostly visit the west coast of Jutland. One possible explanation is that the west coast is more accessible accessible for foreign tourists travelling by car. However, a large share of tourists like to visit popular cottage areas (e.g. northern Zealand), the western coast of Jutland and Lolland-Falster (Nielsen, Zhang, & Javakhishvili-Larsen, 2019).
 Share domestic tourism; b) Share foreign tourism; c) total employment effects (% of total employment effect as a share of the total workforce in a municipality); d) The total value added effects (% of total GVA effects as a share of the total GVA created in the municipality) (Nielsen, Zhang, & Javakhishvili-Larsen, 2019)")
Figure 5: Regional economic effect of coastal and maritime tourism in Denmark per municipality; a) Share domestic tourism; b) Share foreign tourism; c) total employment effects (% of total employment effect as a share of the total workforce in a municipality); d) The total value added effects (% of total GVA effects as a share of the total GVA created in the municipality) (Nielsen, Zhang, & Javakhishvili-Larsen, 2019)
Remote coastal municipalities and islands show the highest employment-effect through coastal and maritime tourism. In total, the coastal and maritime tourism sector creates 32 537 FTE. In terms of GVA, peripheral coastal municipalities of west and north Jutland and north Zealand show a relatively high amount. In total, the coastal and maritime tourism sector creates DKK 16,491 million GVA (Nielsen, Zhang, & Javakhishvili-Larsen, 2019).
France
The French part in the Greater North Sea is the East Channel-North Sea basin and has a coastline of 122 km. On the coastlines of the Normandy and Hauts-de France - besides industrial port activities and fish production - a lot of cultural and recreational activities take place. Coastal municipalities in this area are highly popular to live in when compared to inland municipalities (Ministère de la Transition écologique, 2019). In addition to the rich cultural and historical heritage, a variety of sites and natural landscapes along the coast attract a lot of visitors, which makes tourism an important economic activity for the Eastern Channel-North Sea basin. In 2011, the region comprised 23% of all jobs in the coastal tourism sector and 9% of jobs in tourism at national level. Natural characteristics of tourist sites seem to have a strong link with tourism, as municipalities with protected areas show a high ratio of tourist accommodation capacity to their permanent population (Ministère de la Transition écologique, 2019).
The Eastern Channel-North Sea coastline comprises 11% of all sea bathing areas in France (excluding French islands), where the areas Manche and Calvados account for more than half of documented bathing areas. Furthermore, 7% of all Blue Flag beaches in France are located along this coastal area. Not only is the beach suitable for bathing activities, but also important for economic activities taking place by public and private actors. However, due to pollution (mostly through agriculture), waste waters and bilge waters, some beaches had to be closed for the beach season in 2018 (Ministère de la Transition écologique, 2019).
Next to the coasts, the sea itself can offer various tourist activities, ranging from water sports and leisure activities close to the coast to activities at the open sea. Both close to shore and open sea tourist activities are important for the regional economic development. Even though it is less frequent compared to other coastal France, recreational boating is a popular activity. The Normandy and Hauts-de-France account for 36 marinas, most of them located in Manche, Calvados and Seine-Maritime. From sailors in mainland France, 23% percent are based in the Eastern Channel-North Sea coastal area, which means a decrease of 17% between 2009-2014. In the same time frame, underwater sports showed a 5% increase. In general, there is an estimation of 680.000 sea activity enthusiasts in the Normandy and Hauts-de-France, where sailing, dinghies and windsurfing activities are most popular. Next to water sports and beach tourism, recreational fishing (especially seafood gathering) is a popular activity in the Eastern Channel-North Sea coastal area, where recreational coastal fishers represent an added value of approximately 86 million euros. However, it is difficult to grasp the activity better; on one hand because there is no need for a fishing licence and on the other hand fishers are highly ‘mobile, diverse and dispersed’ (Ministère de la Transition écologique, 2019)
Coastal tourism on the coasts contributes to microbial pathogens and marine pollution and it is still difficult to exactly characterise this contribution. However, it is possible to refer to a tourist function rate, which is a tourist pressure indicator used by the Ministry for the Ecological and Inclusive Transition of France. In this case, the indicator shows the level of touristic frequentation, which should not be surpassed in order not to risk the environmental sustainability of a certain area. In Figure 6, this capacity of intake an area can have is explored by studying the variation of population induced by tourism (ratio between tourist accommodation capacity of municipalities and their resident population for the year).
Areas with a low population per year and a high capacity have the highest tourist function rates. Some areas with high tourist density can nevertheless be at the origin of significant pressures without the tourist function rate being high (Ministère de la Transition écologique et solidaire, 2018). Figure 6 gives spatial visualisation of how tourist beds are distributed over the coastal region.
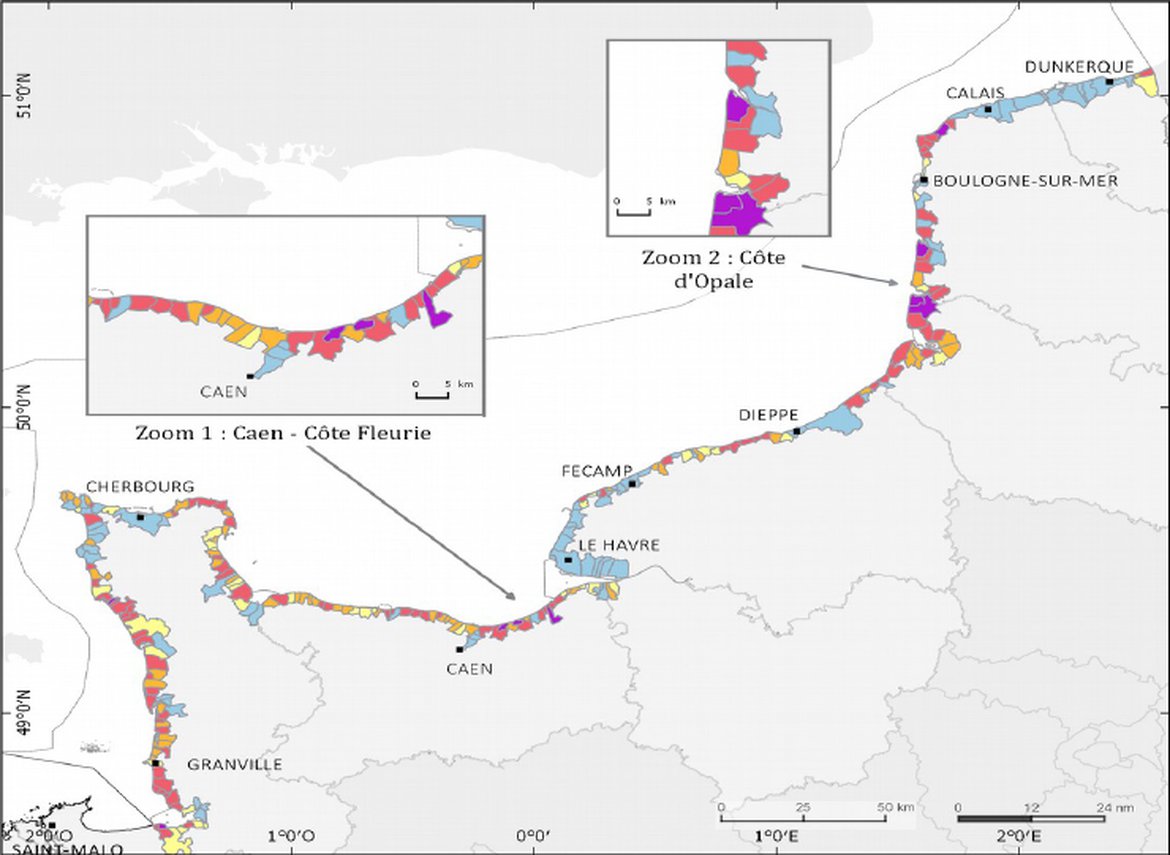
 by coastal municipality in the coastal area (2013) (SOeS; Ministère de l'environnement, de l'énergie et de la mer, en cahrge des relations internationales sur le climat, 2017)")
Figure 6: Rate of tourist function (number of tourist beds per 100 inhabitants) by coastal municipality in the coastal area (2013) (SOeS; Ministère de l'environnement, de l'énergie et de la mer, en cahrge des relations internationales sur le climat, 2017)
Germany
In the region of Lower Saxony (Niedersachsen), tourism is growing steadily in the last 13 years, where 2018 was one of the most successful years for the region. The seaside resorts made up 28,2% of all overnight stays of the region in 2019. Beach visitors, with a plus of 13% and recreational boating, with a plus of 21,3%, are by far the most popular activities since 2013. Especially with the warm summer of 2018 these activities gained popularity (Finanzgruppe Sparkassenverband Niedersachsen, 2019).
The coastal regions of Schleswig-Holstein experienced an increase in visitors and over-night stays of 25% compared to 2013. Also, if compared to inland regions of Schleswig-Holstein, tourist intensity (number of overnight-stays per 1000 inhabitants) is the highest at the North-Sea. This could be an indicator for the economic importance of tourism for the coastal regions. However, in absolute numbers, over-night stays were higher along the Baltic Sea, which is not part of the OSPAR Maritime Area. According to Social Media data referring to the North Sea coast of Schleswig-Holstein online-posts surrounding ‘health and wellness’, ‘culture’, ‘water sport/maritime activities’ and especially ‘cycling’ were topics with a lot positive connotation (Tourismusverband Schelswig-Holstein, 2019). Information gathered through social media could be a useful tool to understand visitor behaviour better.

Figure 7: Development of overnight-stays commercial accomondation establishments in 2018 compared to 2017 in Lower Saxony; Source: Finanzgruppe Sparkassenverband Niedersachsen, 2019

Figure 8: Development of overnight-stays in the hotel industry 2018 compared to 2017 in Schleswig-Holstein; Source: Tourismusverband Schelswig-Holstein, 2019
Similar to other OSPAR countries, Lower Saxony and Schleswig-Holstein experience a trend towards shorter vacation stays, where especially coastal areas and islands show a considerable decrease of longer stays. For 2018, Schleswig-Holstein had 130,4 million day-visitors, accounting for € 3,5 billion turnover (Finanzgruppe Sparkassenverband Niedersachsen, 2019) (Tourismusverband Schelswig-Holstein, 2019).
The natural environment is an important basis for tourism in Germany, and according to a survey, 68% of guests in Schleswig-Holstein want to spend time in nature (FUR, 2014). In this context, Schleswig-Holstein launched its tourism strategy (Tourismusstrategie Schleswig-Holstein 2025), where it wants to foster cooperation between all stakeholders to make tourism more sustainable. This includes the protection of resources and nature and partnerships between nature and environmental organisations. Especially the Wadden Sea is an integral part for German coastal tourism along the North-Sea, where both cultural and nature protection come together. Regarding the Wadden Sea, Germany is in close cooperation with the Netherlands and Denmark (Niedersächsisches Ministerium für Wirtschaft, Arbeit und Verkehr, 2017) (BMU, 2018). Furthermore, some hotels in Lower Saxony took the decision to profoundly reduce their usage of single-use plastic and switch to more environmental-friendly alternatives (Finanzgruppe Sparkassenverband Niedersachsen, 2019).
Netherlands
In the Netherlands, the tourism sector is growing faster than any other economic sector (Heerschap, 2018). In 2015, the Dutch coast welcomed 2,3 million foreign tourists, meaning a 7% increase compared to 2014. Tourist pressure can be measured by the number of over-night stays per day per 100 inhabitants. In the Netherlands, Zeeland receives the highest, namely 7,1 over-night stays per 100 inhabitants, which shows a strong increase compared to 2012 with only 5,8 over-night stays per 100 inhabitants (NRIT Media; Statistics Netherlands, 2016).
According to Statistics Netherlands (2016), the biggest contributors to the Dutch North Sea economy within the tourism industry are expected to be accommodation, food and beverage services, travel agencies, tour operators, sports activities, amusement and recreation activities. All coastal tourism and recreation together are estimated - based on tourism satellite accounts - to create a total GVA of € 2.653 in 2014 and employed 30.000 FTE in 2010. It should be noted, however, that Amsterdam was included in the calculation, therefore these numbers should be considered as a rough estimation, with a bias towards overestimation (Statistics Netherlands, 2016).

Figure 9: Nights spent at tourist accommodation establishments by NUTS2 regions in the Netherlands; Source: Eurostat, 2020
At the Dutch coast, there can be a trend observed towards wellness resorts, especially in Zeeland. It is believed that the sea salt of the North Sea has a healing effect on people, which is also interesting for visitors. However, this sector is not fully developed yet, as it only started about 10-15 years ago. Still, there is the possibility that this sector has the potential to increase in the near future and therefore will contribute to the economic development (Pretwerk, 2020). Furthermore, there is expected to be a rise in sustainable and nature-based tourism, as there is a steady increase in customer awareness and the appreciation of the natural environment. The Dutch coasts offers the preconditions for this kind of development. However, it is unclear to what extent this will contribute to the Dutch economy (ETFI, 2020).
HZ Kenniscentrum Kusttoerisme published a report, in which they assessed inhabitants’ perception on tourism in Zeeland. Even though inhabitants of Zeeland municipalities see tourism as important for the local economy, 5 in 10 inhabitants would say that through tourism there is more litter in their municipality, which has both a negative social and environmental impact. However, a considerable part of the inhabitants would also say that tourism stimulates the protection and conservation of the natural environment in their municipality (IJben, 2019). This demonstrates that tourism could be a way to enhance local economic developments while also preserving the environment.
In the ‘Het Kustpact’, more than sixty boards of the Dutch central governments, provinces, municipalities, water boards and drinking water companies in South Holland, North Holland, Zeeland and Friesland, and various organisations for nature and landscape, recreation and terrain management have made an agreement regarding coastal development. In this agreement parties agreed that new recreational developments, which require space in the coastal zone, are not allowed to damage values such as ‘unobstructed view and large scale’ and ‘naturalness and dynamics’ (Raad vor de leefomgeving en infrastructuur, 2019). This pact should guarantee the protection of the coastal environment, its natural but also cultural landscape (Tweede Kamer, 2017).
Norway
For Norway, the North Sea is the most important region for tourism activities. Similar to the Norwegian Arctic Waters, the North Sea part of Norway experienced similar growth in tourism between 2010 and 2016. Within the tourism sector, the North-Sea-Skagerrak creates 31% of the GVA and 39% of employment (Faglig Forum, 2019b).
| Gross value added in the tourism sector | Employment in the tourism sector | |||||||
|---|---|---|---|---|---|---|---|---|
| 2010 | 2016 | 2010 | 2016 | |||||
| Billion NOK | % of Norway | Billion NOK | % of Norway | Employment | % of Norway | Employment | % of Norway | |
| Norway (all municipalities) | 32,2 | 45,4 | 74.200 | 88.400 | ||||
| The North Sea-Skagerrak | 9,6 | 30% | 14,2 | 31% | 17.100 | 23% | 21.000 | 24% |
Sweden
In 2015, tourism’s share of the Swedish economy was at 2.7%, but was growing steadily in total exports and employment. One of the main drivers for Sweden’s tourism was a strong influx from tourists from abroad. In absolute terms, Västra Götaland received the highest increase in nights spent after Stockholm County, namely by +6,7% between 2014-2015. Also, County Skåne experienced growth of +7,6% within this timeframe. Employment in Sweden is decreasing in many traditional industries, while employment in tourism is rising. Most of these jobs are created in hotels and restaurants. The sub-sector ‘Culture and Recreation’ had the strongest proportional growth (Swedish Agency for Economic and Regional Growth, 2016).
In general, travel behaviour in Sweden has changed, as people are looking for more service, comfort, and sustainability. One of the key success factors identified by the Swedish Agency for Economic and Regional Growth is knowledge in the form of statistics, surveys, indicators, and models to use as a tool for effective tourism development. This knowledge should further feed into urban and regional development (Swedish Agency for Economic and Regional Growth, 2016).

Figure 7: Nights spent per region at hotels, holiday villages, youth hostels, PCAs* and camping sites in 2015 as well as the percentage change from 2014; * Commercially arranged rentals in private cottages and apartments; Source: Swedish Agency for Economic and Growth/Statistics Sweden
The United Kingdom
In the UK, according to the National Coastal Tourism Academy, there is a growth observed in families visiting the seaside, so persons between 16-54 with children. Furthermore, they discovered an opportunity regarding ‘empty nesters’, so people over 55 without children. This group of people are especially relevant for off-peak season, as they pose a key opportunity for growth in this sector. However, there was a decreasing trend of visitors in the months of June and September (NCTA, 2016).
In general, similar to other OSPAR contracting parties, the population of the UK is projected to increase, whereas it also has an ageing population. In 2018, there were 1.6 million people aged 85 or older, and it is projected that by 2043 this number will double to 3.0 million (Office for National Statistics, 2019). This population change likely will also affect the recreation sector in the UK.

Figure 10: Percentage of Seaside Trips Taken; Source: 2014 GBTS via NCTA, 2016
In England, marine and coastal environments attract a considerable number of recreational visits annually. A study by Elliot et al. (2018) found that approximately 271 million visits were made to coastal environments in England each year. The most popular activity being walking, followed by eating or drinking out or visiting attractions. Furthermore, almost 60 million instances of water-based recreation were undertaken, like swimming or water sports. The study also found that coastal recreational walking was more likely to be undertaken by females, older adults, and individuals from a lower socioeconomic classification (Elliott, et al., 2018). These findings suggest that the coast may could help in reducing activity inequalities.
In 2015, LUC conducted the Scottish Marine Recreation and Tourism Survey, which was designed to gather information about recreation and tourism activities at sea and around the Scottish coastline. The survey addressed visitors, but also business operating on the coast.
The three most popular activity at sea or along the Scottish coastline was general marine and coastal recreation, followed by sailing cruises (including dinghy cruising) and walking along coast. Figure 11 visualises the spread of recreation and tourism activities, where one can see for example an intensive usage walking paths alongside the east coast. The most influencing factors where people go was the suitability of a location for certain recreation and tourism activities, the presence of an attractive scenery and the option of sighting wildlife. Secondly, the presence of cultural heritage, food and drink service possibilities had influence on the choice where people recreate. The availability of accommodation had a minor role, which maybe is due to the fact that most people visiting the Scottish coast undertook day trips (LUC, 2016).
In the case of Scotland, elderly people tend to prefer less physically strenuous activities, like taking a walk, compared to younger people who prefer more sporty activities, like cycling or running. The increase of elderly people combined with the trend for shorter visits taken, will likely have a significant impact on the recreation industry (Wilson & Seddon, 2018).
In the next five years, almost half of the businesses operating at the coast expect their turnover to increase; some indicated even major increase. Especially businesses running excursions, providing equipment or training were the most optimistic. Furthermore, the survey showed that the most optimistic businesses were those serving bird or wildlife watching, general recreation, canoeing, kayaking, and sailing or powered boating (LUC, 2016). Another study conducted by Scottish Natural Heritage, investigated how people living in Scotland use, value and enjoy the Scottish natural environment. Among the respondents, 11% of them took visits to the seaside, where they identified picnicking, sightseeing and wildlife watching as most popular activities. Whereas wildlife areas increased in popularity compared to 2013/2014, visits to beach locations decreased by 5% (from 18% to 13%) (Wilson & Seddon, 2018).

Figure 11: Recreation Intensity in Scotland; Source: LUC, 2016
2.3.3 - Trends in Region III
The Celtic Seas
The Celtic Seas region contains wide variations in coastal topography. Even though this area is more known for traditional maritime activities like fisheries, there is an ongoing development of tourism.
Both for regions at the French Celtic Sea and in Ireland the tourism sector makes up a considerable part of their economies. Initiatives like the ‘Wild Atlantic Way’ in Ireland are stimulating recreation and tourism along the coasts and makes visitors engage with its environment. However, it is uncertain how the upcoming Brexit will affect the Irish recreation and tourism industry.
France
Coastal tourism in the French Celtic Sea employed a total of 29 000 people in 2011. This represents 6% of all the tourism workforce of all coastal regions in France and employs 2% of the total tourism sector at a national level. In 2013, total number of nights spent in the coastal accommodations in the French Celtic Sea counted 8.7 million, which represents a 5% increase compared to 2008. The tourist accommodation capacity of coastal municipalities in the French Celtic Sea counts approximately 721 000 beds, which accounts for about 10% of the supply on mainland France in 2013. However, as in other marine sub-regions, a big share of the accommodation is offered non-market (Ministère de la Transition écologique et solidaire, 2018).
The Ministry for the Ecological and Inclusive Transition of France uses a tourist function rate to get a tourist pressure indicator. Figure 12 gives spatial visualisation of how tourist beds are distributed over the coastal region.
 by coastal municipality in the coastal area; Source: (Ministère de la Transition écologique et solidaire, 2018")
Figure 12: Rate of tourist function (number of tourist beds per 100 inhabitants) by coastal municipality in the coastal area; Source: (Ministère de la Transition écologique et solidaire, 2018

Figure 13: Marine and coastal tourism activities at county level; Source: SEMRU, 2018
Ireland
According to the Fáilte Ireland statistics, there were almost 8.0 million overseas visitors to Ireland in 2018, where 76% are estimated to have visited the coasts and 61% participated in marine related activities. In 2018, overseas tourists spend an estimated € 1.94 billion, which is almost 40% of the total expenditure of overseas tourists in Ireland. Notably, one third of coastal-related spending were on marine related activities. County Kerry, County Galway and County Clare were the leading counties for coastal and marine tourism activities, see Figure 13.
Ireland has a 7,700 km of coastland and access to marine waters. Water-based tourism activities like sea angling, all kinds of surfing, sailing are all experiencing an increasing popularity (Hynes, Aymelek, Corless, & Evers, 2018). According to a survey from Fáilte Ireland, surfing and canoeing were the most popular activities in 2013, but also recreational fishers were one of the key user groups (Fáilte Ireland, 2013). Furthermore, cruise tourism also shows considerable increase, namely 30% between 2017-2018 (Hynes, Aymelek, Corless, & Evers, 2018).
SEMRU states that initiatives like the Wild Atlantic Way (WAW) have been successful in communicating Ireland’s geographical position along the Atlantic Ocean as it helped visitors to engage with the sea and understand how it shapes the coastal communities in Ireland (Hynes, Aymelek, Corless, & Evers, 2018).
If one looks back at Figure 3, which was shown at the beginning of this chapter, one can see that in recent years tourism in Region III was rather stable compared to the other regions. One of the reasons this might happened is due the “decline of value of Sterling”, which made trips more expensive to British travellers. Furthermore, Brexit creates big uncertainties (Finn, 2017). As Ireland’s largest overseas market is the UK, a survey by SEMRU showed that some British tourists are concerned that Brexit might be a barrier and unsure about the impact of Brexit on future trips to Ireland (Hynes, Aymelek, Corless, & Evers, 2018).
2.3.4 - Trends in Region IV and V
The Bay of Biscay and the Iberian Coast
The Bay of Biscay and the Iberian Coast extends from the coastlines of France, Portugal, and Spain. The coastline is highly diversified with estuaries, rias, and wetlands, which all support productive ecosystems. The coastal strip has an increasing high population density and one of the main human activities in the region is tourism.
For the contracting parties along these waters, the coastal areas are important in terms of employment and income generated.
Portugal is experiencing continuous growth in its recreation and tourism sector, but
struggles with coastal erosion due to rapid urban development. For the South-West and Northern Spain tourism is an important activity, which however experienced a downward trend in the past years. Within the French tourism sector, due to growth various stakeholders are competing for land, which is often used for the construction of new accommodation facilities.
The Wider Atlantic
Population in the wider Atlantic is restricted to the Azores Archipelago, an autonomous region of Portugal. It is highly popular for marine wildlife watching, with high potential to increase.
France
For the Bay of Biscay, characteristic activities of coastal tourism employed a total of 174,000 people in 2011. This number represents 34% of the workforce the tourism industry employs in all coastal regions and 13% of employees in the tourism sector at national level. In 2013, the Bay of Biscay had a 47,6 million overnight-stays in coastal departments, which is an increase of around 5% since 2009. The northern part of the Bay of Biscay had 191,449 beds in 2012. This number represents 2.4% of the total tourist offer of the entire French coast.
To meet tourism needs, the coastal land is partly used for construction of accommodation, tourist facilities and second homes. Therefore, several players are competing for land, as it becomes more difficult to access. Another issue are user conflicts between professional and leisure activities, which particularly compete in summer for space and resources (Ministère de la Transition écologique et solidaire, 2018).
Coastal and maritime tourism is a key economic resource for the Southern Atlantic coast, sustaining more than half of jobs relating to the maritime economy. Especially the islands and straits are popular tourist destinations. The South-Atlantic coast has a coastline of 720 km, which accounts for 14% of France’s total coastline (excluding islands) and is home to 550,000 people – living in 140 coastal municipalities. The tourism sector in this region accounts for 60% of all maritime jobs (Ministère de la Transition écologique et solidaire, 2018).
Recreational activities like recreational fishing, leisure boating and water sports are all popular activities taking place in this maritime region. Recreational fishing has increased significantly in recent decades which reflects the growth of seaside tourism. Furthermore, it inhabits the largest marina with 5.1000 berths, and the boating sector is the main growth driver (Ministère de la Transition écologique et solidaire, 2018).
 by coastal municipality in the Bay of Biscay in 2013; Source: INSEE, SOEs, 2017")
Figure 14: Rate of tourist function (number of tourist beds per 100 inhabitants) by coastal municipality in the Bay of Biscay in 2013; Source: INSEE, SOEs, 2017
The Ministry for the Ecological and Inclusive Transition of France identified the pressure from the tourism industry through the tourist function rate. Figure 14 gives spatial visualisation of how tourist beds are distributed over the coastal region.
Along the coastline of the North-Atlantic Western Channel of France, lie around 300 coastal municipalities, providing home to 7 million people. Its economic growth is characterised by its demographical characteristic, led by tourists and older generation. The region is rich in attractive ecosystems, coastal and marine landscapes, which not only leads to a strong sense of local and regional identity, but also attracts tourists (Ministère de la Transition écologique, 2019).
Year-round leisure activities are growing, which shows in the development of more onshore storage for individual ships, indicating a need for more harbours. This individual storage may free up port berths, but at the same time creates the need for yard space and access to water. Furthermore, the recreational boating sector is competing with recreational fishing, another popular activity in this region (Ministère de la Transition écologique, 2019).
Portugal
Portugal comprises Portugal mainland, the island Madeira, and the archipelago of the Azores. For the Portuguese economy, tourism remains a major export sector. For its engagement for good tourism accessibility, it won the UNWTO award for Accessible Tourist Destination 2019, making it a leader in this field (European Travel Commission, 2019). As can be seen in Figure 15 below, nights spent at tourist accommodations is increasing steadily since 2010 in all coastal NUTS2 regions.
The coast of Portugal is rich in its flora as a result of its special biographical position (Braun-Blanquet, Braun-Blanquet, Rozeira, & Pinto da Silva, 1972). Also, 35% of Portuguese Natura 2000 sites are coastal habitats, which shows its conservation value (Martins, Neto, & Costa, 2013).
Modification of the coast in Portugal used to happen by natural factors, but nowadays modifications occur mostly due to human activities. On the Portuguese coast, sandy systems were largely expanded, which now as a result face great erosion (Martins, Neto, & Costa, 2013). The coast of Portugal suffers many problems due to bad planning and management of construction in the past (Silva, Alves, & Rocha, 2007) and in the west the shoreline regularly suffered erosion as a result of tourist resort developments (Ferreira, Dias, Cama, & Taborda, 1995).
To ensure sustainability in this sector, while also promoting competitiveness, the Portuguese government launched its Tourism Strategy in 2017. It is a 10-year strategy with economic, environmental, and social sustainability at its core. To oversee the progress, economic, social, and environmental data will be regularly monitored on a national and regional level. Following the UNWTO Measuring Sustainable Tourism (MST) Framework, Portugal wants to guarantee the adoption of sustainability principles throughout the tourism industry by producing relevant information, which in turn should feed into decision-making in tourism management (Guerreiro & Seguro, 2018).

Figure 15: Nights spent per NUTS2 region in Portugal; Source: Eurostat, 2020
In recent years, Portugal experienced a ‘tourism boom’, where the Cruise industry played a significant part. Due to the DAESH crisis and emerging terror attacks around the Mediterranean and other Middle East destinations, the cruise industry re-routed their activities to Lisbon, where a new cruise ship terminal was opened in 2017. However, with the COVID-19 crisis many uncertainties emerged for this sector.
The autonomous regions Madeira and the Azores are popular destinations for nature tourism. According to a survey of Foncesca et al. (2014) focused on the Azores in the Wider Atlantic, the main reason why people visit it was for its natural values, maritime tourist activities and its peculiarity. One of the most popular activities were bathing and whale watching. Noteworthy, the most visited regions were largely coastal, where marine protected areas had high popularity. The study indicates that whale watching, diving, and bathing have the most potential to increase in the future (Fonseca, et al., 2014). Both autonomous regions successfully converted from whaling activities to a whale watching boom. However, to avoid overexploitation of the resources, precautionary measures are necessary. Such measures include avoiding the risk of harassment of the cetaceans if the tourist operators are left unchecked by authorities.
Spain
For North and South-West Spain (‘the Spanish Atlantic Arc’), tourism is an important source of economic activity. By defining the tourism sector by Tourism Satellite Accounts, the economic activity generates approximately 11% of the GVA and 12% of employment for the total Spanish economy, where coastal tourism makes up a considerable part, namely 5,34% GVA and 4,70% employment. However, between 2009-2011 the sector showed a downward trend both in GVA (-5%) and employment (-3%). Furthermore, in recent years there is a slight decrease in overnight stays on the Atlantic coast of Spain, with the Basque Country being an exception (Fernandez-Macho, et al., 2015).
In 2011, Spain offered around 130.000 berths and moorings, where 26% were located along the Atlantic Arc. Furthermore, a third of all water sport clubs and permits water sport activities in Spain were located there as well (Fernandez-Macho, et al., 2015).
3 - Activities
3.1 - Recreational Fisheries
The ICES WGRFS defines marine recreational fishing as “the capture or attempted capture of a living aquatic resources mainly for leisure and/or personal consumption (Hyder, et al., 2017, S. 11). Recreational anglers in the sea have important economic and social benefits, and can be an important source of income for national economies (Haab, Whitehead, & McConnell, 2001).
A study by the EU Policy Department for Structural and Cohesion Policies for Fisheries tried to estimate the value of marine recreational fishing and its impact on fish stocks (Hyder, et al., 2017), summarised in Table 8.
| Country | Production (million euro) | Employment (FTEs) |
|---|---|---|
| Belgium | 60 | 407 |
| Denmark | 249 | 1,877 |
| Finland | 180 | 1,311 |
| France | 2,324 | 24,527 |
| Germany | 176 | 1957 |
| Iceland | 104 | 733 |
| Ireland | 195 | 2029 |
| Netherlands | 279 | 1,835 |
| Norway | 1,992 | 14,079 |
| Portugal | 240 | 2,513 |
| Spain | 374 | 3,921 |
| Sweden | 1,010 | 8,921 |
| UK | 2,370 | 24,632 |
Of relevance to OSPAR is that the study also divided the whole European seas into sub-regions. The North Sea is the largest contributor to the economic activity of recreational fishing with 35%, whereas the North-Western and South-Western Atlantic waters contribute each 15%. Regarding employment, a similar pattern was observed. Furthermore, their results show that the difference in economic impact of incremental spending in an economy by sea area was lowest with the North-Western Atlantic waters
| A. GVA (million euro) | |
| North Sea (Region II) | 1,771 |
| North-Western Atlantic Waters (Region III) | 837 |
| South-Western Atlantic Waters (Region IV) | 825 |
| B. Employment (FTEs) | |
| North Sea (Region II) | 29,82 |
| North-Western Atlantic Waters (Region III) | 15,078 |
| South-Western Atlantic Waters (Region IV) | 19,386 |
It should be noted that this study only offers a point estimate, as there were limited suitable time series available. An assessment of the impact of recreational fishing development is not possible without surveys on a regular basis. Even though there is a European legislative requirement in place since 2002, that says recreational catches must be reported, there are only few estimates from some member states (Hyder, et al., 2017).

Figure 16: Economic distribution of recreational fisheries in Europe, Source: EURecFish via Hyder, et al., 2017
3.2 - Recreational Boating
Recreational boating is a popular activity in Europe. According to interviews by Ecorys (2015) with the EBI around 6 million boats are owned in Europe and 36 million European citizens regularly participate in recreational boating activities. In terms of GVA, the EBI estimates for marinas and boating € 39 billion and approximately 280 000 people are directly employed in this sector. Furthermore, there are roughly 32 000 companies engaged in this industry, where over 95% are SMEs (EBI, personal communication, 2020).
Boat ownership patterns across Europe are rather diverse with Northern countries (Finland, Sweden, and Norway) showing high ownership ratios:
| Contracting party | Number of boats |
|---|---|
| Finland | 1,125,900 |
| France | 501,581 |
| Germany | 480,000 |
| The Netherlands | 501,000 |
| Norway | 800,000 |
| Spain | 164,900 |
| Sweden* | 753,400 |
| UK | 559,973 |
*Advice from the Swedish Government is that there are about 900,000 recreational boats in Sweden, of which over 100,000 are over 40 years old. The number of unsuitable recreational boats is estimated at 62,000, while the number of abandoned scrap boats is estimated at about 2,000
For the numbers in Table 10, it is important to mention that the type and average length of boats differ between countries. However, most of the boats will be small boats (below 8m), especially in the Northern countries (EBI, personal communication, 2020).
Within the EU, key players for the recreational markets are Germany, France, UK, and the Netherlands. Whereas in Germany and UK an increase in boat import is prevalent, in France and the Netherlands confidence in recreational boating is declining steadily since 2009. Superyacht building on the other hand increased (Ecorys, 2015). After the economic crisis in 2008, European boat builders shifted their focus from the internal to the external market. Since the economic crisis, there was a downward trend of 40% in boat registrations within the EU (Ecorys, 2015). Furthermore, the demand trend is reflected in the boat owners age, as boat user demographics are changing. In the past 10 years, the average age of boat users changed from approximately 45 to 55, which shows that fewer younger boat owners came into the market. This can be explained by the economic crisis, lack of capital among younger people to buy recreational vessels and a shifting attitude towards owning a boat. As younger people do not gather experience in recreational boating, the chance is high that they will neither do it at a later stage (Ecorys, 2015). It should be noted, however, that younger people still participate in recreational boating, but are more interested in sharing concepts of various forms, as well as chartering a boat.
| Country | 2014 | 2015 | 2016 | 2017 | ||
|---|---|---|---|---|---|---|
| EU-28 | 393 127 | 395 432 | 396 523 | 414 808 | 400 788 | 14 020 |
| Total | Non-Cruise | Cruise | ||||
| Belgium | 821 | 844 | 1 118 | 1 270 | 321 | 950 |
| Finland | 18 471 | 18 884 | 19 222 | 19 489 | 19 481 | 7 |
| Denmark | 41 353 | 41 647 | 41 583 | 42 886 | 42 461 | 425 |
| Germany | 30 780 | 30 087 | 30 849 | 30 774 | 28 527 | 2 248 |
| Sweden | 29 244 | 29 500 | 29 800 | 30 265 | 30 091 | 175 |
| Ireland | 2 755 | 2 751 | 2 717 | 2 774 | 2 769 | 5 |
| Iceland | 723 | 737 | 544 | 917 | 917 | 0 |
| Spain | 23 486 | 24 522 | 26 323 | 27 899 | 24 896 | 3 004 |
| France | 26 638 | 26 133 | 24 514 | 25 093 | 24 377 | 717 |
| Netherlands (¹) | 1 819 | 1 910 | 1 906 | 1 928 | 1 928 | 0 |
| Portugal | 551 | 583 | 679 | 740 | 677 | 63 |
| United Kingdom | 28 135 | 27 805 | 26 887 | 26 338 | 24 419 | 1 919 |
| Norway (²) | 6 103 | 6 714 | 6 266 | 6 352 | 6 243 | 109 |
(1)Data exclude cruise passengers
(2)Data on international maritime passengers only
3.3 - Cruise Travelling
Cruise travelling, as defined by Ecorys, are “all activities associated to cruise holiday, including the ships used and the facilitations at destinations ports. Cruise tourism is a form of tourism where people travel (cruise) on a ship” (Ecorys, 2012, S. 9). After North America, Europeans are the ones most frequently travelling by cruise ships. Cruise tourism is the fastest growing tourism submarket, seeing an increase from 6.79 million to 7.17 million passengers between 2016-2018 (CLIA, 2018). One factor which is contributing to the increase of cruise tourism are the rising welfare levels (Ecorys, 2012).
Within the cruise industry, is a trend towards exploration destinations. Travelling by cruise ship gives the possibility to explore less-visited places that are sometimes solely accessible by boat. Such a place is for instance in polar regions (CLIA, 2019).
In the OSPAR Maritime Region, the three most popular passenger ports are Hamburg, Bergen and Lisbon in 2019 (Cruise Europe, 2020).
One of the criticisms of cruising is its unsustainability in the way that it generates a lot of pollution, causes over-tourism, and only slightly contributes to local communities, as visitors stay on the destination’s site for short periods. In terms of space, the cruise industry might compete with freight transporters in ports.

Figure 17: Ports for cruise ships in north-western Europe; Source: Cruise Europe, 2020
3.4 - Beach Recreation and Tourism
Recreational activities on beaches include activities like sunbathing, swimming but also walking kite- and windsurfing and so forth (Leewis, van Bodegom, Rozema, & Janssen, 2012).
Especially sandy beaches are a popular type of habitat on the coast, which as a consequence leads to a higher concentration of recreational activities when compared to other types of marine or coastal habitats (Defeo, et al., 2009). As many people and activities are concentrated in certain places, vegetation can be seriously harmed by trampling (Defeo, et al., 2009) and the area more likely to be littered (Interwies, et al., 2013).
Baches offer various cultural services and have an especially significant value for the recreation and tourism industry. The beach offers cultural services and is has especially a significant value for the tourism industry. However, coastal erosion poses a significant threat to tourism services at the coast. This is not only a technical challenge, but also coastal managers face challenges to find a balance between the economic, social, and environmental aspects of beaches (Alexandrakis, Manasakis, & Kampanis, 2015). One of the possible measures to mitigate erosion is beach nourishment, which on one hand can reduce storm risks, but also create recreational benefit due to wider beaches (Phillips & Jones, 2006). However, beach nourishment may also exert environmental pressures, which is elaborated in the Pressure and Impact section.
To allocate a value to beaches could be useful for policy makers, who are interested in erosion management programmes, as these could be economically justified. Furthermore, the allocation of a value to the beach could contribute to territorial, urban and environmental planning in regions where the tourism industry faces structural problems (Riera, 2000).
3.5 - Marine Wildlife Tourism
The whale watching industry can be an essential source of income and employment for coastal communities and regions thus contributing to their tourism infrastructure. Taking an economic perspective, whale-watching can also be more profitable than whaling. However, if not managed properly it can have negative impacts on cetaceans (WDC, 2019). One of the most valuable ways to promote and manage successful wildlife ecotourism is through the establishment of MPAs. MPAs can attract tourists, which are putting special value in experiencing untouched environments.
| Island or archipelago | Whale watchers x 1000 | Whale watch expenditure x millions US$ | MPAs with cetaceans | Proposed |
|---|---|---|---|---|
| Svalbard (Norway) | Low, inc. | Low | 10 | 1 |
| Iceland | 30.33 | 6.47 | 1 | 1 |
| Greenland (Denmark) | 2.50 | 275 | 2 | 0 |
| Faroe Islands (Denmark) | Low | Low | 0 | 0 |
| United Kingdom | 121.13 | 8.231 | 0 | 6 |
| Ireland | 177.60 | 7.110 | 0 | 8 |
| Sylt (Germany) | Low, inc. | Low | 2 | 0 |
| Azores (Portugal) | 9.50 | 3.37 | 17 | 0 |
| Madeira (Portugal) | Low | Low | 1 | 2 |
Whale watching is a growing international industry, which was worth over 1.7 billion Euros in 2009. However, in 2009 Europe only accounted for 6% of global whale watchers. Excluding the Canary Islands, Scotland hosted the highest number of whale watchers in 2009, representing a share of 27% (O'Connor, Campbell, Cortez, & Knowles, 2009). In general, cetaceans are widely distributed in a range of habitats and are overall abundant throughout the OSPAR Maritime Area. It is estimated that more than 1.5 million individual cetaceans live in the Greater North Sea, Celtic Seas, and Bay of Biscay and Iberian Coast (OSPAR Commission, 2017).
For Scotland in 2009, marine wildlife tourism was estimated to have an economic impact of £ 15 million, providing 633 FTE (International Centre for Tourism and Hospitality Research, 2010). Whale-watching is seen as an important component of marine wildlife tourism, where 23% of whale-watchers visited West Scotland particularly for whale-watching trips (Parsons, Warburton, & Woods-Ballard, 2010). A more recent study, focused on West-Scotland, showed that the whale-watching industry in an important source of employment and revenue for isolated coastal communities. However, the capacity of whale watching decreased by 17.3% between 2000 and 2015, even though whale-watching vessels increased. Also, the economic impact got significantly lower, where there was a drop from £ 11.8 million in 2000 to £ 6.5 million in 2015 (Ryan, et al., 2018).
Also, the Azores archipelago (Portugal), marine wildlife tourism has great potential for a combination of development and conservation. The Azores archipelago offers good conditions for wildlife watching close to the shoreline and has a great diversity of cetacean species (25 identified species close to shoreline), which shows in increasing whale watching and other marine wildlife activities. However, a study interviewing experts and stakeholders regarding whale-watching showed that there are different perceptions on the sustainability of whale-watching in the Azores. Some state that whale-watching has the potential to ensure economic and social sustainability and simultaneously protect these species. Others were more sceptical, and state that the activity is not sustainable anymore, as it– among other things – has a high ecological footprint, has certain unpredictability of sightings and that it is difficult to make it financially viable (Bentz, Dearden, & Calado, 2013).
4 - Pressures and Impacts
Coastal and maritime tourism is dependent on good environmental conditions. Land or maritime-based activities, which deteriorate the environment, can have also negative effects on the tourism sector itself.
Tourism and recreational activities can exert various pressures on the coastal and marine environment. Table 13 gives an overview of activities and their associated pressures and impacts, which are then more elaborated throughout this chapter.
| Activity | Pressure and Impact (MSFD Annex III) |
|---|---|
| Population and tourism in coastal areas | Physical loss, physical disturbance, input of litter, contamination by hazardous substances, nutrient and organic matter enrichment |
| Recreational fisheries | Biological disturbance, input of litter, contamination by hazardous substances, other physical disturbance, input of anthropogenic sound |
| Recreational boating | Biological disturbance, physical disturbance, biological disturbances, input of anthropogenic sound; contamination by hazardous substances (abandoned boats) |
| Cruise Ships | Physical loss, physical disturbance, input of litter, biological disturbance input of anthropogenic sound |
| Beach Tourism | Physical loss, physical disturbance, nutrient and organic matter enrichment, contamination by hazardous substances |
| Marine Wildlife Tourism | Biological disturbance, other physical disturbance |
4.1 - Population and tourism in coastal areas
Although OSPAR countries are diverse, population densities are usually higher on the coast than inland as people tend to be concentrated in certain areas, more favourable for trade, marine industry, or recreation.
Coastal areas are not only popular among tourists, but by inhabitants in general. In 2011, 40.8% of the EU-27 population lived in coastal areas. The majority lived within 50 km from the sea, whereas closer (5 and 15 km) wide disparities throughout the EU are prevalent (Eurostat, 2013).

Figure 18: Share of population in coastal regions living within 50 km from the coastline by NUTS3 regions; Source: Eurostat, 2013
In a study by Batista e Silva et al (2018), spatiotemporal patterns in Europe were analysed by using conventional datasets, namely Eurostat, and emerging big data sources like www.booking.com. In Figure 19, one can clearly see that especially coastal areas are popular destinations among tourists and peak in the summer months. These, together with islands, are dominantly oriented towards beach tourism and so dependent on the prevalent climate conditions.
")
Figure 19: Tourist density in EU-28 in August 2016; Source: Batista, et al. (2018)
Population growth in coastal zones can exert pressure on coastal ecosystems and natural resources through increased utilisation and pollution.
For the Mediterranean and for Baltic coastal sandy beaches, Gheskiere and colleagues (2005) showed that beaches, where tourism and recreation took place, the habitats experienced higher stress levels, showed lower diversity of benthic invertebrates (indicator for marine environmental quality) when compared to close untouched beaches (Gheskiere, Vincx, Weslawski, Scapini, & Degraer, 2005). Furthermore, beach tourists and recreationists contribute to marine litter, which will be discussed in section 4.5.
4.2 - Demographic pressure and demand for land
Tourism and recreation often demand facilities and infrastructure (e.g., for hotels, roads etc.) and thus require land. For this, soil gets sealed, which means that the ground is covered by an impermeable material. Soil sealing is one of the main causes of soil degradation in the EU (European Commission, 2012). In Figure 20, one can see that close to the coast imperviousness density is slightly higher. Soil sealing can especially be observed on the coasts of Portugal, Belgium, and the Netherlands. Also, some spots in France, the UK and Ireland show a high imperviousness density (EEA, 2020).

Figure 20: Imperviousness density in 2015; Source: EEA, 2020
The demand for land leads to strong alterations of the coastal front and resulted in the construction of many man-made structures. Such constructions offer a favourable condition for economic growth, but they also caused increasing severe coastal erosion (Taveira-Pinto, 2004). In the case of Portugal and Spain, the tourism boom in the 1960 and 1970 led to uncontrolled urban expansion, where many natural areas were irreversibly transformed into artificial coast (Dias, Cearreta, Isla, & de Mahiques, 2013).
4.3 - Seabed modification through beach nourishment
The ICES Working Group on the Effects of Extraction of Marine Sediments on the Marine Ecosystem (WGEXT) gathered information about the volume extracted from the sea by various OSPAR Contracting Parties. The volumes extracted in 2018 are listed in Table 14. The numbers below only include OSPAR relevant data, thus do not include HELCOM, Baltic or Mediterranean activities (ICES, 2019).
| Country | Beach Nourishment (m³) | Share of Beach Replenishment (%) | Total volume extracted (m³) |
|---|---|---|---|
| Belgium | 988 000 | 26,03 | 3 795 000 |
| Denmark | 3 731 213 | 64,97 | 5 742 576 |
| France | N/D | N/D | 3 676 703 4 |
| Finland | 0 | 0 | 0 |
| Germany | 148 682 | 87,85 | 169 242 |
| Greenland | 0 | 0 | 63 500 |
| Faroes | N/D | N/D | 23 000 |
| Iceland | 0 | 0 | 421 820 |
| Ireland | 0 | 0 | 0 |
| Netherlands | 12 374 401 | 50,33 | 24 583 921 |
| Norway | N/D | N/D | N/D |
| Portugal | 0 | 0 | 137 951 |
| Spain | 3000 | 100 | 3000 |
| Sweden | 0 | 0 | 0 |
| United Kingdom | 493 355 | 5,27 | 9 353 054 |
Whereas some OSPAR contracting parties had zero extractions for beach nourishment, countries like the Netherlands, Denmark and Germany accounted for more than half of the overall figures. With almost 90% of volume extracted for beach nourishment Germany holds the largest share. However, in terms of volumes, the Netherlands has the highest. What has to be noted here is that beach nourishment is not solely done for recreational purposes, but also for e.g., safety issues.
Beach nourishment is known to be an effective maintenance measure, but it can also exert various pressures on an ecosystem. For example, bird species can be affected by beach nourishments. To which extent they are affected depends on how the species interacts with the coast and the type of supplementation used. A distinction can be made between breeding birds and foraging birds. Foraging birds can sometimes move during nourishment activities to other locations, whereas breeding birds often do not have that possibility. Therefore, the chance is high that this leads to a loss of an entire breeding season, even if activities are limited to a few weeks (Jonkvorst, Gyimesi, Boudewijn, & Poot, 2013).
In the case of the Netherlands, Natuurlijk Veiligheid – a Dutch cooperation project – researched the effect of beach nourishment activities on benthic animals, fish, birds and the effect of sand drift on flora and fauna.
As an example, for birds they chose species which might be sensitive to beach nourishments. Birds that eat fish and occur mostly on the coastal zones outside of the breeding seasons are less affected by beach nourishment activities (e.g., cormorant). In contrast, the Kentish plover and Common ringed plover are birds that pick out their foods along the waterline. Both species are already strongly negatively influenced by recreational pressure. In addition, through beach nourishment activities food availability temporarily decreases due to the new layer of sand. As a consequence, the disappearance of a few breeding pairs can already lead unwanted effects. (Jonkvorst, Gyimesi, Boudewijn, & Poot, 2013). For compensation recreational activities could be limited on adjacent beaches, which however could lead to societal conflicts.
4.4 - Sewage and Water demand
The development of coastal tourism leads to increased water demand (for human use, golf courses, swimming pools, air-conditioning, etc.), especially during the peak season in southern Europe (Portugal and Spain) when the water deficit can increase (Cazcarro, Hoekstra, & Chóliz, 2014). Therefore, scarcity of fresh water is a real challenge in certain parts of the OSPAR Maritime Area .
The understanding of tourism’s indirect water requirements, like producing food, building materials or energy are still not enough understood, but is expected to be more substantial than direct water use. Gössling et al. (2012), estimated the direct water use per tourist per day, see Table 15.
| Water use category – direct | L per tourist per day |
| Accommodation | 84-2000 |
| Activities | Oct-30 |
| Water use category – indirect | L per tourist per day |
| Infrastructure | N/A |
| Fossil fuels | 750 (per 1000km by air/car) |
| Biofuels | 2500 (per 1 L) |
| Food | 2000-5000 |
| Total per tourist per day | Estimated range: 2000 - 7500 |
In general, the tourism industry could engage more in energy and water management to adapt to changing water availability and climate change to sustain the future of its own industry (Gössling, et al., 2012)
An important pressure coming from the leisure and tourism industry is golf. Golf courses are important consumers of herbicides, nitrates, and water, especially in the south where it is difficult for grass to grow without these inputs. Besides, golf courses represent the elimination of natural communities and their transformation into simpler ecosystems (OSPAR, 2008).
Eutrophication has been recognised over many years as one of the most important problems facing European coastal waters. However, it displays significant regional and seasonal variability. Within the OSPAR Maritime Area, in 2017 the Greater North Sea had the largest surface area classified as a problem area or potential problem area with regard to eutrophication. Furthermore, extensive problem areas were also identified along the coast from Belgium to Denmark in the North Sea, and in Danish and Swedish waters in the Kattegat and Sound. Also, in the Celtic Seas many coastal waters were classified as problem areas and within the Bay of Biscay two areas were classified as problem areas (OSPAR, 2017). Increased discharges of sewage water due to the rising population levels during the summer caused by tourism could cause an additional deterioration in the waters’ trophic state.
Environmental degradation of marine waters by eutrophication can reduce enjoyment and opportunities for marine and coastal recreation. This may also reduce the appreciation of the existence value of the healthy and diverse coastal ecosystem (Heiskanen, Bonsdorff, & Joas, 2019). Therefore, by reducing eutrophication not only the quality of coastal and marine waters would be improved, but also may lead to better water recreation opportunities (Ahtiainen, Artell, Elmgren, Hasselström, & Hakansson, 2014)
4.5 - Coastal and Marine Litter
Coastlines as a natural environment can provide a range of psychological benefits to their visitors (White, et al., 2010). However, litter can have potential negative effects on the environment and wildlife, but also on people and a state’s economy.
Tourism and recreational activities are considered to be one of the predominant sources of land-based litter on Europe’s coasts (Interwies, et al., 2013). Marine litter is considered to be harmful, as animals living in the OSPAR Maritime Area can get entangled, may ingest litter, or get injured (OSPAR, 2017).
Coastal regions, especially municipalities are directly impacted by the environmental, psychological, and economic burden of marine litter. On the one hand, municipalities are responsible for the costs of keeping the beaches clean, whereas on the other hand litter can have consequence for local tourism and recreational activities but also on the ecosystem. Especially municipalities which’s coasts contribute substantially to the economy, litter costs can be considerable (Newman, Watkins, Farmer, Brink, & Schweitzer, 2015).
The Marine Conservation Society (MCS), a marine charity, is surveying litter across the UK. 30.4% percent of litter found came from the public, partly because people left their litter on beaches. Cigarette stubs was one of the most common litter types, finding 42.6 items per 100 meters (MSC, 2019). Furthermore, Nelms, et al. (2017) assessed data collected by the MCS for a decade on marine anthropogenic litter on British beaches. Plastic was the main component found, mostly coming from land-based sources like public littering. The Western English Channel and Celtic Sea showed the highest mean abundance of litter from both land and sea. The authors argue that this may be due the fact that it is a really busy shipping route, but also it represents a popular tourist destination. Especially the South-west of England; as the region that attracts most domestic tourist within the UK (Smith, 2010). Another recent study by Nelms, et al. (2020), solely assessed the litter occurrence and distribution in English Marine Protected Areas (MPA). Again, the main type of litter was plastic, the highest mean was prevalent in the South-west. When comparing litter abundance inside and outside of the MPA, no difference was observed, meaning that more effective management strategies are needed.

Figure 21: Composition of marine litter according to main litter types for the period 2014-2015 in the OSPAR Maritime Area; Source: OSPAR, 2017
Especially the south west of England; as the region that attracts most domestic tourist within the UK (Smith, 2010). Another recent study by Nelms, et al. (2020), solely assessed the litter occurrence and distribution in English Marine Protected Areas (MPA). Again, the main type of litter was plastic, the highest mean was prevalent in the southwest. When comparing litter abundance inside and outside of the MPA, no difference was observed, meaning that more effective management strategies are needed.
")
Figure 22: Shore-based litter density occurring within English MPAs. Maps showing mean number of items m-1 min-1 person-1 for each MPA for: left: plastic; right: public Litter: Source: Nelms, et al. (2020)
A study by KIMO International revealed that tourist organisations find it important to keep a clean and high-quality coast for their tourism branding. This is because the coast is the initial reason why people visit the area, therefore must stay attractive and free from litter. Besides harming the environment, litter also harms the reputation of tourism operators. Therefore, it was also in their interest to manage their beaches to a high standard (Mouat, Lozano, & Bateson, 2010).
A study by Williams et al, (2016) investigated the distribution of litter items along the coastline around Cadiz on , the Atlantic side of Andalusia. Similar to the above-mentioned studies in the UK, plastic litter was the most frequently occurring item. Whereas beaches with clean-ups are found to be in a relatively acceptable state – meaning little additional cleaning operations would already improve the situation – beaches with no clean-ups showed a high variety of litter items. Open coastlines had mainly recreational litter, whereas sheltered locations, like bays, were mostly polluted by industrial litter. However, some of the non-cleaned beaches also showed a high abundance of recreational litter. To manage litter in the future, the study stresses that there is a need for improved waste management facilities, beach user education and appropriate enforcement measures. As coastal tourism is an important economic activity in Cadiz and is directly dependent on a clean beach, it can be used as an incentive for the involved stakeholders to keep beaches clean (Williams, et al., 2016).
Besides the impact on the environment or the economy, litter in coastal environments also can have psychological effects on visitors. A study by Wyles and colleagues (2016) showed that when litter was present, the environment gave visitors less rest and were less popular. Furthermore, littered beaches were less frequently visited. Especially public-related litter was associated with the distribution of the visitors’ experience as it implies “disrespect for nature by other users, had physical risks associated with it, and was seen as belonging to the city” (Wyles K. , Pahl, Thomas, & Thompson, 2016, p. 1117). This shows that litter can strongly affect the positive implications of a clean, pristine coastal environment and therefore its recreational value.
Next to the economic costs and psychological and physical effects on humans, litter has the potential to shift the ecology of a marine system on the long term (Galloway, Cole, & Lewis, 2017). Such an alteration of the environment and shift in biodiversity might have unpredictable societal consequences (Worm, et al., 2006).
Costs of marine litter
To counteract litter, contracting parties also invest in awareness campaigns related to tourism. For example, the Belgian states current cost on measure related to land-based litter are € 36.000; including public awareness campaigns and clean-up events. The Belgium private sector spent € 15.000 on raising awareness about the prevention of discharges from fishing vessels and recreational boating in ports and € 12.000 in raising awareness related to waste management in marinas (Belgische Staat, 2018).
For the Netherlands, Ecorys (2012) estimated the cleaning costs for Dutch beaches. On average, on Dutch beaches there are 12 tonnes litter per kilometre beach. However, one should note that there is a high variety between beaches (3-50 tonnes per kilometre). This variety can be traced back to how intensive a beach is used for recreation. The more beach kilometre was used for recreation - meaning more visitors per kilometre – the bigger the amount of litter. However, the fraction of collected litter on recreation beaches is generally smaller, as they have a bigger share of waste bins. Next to that, the amount of litter is dependent on the ambition and attitude of the municipalities, what is clean enough? This has a direct effect on how often and how intense beaches will be cleaned (Ecorys, 2012).
The costs for coastal municipalities in the Netherlands for keeping their beaches clean is between € 6.200 - € 48.000 per beach kilometre. This includes the costs for the waste containers management, beach cleaning, waste transport and waste processing. The estimated costs per tonnes of waste for Dutch coastal municipalities is between € 500 – € 3.200 per tonne of beach waste. Furthermore, intensively used recreation beaches demand more cleaning, meaning higher cleaning costs. For comparison, the intensive used beaches have approx. costs of € 204.000 annually, whereas extensive beaches solely spend € 89.000 per year. The total costs for Dutch coastal municipalities for removing beach litter is between € 3.7 – € 5.3 million per year. Approximately 70% of these costs are beach cleaning costs; the rest is spent through management of waste facilities and waste disposal. These costs exclude awareness campaigns around litter, monitoring and controlling. Also, the work of volunteers reduces these costs (Ecorys, 2012).
Cadiz in south-western Spain is a popular destination for sun, sea and sand tourism, where marine litter may negatively affect this industry. For keeping beaches clean, mostly beach cleaning operations, which are costly, are conducted. In 2014, the municipality of Cadiz invested € 1,2 million into beach cleanings and maintenance of infrastructure. For Cadiz, the main driver to keep beaches clean is the coastal tourism industry, as litter negatively affects it (Williams, Buitrago, Anfuso, Cervantes, & Botero, 2016) (Mcllgorm, Campbell, & Rule, 2011).
Besides beach cleans conducted by authoritative institutions, there are also various beach cleaning campaigns being arranged, where individuals are involved and volunteer to collect and dispose litter found on the shore. Besides the immediate benefit on the local environment, they appear to have a wider educational value as well (e.g., leading to higher pro-environmental intentions). This eventually could lead to further environmental benefits (Wyles J. , Pahl, Holland, & Thompson, 2016).
4.6 - Pressure and Impact from Recreational Fishing and Boating
For recreational fishing in general, recreational biomass is not accounted for when advising for total allowable catch of fish stocks and is rarely reported or monitored. This could hinder sustainable management of fish stocks. Popular species, which are close to the coastal shore, could be at higher risk, as they a more easily accessible for recreational fishers. Next to exerting pressure and having an impact on fish stocks, recreational fishing has the potential to affect the marine environment as well (Hyder, et al., 2017). Also, the annual EU fishing regulation had tried for some years to manage the combined pressures of commercial and recreational fishing for the case of sea bass stocks in French, British and Dutch waters, as there are serious conflicts between commercial and recreational interests.
As recreational fishing mostly takes place on shore or from boats in coastal areas, the impacts are focused in littoral and nearshore zones. Furthermore, recreational fishing is normally not evenly spatially distributed which leads to some places receiving higher pressures (see e.g., Hunt et al., 2011, Cabanellas-Reboredo et al, 2014; McPhee, 2017). There are differences in fishing practices between countries, which may lead to varying pressures. Also, local pressures could have disproportionately bigger impacts in fish nursery or nesting areas (Hyder, et al., 2017).
In Hyder’s assessment, they rated the impacts as high, moderate, and low, which they based on scientific literature and expert opinion. Their assessment criteria were based on scale, reversibility, impact, management complexity and the ecosystems. Selected activities and the severity of their environmental consequences are shown in Table 16.
| Criteria | Scale | Reversibility | Impact | Management complexity | Ecosystem | Rating |
|---|---|---|---|---|---|---|
| Non-indigenous species | H | H | H | H | H | H |
| Lead fishing weights | M | H | M | H | H | H |
| Bycatch | M | M | M | M | M | M |
| General litter | L | L | L | L | L | L |
| Boating | L | L | M | L | L | L |
| Noise | L | L | L | L | L | L |
| Benthic disturbance | L | L | L | L | L | L |
Among other things, the use of live bait can pose problems, as non-indigenous species (NIS) can be introduced into ecosystems. Impacts associated with NIS are a decrease or genetic change of native species, an impact on soil and fauna and the potential to spread diseases and pathogens. This impact can affect the marine environment on a global scale. Many recreational anglers release their live baits into the water as they are not aware of the consequences (Kilian et al., 2012; Micael et al., 2016). Political initiatives, like the European Union Invasive Alien Species Regulation and the MSFD, promote the development of monitoring programmes to detect introductions of new NIS.
Another severe environmental impact from recreational fishing comes from losing lead sinkers and lures. As lead is a toxic heavy metal it can cause environmental contamination in the marine waters or get directly or indirectly ingested by birds and mammals (Hyder, et al., 2017). OSPAR is monitoring heavy metals across its Maritime Area, including lead. There are natural concentrations of heavy metals in waters, sediments, and species, called background concentrations. With the exception of the Irish and Scottish West Coast waters, lead concentrations in biota are above background concentration, but still below the European Commission’s maximum levels in foodstuffs. However, OSPAR found that lead concentrations are declining in most of the assessed areas (OSPAR Commission, 2017).
In general litter thrown away by recreational fishermen, but also abandoned, lost or otherwise discarded fishing gear (ALDFG) can have impacts on the local marine environment (Macfadyen, Huntington, & Cappell, 2009). Next to the decrease in visual aesthetic, this eventually can lead to habitat degradation and ecological damage. Especially plastic litter was identified as a key threat to marine ecosystems, but also tourism revenue (Derraik, 2002; Andrady, 2011; Jang et al., 2014) (Hyder, et al., 2017). The problem of ALDFG – as with other marine litter - is of transboundary nature, therefore regional and international cooperation is needed to prevent it (World Wide Fund for Nature, 2020).
Like recreational fishing, also recreational boating can exert various pressures on the environment, leading to various chemical, physical, and biological impacts. Fuel and combustion products and antifouling paints can be considered as having a chemical impact; the boats propeller can have physical impact by increased sediment and nutrient resuspension and increase erosion, which affects the marine fauna and flora. Furthermore, recreational boats can be a severe threat to seagrass habitats, indirectly impact coastal fish populations and might collide with cetaceans. On land, recreational boat wakes can threaten nesting shorebirds and their nests (Hyder, et al., 2017).
Recreational boating activities also can be responsible for the introduction of non-native species. In the case of the Didemnum vexillum – a high-impact, globally-invasive sea squirt – ICES considered recreational boating as being a high-risk vector for primary introduction and secondary spread of non-native ascidians. Within OSPAR, the Netherlands, France, Ireland, the United Kingdom and Spain are affected, see Figure X. In general, such biofouling species create a range of complications: they are considered one of the primary issues affecting the marine aquaculture industry, can outgrow and out-compete other species and might also disturb spawning of Atlantic herring (McKenzie, et al., 2017). ICES highlights that by the disappearance of summer Arctic sea ice - as a consequence of climate change – may lead to an increased invasion of non-native species in the Arctic through more human developments (Ruiz & Hewitt, 2009).

Figure 23: Map showing invasive geographic range of Didemnum vexillum in Europe; Source: McKenzie, et al. 2017
Recreational boats and boats from recreational fishers also produce underwater noise, which can impact fish and other marine species. On one hand, such noise can cause physical damage (impact on hearing system), or disturb fish and other marine species, that are depending on sound for orientation, navigation, communication and the detection of predators, prey, and potential mates. However, it is still difficult to separate noise from recreational (fisher) boats and other anthropogenic noise sources like wind warms or marine traffic (Hyder, et al., 2017).
4.7 - Impact of the cruise industry
In environmental terms, cruise tourism creates various impacts. First of all, for destinations to serve as a cruise line destination, the natural environment has to be modified which leads to natural habitat loss. Furthermore, there can be impacts associated with operational energy, water and antifouling use, leading potentially to physical damage of marine ecosystems. Also, recreational activities can have an impact on wildlife through disturbance, littering, and exploitation (as gifts or out of curiosity). However, as the cruise tourism is a relatively unregulated activity, it is difficult to grasp the whole range of impacts (Brida, 2010). According to the Ocean Conservancy, a cruise ship with 3.000 passengers would have (The Ocean Conservancy, 2002):
- 3800 m3 of ‚grey water‘ (wastewater from laundry, shower, sinks, etc.)
- 800 m3 of sewage
- 100 m3 of oily bilge water
- Almost 0.5 m3 of hazardous or toxic waste
- 50 tons of garbage and solid waste
- Diesel exhaust emissions equivalent to several thousand automobiles
- Large quantities of ballast water, which can introduce invasive species (a typical release of ballast water amounts to 1000 tons)
As the cruise industry experienced rapid development, some tourist destinations have implemented restrictions on the arrival of cruise passengers to cope with the large flux of tourists (European Commission, 2020). Regarding the environmental impact of cruise ships, the CLIA introduced various measures to reduce these impacts. A few examples are advanced wastewater systems, in-situ recycling or new exhaust gas cleaning systems, that filter exhaust gases which can reduce dust particles (CLIA, 2020).
4.8 - Impact Marine Wildlife Watching
While whale-watching may provide socioeconomic benefits and potentially aid conservation, it can have negative impacts on the cetaceans. Parsons (2012) created a list of some examples of behavioural changes observed in cetacean species as a response to whale-watching traffic:
- Surfacing/diving
- “Active” behaviour, like tail slapping and beaching
- Acoustic
- Group size or cohesion
- Swimming speed
- Swimming direction
- Altered feeding or resting
However, Parsons (2012) states that it is difficult to determine long-term effects of whale-watching traffic, but studies suggest that it might increase the animals’ energy expenditure, lead to chronic levels of stress (Orams, 2004) and may even lower reproductive rates (Beijder, Samuels, Whitehead, & Gales, 2006).
Offshore windfarms as interference
All coastal and marine tourism rely on experiences a site can offer, where often the scenery is more important than the activity itself. Especially this is the case for low-impact tourism, where the main attractions are the natural or cultural landscape (e.g., coastal villages, traditional harbours). The EU Renewable Energy Directive requires the EU to meet at least 20% of its total energy from renewables by 2020, meaning the offshore renewable energy is growing fast. In the context of recreation and tourism, offshore windfarms can pose a problem for coastal tourism on account of its aesthetic landscape impact (European MSP Platform, 2019). To illustrate the concern, two examples of OSPAR Contracting parties are given:
Netherlands. The development of offshore windfarms in the Netherlands may disturb the coastal tourism industry. In 2014, the Dutch cabinet agreed to build large-scale offshore wind farms close to the Dutch coast. However, the farms were planned closely to Netherland’s most popular beach resorts, (Zandvoort and Scheveningen). Some municipalities claimed that they would lose € 200 million and 6,000 local jobs due to the construction of offshore windfarms close to the coasts. If these scenarios would hold true is still under debate (European MSP Platform, 2019).
UK, Scotland. Golf is a popular activity taking place in Scotland. However, this activity may be disturbed by offshore-wind farms. A famous example is when Donald Trump, the current president of the United States, battled in court to stop the project of a 11-turbine wind farm in Aberdeen, as the wind farms would destroy the view and therefore also affect the Scottish tourism industry. In the end, the Scottish government won the case (Partlow, 2019).
5 - Measures and Policy Context
5.1 - OSPAR Marine Litter Programme and POSH Roadmap
OSPAR is committed to substantially reduce marine litter in the North-East Atlantic Ocean, so to reduce it to levels that do not harm the marine environment. Under its North-East Atlantic Environment Strategy, OSPAR agreed in 2014 to the Regional Action Plan (RAP) for Marine Litter, where various actions are taking place between 2014-2021. In total, the first iteration of the RAP contained 23 national actions and 32 collective actions. These included actions on reducing land- and sea-based litter sources, education and outreach programs, and clean-up actions. Next to specific actions, OSPAR also undertakes Litter Monitoring. This work supports on one hand the RAP, but also contributes to environmental reporting. Currently, OSPAR assesses beach litter, seabed litter and plastic particles in fulmar stomachs. In 2021 OSPAR reviewed and reflected on the RAP and planning began for the 2nd iteration of the RAP.
Under Annex 5 of the OSPAR Convention, OSPAR is dedicated to protect and conserve ecosystems and biological diversity of the OSPAR Maritime Area. On the basis of this Annex, OSPAR created a “Roadmap for the implementation of collective actions within the Recommendations for the protection and conservation of OSPAR listed Species and Habitats (POSH)”. OSPAR created a list of the various species and habitat to fulfil this commitment. Within this framework, OSPAR is working on communication and awareness campaigns, monitoring and assessment actions, MPA actions legislation (see below for further details) and legal protection, research and knowledge generation and it looks at pressures from various human activities. Currently, OSPAR does not directly address the leisure industry, however, indirectly by addressing other human activities related to the recreation and tourism sector. For instance, OSPAR is addressing topics like habitat destruction, harmful discharges, or noise pollution, which can be linked to tourism and recreation as well.
Next to RAP and POSH, OSPAR also addresses the issues of hazardous substances and eutrophication, which are both issues associated with the recreation and tourism sector, even though to a lesser extent than other human activities at sea.
5.2 - Marine Strategy Framework Directive
The Marine Strategy Framework Directive (MSFD) was launched in 2008 with the aim to achieve Good Environmental Status (GES) for EU’s waters by 2020. This should ensure that resources - on which marine-related economic and social activities depend – are protected. GES should be reached by management measures applying the ecosystem approach. For achieving this goal, the Directive established European marine regions and sub-regions on the basis of geographical and environmental criteria. In 2017, the European Commission produced a set of methodological standards to help Member State to implement the MSFD and amendments in Annex III were made to better link ecosystems, anthropogenic pressures and impacts on the marine environment (European Commission, 2008) (European Commission, 2017). One of these regions is the North-East Atlantic Ocean – the OSPAR Maritime Area. For the North-East Atlantic, OSPAR launched its North-East Atlantic Environment Strategy 2010-2020 (NEAES). This strategy focuses on the implementation of the Ecosystem Approach and five thematic strategies, like biodiversity and ecosystems (OSPAR, 2010). In 2021 OSPAR agreed it NEAES 2030 which focuses on the themes of clean seas; biologically diverse and healthy seas; productive and sustainably used seas; and seas resilient to the impacts of climate change and ocean acidification.
According to the European Commission, Member States have made considerable efforts to develop their programmes of measures under the Marine Strategy Framework Directive. In general, the MSFD improved the understanding of the linkage of human activities and its pressures and impacts. As a result, for example the Single use Plastics Directive was adopted. Furthermore, coordination between Member States was improved resulting in more coordinated objectives and targets. In June 2020, the European Commission published a report on the implementation of the MSFD with the conclusion that not all descriptors in EU waters will reach GES by 2020. This can be linked to
“the complexity of analysing and managing the marine environment and reporting on it, the lack of political will to adequately fund and enforce the necessary measures, or the lack of involvement of other economic and private sectors (apart from environmental public authorities).” (European Commission, 2020, S. 29)
As critical areas to strengthen the implementation of the MSFD, the European Commission stresses a need to level up the ambition and will of Member States, to ensure enough human and material resources and to streamline and simplify the implementation of the MSFD. The main pressures identified under the MSFD affecting the marine ecosystems are non-indigenous species, fishing, human-induced eutrophication, permanent alteration of hydrographical conditions, contaminants, marine litter and underwater noise (European Commission, 2020). All these pressures are also partly induced by the tourism and recreation industry.
However, the MSFD initiated Member States to act, which is shortly illustrated with the following two examples:
Marine litter. Within the EU, all Members States are taking, or plan to take, measures to tackle both land and sea-based litter. The most common measures are beach clean-ups, ‘fishing for litter’ and communication initiatives. Even though these measures have a modest impact in reducing pressures, they help to raise awareness and thus can potentially prevent future pollution.
To give an illustration, the Netherlands had an initiative ‘Green Deals’ to reduce litter in the sea. One part of the initiative was the ‘Green Deal’ for cleaner beaches. The evaluation of the initiative showed that it helped to expand and strengthen the network, from which new initiatives or pilots could arise at the local level. Furthermore, information exchange between municipalities was strengthened (what worked? What did not work?). Also, there has been an increased awareness among stakeholders that cooperation is needed to achieve cleaner beaches. Lastly, more, and improved waste facilities were added (Wienhoven & Nijmeijer, 2019).
Recreational Fisheries. Most Member States have introduced new measures to reduce the pressure on over-exploited stocks, e.g., by requiring the use of specific fishing gear or by introducing temporal and spatial restrictions.
Belgium, for example, has introduced a legal measure that makes it easier to monitor recreational fishing. This national measure goes beyond the requirements of the common fisheries policy and will improve data collection. This on one hand will give a better understanding of the state of fish stocks, but also to regulate certain fishing activities (Vlaams Parlement, 2017). Sweden has developed a web application for reporting gear loss from recreational fisheries. This tool is also used when planning clean up actions of ALDFG to make it more cost-efficient (https://ghostguard.havochvatten.se/ghostguard/).
5.3 - Marine Spatial Planning Directive
As there is a growing competition for maritime space, the European Parliament and the Council have launched a framework for maritime spatial planning, namely the Marine Spatial Planning Directive (Directive 2014/89/EU). By applying this framework, conflicts between sectors should be reduced, encourage investments, increase cross-border cooperation, and also protect the environment. To ensure the sustainable use of marine resources, marine spatial planning should apply the ecosystem approach. The deadline for implementation is 2021 (European Parliament; Council of the European Union, 2014).
Within this framework the Blue Growth Strategy was launched in 2012, which is a long-term strategy aimed to support sustainable growth in the marine and maritime sectors as a whole (European Commission, 2012). One of the key sectors identified is coastal tourism. The strategy stresses member states to address cross-border challenges at the EU-level and promote cooperation, best practice sharing and strategic partnerships. The defined challenges are ‘performance and competitiveness (knowledge, demand volatility, sector fragmentation) ‘skills and innovation’, ‘sustainability’ (environmental pressures, innovative and high-quality offer, insularity and remoteness), and ‘available EU funding’ (European Structural and Investment Funds, research innovation and competitiveness, education, training and culture) (European Commission, 2014).
The European Commission wants to ensure that coastal and maritime tourism is included in other EU policies, like for instance IT connectivity or sustainable transport. Therefore, “cross-cutting policy aspects such as environmental protection, regional development, training, consumer protection and climate change mitigation and adaption policies will be considered” (European Commission, 2014, p.10). In this context, the European Commission highlights the macro-regional strategy for the Atlantic to promote a strong tourism economy and coordinate resources (European Commission, 2014).
5.4 - Bathing Water Directive
The Bathing Water Directive (76/160/ECC) is a directive launched by the EU with the aim that bathing water sites are at least classified as ‘sufficient’. In 2018, 95.4% of all EU bathing water sites reached the minimum water quality standard, representing a slight decrease compared to 2017 with 96.0%. This increase can be explained by adding new bathing water sites, for which insufficient numbers of samples were yet been taken to classify the quality (3.2% unclassified bathing waters). The share of bathing water sites with excellent quality increased to 85.1% (83.3% in 2014), whereas the number of bathing water sites with poor quality decreased to 1.3% (1.4.% in 2017) (EEA, 2018). The improvement in bathing water quality can also be linked to the Urban Waste Water Directive (European Commission, 2019).

Figure 24: Percentage of coastal bathing waters in EU per compliance category; Source: EEA, 2015
For OSPAR, all contracting parties have a high share in coastal bathing sites with excellent water quality. However, some do still have sites with poor quality, namely the UK (3.3%), Ireland (2.9%), France (1.4%), Denmark (1.4%), Sweden (0.8%), Spain (0.5%) and Germany (0.5%) (EEA, 2018). The three contracting parties with the highest share of excellent quality are Belgium (97.6%), Portugal (94.4%) and Spain (92.2%).
| Country | Total number of bathing waters | Excellent quality | Good quality | Sufficient quality | Poor Quality | ||||
|---|---|---|---|---|---|---|---|---|---|
| 2018 | Number | % | Number | % | Number | % | Number | % | |
| Belgium | 42 | 41 | 97.6 | 1 | 2.4 | 0 | 0.0 | 0 | 0.0 |
| Germany | 366 | 313 | 85.5 | 30 | 8.2 | 16 | 4.4 | 2 | 0.5 |
| Denmark | 910 | 790 | 86.8 | 83 | 9.1 | 19 | 2.1 | 13 | 1.4 |
| Spain | 1 965 | 1 812 | 92.2 | 100 | 5.1 | 29 | 1.5 | 9 | 0.5 |
| France | 2 041 | 1 632 | 80.0 | 306 | 15.0 | 62 | 3.0 | 28 | 1.4 |
| Ireland | 136 | 95 | 69.9 | 22 | 16.2 | 12 | 8.8 | 4 | 2.9 |
| Netherlands | 91 | 67 | 73.6 | 19 | 20.9 | 2 | 2.2 | 0 | 0.0 |
| Portugal | 480 | 453 | 94.4 | 16 | 3.3 | 5 | 1.0 | 0 | 0.0 |
| Sweden | 244 | 151 | 61.9 | 61 | 25.0 | 13 | 5.3 | 2 | 0.8 |
| United Kingdom | 628 | 397 | 63.2 | 165 | 26.3 | 43 | 6.8 | 21 | 3.3 |
5.5 - Urban Waste Water Treatment Directive
Discharges of urban wastewater are one of the most serious causes of the pollution of waters by eutrophication. Therefore, the Urban Waste Water Directive (Council Directive 91/271/ECC) was adopted in 1991 with the aim to protect the environment from negative effects of urban wastewater discharges. In 2019, the European Commission evaluated the directive and concluded that it indeed is very effective (European Commission, 2019). However, the European Commission also states that the directive has to be updated, as new issues like pollution through pharmaceuticals and microplastics is on the rise.
OSPAR contracting parties assess the eutrophication status of the North-East Atlantic in a harmonised manner at regular intervals.
5.6 - Single Use Plastic Directive
As plastic has high functionality and is relatively cheap, its use is increasing, leading to big plastic waste generation and also leakage to the environment.
The Single Use Plastic Directive is part of the European Strategy for Plastics in a Circular economy, which was adopted in 2018 and is aiming to transform the way plastic products are designed, used, produced, and recycled in the EU. By the approval of the European Parliament in 2019, single-use plastic items will be banned by of 2021. Therefore, single-use plastic items like cutlery and plates, plastic straws, cotton bud sticks, balloon sticks and oxo-degradable plastics and food containers and expanded polystyrene cups will be banned in the near future.
The European Parliament and Council stress especially the importance to reduce marine litter and highlight the problematic nature of single-use plastic – besides fishing gear – as posing a severe risk to marine ecosystems, biodiversity and human health (European Parliament, The Council, 2019).
5.7 - Natura 2000 and Marine Protected Areas
To preserve the coast, contracting parties have been designating Natura 2000 sites under the Birds Directive (Directive 2009/147/EC) and Habitats Directive (Council Directive 92/43/EEC). All EU members that are OSPAR Contracting Parties have designated terrestrial and marine Natura 2000 sites. In the last QSR2010, terrestrial sites were much larger than marine sites. Within 10 years, a lot of new marine sites were added to the Natura 2000 network, especially by the UK, France, and Spain (in terms of km2). The data shows the status of the Natura 2000 network up until 2019, meaning that the UK is still included in the statistics (EEA, 2018).

Figure 26: Surface covered by Natura 2000 sites in km2 per Contracting Party; Source: EEA, 2018
Marine protected areas (MPAs) are “geographically distinct zones for which protection objectives are set. They constitute a globally connected system for safeguarding biodiversity and maintaining marine ecosystem health and the supply of ecosystem services.” (EEA, 2018, p. 1).
In an EU context, MPAs were established under the Birds and Habitats Directives as part of the Natura 2000 network. Generally, the OSPAR Network of Marine Protected Areas aims to protect, conserve and restore species, habitats and ecological processes; prevent the degradation of these; and protect and conserve areas that best represent the range of species, habitats and ecological processes in the Maritime Area. According to OSPAR’s latest report in 2018, the OSPAR MPA network comprised of 496 MPAs. Together, OSPAR’s MPAs cover 864,337 km2 which is 6.4% of the OSPAR Maritime Area (OSPAR Commission, 2019).
| OSPAR Region | Total Area in km2 | Protected Area by OSPAR MPAs | ||
|---|---|---|---|---|
| In km2 | In % | |||
| I | Arctic Waters | 5 529 716 | 107 109 | 1.9 |
| II | Greater North Sea | 766 624 | 142 489 | 18.6 |
| III | Celtic Seas | 366 459 | 56 167 | 15.3 |
| IV | Bay of Biscay and Iberian Coast | 539 152 | 32 076 | 5.9 |
| V | Wider Atlantic | 6 346 159 | 526 530 | 8.3 |
| TOTAL | 13 548 111 | 864 379 | 6.4 | |
As tourism and recreational benefits are closely linked to the quality of the natural environment, well-managed MPAs can play a role in reconciling economic development and ecosystem protection. Furthermore, MPAs can support the long-term sustainability of the marine and coastal tourism and recreation sector for OSPAR contracting parties (ECORYS, 2013).
Lyme Bay, UK. Lyme Bay, located in the UK – South-west England - is a marine habitat important for conservation, hosting nationally uncommon species and is rich in biodiversity (Hiscock & Breckels, 2007) and a closed area was designated in 2008. Recreational activities like angling, scuba diving or wildlife watching stayed permitted in this closed area. All these activities have in common that they make use of the natural marine resources which stem from biodiversity.
Rees and colleagues (2010) tried to estimate the value of biodiversity for the recreation and leisure industry in Lyme Bay – in monetary and non-monetary terms.
For this, they developed questionnaires for different recreation groups, where recreation hotspots were defined as the non-market value. In monetary terms, the recreational activities combined are estimated to be worth £ 3 943 733 per year in the closed area of Lyme Bay. For the whole Lyme Bay, the authors estimate the marine leisure and recreation industry to be at least £ 17 million of expenditure/turnover annually. The allocation of a monetary value can be used as a tool to influence decision making processes (Rees, Rodwell, Attril, Austen, & Mangi, 2010). The non-monetary valuation – in this case recreation hotspots – is an additional tool to give insights into the relative value of sites for marine leisure and recreation activities. Such information can serve as input for stakeholder discussions on marine spatial planning and may economically justify conservation objectives.
Focusing on the same closed area of Lyme Bay – Gallacher, et al. (2016) evaluated the success of MPAs in terms of biophysics, socioeconomics, and governance by an extensive literature review. The assessed literature shows that through the designation of a closed area, species have increased in abundance and biomass. This increase in turn had a positive impact on the quality of sea anglers and divers experience, which also strengthened the local economy. In terms of governance, shortly after the designation some conflicts with towed gear fishers were present. However, the conflicts declined over time through increased stakeholder involvement in the management process and the recognition of the importance of a closed area (Gallacher, et al., 2016).
For this, they developed questionnaires for different recreation groups, where recreation hotspots were defined as the non-market value. In monetary terms, the recreational activities combined are estimated to be worth £ 3 943 733 per year in the closed area of Lyme Bay. For the whole Lyme Bay, the authors estimate the marine leisure and recreation industry to be at least £ 17 million of expenditure/turnover annually. The allocation of a monetary value can be used as a tool to influence decision making processes (Rees, Rodwell, Attril, Austen, & Mangi, 2010). The non-monetary valuation – in this case recreation hotspots – is an additional tool to give insights into the relative value of sites for marine leisure and recreation activities. Such information can serve as input for stakeholder discussions on marine spatial planning and may economically justify conservation objectives.
Focusing on the same closed area of Lyme Bay – Gallacher, et al. (2016) evaluated the success of MPA in terms of biophysics, socioeconomics, and governance by an extensive literature review. The assessed literature shows that through the designation of a closed area, species have increased in abundance and biomass. This increase in turn had a positive impact on the quality of sea anglers and divers experience, which also strengthened the local economy. In terms of governance, shortly after the designation some conflicts with towed gear fishers were present. However, the conflicts declined over time through increased stakeholder involvement in the management process and the recognition of the importance of a closed area (Gallacher, et al., 2016).
Lundy Island, UK. Another study focusing on the UK studied recreational benefits of an MPA around Lundy Island. To estimate the non-market recreational benefits arising from Lundy Island a travel cost model was used. This method is a revealed preference approach that is based on visitors Willingness To Pay (WTP), by relying on actual market data and human behaviour. The results of the study suggest that there can be considerable recreational benefits generated by MPAs, as the mean consumer surplus for visiting the island was found to be within the range of £359 to £574 per trip. Notably, the designation of a No Take Zone contributed to this higher consumer surplus value, which can offer a strong economic justification for the designation of MPAs for both recreational and conservation purposes (Chae, Wattage, & Pascoe, 2012).
 marine leisure and recreation hotspots in Lyme Bay closed area based on 1 km2 units; (ii) a monetary valuation of three most visited sites in Lyme Bay; (iii) the total estimated value of recreation activity in Lyme Bay closed area per group and aggregated (Rees, Rodwell, Attril, Austen, & Mangi, 2010).")
Figure 27: A monetary and non-monetary valuation of recreation activity in the Lyme Bay closed area, showing (i) marine leisure and recreation hotspots in Lyme Bay closed area based on 1 km2 units; (ii) a monetary valuation of three most visited sites in Lyme Bay; (iii) the total estimated value of recreation activity in Lyme Bay closed area per group and aggregated (Rees, Rodwell, Attril, Austen, & Mangi, 2010).
According to Fletcher et al. (2014), there is clear evidence that the designation and management of MPAs can support nature-based tourism and can be therefore an important part of sustainable use of marine and coastal areas. What is apparent from a study by Potts, is that certain charismatic species (e.g., Atlantic salmon, bottlenose dolphin or common seal) in MPAs can play a key role in providing spiritual and cultural wellbeing, and tourism/nature watching (Potts, et al., 2014), which could strengthen MPAs from a conservation, but also societal and economic perspective.
In general, previous research so far suggests that MPAs can have a positive effect on recreation and tourism, whereas a negative effect on the recreation and tourism industry is hardly ever reported. However, it is still not possible to distinguish whether increased recreation and tourism results from environmental improvements through the MPA, or through a so-called ‘designation effect’, which increased the sites’ reputation. To ensure that recreational activities do not lead to environmental degradation in the MPA – which in turn could also lead to damage to the recreation and tourism industry itself – regulations might have to be put into place (European Commission, 2018). To finance management, enforcement and educational activities, using revenue and fees - which were generated from tourism in the MPA - could be used to help finance the management of MPAs and decrease the input from public funding (Gusmerotti, Marino, & Testa, 2013) (Russi, et al., 2016). In general, to improve recreational and tourism opportunities provided by MPAs, a better understanding of the relationship between user groups and MPAs is still needed (Russi, et al., 2016).
6 - Outlook
Recreation and tourism is a diverse activity, and therefore also exerts various pressures and impacts on the marine environment. Currently, OSPAR does not directly address the recreation and tourism sector per se. However, OSPAR has a lot of other initiatives in place which can be indirectly linked to the pressures and impacts coming from this sector. These other thematic assessments include Underwater noise ,Marine litter , Cumulative effects, Protection of species & habitats, and Hazardous Substances and Eutrophication. Via these other thematic initiatives, pressures and impacts from the recreation and tourism sector could be addressed to a certain extent.
As recreation and tourism is rather a local activity and spatially dispersed, it might be an idea to communicate best practices, share knowledge and expertise among the OSPAR Contracting Parties to reduce pressures and impacts. Within the marine litter issue, there might be potential for OSPAR to address the recreation and tourism sector more specifically in the updated OSPAR Regional Action Plan. However, to what extent this will be necessary is uncertain in the light of the new EU Single Use Plastic Directive.
7 - Conclusion
Key messages1
- Recreation and tourism grew steadily over the past 10 years in and along the coastline of the OSPAR Maritime Area and are important economic activities;
- Recreational and tourism activities can lead to significant pressures and impacts on the coastal and marine environment, including habitat loss and disturbance, spread of invasive species, losses from recreational fishing and various types of pollution. Since this is a sector that is expected to continue to grow in the long term (notwithstanding COVID-19), it will be important to maintain a watch on developments within the relevant OSPAR expert bodies;
- It is still a challenge to arrive at standardised data, both in terms of economics, but also in quantitative environmental information about their impact on marine and coastal ecosystems.
Recreation and tourism are important economic activities for OSPAR Contracting Parties. Since the last QSR in 2010, this sector has increased steadily in all OSPAR Regions, albeit at different rates. Before the COVID-19 outbreak in early 2020, it was expected that this trend would continue until 2030. The sector is associated with environmental pressures and impacts on marine and coastal ecosystems, which likewise vary between the OSPAR Regions.
| OSPAR REGIONS | |||||
|---|---|---|---|---|---|
| I | II | III | IV | V | |
| Relative intensity | L | H | M | H | L |
| Trend since 2010 | ↑ | ↑ | ↔ | ↑ | ↑ |
| Forecast trend to 2030 | ↑ | ↑ | ↔ | ↑ | ↑ |
| Confidence assessment | Medium | High | High | High | Medium |
Distribution and Intensity of Activity
Recreational and tourism activities take place in all OSPAR Regions, however, with considerable differences. If one looks at the regional or local level, differences in distribution are visible, showing that recreational and tourism activities are rather dispersed. In general, however, common recreational activities like going to the beach, walking along the coast, recreational fishing and boating are distributed throughout the OSPAR Maritime Area.
Region II (47%) and Region IV (27%) are the Regions with the highest share of tourist arrivals, followed by Region III (20%), I (6%) and V (>1%). All Regions show a higher concentration of tourist and recreation activities along their coasts. In terms of type of tourism and recreation, great differences can be observed. For instance, recreational boating is highly popular in the Nordic countries, whereas the cruise industry boomed in Portugal, Norway, and Iceland.
Trends within the sector
In the past ten years – since QSR2010 - tourism has grown continuously in all OSPAR Regions, reflecting the overall trend of tourism growth worldwide. However, some Regions experienced stronger growth than others. Regions I, II and IV experienced substantial growth, whereas Region III showed a slight downward trend at the end of this decade. Even though Region V has in absolute numbers a rather small share of tourist arrivals (less than 1% within OSPAR), tourism is increasing.
Estimations would suggest that marine and coastal tourism would continue growing the upcoming decade. However, with the outbreak of COVID-19 in Europe in February 2020, the tourism industry got hard hit – some sub-sectors more than others. Therefore, uncertainties pertain on how the aftermath of the pandemic will influence travel behaviour, and therefore tourism and recreational activities. It could nevertheless be that domestic holidays – “staycations” – could gain increased importance for OSPAR countries. Furthermore, it may be that the crisis creates on opportunity for the already existing niche trends of ‘sustainable’ or ‘eco’ tourism.
Economic value
The economic sector of recreation and tourism is of relative important for OSPAR’s Contracting Parties. However, this economic activity has no separate NACE code, therefore it is more difficult to present relevant data in a uniform matter. Therefore, the numbers found should be treated with caution.
For comparison purposes, Table 19 was created, showing other economic activities within the OSPAR Maritime Area for selected OSPAR Contracting Parties. The numbers for the other sectors shown are taken from the OSPAR Intermediate Assessment 2017. By comparing the numbers, the importance of the recreation and tourism sector is getting visible. Especially in terms of employment (FTE), recreation and tourism show a significantly high number when compared to the other sectors. However, the importance of the sector varies per OSPAR Contracting Party and is of varying relevance throughout the OSPAR Regions.
| Recreation and tourism | Fisheries and Aquaculture | Shipping | ||||
|---|---|---|---|---|---|---|
| GVA (million euro) | FTE | GVA (million euro) | FTE | GVA (million euro) | FTE | |
| Netherlands (Region II) | 2,654 | 30 | 58 | 600 | 1,616 | 9,5 |
| Portugal (Region IV) | 1,66 | 45,95 | 1,223 | 62,395 | 98 | 2,221 |
| Denmark (Region II) | Approx. 2,215 | 32,537 | 184 | 1,289 | 2,9 | 13,76 |
| Ireland (Region III) | 558 | 16 | 259 | 1,03 | 533 | 4,666 |
Pressures and Impacts
The recreation and tourism sector is highly diverse, which directly translates into various forms of pressures and impacts. Recreation and tourism developments lead to physical loss and physical destruction of coastal habitats due to the construction of tourism facilities and infrastructure, both on land and sea. Furthermore, the sector contributes to various types of pollution (water, noise, litter), leading to contamination by hazardous substances, nutrient and organic matter enrichment, and physical disturbance. In addition to that, some sub-types of tourism can lead to biological disturbances, for instance by introducing invasive species.
Measures
Currently, OSPAR does not directly address the recreation and tourism sector within its work. However, it does address various pressures, which also can be associated with this sector. Via its Regional Action Plan on Marine Litter, OSPAR is taking various measures to reduce the issue of marine litter in the North-East Atlantic. Furthermore, OSPAR addresses issues like eutrophication, hazardous substances, biological diversity and the protection of species and habitats. To reduce pressures and impacts from the recreation and tourism sector, OSPAR might address them via other these existing working areas.
1 The views expressed on key points are those of the assessor and do not necessarily represent the views of the OSPAR Commission
References
Ahtiainen, H., Artell, J., Elmgren, R., Hasselström, L., & Hakansson, C. (2014). Baltic Sea nutrient reductions – What should we aim for? Journal of Environmental Management, pp. 9-23.
Alexandrakis, G., Manasakis, C., & Kampanis, N. (2015). Valuating the effects of beach erosion to tourism revenue. A management persepctive. Ocean & Coastal Management, pp. 1-11.
Alvas, B., Ballester, R., Rigall-I-Torrent, R., Ferreira, O., & Benavente, J. (2017). How feasible is coastal management? A social benefit analysis of coastal destination in SW Spain. Tourism Management, 60, pp. 188-200. doi:https://doi.org/10.1016/j.tourman.2016.12.004
AMAP. (2011). Snow, Water, Ice and Permafrost in the Arctic (SWIPA): Climate Change and the Cryosphere. Scientific Assessment Report. Oslo: Arctic Monitoring and Assessment Programme. Retrieved from http://www.amap.no/swipa/
Atkisson, A., Arnbom, T., Tesar, T., & Christensen, A. (2018). Getting it right in a new ocean: Bringing Sustainable Economy Principles into the Artic. Retrieved from https://wwf.panda.org/our_work/oceans/publications/sustainable_blue_economy_reports.cfm
Beatty, C., Fothergill, S., & Gore, T. (2014). Seaside Towns in the Age of Austerity. Sheffield Hallam University.
Beijder, L., Samuels, A., Whitehead, H., & Gales, N. (2006). Interpreting short-term behavioural responses to disturbance within a longitudinal perspective. Animal Behaviour, pp. 1149-1158.
Belgische Staat. (2016). Programma van maatregelen voor de Belgische mariene wateren Kaderrichtlijn Mariene Strategie - Art.13. Brussels: Federale Overheidsdienst Volksgezondheit, Veiligheid van de Voedselketen en Leefmilieu.
Belgische Staat. (2018). Actualisatie van de socio-economische analyse van het gebruik van de Belgische mariene wateren en de aan de aantasting van het mariene milieu verbonden kosten. Kaderrichtlijn Mariene Strategie – Art 8.1.c. Brussels: Overheidsdienst Volksgezondheid, Veiligheid van de Voedselketen en Leefmilieu.
Bentz, J., Dearden, P., & Calado, H. (2013). Strategies for marine wildlife tourism in small islands – the case of the Azores. Journal of Coastal Research, pp. 874-879.
Berner, J., Symon, C., Arris, L., & Heal, O. (2005). Arctic Climate Impact Assessment - Scientific Report. Cambridge, New York: Cambridge University Press. Retrieved from https://www.amap.no/documents/doc/arctic-arctic-climate-impact-assessment/796
BMU. (2018). Zusand der deutschen Nordseegewässer 2018. Bonn: Bundesministerium für Umwelt, Naturschutz und nukleare Sicherheit (BMU).
Braun-Blanquet, J., Braun-Blanquet, G., Rozeira, A., & Pinto da Silva, A. (1972). Résultats de Trois Excursions Géobotaniques à travers le Portugal Septentrional et Moyen. IV. Esquisse sur la végétation dunale. Agron.Lusit., 33, pp. 217-234.
Brida, J. (2010). Cruise tourism: economic, socio-cultural and environmental impacts. International Journal of Leisure and Tourism Marketing.
Carson, R., Hanemann, W., & Wegge, T. (2009). A nested logit model of recreational fishing demand in Alaska. Marine Resource Economics, pp. 101-129.
Cazcarro, I., Hoekstra, A., & Chóliz, J. (2014). The water footprint of tourism in Spain. Tourism Management, pp. 90-101.
Chae, D., Wattage, P., & Pascoe, S. (2012). Recreational benefits from a marine protected area: A travel cost analysis of Lundy. Tourism Management, pp. 871-977.
CLIA. (2018). Europe Market Report. Retrieved from https://cruising.org/-/media/research-updates/research/final-market-report-europe-2018.pdf
CLIA. (2019). Ocean & River Cruise Review 2018. Retrieved from https://www.cruiseexperts.org/media/8467/ocean-and-river-cruise-review-2018.pdf
CLIA. (2020). Duurzaam Milieubeheer. Cruise Lines International Assosciation. Retrieved from https://images.magnetmail.net/images/clients/CLIA/attach/CLIA_ER-Factsheet_June_2020_Dutch.pdf
Coastal Communities Fund. (2016). Coastal Communities Fund: Annual Progress Report 2016. Big Lottery Fund.
Cruise Europe. (2020). Cruise Europe. Retrieved June 8, 2020, from Cruise Europe Destinations: https://www.cruiseeurope.com/destinations/
Davies, B., Pita, C., Lusseau, D., & Hunter, C. (2010). The Value of Tourism Expenditure Related to the East of Scotland Bottlenose Dlophin Population. Aberdeen Centre for Environmental Sustainability.
Defeo, O., McLachlan, A., Schoeman, S., Schlacher, T., Dugan, J., Jones, A., . . . Scapini, F. (2009). Threats to sandy beach ecosystems: a review. Estuarine Coastal and Shelf Science, pp. 1-12.
Dias, J., Cearreta, F., Isla, I., & de Mahiques, M. (2013). Anthropogenic impacts on Iberoamerican coastal areas: historical processes, present challenges, and consequenes for coastal zone management. Ocean Coastal Management, 77, pp. 80-88.
Direction interrégionale de la mer. (2018). Document stratégique de la facade Sud-Atlantique: Annexe 9: Atlas cartographique.
Ecorys. (2012). Scenarios and Drivers for Sustainable Growth from the Oceans, Seas and Coasts. Maritime Sub-Function Profile Report Cruise tourism (4.3). Rotterdam.
Ecorys. (2012). Schoonmaakkosten KRM. Kostenkallen voor opruimen zwerfafval langs de Nederlandse stranden. Rotterdam: Ecorys.
ECORYS. (2013). Study in support of policy measures for coastal and maritime tourism at EU level. Rotterdam/Brussel.
Ecorys. (2015). Study on the competetiveness of the recreational boating sector. Rotterdam/Brussels: ECSIP Consortium. Retrieved from https://ec.europa.eu/growth/tools-databases/vto/content/study-competitiveness-recreational-boating-sector
EEA. (2018). European Bathing Water Quality in 2018. EEA Report No 3/2019.
EEA. (2018). Marine protected areas. EEA.
EEA. (2018). Natura 2000 Barometer. Retrieved from https://www.eea.europa.eu/data-and-maps/dashboards/natura-2000-barometer
EEA. (2019). Marine messages II: Navigating the course towards clean, healthy and productive seas through implementation of an ecosystem-based approach. Copenhagen: Publication Office of the European Union.
EEA. (2020). Imperviousness density in 2015. Retrieved from https://www.eea.europa.eu/data-and-maps/indicators/imperviousness-change-2/assessment
Einarsson, N. (2009). From good to eat to good to watch: whale watching, adaption and change in Icelandic fishing communities. Polar Research, 28(1), pp. 129-38. doi:DOI:10.1111/j.1751-8369.2008.00092.x.
Einarsson, N. (2011). Culture, Conflict and Crises in the Icelandic Fisheries: An Anthropological Study of People, Policy and Marine Resources in the North Atlantic Arctic. Uppsala, Sweden: Uppsula Studies in Cultural Anthropology. Uppsala University.
Elliott, L., White, M., Grellier, J., Rees, S., Waters, R., & Fleming, L. (2018). Recreational visits to marine and coastal environments in England: Where, what, who, why, and when? Marine Policy, pp. 305-314. doi:https://doi.org/10.1016/j.marpol.2018.03.013
ETFI, R. o. (2020). (P. Pachernegg, Interviewer)
European Commission. (2008). Directive 2008/56/EC of the European Parliament and of the Council of 17 June 2008 establishing a framework for community action in the field of marine environmental policy (Marine Strategy Framework Directive) . Official Journal of the European Union.
European Commission. (2012). Blue growth: opportunities for marine and maritime sustainable growth. Official Journal of the European Union.
European Commission. (2012). The implementation of the Soil Thematic Strategy and ongoing activities. Official Journal of the European Union.
European Commission. (2014). A European Strategy for more Growth and Jobs in Coastal and Maritime Tourism.
European Commission. (2016). Study on specific challenges for a sustainable development of coastal and maritime tourism in Europe. EASME. Brussels: European Union.
European Commission. (2017). Commission Directive (EU) 2017/845 of 17 May 2017 amending Directive 2008/56/EC of the European Parliament and of the Council as regards the indicative lists of elements to be taken into account for the preparation of marine strategies. Official Journal of the European Union.
European Commission. (2018). Assessing Member States' programmes of measures under the Marine Strategy Framework Directive.
European Commission. (2018). Study on the economic benefits of Marine Protected Areas: Literature review analysis. Executive Agency for Small and Medium-sized Enterprises, Brussels.
European Commission. (2019). Evaluation of the Urban Waste Water Treatment Directive. European Commission.
European Commission. (2020). Report on implementation of the Marine Strategy Framework Directive (Directive 2008/56/EC). Brussels.
European Commission. (2020). The EU Blue Economy Report 2020. Luxembourg: Publications Office of the European Union.
European MSP Platform. (2019). Conflict fiche 1: Maritime tourism (incl. local communities) and offshore wind. Retrieved from MSP Platform Conflict Fiche 1: Tourism (incl. local communities) and offshore wind.
European Parliament, The Council. (2019). Directive (EU) 2019/904 of the European Parliament and of the Council of 5 June 2019 on the reduction of the impact of certain plastic products on the environment. Official Journal of the European Union.
European Parliament; Council of the European Union. (2014). Directive 2014/89/EU of the European Parliament and of the Council. establishing a framework for maritime spatial planning. Official Journal of the European Union.
European Travel Commission. (2019). European Tourism: Trends & Prospects: Quarterly Report (Q4/2019). Brussels: European Travel Commission.
Eurostat. (2013). Coastal regions: people living along the coastline, integration of NUTS 2010 and latest population grid. European Union.
Faglig Forum. (2019a). Verdiskaping i næringene. Faggrunnlag for oppdatering av forvaltningsplan for Norskehavet og for Nordsjøen-Skagerrak. M-1408.
Faglig Forum. (2019b). Verdiskaping i næringene. Faggrunnlag for revisjon av forvaltningsplanen for Barentshavet og havområdene utenfor Lofoten. M-1178.
Fáilte Ireland. (2013). Watersports - Market Research 2013. Dublin: Fáilte Ireland Publication.
Fernandez-Macho, J., Murillas, A., Ansuategi, A., Escapa, M., Gallastegui, C., Gonzalez, P., . . . Virto, J. (2015). Measuring the maritime economy: Spain in European Atlantic Arc. Marine Policy.
Ferreira, O., Dias, J., Cama, C., & Taborda, R. (1995). Quantification of beach eroson caused by storms on the Portugeuse coast. Directions in Coastal Mangemetn.
Finanzgruppe Sparkassenverband Niedersachsen. (2019). Sparkassen Tourismusbarometer Niedersachsen. Hannover: Sparkassenverband Niedersachsen.
Finn, C. (2017, August 29). 'It is a worry': Tourism Ireland concerned about the fall-off in tourists visiting Ireland in July. thejournal.ie. Retrieved from https://www.thejournal.ie/tourism-ireland-visitor-numbers-3570555-Aug2017/
Fletcher, R., Baulcom, C., Hall, C., & Hussain, S. (2014). Revealing marine cultural ecosystem services in the Black Sea. Marine Policy, 50, pp. 151-161.
Fletcher, Rees, Gall, Shellock, Dodds, & Rodwell. (2014). Assessing the socio-economic benefits of marine protected areas. A report for Natural Resources Wales. Plymouth University: Centre for Marine and Coastal Policy Research.
Fonseca, Pereira da Silva, Calado, Moniz, Bragagnolo, Gil, . . . Moreira. (2014). Coastal and marine protected areas as key elements for tourism in small islands. (C. E. Foundation, Ed.) Journal of Coastal Research, pp. 461-466.
FUR. (2014). 44. Reiseanalyse zur ITB 2014. Kiel: Forschungsgemeinschaft Urlaub und Reisen e.V. (FUR).
Gallacher, J., Simmonds, N., Fellowes, N., Brown, N., Gill, N., Clark, W., . . . Rodwell, L. (2016). Evaluating the success of a marine protected area: A systematic review approach. Journal of Environmental Management, 182(Part 1), pp. 280-293. doi:https://doi.org/10.1016/j.jenvman.2016.08.029
Galloway, T., Cole, M., & Lewis, C. (2017). Interactions of microplastic debris throughout the marine ecosystem. Nature Ecology & Evolution.
Gheskiere, T., Vincx, M., Weslawski, M., Scapini, F., & Degraer, S. (2005). Meiofauna as descriptor of tourism-induced changes at sandy beaches. Marine Environmental Research, 60(2), pp. 245-265.
Gössling, S., Peeters, P., Hall, C., Ceron, J., Dubois, G., Lehmann, L., & Scott, D. (2012). Tourism and water use: Supply, demand, and security. An international review. Tourism Management, pp. 1-15.
Guerreiro, S., & Seguro, P. (2018). 15th Global Forum on Tourism Statistics. Retrieved from Sustainable Tourism Indicators: Monitoring sustainability performance in the Portuguese tourism industry: http://www.15th-tourism-stats-forum.com/pdf/Papers/S2/2_2_Sustainable_tourism_indicators_monitoring_of_sustainability_performance_in_the_tourism_industry_in_Portugal.pdf
Gusmerotti, N., Marino, D., & Testa, F. (2013). Environmental policy tools to improve the management of marine and coastal zones in Italy: the self-financing instruments. Environmental Research Journal, pp. 389-403.
Haab, T., Whitehead, J., & McConnell, K. (2001). The economic value of marine recreational fishing in the Southeast United States: 1997 Southeast eocnomic data analysis. US Department of Commerce, National Oceanic and Atmospheric Administration. Maryland: National Marine Fisheries Service.
Heerschap, N. (2018). 15th Global Forum on Tourism Statistics. Retrieved from Tourism-related employment: importance and its measurement: http://www.15th-tourism-stats-forum.com/pdf/Papers/S5/5_2_Tourism_related_employment_importance_and_its_measurement.pdf
Heiskanen, A., Bonsdorff, E., & Joas, M. (2019). Chapter 20 - Baltic Sea: A Recovering Future From Decades of Eutrophiation. Coasts and Estuaries, pp. 343-362.
Hiscock, K., & Breckels, M. (2007). Marine Biodiversity Hotspots in the UK. A report identifying and protecting areas for marine biodiversity. . WWF UK.
Horlings, E., Schenau, S., Hein, L., Lof, M., de Jongh, L., & Polder, M. (2020). Experimental monetary valuation of ecosystem services and assets in the Netherlands. Wageningen, The Hague: WUR, CBS. Retrieved from https://www.cbs.nl/en-gb/background/2020/04/monetary-valuation-of-ecosystem-services-for-the-netherlands
Hoyt, E. (2005). Sustainable ecotourism on Atlantic islands, with special reference to whale watching, Marine Protected Areas and sanctuaries, for cetaceans. Biology & Environment Proceedings of the Royal Irish Acadamy.
Hyder, K., Radford, Z., Prellezo, R., Weltersbach, M., Lewin, W., Zarauz, L., . . . Strehlow, H. (2017). Research for PECH Committee - Marine recreational and semi-substinence fishing - its value and its impact on fish stocks. Brussels: European Parliament, Policy Department for Structural and Cohesion Policies.
Hynes, S., Aymelek, M., Corless, R., & Evers, N. (2018). A Survey of Marine and Coastal Overseas Tourism Activity in Ireland. The Socio-Economic Marine Research Unit (SEMRU).
ICES. (2019). Working Group on the Effects of Extraction of Marine Sediments on the Marine Ecosystem (WGEXT). ICES Scientific Reports, 87, p. 133. doi:http://doi.org/10.17895/ices.pub.5733
IJben, H. (2019). De eerste stap richting een (nog meer) bewuste toeristische bestemming. Vlissingen: Kenniscentrum Kusttoerisme. Retrieved from https://www.kenniscentrumtoerisme.nl/images/6/6f/Rapportage_inwonersonderzoek_Zeeland_LR.pdf
International Centre for Tourism and Hospitality Research. (2010). The Economic Impact of Wildlife Tourism in Scotland. Bournemouth: International Centre for Tourism and Hospitality Research.
Interwies, E., Görlitz, S., Stöfen, A., Cools, J., van Breusegem, W., Werner, S., & de Vrees, L. (2013). Issue Paper to the 'International Conference on Prevention and Management of Marine Litter in European Seas'. Berlin, Germany.
Jonkvorst, R., Gyimesi, A., Boudewijn, T., & Poot, M. (2013). FASE 1. Kustvogels & zandsuppleties: Overzicht ecologie en voorkomen kustvogels ter voorkoming en mitigatie van effecten zandsuppleties. Culemborg: Bureau Waardenburg bv.
Komossa, F., van der Zanden, E., Schulp, C., & Verburg, P. (2018). Mapping landscape potential for outdoor recreation using different archetypical recreation user groups in the European Union. Ecological Indicators, pp. 105-116.
Lee, S., & Song, J. (2014). Economic Possibilities of Shipping though Northern Sea Route. The Asian Journal of Shipping and Logistics, pp. 415-430.
Leewis, L., van Bodegom, P., Rozema, J., & Janssen, G. (2012). Does beach nourishment have long-term effects on intertidal macroinvertebrate species abundance? Estuarine, Coastal and Shelf Science, pp. 172-181.
Lemelin, R. (2005). Wildlife tourism at the edge of chaos: Complex interactions between humans and polar bears in churchill, Manitoba. In F. Bekers, R. Huebert, H. Fast, M. Manseau, & A. Diduck, Breaking ice: Renewable resource and ocean management in the Canadian North. University of Calgary Press.
LUC. (2016). Scottish Marine Recreation and Tourism Survey 2015. Glasglow: LUC.
Macfadyen, G., Huntington, T., & Cappell, R. (2009). Abandoned, lost or otherwise discarded fishing gear. (UNEP/FAO, Ed.) UNEP Regional Seas Reports and Studies No.185; FAO Fisheries and Aquaculture Technical Paper, No. 523.
Martins, M., Neto, C., & Costa, C. (2013). The meaning of mainland Portugal beaches and dunes psammophilic plant communities: a contribution to tourism management and nature conservation. Journal of Coastal Conservation.
McKenzie, C., Reid, V., Lambert, G., Matheson, K., Minchin, D., Pederson, J., & Brown, L. (2017). Alien Species Alert: Didemnum vexillum Kott, 2002: Invasion, impact, and control. ICES Cooperative Research Report No.355.
Mcllgorm, A., Campbell, H., & Rule, M. (2011). The economic cost and control of marine debris damage in Asia-Pacific region. Ocean Coastal Management, pp. 643-651.
Millennium Ecosystem Assessment Board. (2005). Millenium Ecosystem Assessment. Washington, DC: ISLAND PRESS.
Miller, M., & Auyong, J. (1991). Coastal zone tourism: A potent force affecting environment and society. Marine Policy, pp. 75-99.
Ministère de la Transition écologique. (2019). Eastern Channel - North Sea Sea Basin Strategy document: Summary version. Retrieved from http://www.geolittoral.developpement-durable.gouv.fr/documents-english-version-r549.html
Ministère de la Transition écologique. (2019). North Atlantic Western Channel Sea Basin Strategy Document: Summary version. Retrieved from http://www.geolittoral.developpement-durable.gouv.fr/documents-english-version-r549.html
Ministère de la Transition écologique et solidaire. (2018). Document stratégique de la façade Nord Atlantique - Manche Ouest: Annexe 1: description détaillée des activités et usages de l'espace maritime et littoral. Ministère de la Transition écologique et solidaire. Retrieved from http://geolittoral.din.developpement-durable.gouv.fr/telechargement/dsf/docs_2019_adoptes/Annexe%201_vf.pdf
Ministère de la Transition écologique et solidaire. (2018). South Atlantic Sea Basin Strategy Document: Summary Version. Retrieved from http://www.geolittoral.developpement-durable.gouv.fr/documents-english-version-r549.html
Mouat, J., Lozano, R., & Bateson, H. (2010). Economic Impacts of marine litter. KIMO International.
Mouat, J., Lozano, R., & Bateson, H. (2010). Economic Impacts of Marine Litter. KIMO International. Retrieved from http://www.kimointernational.org/wp/wp-content/uploads/2017/09/KIMO_Economic-Impacts-of-Marine-Litter.pdf
MSC. (2019). Great British Beach Clean: 2019 Report. Herefordshire: MSC. Retrieved from https://www.mcsuk.org/media/mcs-gbbc-2019-report-digital.pdf
NCTA. (2016). 2016 Coastal Tourism: Summary report of challenges and opportunities for growth. Retrieved from https://britishdestinations.files.wordpress.com/2013/10/2016-coastal-tourism-report.pdf
Nelms, S., Coombes, C., Foster, L., Galloway, T., Godley, B., Lindeque, P., & Witt, M. (2017). Marine anthropogenic litter on British beaches: A 10-year nationwide assessment using citizien science data. Science of Total Environment, 579, pp. 1399-1409. doi:https://doi.org/10.1016/j.scitotenv.2016.11.137
Nelms, S., Eyles, L., Godley, B., Richardson, P., Selley, H., Solandt, J., & Witt, M. (2020). Investigating the distribution and regional occurrence of anthropogenic litter in English marine protected areas using 25 years of citizen-science beach clean data. Environmental Pollution, 263. doi:https://doi.org/10.1016/j.envpol.2020.114365
Newman, S., Watkins, E., Farmer, A., Brink, P., & Schweitzer, J. (2015). The Economics of Marine Litter. Marine Anthropogenic Litter, pp. 367-394.
Niedersächsisches Ministerium für Wirtschaft, Arbeit und Verkehr. (2017). Wirtschaftsfaktor Tourismus: Erstes Tourismussatellitenkonto für Niedersachsen. Hannover: Niedersächsisches Ministerium für Wirtschaft, Arbeit und Verkehr.
Nielsen, A., Zhang, J., & Javakhishvili-Larsen, N. (2019). Regional economic effects of coastal and maritime tourism in Denmark. Documentation of the Danish Coastal Tourism Model. Nexo: Centre for Regional and Tourism Research.
NIVA, NINA, Menon Economics, SSB. (2019). Verdier i Oslofjorden: Økonomiske verdier tilknyttet økosystemtjenester fra fjorden og strandsonen. Oslo: Norwegian Institute of Water Research.
NRIT Media; Statistics Netherlands. (2016). Trendrapport toerisme, recreatie en vrije tijd 2016. NRIT Media en CBS.
O'Connor, S., Campbell, R., Cortez, H., & Knowles, T. (2009). Whale Watching Worldwide: tourism numbers, expenditures and expanding economic benefits. Yarmouth MA: Economists at Large.
Office for National Statistics. (2011). Summary: UK Population Projected to Reach 70 Million by MId-2027. Crown. Retrieved from https://webarchive.nationalarchives.gov.uk/20160105223720/http://www.ons.gov.uk/ons/rel/npp/national-population-projections/2010-based-projections/sum-2010-based-national-population-projections.html
Office for National Statistics. (2019). National population projections: 2018-based. Retrieved from https://www.ons.gov.uk/peoplepopulationandcommunity/populationandmigration/populationprojections/bulletins/nationalpopulationprojections/2018based
Orams, :. (2004). Why dolphins may get ulcers: considering the impact of cetacean-based tourism in New Zealand. Tourism in Marine Environments, pp. 17-28.
OSPAR. (2008). Assessment of impacts of tourism and recreational activities. Biodiversity Series.
OSPAR. (2010). The North-East Atlantic Environment Strategy.
OSPAR. (2017). Third integrated report on the eutrohication status of the OSPAR maritime area. London: OSPAR Commission. Retrieved from https://oap.ospar.org/en/ospar-assessments/intermediate-assessment-2017/pressures-human-activities/eutrophication/third-comp-summary-eutrophication/
OSPAR Commission. (2017). 2016 Status Report on the OSPAR Network of Marine Protected Areas. Biodiversity Series. Retrieved from https://oap.ospar.org/en/ospar-assessments/intermediate-assessment-2017/biodiversity-status/marine-protected-areas/
OSPAR Commission. (2017). Abundance and Distribution of Cetaceans in Intermediate Assessment 2017. OSPAR Commission.
OSPAR Commission. (2017). Status and Trends for Heavy Metals (Mercury, Cadmium, and Lead) in Fish and Shellfish. Retrieved from https://oap.ospar.org/en/ospar-assessments/intermediate-assessment-2017/pressures-human-activities/contaminants/metals-fish-shellfish/
OSPAR Commission. (2019). 2018 Status Report on the OSPAR Network of Marine Protected Areas. Biodiversity and Ecosystems Series, London.
OSPAR Commission. (2020, May 12). OSPAR Commission: The North-Eat Atlantic. Retrieved from https://www.ospar.org/convention/the-north-east-atlantic
Parsons, E. (2012). The Negative Impacts of Whale-Watching. Journal of Marine Sciences.
Parsons, E., Warburton, C., & Woods-Ballard, A. (2010). Whalewatching tourists in West Scotland. Journal of Ecotourism, pp. 93-113.
Partlow, J. (2019). Trump Organization ordered to pay $290,000 after losing battle against Scottish wind farm. The Washington Post. Retrieved from https://www.washingtonpost.com/politics/trump-organization-ordered-to-pay-290000-after-losing-battle-against-scottish-wind-farm/2019/11/12/3657cdd4-0561-11ea-ac12-3325d49eacaa_story.html
Pawson, M., Glenn, H., & Padda, G. (2008). The definition of marine recreational fishing in Europe. Marine Policy, 32(3), pp. 339-350.
Phillips, M., & Jones, A. (2006). Erosion and tourism infrastructure in the coastal zone: problems, consequences and management. Tourism Management, pp. 510-535.
Potts, T., Burdon, D., Jackson, E., Atkins, J., Saunders, J., Hastings, E., & Langmead, O. (2014). Do marine protected areas deliver flows of ecosystem services to support human welfare? Marine Policy, pp. 139-148.
Pretwerk, R. o. (2020). (P. Pachernegg, Interviewer)
Raad vor de leefomgeving en infrastructuur. (2019). Waardevol toerisme: onze leefomgeving verdient het. Den Haag.
Readmann, J., & Hiscock, K. (2017). Pink sea fan (Eunicella verrucosa). Marine Life Information Network: Biology and Sensitivity Key Information Reviews. Plymouth: Marine Biological Association of the United Kingdom.
Rees, S., Rodwell, L., Attril, M., Austen, M., & Mangi, S. (2010). The value of marine biodiversity to the leisure and recreation industry and its application to marine spatial planning. Marine Policy, 34(5), pp. 868-875. doi:https://doi.org/10.1016/j.marpol.2010.01.009
Riera, A. (2000). Mass tourism and the demand for protected natural areas. Journal of Environmental Economics and Management, pp. 97-116. doi:https://doi.org/10.1006/jeem.1999.1094
Ruiz, G., & Hewitt, C. (2009). Latitudinal Patterns of Biological Invasions in Marine Ecosystems: A Polar Perspective. Smithsonian at the Poles: Contributions to International Polar Year Science, pp. 347-358.
Russi, D., Pantzar, M., Kettunen, M., Gitti, G., Mutafoglu, K., Kotulak, M., & Brink, P. (2016). Socio-Economic Benefits of the EU Marine Protected Areas. Brussels: Institute for European Environmental Policy.
Ryan, C., Bolin, V., Shirra, L., Garrard, P., Putsey, J., Vines, J., & Hartny-Mills, L. (2018). The development and value of whale-watch tourism in the west of Scotland. Tourism in Marine Environments, pp. 17-24.
s.Pro, & Ecorys. (2018). Technical Study: MSP as a tool to support Blue Growth. Sector Fiche: Coastal and Maritime Tourism. European MSP Platform. Retrieved from https://www.msp-platform.eu/sites/default/files/sector/pdf/mspforbluegrowth_sectorfiche_tourism.pdf
Silva, C., Alves, F., & Rocha, R. (2007). The Management of Beach Carrying Capacity: The case of northern Portugal. Journal of Coastal Research , 50, pp. 135-139.
Smith, E. (2010). Portrait of the South West. (O. f. Statistics, Ed.) Regional Trends, pp. 43-59. doi:https://doi.org/10.1057/rt.2010.4
SOeS; Ministère de l'environnement, de l'énergie et de la mer, en cahrge des relations internationales sur le climat. (2017). La fonction touristique des territoires: facteur de pression ou de préservation de l'environnement? MEEM.
Statistics Netherlands. (2016). Economic description of the Dutch North Sea and Coast: 2005, 2010, 2014. The Hague: Statistics Netherlands.
Swedish Agency for Economic and Regional Growth. (2016). Tourism in Sweden 2015. Stockholm: Swedish Agency for Economic and Regional Growth.
Taveira-Pinto, F. (2004). The practice of coastal zone management in Portugal. Journa of Coastal Conservation, 10, pp. 147-158.
The Ocean Conservancy. (2002). Cruise Control. A Report on How Cruise Ships Affect the Marine Environment. Washington.
Tourismusverband Schelswig-Holstein. (2019). Sparkassen-Tourismusbarometer Schelswig-Holstein. Jahresbericht 2019. Sparkassen- und Giroverband für Schelswig-Holstein.
Tweede Kamer. (2017). Het Kustpact. Brief van de minister van Infrastructuur en Milieu an de voorzitter van de Tweede Kamer, 21 februari 2017. (Vergaderjaar 2016-2017, 29 383, nr. 278). Den Haag.
UN, European Commission, Food and Agriculture Organisation, International Monetary Fund, OECD, & World Bank. (2014). System of Environmental-Economic Accouting - Central Framework (SEEA CF). New York.
United Nations. (2008). International Recommendations for Tourism Statistics. Department of Economic and Social Affairs.
United Nations. (2014). The World Population Situation in 2014. New York. Retrieved from https://www.un.org/en/development/desa/population/publications/pdf/trends/Concise%20Report%20on%20the%20World%20Population%20Situation%202014/en.pdf
Verleye, T., & van Winsen, F. (2016). Protocol 'recreatieve zeevisserijmonitoring'. ILVO.VLIZ publicatie 001.
Visit Svalbard. (2020). Visit Svalbard. Polar Bear, The King of the Arctic. Retrieved June 9, 2020, from https://en.visitsvalbard.com/visitor-information/polar-bears
Vlaams Parlement. (2017). Verslag namens de Commissie voor Landbouw, Visserij en Plattelandsbeleid uitgebracht door Sofie Joosen over het vorstell resolutie betreffende monitoring en regelgeving van de recreatieve zeevisserij. Commissie voor Landbouw, Visserij en Plattelandsbeleid.
WDC. (2019). A Guide to Responsible Whale Watching. Whale and Dolphin Conservation. Retrieved from https://uk.whales.org/wp-content/uploads/sites/6/2019/05/wdc-responsible-whale-watching-guide-2019.pdf
Westtoer apb. (2017). Trendrapport Kust 2016-2017. Brugge.
White, M., Smith, A., Humphryes, K., Pahl, S., Cracknell, D., & Depledge, M. (2010). Blue space: The importance of water for preference, affect, and restorativeness ratings of natural and built scenes. Journal of Environmental Psychology, pp. 482-493. doi:doi:10.1016/j.jenvp.2010.04.004
Wienhoven, M., & Nijmeijer, C. (2019). Evaluatie Green Deals Zwerfafval in zee. Deventer: Witteveen+Bos Raadgevende ingenieurs B.V.
Williams, A., Buitrago, N., Anfuso, G., Cervantes, O., & Botero, C. (2016). Litter impacts on scenery and tourism on the Colombian north Caribbean coast. Tourism Management, pp. 1-16.
Williams, A., Randerson, P., Giacomo, C., Anfuso, G., Macias, A., & Perales, J. (2016). Distribution of beach litter along the coastline of Cádiz, Spain. Marine Pollution Bulletin, pp. 77-87.
Wilson, V., & Seddon, B. (2018). Scotland's People and Nature Survey 2017/18 - outdoor recreation and health modules. Scottish Natural heritage Research Report No. 1062.
World Tourism Organisation. (2020). UNWTO. Retrieved April 2020, from https://www.unwto.org/glossary-tourism-terms
World Tourism Organization. (2019). International Tourism Highlights, 2019 Edition.
Worm, B., Barbier, E., Beaumont, N., Duffy, E., Folke, C., Halpern, B., . . . Watson, R. (2006). Impacts of Biodiversity Loss on Ocean Ecosystem Services. Science, 314, pp. 787-790. doi:DOI: 10.1126/science.1132294
Wyles, J., Pahl, S., Holland, M., & Thompson, R. (2016). Can Beach Cleans Do More Than Clean-Up Litter? Comparing Beach Cleans to Other Coastal Activities. Environment and Behaviour, pp. 509-535. doi:DOI: 10.1177/0013916516649412
Wyles, K., Pahl, S., Thomas, K., & Thompson, R. (2016). Factors That Can Undermine the Psychological Benefits of Coastal Environments: Exploring the Effect of Tidal State, Presence, and Type of Litter. Environmental Behaviour, pp. 1095-1126. doi:doi: 10.1177/0013916515592177
Zhang, Y., Meng, Q., & Ng, S. (2016). Shipping efficiency comparison between Northern Sea Route and the conventional Asia-Europe shipping route via Suez Canal. Journal of Transport Geography, pp. 241-249.
Acknowledgements
The report was written within the course of an internship at Rijkswaterstaat; with the support of several people. First of all, I would like to thank the team of the advisory board on economic analyses (Steuntpunt Econimische Expertise; SEE) of Rijkswaterstaat, who gave me general feedback on the report. Secondly, I want to thank all people from OSPAR ICG-ESA (Intersessional Correspondence Group of Economic & Social Analysis), who provided me information, suggestions, and feedback, which contributed to the quality of the report. Also, I would like to thank the members of the JAMP B14 project, which provided me with final feedback. Here, I would like to thank especially Philip Stamp from the OSPAR Secretariat, who guided me in certain parts of the report and other parts of the internship. Lastly, I would like to give special thanks to my supervisor from Rijkswaterstaat, Rob van der Veeren. He guided me through the whole process of writing this report by sharing his knowledge and expertise. Also, he organised several meetings with interesting people from this field, which in turn resulted in a lot of input for this report. Overall, the internship has taught me a lot professionally and personally, not only about recreation, tourism, and its environmental impacts, but especially to work within a Dutch and international network.