

Eutrophication state of the OSPAR Maritime Area
Overall eutrophication assessment results are summarised per assessment area category (river plumes/variable salinity, coastal, shelf and oceanic areas) and OSPAR Region (Table S.1). These categories have also been used in the pelagic habitat and food web assessments to enable alignment of the indicator and thematic assessments, thereby supporting consistency across the assessments in accordance with QSR 2023 and MSFD requirements.
The Good and High classifications are merged into Good status (also termed non-problem areas in the Common Procedure Agreement), while moderate, poor and bad results are considered to be Not Good (also termed problem areas in the Common Procedure Agreement) . The overall eutrophication status per area category and OSPAR Region was determined following the one-out-all-out principle. The assessment was carried out with the fully automated assessment tool COMPEAT. Information on the status classification of assessment areas, by category and Region, is included in Table S.1 to support the interpretation of the overall result, with the different percentages indicating numbers of areas in moderate or worse status where improvements are still required in order to reach Good status.
Table S.1: Overall status of eutrophication per OSPAR Region. N/A = not assessed. No or minimal changes are expected until 2030 assuming the current rate of load reduction continues. Ongoing efforts of reducing riverine and atmospheric nutrient inputs (e.g. WFD and MSFD programmes of measures, EU NEC Directive) can improve this trajectory
| Overall status | ||||||||
| Area Category | Arctic Waters | Greater North Sea | Celtic Seas | Bay of Biscay and Iberian Coast | Wider Atlantic | |||
| Status 2020 Percentage of areas in moderate or worse status | Predicted status in 2030 | Status 2020 Percentage of areas in moderate or worse status | Predicted status in 2030 | Status 2020 Percentage of areas in moderate or worse status | Predicted status in 2030 | |||
| River plumes | N/A | 67% | No change | 0% | No change | 67% | No change | N/A |
| Coastal | N/A | 42% | No change | 0% | No change | 0% | No change | N/A |
| Shelf | N/A | 10% | No change | 0% | No change | 40% | No change | N/A |
| Oceanic | N/A | - | - | 0% | No change | N/A | ||
| Overall statement | N/A | N/A | ||||||
In most assessment areas and categories, good status was achieved, indicating non-problem areas according to the Common Procedure. However, the overall not-good status of river plumes in Regions II and IV emphasises further need to reduce eutrophication effects. Whilst most coastal areas were assessed as good, the relatively high proportion of coastal areas in Region II that did not achieve good status clearly shows that these areas also require further improvement.
Along with the status assessment of eutrophication, a data-driven confidence assessment was conducted with the COMPEAT tool. The confidence assessment considers temporal, spatial and accuracy aspects per indicator (see Annex 13 in the Common Procedure) and is combined into an overall confidence result in the integration process of COMPEAT using three different levels of high, moderate and low confidence . The resulting overall confidence level was either moderate or even high in all OSPAR Regions, as shown in Figure S.1 along with the status assessment.
For this thematic assessment, the confidence assessment was conducted according to the recommendation in the QSR Guidance to be comparable with other thematic assessments (Table S.2). The overall confidence score for each OSPAR Region was assessed by considering the type, amount, quality, and consistency of evidence (using the classifications Robust, Medium, or Limited) and the degree of agreement (using the classifications High, Medium, or Low) in the results of the indicator assessments (see Annex 1 in the QSR 2023 Guidance Document).
Table S.2: Confidence assessment results for OSPAR Regions II, III and IV. Regions I and V were not assessed
| OSPAR Region | Arctic Waters (Region I) | Greater North Sea (Region II) | Celtic Seas (Region III) | Bay of Biscay and Iberian Coast (Region IV) | Wider Atlantic (Region V) |
|---|---|---|---|---|---|
| Confidence | Not assessed | High | High | Medium | Not assessed |
The overall confidence results per OSPAR Region were based on estimates of the agreement of and evidence for the different indicators, as shown in Table S.3. For the agreement, it was considered whether the indicator results were in line, i.e. showing similar trends and developments in concentrations over time among the different area categories. Other assessment outcomes were also reflected in the estimates where relevant, for example nutrient inputs and pelagic habitat assessment results. The evidence estimates were mainly based on underlying data coverage (temporal and spatial confidence) informed by the confidence assessment results from the different indicator assessments as calculated with the COMPEAT tool.
Table S.3: Confidence assessment of the type, amount, quality, and consistency of evidence (Robust, Medium or Limited), and the degree of agreement in the results (High, Medium or Low) for the common indicators used in the eutrophication assessment in OSPAR Regions II, III and IV. Regions I and V were not assessed
| Criteria | Nutrients (DIN, DIP) | Chlorophyll | Oxygen | |
|---|---|---|---|---|
| Arctic Waters (Region I) | Agreement | Not assessed | Not assessed | Not assessed |
| Evidence | Not assessed | Not assessed | Not assessed | |
| Greater North Sea (Region II) | Agreement | High | High | Medium |
| Evidence | Medium | Robust | Medium | |
| Celtic Seas (Region III) | Agreement | High | High | Medium |
| Evidence | Medium | Robust | Medium | |
| Bay of Biscay and Iberian Coast (Region IV) | Agreement | High | High | Medium |
| Evidence | Limited | Robust | Limited | |
| Wider Atlantic (Region V) | Agreement | Not assessed | Not assessed | Not assessed |
| Evidence | Not assessed | Not assessed | Not assessed |
Assessment of eutrophication using COMPEAT
The assessment of eutrophication status is based on the degree of nutrient enrichment (Category I), the direct effects of nutrient enrichment (Category II) and the indirect effects of nutrient enrichment (Category III). For Category I, the Nutrients common indicator looks at winter mean concentrations of dissolved inorganic phosphorus (DIP) and dissolved inorganic nitrogen (DIN). For Category II, the Chlorophyll common indicator looks at growing season mean concentrations of chlorophyll. For Category III, the Dissolved Oxygen common indicator looks at oxygen concentrations near the seafloor. The overall result of the assessment depends on the outcome of the direct and indirect effects (Categories II, III), following the one-out-all-out principle. The degree of nutrient enrichment is not considered in the overall eutrophication result.
Here, we first provide an overview of the final results of the integrated assessment and a comparison of the assessment for the four different COMP periods, followed by an overview of more detailed results for each common indicator.
Integrated eutrophication assessment results
The three above-mentioned common indicators were integrated into the overall eutrophication assessment result following the assessment rules described above.
The final outcome for the COMP4 period is shown in Figure S.1, accompanied by the overall confidence assessment.

Figure S.1: Eutrophication assessment result for the COMP4 period 2015-2020 (left) and overall confidence assessment based on spatial and temporal data coverage and accuracy as calculated in COMPEAT (right)
Assessment areas with moderate or worse status were mainly detected in the South-eastern North Sea and in river plumes along the continental coast from Belgium up to Denmark and the Kattegat (Table S.4).
Table S.4: Summary table of the eutrophication assessment for COMP4, showing only the assessment areas where at least one of the common indicators did not achieve good status
| Category | Unit code | Description | DIN | DIP | Chlorophyll | Dissolved oxygen | Final assessment |
|---|---|---|---|---|---|---|---|
| Plume | ADPM | Adour plume | Good | Moderate | Moderate | ||
| Coastal | ELPM | Elbe plume | Poor | Moderate | Poor | Good | Poor |
| EMPM | Ems plume | Poor | Good | Moderate | Good | Moderate | |
| GDPM | Gironde plume | High | Moderate | Moderate | |||
| MPM | Meuse plume | Moderate | High | Poor | Good | Poor | |
| RHPM | Rhine plume | Poor | High | Moderate | Good | Moderate | |
| SCHPM1 | Scheldt plume 1 | Poor | High | Bad | Good | Bad | |
| SCHPM2 | Scheldt plume 2 | High | High | Moderate | Good | Moderate | |
| SHPM | Shannon plume | Poor | High | High | Good | Good | |
| CFR | Coastal FR channel | Good | Moderate | Moderate | High | Moderate | |
| Shelf | CWAC | Coastal Waters AC (D5) | Moderate | High | High | High | |
| GBC | German Bight Central | Poor | Good | Moderate | Good | Moderate | |
| KC | Kattegat Coastal | Poor | Moderate | Poor | Poor | Poor | |
| KD | Kattegat Deep | Moderate | Moderate | Moderate | Moderate | Moderate | |
| OC DEDK | Outer coastal DEDK | Moderate | Good | Poor | Good | Poor | |
| ENS | Eastern North Sea | High | High | Good | Moderate | Moderate | |
| GBCW | Gulf of Biscay coastal waters | High | Moderate | Moderate | |||
| GBSW | Gulf of Biscay shelf waters | High | Moderate | Moderate | |||
| SK | Skagerrak | Moderate | High | Good | Good | Good |
In a data-driven confidence assessment conducted with the COMPEAT tool, all indicators applied in the assessment are considered, using different aspects for temporal and spatial confidence, as well as accuracy, to estimate the probability of correct classification in relation to the respective thresholds. The confidence assessment is based on three classifications resulting from averaging of the different confidence aspects. In most areas, confidence scores were high or moderate and only in certain river plume areas was the confidence low. However, agreement is needed for a separate assessment of confidence in offshore areas, previously only assessed using a screening procedure, because the available data are not collected in the same way as in the more established eutrophication-sensitive areas, which are assessed according to the CEMP Guidelines for coordinated monitoring for eutrophication, CAMP and RID (OSPAR, 2021).
The eutrophication assessment was performed with COMPEAT for the first time for the most recent COMP4 period (2015-2020) and also retrospectively for the previous assessment periods COMP1 (1990-2000), COMP2 (2001-2006) and COMP3 (2006-2014). The agreed assessment areas and thresholds for applying COMP4 were also used to assess previous periods so as to identify developments over time, as illustrated in Figure S.2.

Figure S.2: Eutrophication assessment results for all assessment periods of COMP1 (1990-2000), COMP2 (2001-2006), COMP3 (2006-2014) and COMP4 (2015-2020) covering a time span of 30 years
Comparison of the four different COMP periods shows a gradual decrease in the number and total surface area of assessment areas that do not achieve Good status. The areas that have been designated as moderate, poor or bad have decreased for DIN, DIP and Chl-a, but are increasing in overall area for DO (Figure S.3). Total surface area showed a more continuous decrease for DIN, but the development was different for DIP, which experienced an increase during the COMP2 and COMP3 periods, with a final surface area in not-good status in the most recent period of COMP4. Since the first COMP assessment, the total surface area of assessment areas where chlorophyll concentrations exceed thresholds has decreased, notably in coastal and shelf assessment areas. However, no change has been observed since the period 2006-2014. It should be noted that in the COMP1 period, the satellite data used for the Chlorophyll common indicator only became available from 1998 onwards. The chlorophyll assessment for the COMP1 period was therefore mainly determined by in situ data which increases the uncertainty of the assessment, notably because of low spatial confidence in offshore areas such as the Northern North Sea. Changes in the main data source for chlorophyll may, over time, have driven some of the changes observed in the overall eutrophication assessment, notably from COMP1 to COMP2. The surface area of assessment areas that do not achieve good status for DO has increased, from COMP1 (16 657 km2) and COMP2 (98 318 km2) to a maximum in COMP3 of 337 696 km2, reducing to 110 261 km2 in the current COMP4.
Surface area in moderate, poor or bad status for DIN
Surface area in moderate, poor or bad status for Chlorophyll
Surface area in moderate, poor or bad status for DIP
Surface area in moderate, poor or bad status for Dissolved Oxygen
Figure S.3: Changes in the surface areas (km2) for areas in moderate, poor or bad status presented for each indicator and separated into oceanic, shelf, coastal and plume areas
Category I – Degree of nutrient enrichment
Winter nutrient concentrations :
- The Winter Nutrient Concentrations common indicator assesses whether nutrient levels of dissolved inorganic nitrogen (DIN) and dissolved inorganic phosphorus (DIP) are elevated and may cause undesirable disturbances such as accelerated growth of algae, including shifts in the composition and extent of flora and fauna. Winter mean concentrations of DIN and DIP have continued to decrease since QSR 2010, mainly in river plumes and coastal areas. In the most recent assessment period 2015-2020, twelve assessment areas were assessed as moderate or poor for DIN, mostly in OSPAR Region II, while for DIP only four assessment areas were classified as being in Not-good status (Figure S.4). The total surface areas in not-good status for the period 2015-2020 are 63 537 km2 for DIN and 29 603 km2 for DIP. Broken down for the different area categories, this corresponds to 61% of the river plumes, 24% of the coastal waters and less than 1% of the shelf waters in the assessed OSPAR area (surface area km2) not being in good status for DIN. For DIP, 38% of the river plumes and 11% of the coastal waters were in Not-good status. Most of the areas in moderate or worse status for DIN were found along the continental coast from France to Denmark/Sweden in several river plumes (e.g. Scheldt, Meuse, Rhine, Ems and Elbe) and coastal areas (e.g. German Bight central and Kattegat). Most of the areas with elevated DIN concentrations along the continental coast from Belgium to Denmark also showed chlorophyll concentrations above thresholds (cf. Table S.3).
- The development of areas in not-good status for DIN and DIP during the different COMP periods from 1990-2020 and the corresponding surface area in km2 are illustrated in Figure S.2. While the number of these areas as well as their total surface area showed a more continuous decrease for DIN, the development was different for DIP, which experienced an increase during the COMP2 and COMP3 periods, with a final very low number of areas in not-good status in the most recent period COMP4. The increased DIP in the areas with moderate or worse status during the COMP2 and COMP3 periods was mainly due to increases in shelf areas, in particular in the Eastern North Sea and some Channel areas, leading to a significant increase in the surface area in not-good status. Between COMP3 and COMP4, DIP concentrations decreased substantially both in coastal and shelf areas in the Southern and South-eastern North Sea.
Number of areas in moderate, poor or bad status for DIN
Number of areas in moderate, poor or bad status for DIP
Surface area in moderate, poor or bad status for DIN
Surface area in moderate, poor or bad status for DIP
- Trend assessments for the period 1990-2020 showed significant decreases for DIN in the Meuse and Rhine plumes. Decreasing DIN concentrations were also observed in other river plumes, but these were not statistically significant. Assessment areas with DIP concentrations above the threshold, leading to a moderate status classification, were all located in OSPAR Region II (Kattegat, Elbe plume and French Coastal Channel). Only in the Elbe plume was a significant decreasing trend for DIP identified, while the decreasing developments observed in other areas were not statistically significant.
Figure S.5: Assessment results of winter DIN for the period 2015-2020 in OSPAR Regions II, III and IV. Available at: ODIMS
Figure S.6: Assessment results of winter DIP for the period 2015-2020 in OSPAR Regions II, III and IV. Available at: ODIMS
- The development of winter DIN (Figure S.5) and DIP (Figure S.6) concentrations during the different assessment periods of COMP1 (1990-2000), COMP2 (2001-2006), COMP3 (2006-2014) and COMP4 (2015-2020) is reflected in the changing status classifications over time in certain areas, as illustrated in Figure S.7, Figure S.8, Figure S.9 and Figure S.10. In the automated assessment tool COMPEAT, retrospective assessment of previous COMP periods was applied by using the thresholds and assessment areas defined for the application of COMP4, in order to allow for a comparable assessment. These results are therefore not directly comparable with the previous OSPAR eutrophication assessment results summarised in the integrated reports, since they are based on different assessment areas and national thresholds. In general, the last 30 years have seen a decrease in nutrient input, as reflected in a decrease in DIN and DIP concentrations. Improved status classifications were thus observed in most of the assessment areas over the same period. This shows the effectiveness of the measures used to improve the status of marine ecosystems. However, there are exceptions showing interim increases, and in many areas the decreases in DIN and DIP concentrations have ceased over the last decade. As we know that there is a considerable time lag - probably decades – before ecosystems recover fully from eutrophication following a decrease in DIN and DIP concentrations, there is an urgent need for stronger measures if the OSPAR goal of good status by 2030 is to be achieved.
Figure S.7: Assessment results of winter DIN for all assessment periods of COMP1 (1990-2000), COMP2 (2001-2006), COMP3 (2006-2014) and COMP4 (2015-2020)

Figure S.8: Estimate of overall confidence for winter DIN for all assessment periods of COMP1 (1990-2000), COMP2 (2001-2006), COMP3 (2006-2014) and COMP4 (2015-2020)
Figure S.9: Assessment results of winter DIP for all assessment periods of COMP1 (1990-2000), COMP2 (2001-2006), COMP3 (2006-2014) and COMP4 (2015-2020)
Figure S.10: Estimate of overall confidence for winter DIP for all assessment periods of COMP1 (1990-2000), COMP2 (2001-2006), COMP3 (2006-2014) and COMP4 (2015-2020)
Category II – Direct effects of nutrient enrichment
Growing season concentrations of chlorophyll-a
- The Chlorophyll-a common indicator is a proxy for phytoplankton biomass. Chlorophyll is traditionally measured in situ but, given the variability in space and time of this indicator, the results of in situ sampling are often insufficient for detecting spatial patterns. Particularly in offshore areas, in situ sampling is very sparse. By using ‘ocean colour’, satellites can detect chlorophyll at a much higher temporal and spatial resolution and at relatively low costs per observation. Chlorophyll-a concentrations were thus assessed in all COMP4 assessment areas of OSPAR Regions II, III and IV (Greater North Sea, Celtic Seas, Bay of Biscay and Iberian Coast). For the first time, the assessment was based not only on in situ data but also on the Earth Observation (satellite) data available for 1998 onwards. The combination of in situ data and satellite data used in the assessment follows the methods described in the revision of the Common Procedure (OSPAR, 2022).
- For the most recent period 2015-2020, eleven assessment areas (Figure S.11), all in OSPAR Region II, are in moderate, poor or bad status (i.e. with concentrations above the threshold). Those areas along the continental coast from France to Denmark/Sweden are either river plumes (Scheldt, Meuse, Rhine, Ems, Elbe) or coastal waters (Coastal French Channel, German Bight, Coastal DEDK and Kattegat Coastal and Kattegat Deep).
- Five of the river plume assessment areas with chlorophyll concentrations above the threshold also have DIN concentrations exceeding the threshold. In one case, data are missing. In the Elbe plume, both DIN and DIP concentrations are above the threshold. The five coastal water assessment areas with chlorophyll concentrations above the threshold also have DIN and/or DIP concentrations above the threshold.
Figure S.11: Results of the COMP4 assessment of chlorophyll growing season mean, based on the combination of in situ and satellite data, for OSPAR Regions II, III and IV. Available at: ODIMS
- Since the first COMP assessment, the number and total surface area of assessment areas with chlorophyll concentrations exceeding thresholds have decreased, notably in coastal and shelf assessment areas. However, no change has been observed since the period 2006-2014 (see Figure S.12).
River plumes
Shelf areas
Coastal waters
Oceanic waters
Figure S.12: Percentage of the surface area of river plumes, coastal waters, shelf areas and oceanic waters with bad, poor or moderate status (red) or good or high status (green) in the COMP1, COMP2, COMP3 and COMP4 assessment periods. Grey bars indicate assessment areas with missing data.
For the period 2015-2020, the total surface area not in good/high status is 57 304 km2 or 2,2% of the total assessed surface area. However, this low percentage reflects the vast areas of open ocean where eutrophication is absent. Split up over the different categories, 46% of the surface area of river plumes and 22% of the surface area of coastal areas is not in good/high status.
- A trend analysis of the growing season means in each assessment area was conducted and regression analyses done for the periods 1990-2020 (for in situ data) and 1998-2020 (for satellite data). The five coastal waters assessment areas that were classified as moderate, poor or bad in status (i.e. with concentrations above the threshold) for chlorophyll show significant decreasing trends in concentrations (whether Earth Observation or in situ data) over the last 25 to 30 years. These areas are all in coastal waters: Coastal French Channel, Outer Coastal DEDK, German Bight Central, Kattegat Coastal and Kattegat Deep. For some areas, for example Kattegat Coastal and Kattegat Deep, there is an increasing trend over approximately the last ten years. The nutrient concentrations in those areas (whether DIN or DIP) did not show a significant trend, possibly due to limited data availability in some of the areas (Figure S.13 and Figure S.14).
- The river plume assessment areas classified as moderate, poor or bad in status did not show trends in chlorophyll concentrations despite decreasing trends in nutrients in some cases (DIN: Rhine, Meuse; DIP: Elbe). The lack of response by chlorophyll concentrations to decreasing nutrient concentrations may be partly due to high interannual variability in chlorophyll concentrations but may also point to nutrient concentrations which are still so high that phytoplankton growth is not limited by nutrient availability, and to ecological time lags between nutrient reduction and a measurable ecological response. The biomass of grazers can also control the biomass of phytoplankton, such that the chlorophyll concentration does not respond linearly to decreasing nutrient concentrations. Light availability also influences plankton community structure and the associated chlorophyll concentrations. In general, a time lag of decades is expected between a decrease in nutrient inputs and a full positive response from the biological system. Therefore, continuous, substantial reductions in nutrient inputs are needed in order to meet the OSPAR strategic objective with regard to eutrophication and achieve and maintain a healthy marine environment where anthropogenic eutrophication does not occur.
Figure S.13: Assessment results of Chlorophyll for the assessment periods of COMP1 (1990-2000), COMP2 (2001-2006), COMP3 (2006-2014) and COMP4 (2015-2020). Note that in COMP1 the chlorophyll concentrations are mainly based on in situ sampling, which is less reliable in offshore waters (e.g. Northern North Sea), owing to low spatial confidence. This may partly explain the apparent changes seen between COMP1 and COMP2.
Figure S.14: Estimate of overall confidence for Chlorophyll for all assessment periods of COMP1 (1990-2000), COMP2 (2001-2006), COMP3 (2006-2014) and COMP4 (2015-2020)
Category III - Indirect effects of nutrient enrichment
Concentrations of dissolved oxygen near the seafloor
- The Dissolved Oxygen common indicator looks at the effects of nutrient enrichment and increased algal production on the concentrations of dissolved oxygen in the water column near the seafloor.
- All but seven assessment areas have been classified as having good or high status, based on the mean 5th percentile value of dissolved oxygen being greater or equal to a threshold value of 6,0 mg/L for the period 2015-2020. The seven assessment areas in question are: Adour plume (4,4 mg/L), Kattegat Coastal (3,92 mg/L), Kattegat Deep (4,70 mg/L), Eastern North Sea (5,69 mg/L), Gironde plume (5.3 mg/L), Gulf of Biscay coastal (5,56 mg/L) and Gulf of Biscay shelf waters (5,86 mg/L) (Figure S.15).
- The trend analysis was carried out on data for the period 1990 to 2020 (Figure S.16). Many of the assessment areas had sufficient long-term data (52 out of 64) to apply a trend assessment. Out of those 52 areas, one coastal area showed an increasing trend (Kattegat Coastal). The areas with decreasing trends for dissolved oxygen included two in river plumes (Meuse, Scheldt), two in shelf areas (Norwegian Trench, Atlantic Seasonally Stratified) and one in oceanic areas (Atlantic). The Thames plume also showed a decreasing trend, but it was not significant. Note that, in contrast to the other eutrophication common indicators, an increasing trend reflects an improving status, while a decreasing trend signifies that the status is deteriorating.

Figure S.15: Results of the COMP4 assessment for dissolved oxygen for OSPAR Regions II, III and IV. Available at: ODIMS
- The assessment results for the previous COMP periods, with application of the COMP4 thresholds, are shown in Figure S.17. In the COMP1 period (1990-2000), four assessment areas were classified as having moderate, poor or bad status, out of 36 areas. The assessment areas with eutrophication problems were mainly found in OSPAR Region II, namely Kattegat Coastal and Kattegat Deep, and also the Noratlantic Area NOR-NorC2 and Sudatlantic Area SUD-C1 in OSPAR Region IV. However, for the latter area the spatial and temporal confidence of the assessment is classified as low.
- In the COMP2 period (2001-2006) five out of 34 assessment areas were in moderate, poor or bad status, including Kattegat Coastal, Kattegat Deep, Eastern North Sea, German Bight and Coastal DEDK. In the COMP3 period (2006-2014) this was the case for eight out of 31 assessment areas. These comprise Kattegat Coastal, Kattegat Deep, Eastern North Sea, German Bight Central and Coastal DEDK again, with the addition of Atlantic Seasonally Stratified, Channel Well-mixed Tidal Influenced, and Ems plume. In summary, the recurrent pattern over the entire period from 1990 to 2020 is that in OSPAR Region II a number of assessment areas are repeatedly classified as having moderate, poor or bad status. The oxygen concentrations show high spatial variability and are better assessed using a gridded approach, as was applied in the common indicator assessment.
Figure S.16: Assessment results of Dissolved Oxygen (5th percentile) for all assessment periods of COMP1 (1990-2000), COMP2 (2001-2006), COMP3 (2006-2014) and COMP4 (2015-2020)

Figure S.17: Estimate of overall confidence for Dissolved Oxygen for all assessment periods of COMP1 (1990-2000), COMP2 (2001-2006), COMP3 (2006-2014) and COMP4 (2015-2020)
- These changes in assessment outcomes for dissolved oxygen are shown in terms of the number of assessment areas and amount of surface area identified as having moderate, poor or bad outcomes for each of the COMP periods (Figure S.18). The number of assessment areas identified as moderate, poor or bad increased between COMP1 (4 areas), COMP2 (5 areas), COMP3 (8 areas) and COMP4 (7 areas). The surface area covered has also increased, from COMP1 (16 657 km2) and COMP2 (98 318km2) to a maximum in COMP3 of 337 696 km2, reducing to 110 261 km2 in the current COMP4. The peak in COMP3 was influenced by the inclusion of the large Atlantic Seasonally Stratified area (5th percentile value = 5,79mg/L). However, confidence in the assessment for this area in COMP3 is low. Moreover, confidence in the dissolved oxygen assessments is low for the majority of the assessment areas, in all four COMP periods. This is particularly relevant for offshore areas with large data gaps and the plume areas with limited monitoring. Increased surveillance of these areas, coupled with the integration of modelling outcomes, will resolve these low-confidence issues for dissolved oxygen assessment.
Figure S.18: Number and surface area of the assessment areas with Moderate, Poor or Bad status over the four COMP periods
- Across most of the assessment areas in the OSPAR COMP regions, there is no widespread oxygen deficiency. However, localised areas of oxygen deficiency are apparent, particularly in the eastern North Sea (shelf), Kattegat (coastal) and Gulf of Biscay (shelf). The Eastern North Sea, Kattegat Coastal and Kattegat Deep have long-term data available from 1990, demonstrating persistently low dissolved oxygen values. Although both Kattegat Coastal and Kattegat Deep show an increasing trend over the entire period from 1990 to 2020, positive development has been absent for the last decade, which corresponds with similar results for the other indicators. Concentrations in the Eastern North Sea show some improvement in recent years, but this is not significant and will require further observations to resolve the direction of trend. The persistent failures of the Eastern North Sea, alongside its increased susceptibility to dissolved oxygen sags, identify this as an area of concern.
- There are statistically significant trends of reducing oxygen concentration in five areas (Atlantic, Atlantic Seasonally Stratified, Meuse, Scheldt plume, Norwegian Trench) and of increasing oxygen concentration in one (Kattegat Coastal). Of these areas, it is only the Atlantic Seasonally Stratified area where the reduced solubility due to increased sea temperature is the dominant causative factor rather than eutrophication.
Additional eutrophication parameters in categories I and III
In some areas, additional parameters for total nutrients (total nitrogen and total phosphorus) and photic limit (Secchi depth) have been included to support assessment based on data availability and jointly agreed thresholds between the Contracting Parties sharing these areas. The assessment areas with additional parameters applied are mainly located in the eastern part of the North Sea, Kattegat and Skagerrak (Figure S.19), where some indicators still exceed the thresholds and thus point to potential eutrophication problems. Total nutrients are combined with dissolved inorganic nutrients (DIN and DIP) in the category I results for nitrogen and phosphorus, while Secchi depth is combined with oxygen in the category III results for indirect effects. The following figures show the areas where additional parameters have been included with the respective category results for causative factors/nutrient enrichment as well as direct and indirect effects, for the most recent assessment period of COMP4 from 2015 to 2020 (Figure S.20).
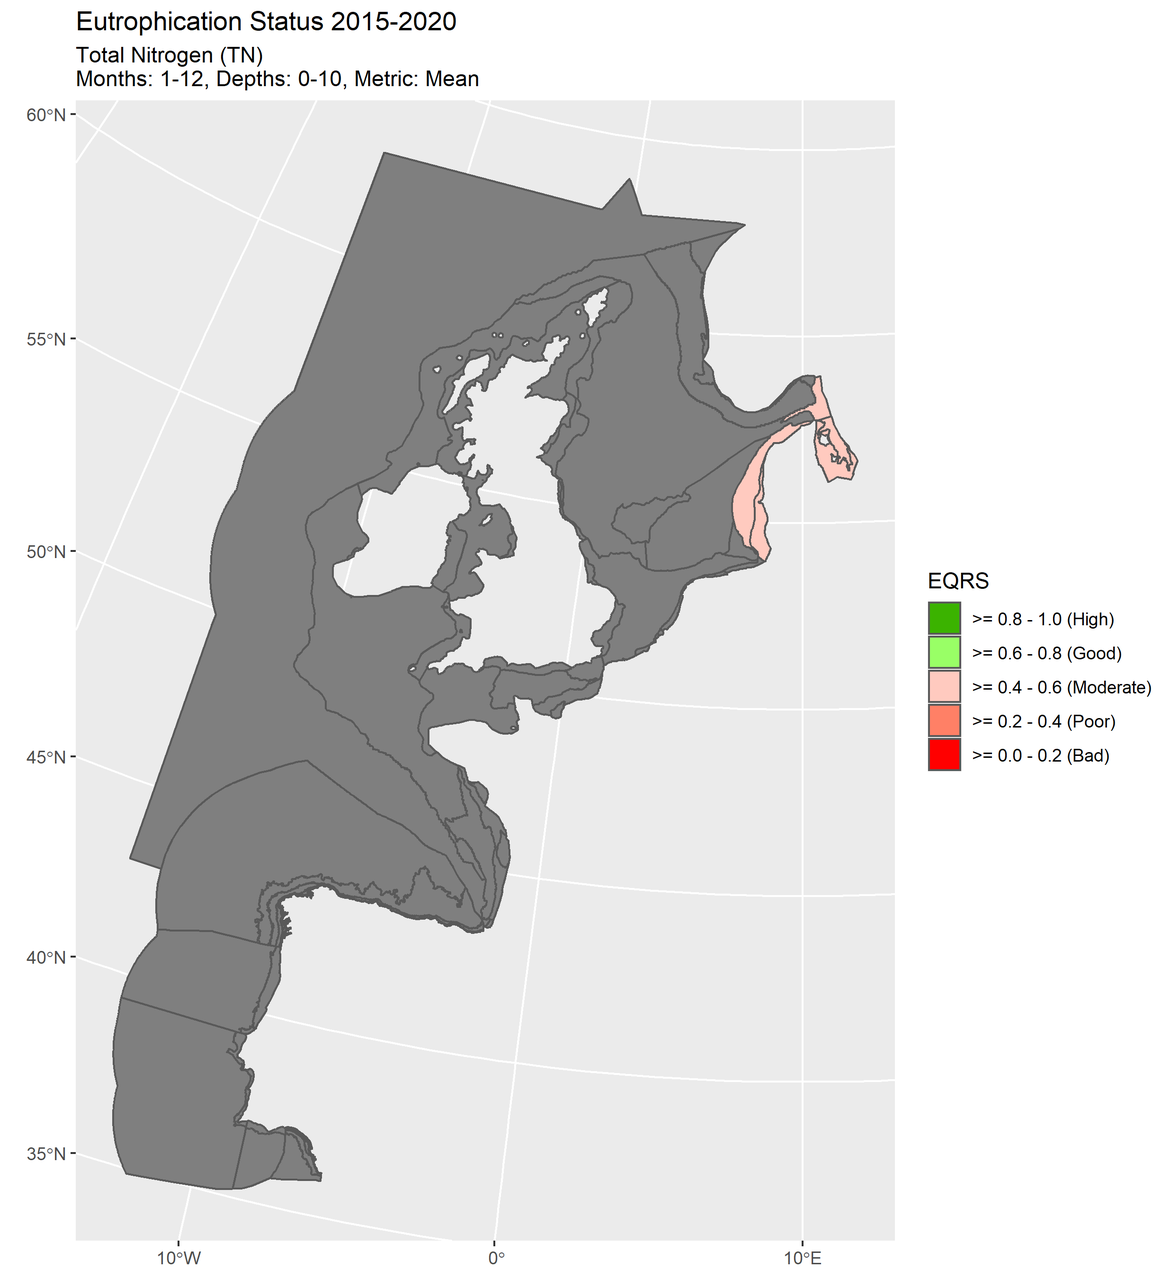
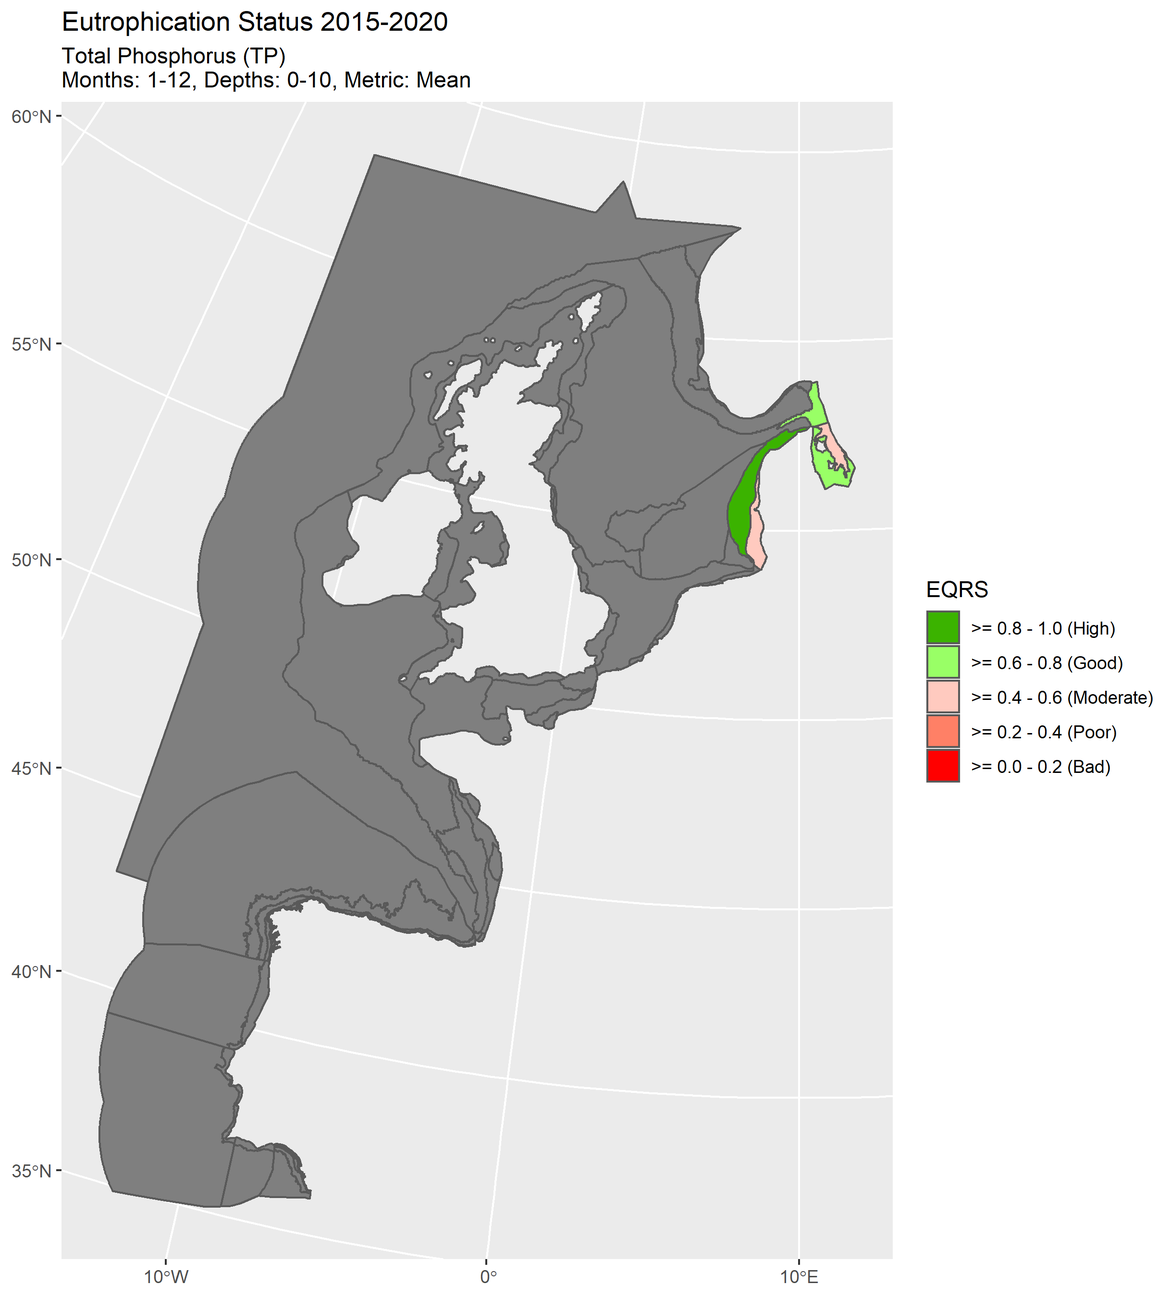
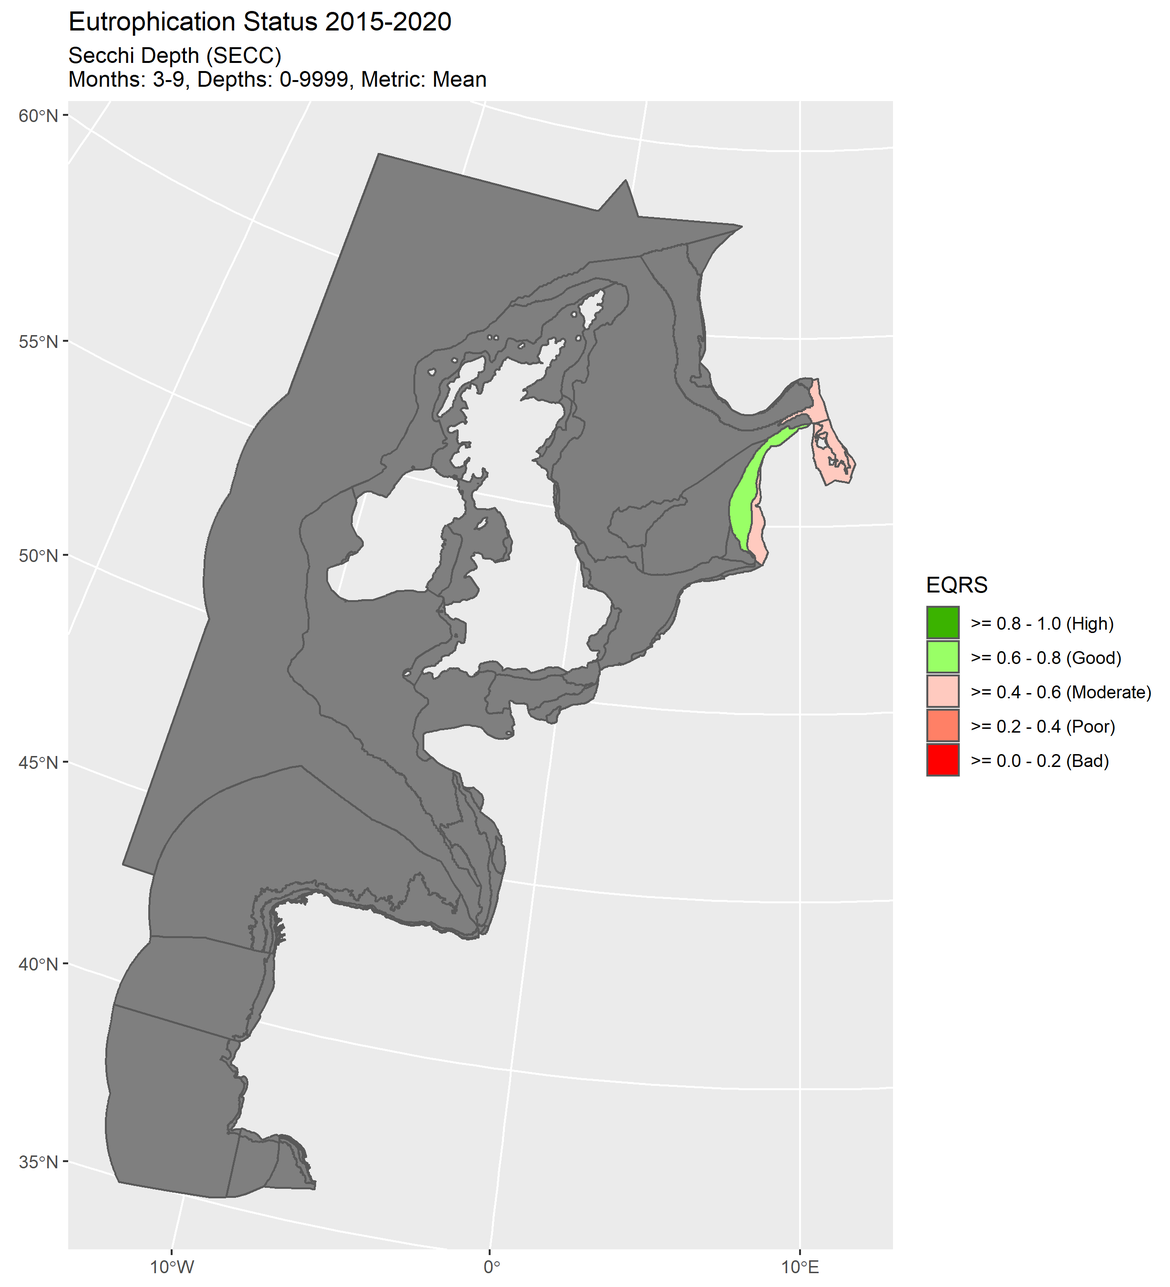
Figure S.19: Zoom to assessment results of additional parameters total nitrogen (TN), total phosphorus (TP) and photic limit (Secchi depth) for COMP4 (2015-2020)
")
Cat 1 Nitrogen (DIN, TN)
")
Cat 1 Phosphorus (DIP, TP)

Cat 2 Chlorophyll-a
")
Cat 3 Oxygen (Secchi)
Figure S.20: Assessment results per category for nutrient enrichment (separately for nitrogen and phosphorus), direct effects (chl-a) and indirect effects (oxygen, Secchi depth) in the COMP4 period 2015-2020 taking into account the additional assessment parameters.
Relationships with pelagic habitats and food web assessments
The assessment areas developed for eutrophication and based on phytoplankton seasonal patterns and hydrological criteria have also been adopted for the assessments of pelagic habitat and food web indicators, thereby facilitating comparison between them. In addition to identifying areas where eutrophication is a problem, the information gathered also indicates spatial and temporal patterns for the primary producers (notably algae) that form an important basis of marine food webs.
In the Changes in Phytoplankton Biomass and Zooplankton Abundance (PH2) Indicator Assessment , chlorophyll-a is also used as a proxy for algal biomass, but the focus is on mean chlorophyll concentrations over the entire year and on change in the amplitude of monthly deviation from mean conditions in the 2015-2019 assessment period compared to previous years (1998-2014). Predominantly decreasing trends were observed in the Greater North Sea and the Celtic Seas (river plumes, coastal and shelf areas) and in the Bay of Biscay and Iberian Coast (coastal and oceanic areas), which generally does not reflect the findings in the eutrophication chlorophyll assessment, where most of assessment areas displayed no trend. This may be due to differences in the data sources and methods used to calculate the annual means for each assessment area, which should be further investigated. Surprisingly, mean chlorophyll concentrations based on satellite data gathered over the entire year are in many cases higher than those for the growing season. This indicates that the selected period for the growing season in the eutrophication assessment does not capture the highest chlorophyll concentrations in all cases, but that in a number of areas plankton blooms are missed in February and well into November.
Another important comparison is with the Pilot Assessment of Primary Productivity (FW2), which is strongly related to phytoplankton biomass and therefore chlorophyll-a. The data were retrieved from local in situ measurements and broad-scale satellite observation. This assessment concluded that over the long term (1997-2019) primary productivity was stable in Regions II, III and IV. Significant decreases occurred in the majority of the assessment areas, except for the Kattegat area, in 2015-2019, likely driven by de-eutrophication and climate change, which may disturb higher trophic levels. Since only long-term trend analyses were performed for the eutrophication indicator, chlorophyll-a comparison is not straightforward. Significant long-term decreases in chlorophyll-a concentrations were only observed in a limited number of coastal and shelf areas, mostly located in the eastern part of the North Sea, thereby only partly supporting the findings of the primary productivity assessment.
The Indicator Assessment on Changes in Phytoplankton and Zooplankton Communities (PH1/FW5) looked into changes in functional groups in the current assessment period (2015 and 2019) compared with previous years. Changes in the abundance of diatoms and/or dinoflagellates were estimated to be driven by changes in nutrients in several coastal waters in the eastern part of the North Sea, the Channel, around the United Kingdom and Ireland and also in the area named Atlantic Seasonally Stratified.
The Changes in Plankton Diversity (PH3) Indicator Assessment also compared the current assessment period against previous years, focusing on diversity indices for phytoplankton and zooplankton. Significant changes in phytoplankton diversity were observed in only a small number of areas in the Celtic Seas and the North Sea. Nutrients were considered drivers of change mainly in coastal areas around the United Kingdom and Ireland, including the Atlantic Seasonally Stratified area and along the Spanish and Portuguese coasts, and to a lesser extent in the eastern part of the North Sea.
It should be noted that further harmonisation of data sources and assessment methods between eutrophication and pelagic and food web assessments is expected to increase comparability. Moreover, further analyses of the relationships between these assessments will help improve understanding of how nutrient loads affect ecosystem functioning and at which nutrient concentrations the ecosystem can be considered healthy.
OSPAR (2021). CEMP guidelines for coordinated monitoring for eutrophication, CAMP and RID Agreement 2016-05, revised 2021: https://www.ospar.org/documents?v=35414. Accessed 23 December 2022.
OSPAR (2022). Agreement 2022-07 on The Common Procedure for the Identification of the Eutrophication Status of the OSPAR Maritime Area. Available at: https://www.ospar.org/documents?v=49366
| Pressures | Impact |