

Tendances des nouveaux enregistrements d’espèces non indigènes (ENI) introduites par les activités humaines
D2 - Espèces non indigènes
D2.1 - Abondance des espèces non indigènes, en particulier des espèces envahissantes, et caractérisation de leur état
Message clé:
Les espèces non indigènes non seulement représentent une menace majeure pour la biodiversité marine mais ont également des impacts socio-économiques considérables. Des espèces enregistrées récemment apparaissent à un rythme relativement constant dans les zones évaluées. On considère que la prévention de l’introduction d’espèces non indigènes est l’approche la plus économique à appliquer à la gestion.
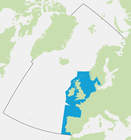
Zone Évaluée
Récapitulatif Imprimable
Contexte
Les espèces non indigènes (ENI) introduites par les activités humaines sont des organismes déplacés dans de nouvelles zones situées au-delà de leur aire de répartition naturelle, par exemple par le transfert d’eau de ballast des navires, le bioencrassage (accumulation d’organismes sur la coque des navires) et l’aquaculture. Les espèces qui étendent naturellement leur aire de répartition ne sont pas prises en compte mais les ENI qui s’étendent naturellement dans des zones avoisinantes à la suite de leur introduction (dispersion secondaire) le sont.
La présence d’ENI peut exercer des pressions sur le milieu marin et avoir des impacts sociaux, économiques ou environnementaux éventuels. Les ENI envahissantes sont l’une des menaces les plus significatives pour la biodiversité mondiale. Il est très difficile de retirer des ENI après leur introduction et la prévention de leur introduction est donc l’approche la plus économique à appliquer à la gestion, réduisant le coût et évitant de devoir prendre des mesures d’élimination.
Cette évaluation se concentre sur les tendances des nouveaux enregistrements d’introduction d’ENI dans la zone maritime OSPAR, afin de déterminer l’efficacité des mesures visant à réduire les introductions d’ENI.
Cette évaluation se base sur les nouveaux enregistrements d’ENI, fournis par les pays OSPAR, tout en reconnaissant les limites de ces données, telles que les écarts entre le moment de leur enregistrement et celui de leur introduction. De nouvelles initiatives politiques (par exemple, le Règlement sur les espèces exotiques envahissantes et la Directive cadre stratégie pour le milieu marin (DCSMM) de l’Union européenne) permettent de commencer à développer des programmes de surveillance se focalisant sur la détection d’introductions de nouvelles ENI. Ceci permettra, au fil du temps, d’obtenir des données plus solides et donc une meilleure évaluation de cet indicateur.
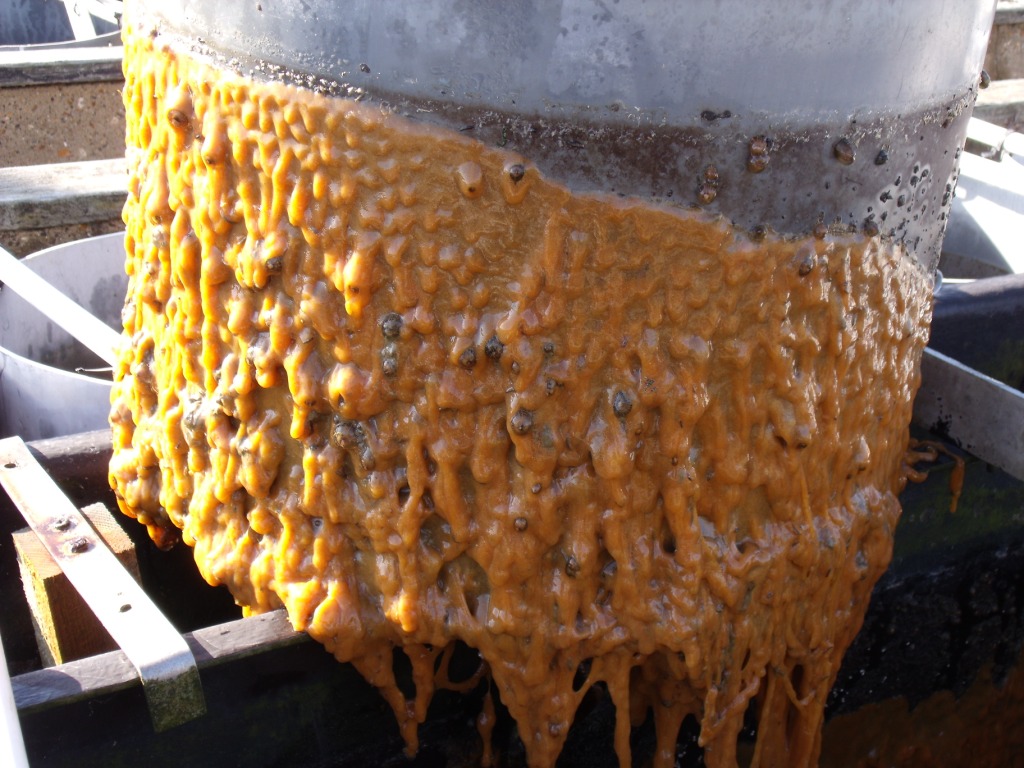
Le didemne étendard Didemnum vexillum envahissant recouvre une cuve de stockage dans une exploitation ostréicole (avec la permission de Cefas)
The indicator on which this assessment is based includes three parameters that are used to determine the effectiveness of a programme of measures designed to reduce the number of new non-indigenous species (NIS) introductions, their rate of establishment and their spread.
- Introduction parameter: This examines the number of new introductions of NIS into geographical areas, enabling assessments of trends in introduction over time.
- Community abundance parameter: This examines the total number of established NIS present within a geographical area, enabling assessments of trends in the NIS community over time.
- Dispersal parameter: This examines the distribution of established NIS, enabling an assessment of changes in the distribution of NIS over time.
Only the introduction parameter is used in this first assessment. The main reasons being that (a) because preventing NIS introductions is the most cost-effective management approach, assessing (rates of) new introductions themselves should have a higher priority than assessing their subsequent abundance and dispersal, and (b) the other two parameters require more detailed data on NIS which are currently not widely available for the period considered in this assessment, mainly owing to the lack of current monitoring for NIS.
Despite global recognition of the threat of invasive NIS, there has been no coordinated and sustained regional monitoring of new NIS introductions in the OSPAR Maritime Area. While some OSPAR Countries do monitor for NIS, others do not, and of those monitoring programmes that do exist none have been in place long enough to facilitate an assessment. Despite this, all OSPAR Countries record NIS detected. However, in some cases these records bear little relation to the time and place in which the species was initially introduced. This may be due to lack of monitoring effort or the reporting process.
First recordings of new NIS have been used for this assessment, being the only suitable data available. These records come from many different sources including monitoring programmes (some of which are specifically tasked to look for NIS), but the majority originate from secondary sources, such as scientific studies, citizen science or chance observations. These sources mostly lack the necessary geographic and temporal consistency in the methodology used for detection and recording needed to ensure data suitable for trend analysis. Using historical data from such a wide range of sources for this assessment may limit interpretation of results.
With various political drivers, such as the International Convention for the Control and Management of Ships' Ballast Water and Sediments (The International Maritime Organisation Ballast Water Management Convention), the European Union Marine Strategy Framework Directive (EU 2008/56/EC) (MSFD) and the European Union regulation on Invasive Alien Species (1143/2014), monitoring programmes focused on detecting NIS are starting to be developed. Given time, these should provide baselines and datasets that can be used to assess all three indicator parameters. It is essential however that there is consistency in approach, coordination and harmonisation of monitoring methods and quality assurance, recording processes, data flow and assessment at an OSPAR regional scale.
For the Quality Status Report (QSR) 2010, NIS were assessed by compiling a list of NIS considered problematic in the OSPAR Maritime Area, supported by information on range, first reporting, probable vector and possible impact. A quantitative assessment of trends in introduction was not possible. The development of an indicator on introduction of NIS makes it easier to identify change in the rate of new introductions of NIS and to assess the effectiveness of management measures.
Data
Each OSPAR Contracting Party was requested to provide data on new records of non-indigenous species (NIS) within their waters between 1 January 2003 and 31 December 2014 for each region assessed (Greater North Sea, Celtic Seas and Bay of Biscay and Iberian Coast). The period assessed was selected because it represents two six-year periods (2003–2008 and 2009–2014), from which Contracting Parties are most likely to have complete data sets. The data therefore enable comparison of new NIS records between two six-year reporting periods. Data were requested on the date that NIS were first recorded within each of the regions and the location of the observation.
Data were provided by: Belgium, Denmark, France, Germany, Ireland, Portugal, Spain, Sweden, the Netherlands and the United Kingdom.
The data received were checked for taxonomic discrepancies and formatting issues, which were then addressed. For the purpose of this assessment, records before 2003 and after 2014 were removed.
Analysis
Analysis was conducted using R Studio Version 0.98.994 (a programme for statistical computing and graphics). Analysis was based on the first new record of an NIS in the OSPAR Maritime Area. Duplicate records for any given species were removed such that numbers recorded for each of the three regions were not overestimates. Care was taken to ensure that it was the first record (i.e. earliest) for a given species in a given region that was used for analysis.
The following metrics were assessed using the data gathered for this assessment:
- The total number of new records of NIS made per year, for each region assessed;
- The total number of new records of NIS for each region between 2003 and 2014, calculated using the count function and cumulative function; and
- A comparison of the mean number of new records of NIS between reporting period 1 (2003–2008) and reporting period 2 (2009–2014) for the Greater North Sea, Celtic Seas and Bay of Biscay and Iberian Coast. A T-test analysis (a statistical hypothesis test to determine if the two sets of data are significantly different from each other) was used to determine whether there was any significant difference between the mean number of new records made in reporting period 1 compared to reporting period 2. Box plots were used to illustrate the comparison between the number of new NIS records in reporting periods 1 and 2. Box plots are used to examine patterns in data sets as follows: the data are sorted and divided into quarters, the thick black line represents the median or the midpoint of the data, the middle box represents the middle 50% of scores, with 25% being above the median line and 25% below. The bars above and below the box (not always visible) represent the upper and lower 25% of data.
This analysis was used to identify potential emerging trends in NIS records, within those areas of the OSPAR Maritime Area assessed.
Résultats
Le nombre de nouvelles espèces non indigènes (ENI) enregistrées dans la mer du Nord au sens large, les mers Celtiques et le golfe de Gascogne et la côte ibérique au cours de la période de 2003 à 2014, varie d’une année à l’autre et d’une région à l’autre (Figure 1) mais ne révèle aucune tendance générale pour la période d’évaluation.
Le nombre cumulatif d’introductions de nouvelles ENI (Figure 1) permet d’apprécier la modification des tendances. On relève, dans la mer du Nord au sens large, une augmentation linéaire relativement constante du nombre de nouvelles ENI enregistrées au fil du temps alors que dans les deux autres régions on relève un nombre relativement élevé d’enregistrements d’ENI pour des années particulières, ce qui signifie qu’une augmentation linéaire similaire ne s’est pas produite: mers Celtiques (2006, 2012) et golfe de Gascogne et côte ibérique (2004).
Les données indiquent que le nombre d‘ENI introduites dans les mers Celtiques est inférieur à celui pour la mer du Nord au sens large, le golfe de Gascogne et la côte ibérique. Il est difficile d’en déterminer les raisons étant donné la nature des données utilisées.
Le nombre de nouveaux enregistrements d’ENI, pour chacune des trois régions évaluées, est plus élevé pendant la première période de notification (2003–2008) que pendant la deuxième (2009–2014), comme le montre le Tableau 1. Ce nombre est beaucoup plus élevé dans le cas de la mer du Nord au sens large et du golfe de Gascogne et de la côte ibérique, bien que cette différence ne soit pas statistiquement différente. Dans le cas des mers Celtiques, on relève peu de différence entre les nouveaux enregistrements d’ENI de la première période de notification et ceux de la deuxième et aucune différence significative entre les séries de données.
La méthode utilisée inspire une confiance modérée et la disponibilité des données une confiance faible.
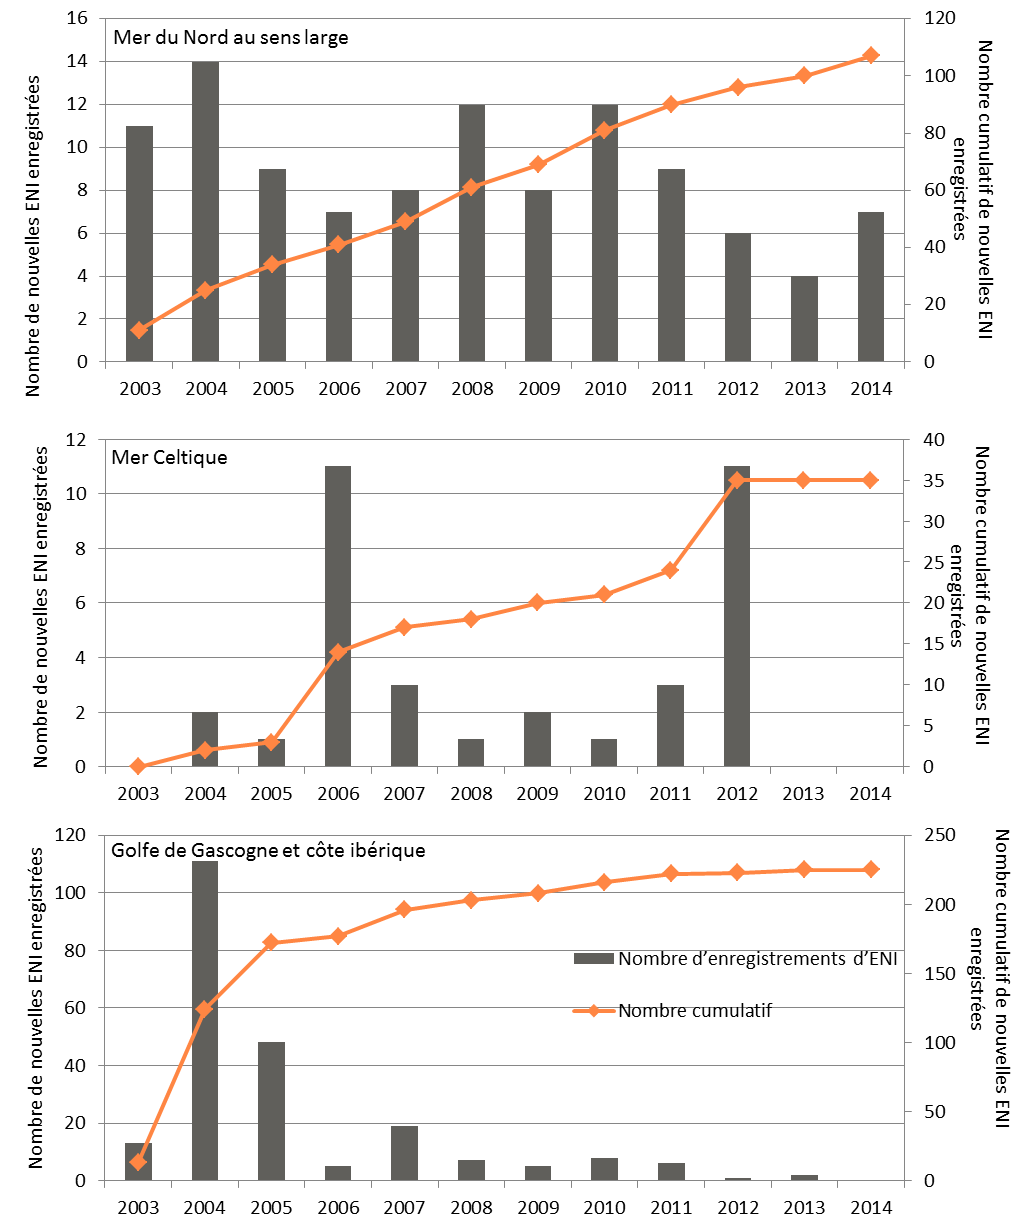
Figure 1: Nombre de nouveaux enregistrements d’ENI par an dans chaque région évaluée
Note: Des échelles différentes sont utilisées sur chaque diagramme et sur les deux abscisses
| Région OSPAR | Nombre moyen de nouveaux enregistrements d’ENI | Différence significative statistiquement entre les moyennes (valeur de p 0,05) | |
|---|---|---|---|
| Première période de notification (2003–2008) | Deuxième période de notification (2009-2014) | ||
| Mer du Nord au sens large | 10.17 | 7.67 | Aucune |
| Mers Celtiques | 3.00 | 2.83 | Aucune |
| Golfe de Gascogne et côte ibérique | 38.83 | 3.67 | Aucune |
The number of new non-indigenous species (NIS) records per year varied for each of the three OSPAR Regions assessed (Figure 2). In total, there were 107 new records for the Greater North Sea, 35 for the Celtic Seas and 225 for the Bay of Biscay and Iberian Coast over the 12-year assessment period (2003–2014).
The number of new NIS records varied between years. These variations may reflect differences in monitoring intensity (in space and time), as well as the ad hoc nature of most of the data collected. In the Greater North Sea, the total number of new NIS records per year ranged from 4 (2013) to 14 (2004), for the Celtic Seas the range was 0 (2003, 2013, 2014) to 11 (2006, 2012), and for the Bay of Biscay and Iberian Coast the range was 0 (2014) to 111 (2004). It is possible that formerly undetected NIS were recorded in the first reporting period.
The average number of new NIS records per year was 8.92 for the Greater North Sea, 2.92 for the Celtic Seas and 18.75 for the Bay of Biscay and Iberian Coast.
In the Greater North Sea there was a relatively constant increase in new NIS records over the assessment period (Figure 2). In the Celtic Seas there were two years (2006, 2012) in which comparatively high numbers of new NIS were recorded, resulting in a non-linear increase in total NIS records. For the Bay of Biscay and Iberian Coast, the number of new NIS records was greater near the start of the assessment period (2004), resulting in an early increase followed by a plateau.
For each region assessed, there were more new NIS records in reporting period 1 (2003–2008) than in reporting period 2 (2009–2014). Specifically, 61 and 46 for the Greater North Sea, 18 and 17 for the Celtic Seas, and 203 and 22 for the Bay of Biscay and Iberian Coast. The lower number of new NIS records in reporting period 2 may reflect a decrease in monitoring intensity or delays in the reporting of data, as well as a real decrease in rates of new NIS introductions.
For each region assessed, although the mean number of new NIS records for reporting period 1 is greater than for reporting period 2, this difference is not statistically significant (Table 1). Figure a shows box plots of the number of new recordings of NIS made in reporting periods 1 (2003 to 2008) and 2 (2009 to 2014) whereby the thick black line represent the median or the midpoint of the data, the middle box represents the middle 50% of scores, with 25% being above the median line and 25% below. The bars above and below the box (not always visible) represent the upper and lower 25% of the data.
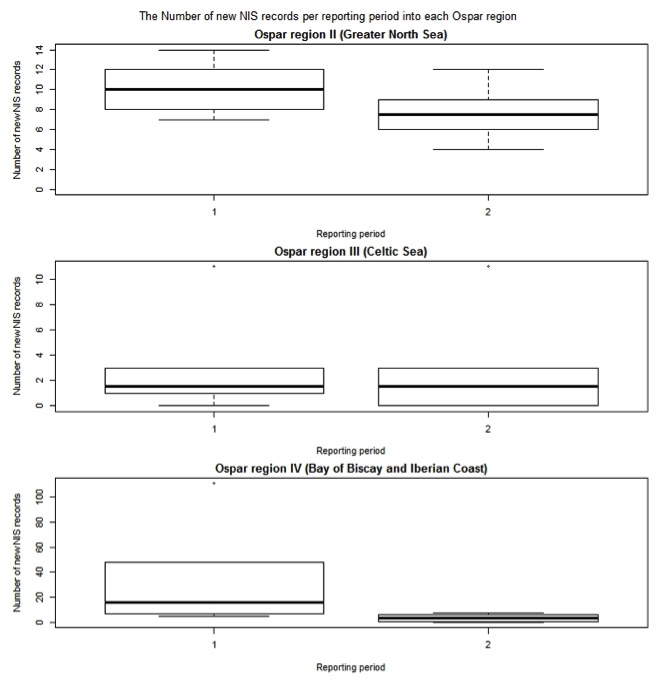
Figure a: Box and whisker plots comparing the number of new records of NIS per year between reporting periods 1 (2003–2008) and 2 (2009–2014)
Note the different scales used on each plot.
A T-test was used to compare the mean number of new NIS records between reporting periods 1 (2003–2008) and 2 (2009–2014). For future assessments, where multiple reporting periods will be used, more appropriate multi-variant analysis will be applied.
Confidence Assessment
The confidence in the methodology for this assessment is moderate. There is a common consensus for using the method among the regional seas commissions, with OSPAR, the Baltic Marine Environment Protection Commission (HELCOM) and the Barcelona Convention using similar assessment methodology. However, further work is required to develop the indicator, especially in relation to determining monitoring effort, NIS community abundance and NIS distribution.
There is low confidence in the data availability for NIS. There is no information on how data were gathered or monitoring effort applied. There are also spatial gaps in the data used.
Conclusion
L’observation de nouvelles espèces s’est produite à un rythme relativement constant dans les trois régions évaluées, à l’exception de quelques années durant lesquelles l’introduction d’ENI a été élevée. Il faudrait donc envisager d’intensifier les efforts pour réduire le rythme actuel d’introduction. Les différences entre les rythmes d’introduction dans les régions sont relativement faibles et pas significatives statistiquement entre les deux périodes de notification de six ans (2003–2008 et 2009–2014).
On a identifié un certain nombre de limites dans les données utilisées. Des données qui permettraient d’évaluer avec précision et fiabilité les introductions de nouvelles ENI dans chacune des régions évaluées sont absentes. Cette évaluation démontre néanmoins la fonctionnalité de la méthode développée.
La principale conclusion est donc que l’on devrait envisager le développement et la mise en œuvre d’une surveillance coordonnée et harmonisée afin d’obtenir des séries de données exactes pour les évaluations futures. De plus, des séries de données à plus long terme sont nécessaires, et donc une surveillance plus soutenue, pour pouvoir déterminer plus précisément si le rythme d’introduction de nouvelles ENI et stable ou variable.
Il est très difficile de déceler des ENI émergentes et le développement de la surveillance devrait donc prendre en compte l’approche basée sur le risque et une application proportionnelle des options de gestion des ENI, une fois qu’elles sont décelées.
La mise en œuvre continue de la DCSMM, du Règlement sur les espèces exotiques envahissantes et de la Directive cadre sur l’eau de l’Union européenne et de la Convention sur la gestion des eaux de ballast de l’Organisation maritime internationale, devrait permettre d’aborder certaines lacunes identifiées dans la surveillance.
It is difficult to draw any clear conclusions from the results of the analysis except that, excluding a few exceptional years, the rates of introduction of non-indigenous species (NIS) have been relatively constant over the assessment period.
Several issues have been identified in relation to the data used for this assessment:
- A lack of information on the monitoring effort applied to detect new NIS. The number of new NIS introductions reported may be positively correlated with monitoring effort, so years with high numbers of new NIS records may be the result of increased monitoring effort; equally a year with few new NIS records may be the result of little or no monitoring effort. For example, in the Bay of Biscay and Iberian Coast region more than 100 new NIS were reported in 2004. This is unlikely to be a true reflection of the number of new NIS introduced in 2004, especially in comparison to the number of new NIS introductions reported for other years in the same region; but may be the result of the reporting process or increased monitoring effort;
- A lack of information concerning the methods used for NIS detection, in particular their sensitivity and / or suitability for detecting NIS. Without an understanding of the methodology applied it is difficult to determine the effectiveness of the methods used for detecting NIS;
- Limited monitoring at locations considered to be at particular risk of new NIS being introduced, such as ports and marinas, therefore species will be missed at the point of introduction;
- Potential discrepancy between when an NIS is first recorded and when the introduction actually occurred. This also raises issues with linking introduction events to specific pathways of introduction and management measures;
- Potential discrepancy between where an NIS is first recorded and where it was actually first introduced. This may result from multiple NIS introduction events, where subsequent introductions are detected before the initial introduction, or where a secondary population resulting from spread is detected prior to the original founder population;
- Data accessibility varies between countries, depending on internal processes for collating and storing data. This may result in missing data, resulting in an incomplete view of the number of new NIS introductions in a given year; and
- Reliable data are not available for a long enough period to effectively examine trends in new NIS introductions over time.
Despite data limitations, this assessment does demonstrate how this indicator can be used to determine changes in the number of new NIS being introduced into the three regions assessed (and has synergy with other Regional Seas Conventions in Europe), with the provision of appropriate data. Development and implementation of coordinated and harmonised monitoring is required to address the issues listed above and to provide accurate datasets for future assessments. Any such monitoring will need to be integrated with other requirements such as those for the European Union Marine Strategy Framework Directive, the European Union Invasive Alien Species Regulation, and the International Maritime Organization Ballast Water Management Convention.
Lacune des connaissances
Une surveillance plus solide des espèces non indigènes (ENI) permettrait d’améliorer l’évaluation de cet indicateur. Il y lieu que les travaux se concentrent sur une approche économique à appliquer à:
- l’amélioration de la série de données de base, à partir des connaissances disponibles, permettant une comparaison avec des périodes d’évaluation futures;
- la considération d’approches et de méthodologies utilisées par d’autres organisations et pour d’autres exigences règlementaires;
- la coordination et l’harmonisation de la surveillance et des réponses au niveau régional d’OSPAR, en association avec d’autres conventions sur les mers régionales;
- l’amélioration du flux de données et des processus de gestion; et
- la possibilité d’envisager le développement de méthodes supplémentaires afin d’améliorer la vitesse et la probabilité d’une détection précoce d’ENI.
Le développement d’indicateurs complémentaires permettrait de mieux comprendre la contribution des divers vecteurs d’introduction d’ENI.
In relation to NIS, consideration could be given to the following.
Develop Baseline Dataset:
- A baseline is required from which future trends can be assessed. This could be achieved using secondary data (i.e. information collected from sources other than established monitoring programmes, such as rapid assessment surveys or citizen science) and validated against data collected from monitoring programmes as they are developed; and
- The development of a baseline and the validation process would ideally be conducted at the OSPAR regional scale, but could also be coordinated between Regional Seas Conventions.
Improve Speed and Probability of Early Detection and Response to NIS, Notably in Areas at High Risk of Introduction:
- Increase the quality and quantity of monitoring conducted for NIS;
- Conduct vector-related monitoring at locations at high risk from the introduction of NIS, such as ports, marinas and aquaculture sites;
- Investigate the applicability of different detection methods, such as molecular-based tools;
- Develop methods whereby monitoring effort can be quantified and compared between Contracting Parties;
- Develop standardised monitoring protocols to optimise detection of NIS;
- Develop methods by which assessment results can be compared with effort undertaken in relation to the programme of measures to determine its effectiveness and how the programme of measures may need to be modified in the future;
- Establish an early warning system to alert Contracting Parties, especially on the occurrence of potentially invasive NIS to enable joint consideration of possible eradication efforts as a rapid response action;
- Improve the quality assurance of taxonomic identification Coordinate and harmonise monitoring at the OSPAR regional level, as well as at the level of other Regional Seas Conventions;
- Ensure expertise and experience is shared between and within Regional Seas Conventions;
- Develop standardised monitoring guidelines and procedures to ensure consistency;
- Investigate and define optimised monitoring design for the European Union Marine Strategy Framework Directive, with potential applicability to other policy drivers, such as the International Maritime Organization Ballast Water Convention, the European Union Water Framework Directive and the European Union Invasive Alien Species Regulation; and
- Identify a central body / group of representatives to coordinate monitoring and quality assurance, within and between Regional Seas Conventions.
Improve Data Flow and Management Processes:
- Develop data management and data flow guidelines;
- Identify a common repository for data management processes and storage; and
- Standardise reporting format and procedure to the common repository.