

Teneurs en chlorophylle-a dans la mer du Nord au sens large et les mers Celtiques
D5 - Eutrophisation
D5.2 - Effets directs de l’enrichissement en nutriments
Message clé:
On trouve des tendances à la baisse (amélioration) des teneurs en chlorophylle-a dans le Sund et le Skagerrak (1990–2014) et dans les parties au large de la mer du Nord au sens large (2006-2014). On relève une petite tendance à la hausse (niveau de confiance bas) au large des mers Celtiques. Des teneurs élevées se trouvent dans certaines zones côtières.
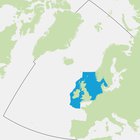
Zone Évaluée
Récapitulatif Imprimable
Contexte
L'objectif stratégique d’OSPAR, en ce qui concerne l’eutrophisation, consiste à lutter contre eutrophisation dans la zone maritime OSPAR, dans le but ultime de parvenir à, et de maintenir, un milieu marin sain, exempt d’eutrophisation anthropique. La chlorophylle-a fait partie d’une série de cinq indicateurs de l’eutrophisation. Cette série d’indicateurs peut identifier l’eutrophisation lorsque ces indicateurs sont évalués et étudiés ensemble dans le cadre de la Procédure Commune d’OSPAR selon une méthode à plusieurs étapes.
Des niveaux élevés de biomasse du phytoplancton peuvent être un effet direct de l’enrichissement en nutriments. La chlorophylle-a est mesurée à titre de substitution pour la biomasse (carbone) du phytoplancton. Une image de la zone maritime OSPAR, basée sur des données satellites, révèle la répartition spatiale de la chlorophylle-a lors d’une journée durant l’efflorescence printanière du phytoplancton (avril) et d’une journée estivale (juillet) (Figure 1). Les teneurs en chlorophylle-a les plus élevées se trouvent dans les eaux côtières. Cette évaluation décrit les teneurs en chlorophylle-a dans diverses sous-zones de la mer du Nord au sens large et des mers Celtiques. Les tendances temporelles ont également été analysées.
La présente évaluation est une étape intermédiaire dans le sens d’une évaluation cohérente de la chlorophylle-a au niveau de régions et de sous-zones.
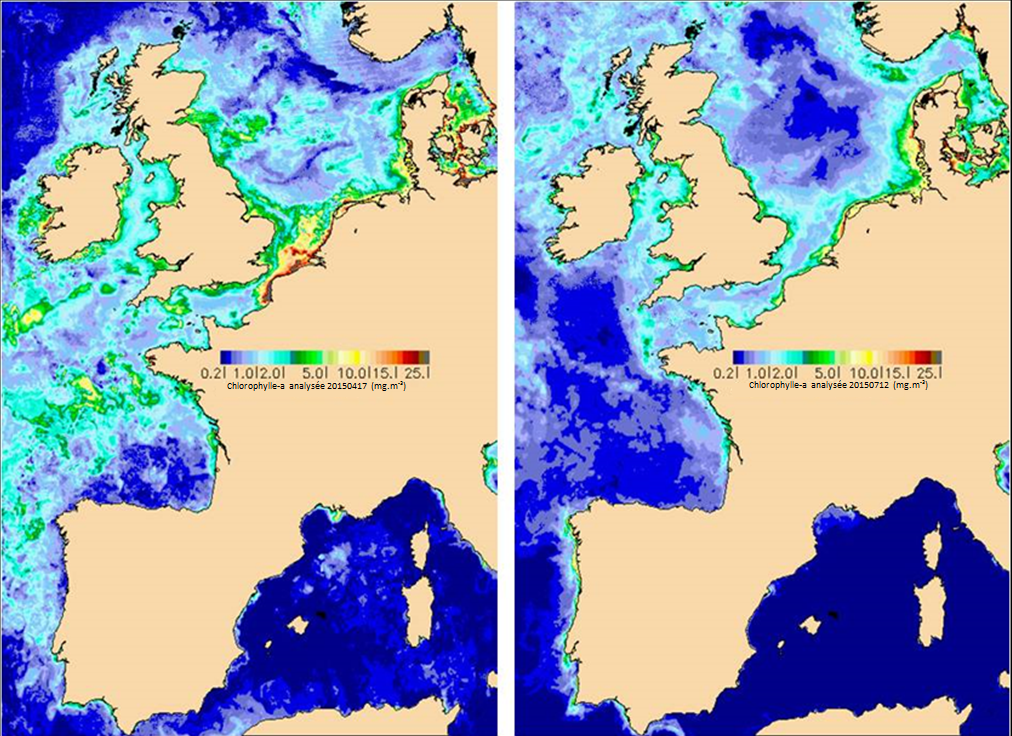
Figure 1: Images satellites des teneurs en chlorophylle-a (à gauche) un jour d’avril durant l’efflorescence printanière du phytoplancton en mer du Nord et (à droite) un jour de juillet, les teneurs estivales en chlorophylle-a étant plus basses
(Francis Gohin, Ifremer, pers. comm.)
Eutrophication is the result of excessive enrichment of water with nutrients. This may cause accelerated growth of algae and / or higher forms of plant life (Council Directive 91/676/EEC). This may result in an undesirable disturbance to the balance of organisms present and thus to the overall water quality. Undesirable disturbances can include shifts in the composition and extent of flora and fauna and the depletion of oxygen due to decomposition of accumulated biomass. Such disturbances then have other effects, such as changes in habitats and biodiversity, blooms of nuisance algae or macroalgae, decrease in water clarity and behavioural changes or even death of fish and other species. Identifying causal links between these disturbances and nutrient enrichment can be complicated by other pressures. Cumulative effects, including climate change, may have similar effects on biological communities and dissolved oxygen, further complicating efforts to demonstrate causal links.
The OSPAR Commission’s strategic objective, with regard to eutrophication, is to combat eutrophication in the OSPAR Maritime Area, with the ultimate aim that by 2020 the OSPAR Maritime Area is a healthy marine environment where anthropogenic eutrophication does not occur (OSPAR Agreement 2010-3). The OSPAR Eutrophication Strategy requires assessment of eutrophication to be based on the ecological consequences of nutrient enrichment and not just on nutrient enrichment alone, i.e. finding reliable evidence for accelerated growth of algae and / or macrophytes caused by anthropogenic nutrient enrichment, leading to undesirable disturbance. Eutrophication is diagnosed using OSPAR’s harmonised criteria of nutrient inputs, concentrations and ratios, chlorophyll-a concentrations, phytoplankton indicator species, macrophytes, dissolved oxygen levels, incidence of fish kills and changes in zoobenthos (OSPAR Agreement 2010-8). As there is no single indicator of disturbance caused by marine eutrophication, OSPAR applies a multi-step method using the harmonised criteria. Eutrophication is considered to have occurred if there is evidence for all of the stages shown in Figure a and of causal links between them (ECJ, 2009).
For OSPAR’s Intermediate Assessment 2017, five harmonised eutrophication criteria have been assessed at a regional scale: nutrient inputs, nutrient concentrations and ratios, chlorophyll-a concentrations, concentrations of the nuisance algae Phaeocystis, and dissolved oxygen levels. These are highlighted in Figure a. The individual assessment results of any one of these five common indicators do not diagnose eutrophication by themselves. However, the assessments provide useful information about trends and are important for informing management measures.

Figure a: Three stages in the identification of eutrophication. The criteria marked ¹ are common indicators for the OSPAR Intermediate Assessment 2017.
The criteria marked ² are not relevant in all Contracting Parties’ waters. The common indicator assessed here (chlorophyll concentrations) is outlined in red
Chlorophyll-a was assessed in the OSPAR Quality Status Report (QSR) 2010 (OSPAR, 2010) as part of the Common Procedure for the identification of eutrophication (OSPAR Agreement 2013-8). There is no comparable regional indicator assessment of chlorophyll-a.
Chlorophyll-a concentrations, used in this assessment as a proxy for phytoplankton biomass, are the net result of a number of processes: the production of phytoplankton biomass which is determined by nutrient concentrations but also by light and temperature, and the loss of phytoplankton biomass which is determined by mortality, sinking and grazing (Cloern et al., 2014). Consequently, the chlorophyll-a concentrations that are observed at monitoring sites are influenced by growth, mortality and transport processes. Physical factors such as turbidity, depth, vertical and horizontal mixing and stratification, and biological factors such as algal species composition, zooplankton grazing and competition with other primary producers have an impact on growth, mortality and transport. Due to these many interacting factors, the response of phytoplankton biomass to changes in nutrient input is complex and system specific (Cloern, 2001; Cloern et al., 2014). In addition, reduction in nutrient inputs has not always resulted in expected declines in phytoplankton biomass (Duarte et al., 2009). On the other hand, there are examples of water systems within the OSPAR Maritime Area where reduced nutrient inputs have resulted in lowered phytoplankton biomass or production (e.g. Philippart et al., 2007; Van Beusekom et al., 2009; Lyngsgaard et al., 2014; Riemann et al., 2016; Staehr et al., 2017).
Chlorophyll-a concentrations are generally higher in coastal waters where nutrient concentrations are higher due to river discharges and direct inputs (Figure 1).
In this assessment, trends in chlorophyll-a concentration in the Greater North Sea and Celtic Seas were analysed. This is an intermediate step towards coherent assessment of chlorophyll-a at the level of regions and sub-areas.
The common indicator chlorophyll-a is a proxy for phytoplankton biomass. The intention was to assess chlorophyll-a concentrations partially in the Arctic Waters and fully in the Greater North Sea, and Celtic Seas, Bay of Biscay and Iberian Coast, but not in the Wider Atlantic, as determined by data availability. For example, data availability for the northern North Sea coast, which comprises the Norwegian and United Kingdom coasts, was limited. The United Kingdom coast has years with only few or no observations as well as years with roughly the same number of observations as Norway but highly clustered in space and time.
Data from the International Council for the Exploration of the Sea (ICES) DOME were used in the assessment. The data were retrieved from the database in November 2016 and all available data for the Greater North Sea, Celtic Seas and Bay of Biscay and Iberian coast for the years 1990–2016 were used in the analysis.
The availability of chlorophyll-a data in the ICES database has been inventoried and analysed under the Joint Monitoring Programme for the North Sea and Celtic Sea (Baretta-Bekker et al., 2015). Key findings of that study were that the monitoring approach and analytical methodology for chlorophyll-a differed between countries involved in the common areas, which results in large variance in analysing the combined data (Baretta-Bekker et al., 2015: Annex II). Regardless of these methodological differences, all data from the ICES database are considered to be measures of chlorophyll-a.
The assessment areas
Chlorophyll-a was initially assessed in the OSPAR regions the Greater North Sea (northern North Sea, southern North Sea, English Channel, Skagerrak, Kattegat, Sound), and Celtic Seas, Bay of Biscay and Iberian Coast.
The Greater North Sea was sub-divided into the northern and southern North Sea to align with the common indicator assessments for nutrient concentrations , dissolved oxygen concentrations , and Phaeocystis . The southern North Sea consists mostly of shallow continental waters. The northern North Sea consists of deeper offshore waters and two very different coastal areas; the mixed United Kingdom coastal waters and the Norwegian coasts, affected by the Baltic Sea outflow. The Skagerrak, Kattegat and Sound have been assessed separately due to their unique hydrodynamic characteristics. Some of the assessment areas have been further sub-divided into an offshore and a coastal zone.
Under the Common Procedure, assessments are carried out for specific national assessment areas. These areas are defined taking into account hydrodynamic factors, such as freshwater influence, vertical mixing and depth. The areas used in the present assessment for the common indicator chlorophyll-a are designed to deliver relatively large-scale assessments.
The assessment indicator for chlorophyll-a
Table a shows the assessment areas and their sub-areas. In describing the results of the assessment of the areas of the Greater North Sea and Celtic Seas, salinity zones have been distinguished in some of the assessment areas, as defined in Table a.
The salinity boundary 18 was used to separate coastal waters from estuaries and inland waters. The salinity boundary 27 (Skagerrak) or 30 (North Sea, Celtic Seas) was used to distinguish coastal waters (influenced by freshwater discharges) from offshore waters. Salinity is useful to distinguish freshwater influence in most areas, but the boundaries give very different geographic patterns. In the southern North Sea, the boundary of salinity 30 can stretch up to 20–50 km from the coast. In the Celtic Seas the boundary of salinity 30 lies near the mouth of estuaries or within a few kilometres of the coastline.
| OSPAR Region | Assessment area | Sub-area salinity zone |
|---|---|---|
| Greater North Sea | Northern North Sea | offshore zone; salinity > 30 |
| coastal zone; salinity 18 – ≤ 30 | ||
| Southern North Sea | offshore zone; salinity > 30 | |
| coastal zone; salinity 18 – ≤ 30 | ||
| Skagerrak | offshore zone; salinity > 27 | |
| coastal zone; salinity 0 – ≤ 27 | ||
| Kattegat and Sound | None | |
| Celtic Seas | Celtic Seas | offshore zone; salinity > 30 |
| coastal zone; salinity 18 – ≤ 30 |
In the Kattegat and the Sound, the spatial distribution of salinity is complex due to the exchange of water between the saline North Sea and the brackish Baltic Sea. In those assessment areas, salinity cannot be used to distinguish between coastal and offshore waters. Consequently, those areas have been assessed as a whole.
In the other areas, the salinity ranges shown in Table a were used to distinguish between coastal and offshore waters. However, in some cases this does not result in a consistent separation of coastal and offshore waters. Some monitoring stations have salinities that fluctuate around the limits of the salinity range, alternating between ‘coastal’ and ‘offshore’, depending on the actual salinity. This is a limitation to the method of defining coastal areas (i.e. areas with the strongest freshwater influence) based on salinity. Other methods however, such as defining coastal areas based on a fixed distance from the coastline, have the disadvantage of combining areas with very different salinities (i.e. different freshwater influence).
In the OSPAR Common Procedure the statistics for the indicator chlorophyll-a are the mean, the 90-percentile and / or the maximum value over the growing season, which is defined as the period from 1 March to 30 September for the northern countries and 1 March to 31 October for the southern countries. The northern countries comprise: Belgium, the Netherlands, Germany, Denmark, Sweden and the United Kingdom. From the southern countries only France is involved in this study and for its northern coastal zone only, hence the period 1 March to 30 September has been taken as the growing season for all participating countries.
To deal with the issue of irregular distribution in time, first the daily means were calculated for each subarea. Based on these daily means, monthly means were calculated to avoid giving days or months with many observations undue weight. Second, the growing season means were calculated from the monthly means. Data for years with fewer than three months of data during the growing season are not shown in the graphics. Years with fewer than five months of data were excluded from the trend assessments. The 90-percentiles were calculated from the daily means.
This assessment reports on trends in chlorophyll-a concentration in the period 1990–2014. Results for the most recent years (2006–2014) are shown separately.
Availability of chlorophyll-a data
OSPAR countries submit the results of their water sample and conductivity, temperature and depth (CTD) observations to the (ICES) DOME, from where the data can be downloaded or obtained directly from ICES. Countries submit their observations made in their national waters, as well as their international data. As many as possible of the available data have been used for the assessment of specific areas, provided that the quantity of data in that area is sufficient.
Following a data request to ICES, all chlorophyll-a data to 25 November 2016, measured in the upper 10 m of the water column (the surface layer) for March to September inclusive (the growing season) were used.
Chlorophyll-a data were analysed for almost all recent years for the Celtic Seas, northern North Sea, southern North Sea, Skagerrak, Kattegat and Sound, by salinity zones (Table a). Data in recent years for other areas (e.g. English Channel, Bay of Biscay and Iberian Coast) were too limited for assessment.
With the exception of the Kattegat and Sound, observations with a salinity <18 were excluded from the analysis, as were observations for which salinity data were missing.
Statistical analysis of the data
For all assessment periods, the temporal trends were tested for statistical significance using the Mann-Kendall test. Where trends were significant (p<0.05), this is included in the description of the results.
In the graphics showing the time series of chlorophyll-a, linear trend lines over the assessment period are shown where trends are statistically significant, as calculated using the Theil-Sen estimator.
Résultats
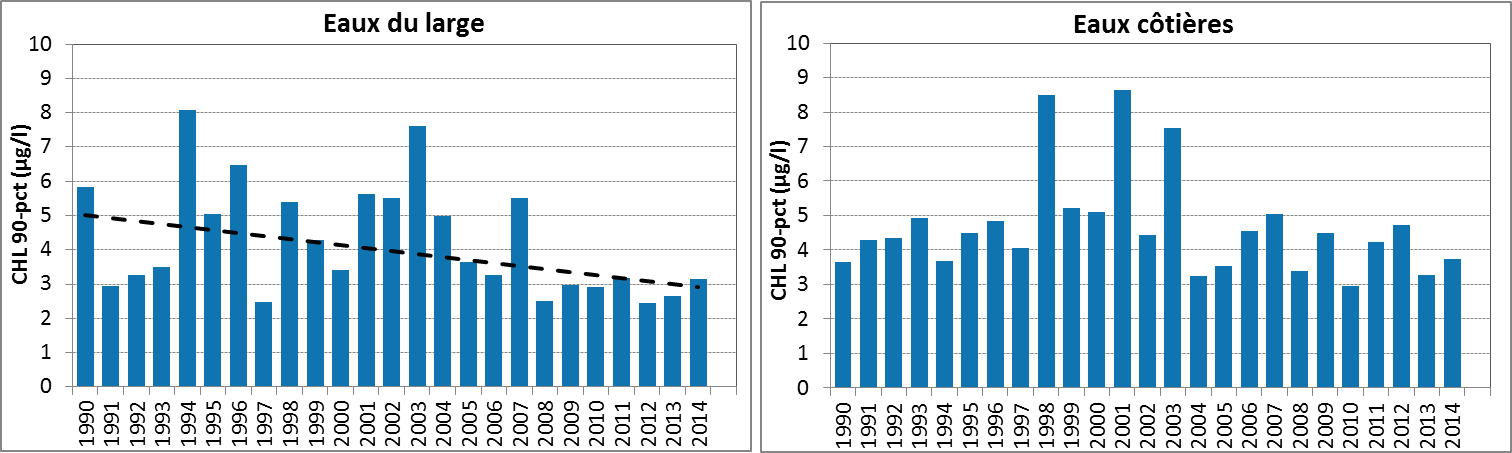
Dans l’ensemble, les teneurs en chlorophylle-a sont plus élevées dans les zones côtières que dans les eaux du large (Figure 2). Durant toute la période d’évaluation (1990–2014), les tendances du 90e percentile de la chlorophylle-a durant la saison de croissance étaient nettement à la baisse statistiquement dans deux zones, au large du Skagerrak et dans le Sund. On a relevé une tendance à la hausse significative statistiquement dans les eaux au large des mers Celtiques mais dans la série de données correspondantes des données manquaient pour un nombre relativement grand d’années. Cette série de données contient également des données provenant de laboratoires différents et utilisant des méthodes d’analyse différentes, ce qui pourrait avoir engendré un biais dans le calcul du 90e percentile.
La chlorophylle-a n’a pas été évaluée dans la Manche, le golfe de Gascogne et la côte ibérique car des données étaient trop limitées pour les années récentes (2004–2014).
La méthodologie et la disponibilité des données inspirent une confiance élevée.
Mer du Nord septentrionale
Mer du Nord méridionale
Skagerrak
Kattegat
Sund
Mers Celtiques
Figure 2: 90e percentile des teneurs en chlorophylle-a pendant la saison de croissance (mars–septembre) dans les sous-zones OSPAR évaluées: mer du Nord septentrionale et méridionale et au large des mers Celtiques (salinité ≥30) et la zone de salinité côtière (salinité de 18 à <30); au large du Skagerrak (salinité >27) et la zone de salinité côtière (salinité ≤27); le Kattegat et le Sund
Barres en couleur, années dont les relevés couvrent au moins cinq mois; barres blanches, années dont les relevés couvrent trois ou quatre mois. La ligne en pointillés indique une tendance linéaire significative statistiquement (p<0,05)
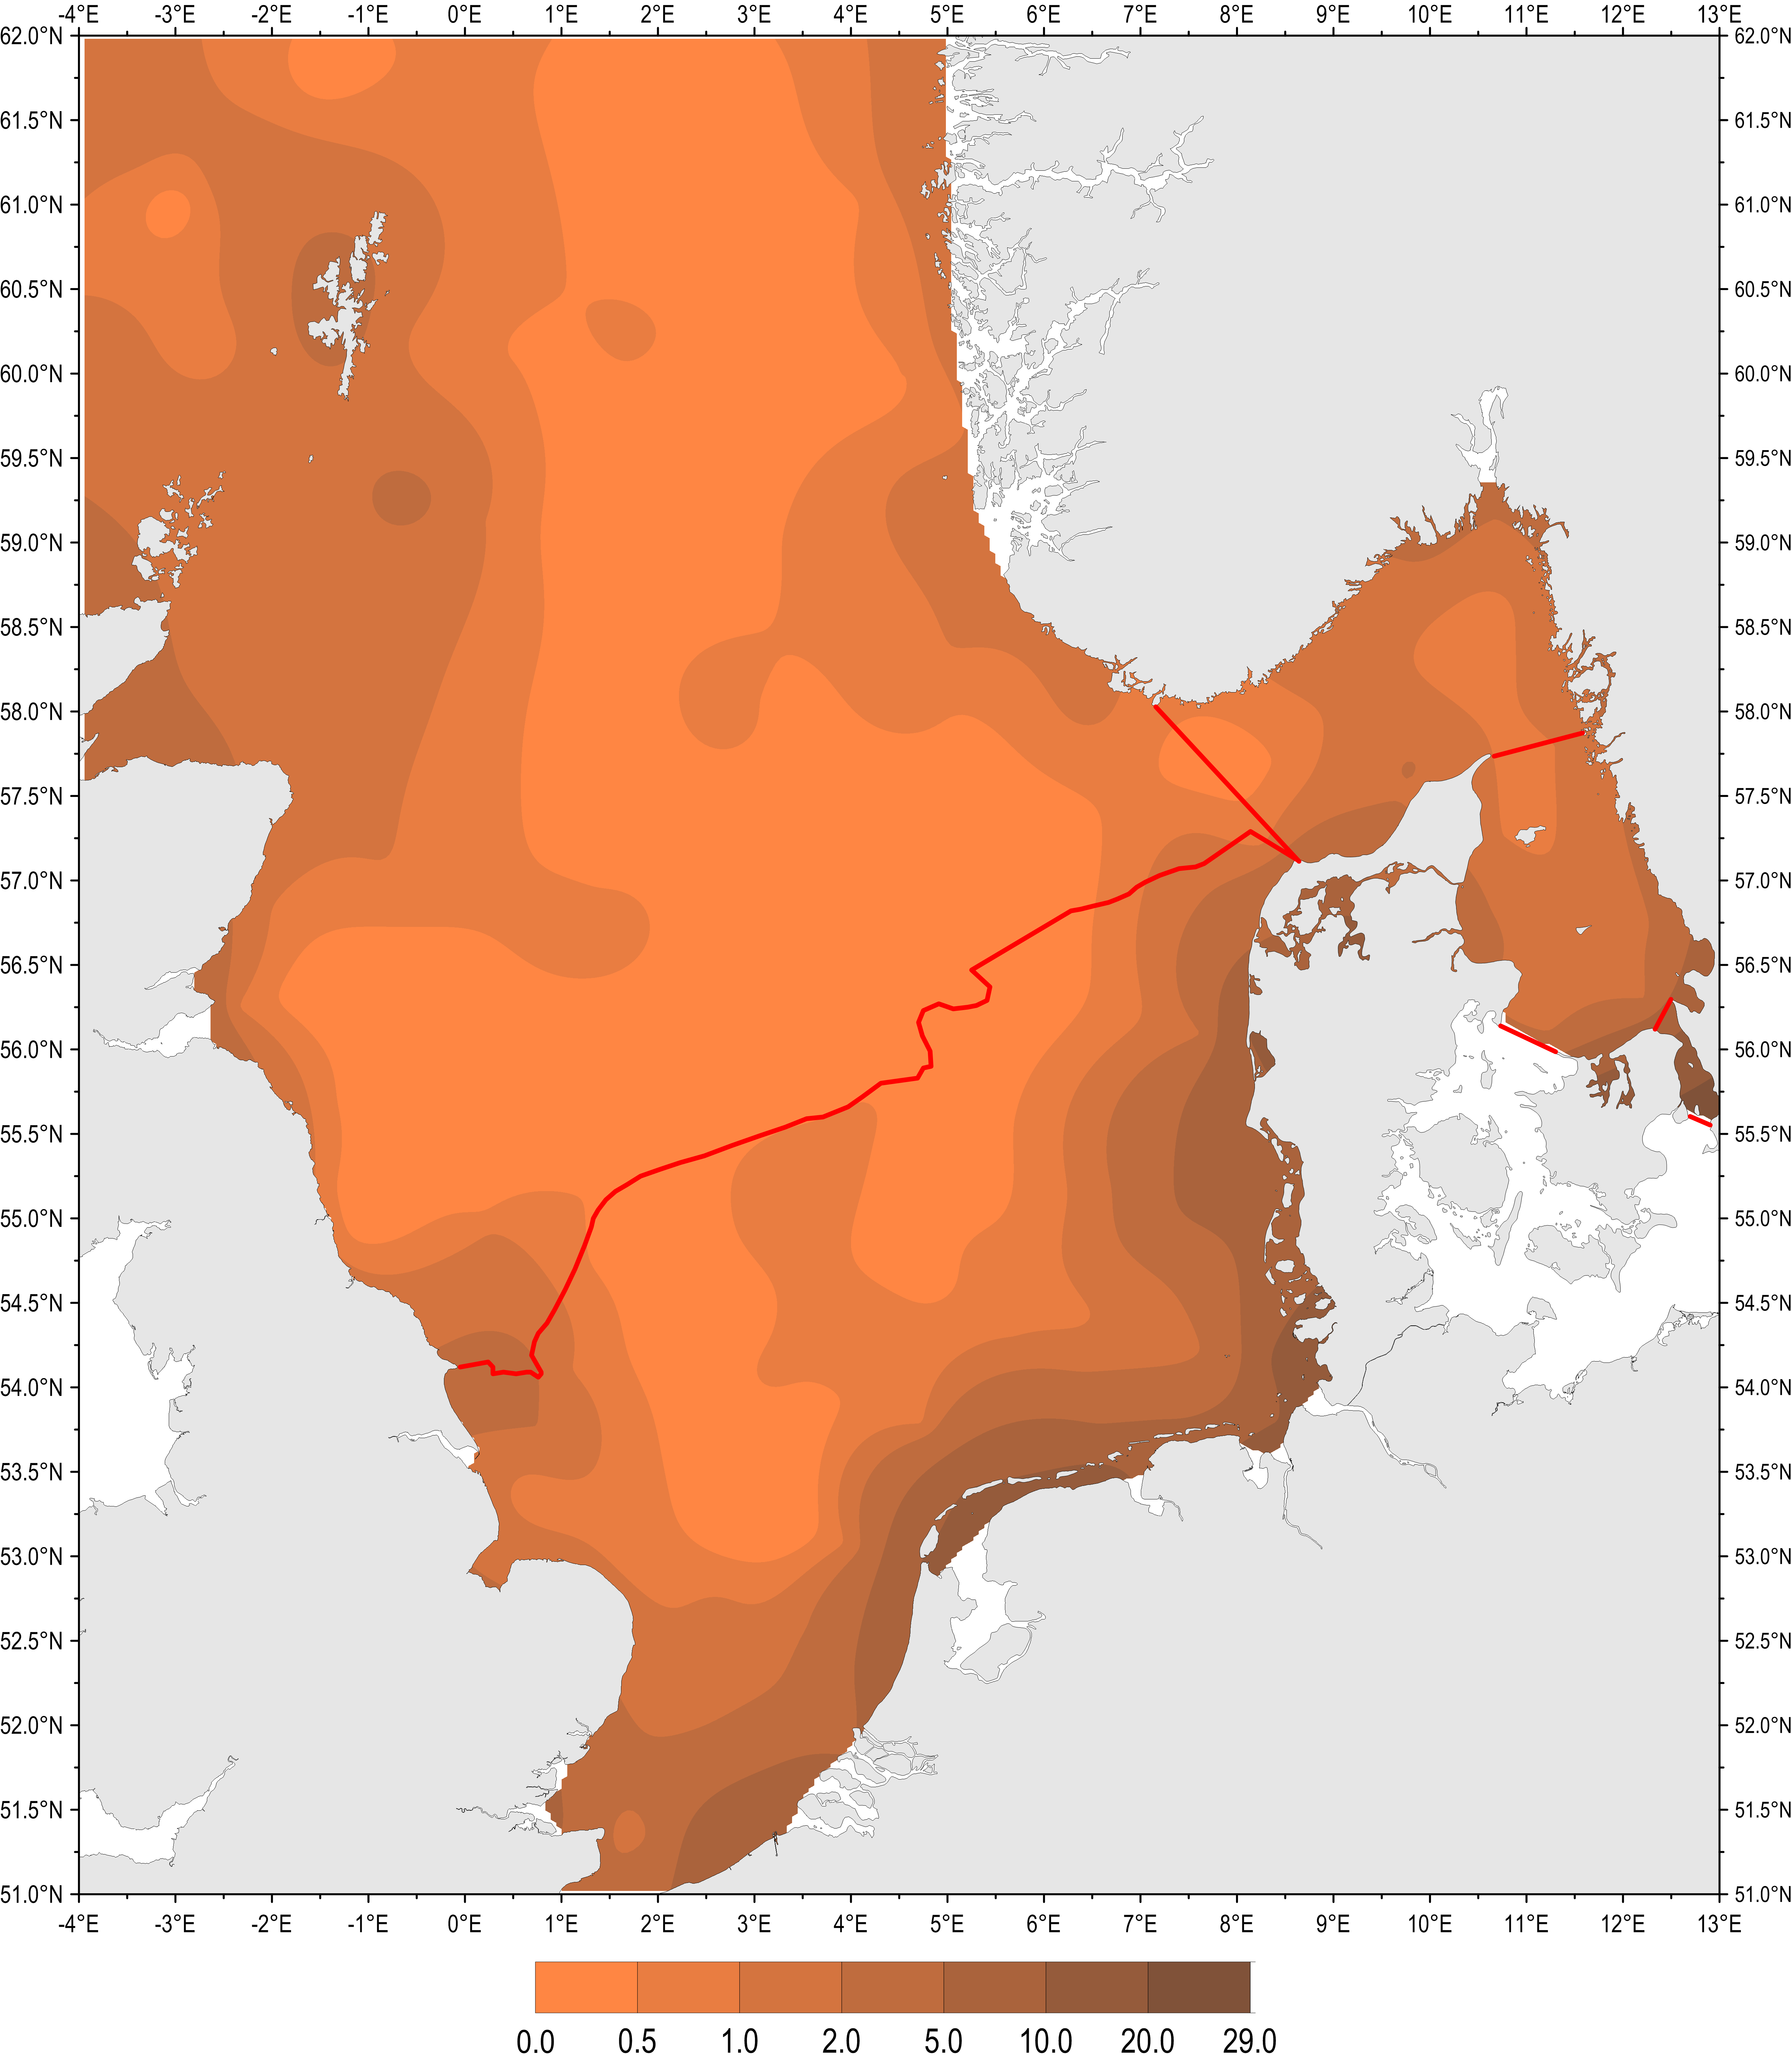
Figure c: Mean chlorophyll-a in the surface waters of the Greater North Sea, Skagerrak, Kattegat and Sound during the growing season (March–September) for the period 2006–2014. Red lines delineate boundaries for the northern and southern North Sea, Skagerrak, and Kattegat and the Sound
Figure c shows the spatial distribution of mean chlorophyll-a concentration during the growing season (March–September) for the period 2006–2014 in the Greater North Sea and the Skagerrak and Kattegat. The period 2006–2016 corresponds to the assessment period for the third application of the to identify eutrophication. During this period the highest chlorophyll-a concentrations occurred along the coast of Belgium, Netherlands Germany and Denmark, and other local coastal areas of the North Sea. The highest chlorophyll-a concentrations in the coastal waters are approximately ten-fold higher than in offshore waters.
The Assessment areas and Sub-Areas (Salinity Zones)
Chlorophyll-a concentrations and trends have been analysed in the Celtic Seas and all salinity zones of the Greater North Sea with the exception of the English Channel.
The 90-percentile growing season (March–September) chlorophyll-a concentrations calculated from the individual observations are shown per sub-area in Figure 2. Chlorophyll-a 90-percentile is the key measure for assessing chlorophyll-a, as used by most Contracting Parties in their national Common Procedures. However, some Contracting Parties also measure and assess chlorophyll-a growing season mean values. Therefore the results of trend assessments based on growing season means are provided as supporting information.
The Northern and Southern North Sea
The spatial distribution of mean chlorophyll-a in the surface waters of the North Sea during the growing season (March–September) for the period 2006–2014 is shown in Figure c.
Northern North Sea
In Table b, the annual number of available observations during the growing season (March–September) in the northern North Sea is given for coastal and offshore salinity zones. For the period 1990–2014, 3373 observations during the growing season were available.
Chlorophyll-a observations in the northern North Sea were not always distributed proportionally over all months in the growing season in the period 1990–2014. When the chlorophyll-a concentrations show strong seasonal variation, this can result in a biased growing season mean as months with a higher frequency of observations will statistically weight the mean. For this reason, growing season means were calculated from monthly means. The monthly means were derived from daily means for both salinity zones.
| Year | Coastal waters | Offshore waters |
|---|---|---|
| 1990 | 10 | 104 |
| 1991 | 26 | |
| 1992 | 5 | 84 |
| 1993 | 2 | 308 |
| 1994 | 2 | 103 |
| 1995 | 5 | 90 |
| 1996 | 2 | 137 |
| 1997 | 1 | 83 |
| 1998 | 3 | 140 |
| 1999 | 2 | 84 |
| 2000 | 2 | 37 |
| 2001 | 1 | 55 |
| 2002 | 3 | 46 |
| 2003 | 3 | 137 |
| 2004 | 5 | 184 |
| 2005 | 3 | 149 |
| 2006 | 8 | 266 |
| 2007 | 14 | 180 |
| 2008 | 38 | 152 |
| 2009 | 38 | 137 |
| 2010 | 33 | 202 |
| 2011 | 6 | 153 |
| 2012 | 34 | 124 |
| 2013 | 8 | 111 |
| 2014 | 17 | 36 |
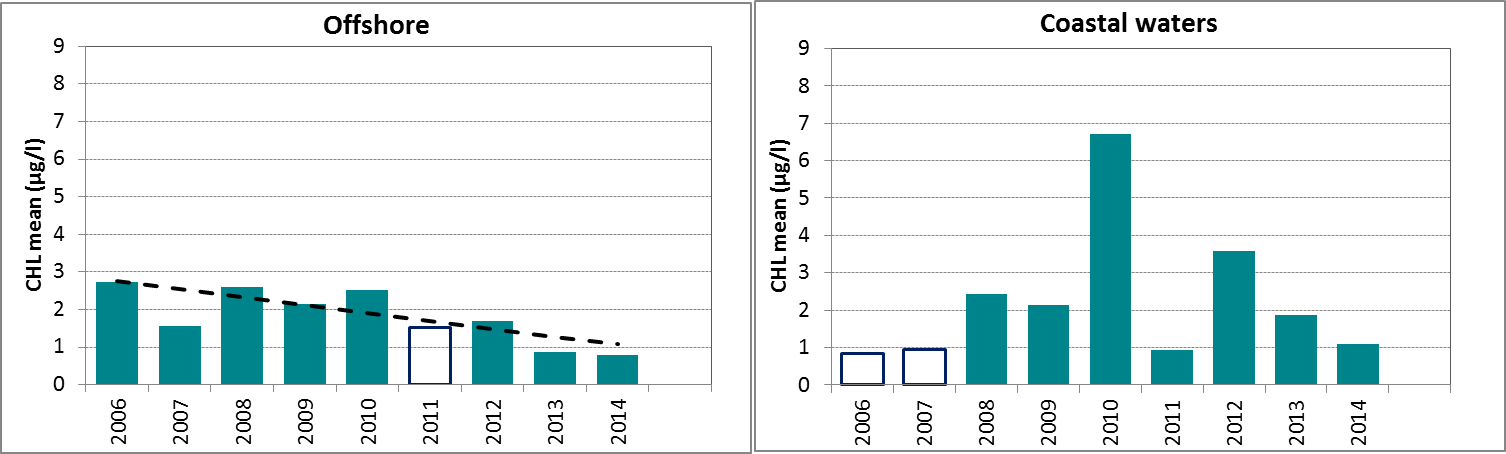
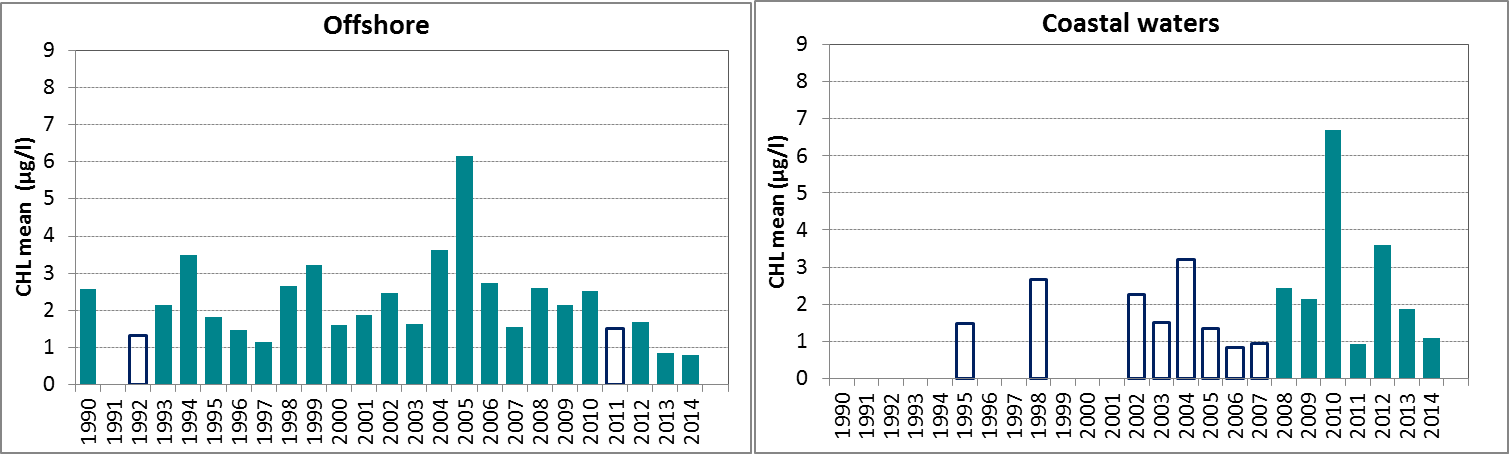
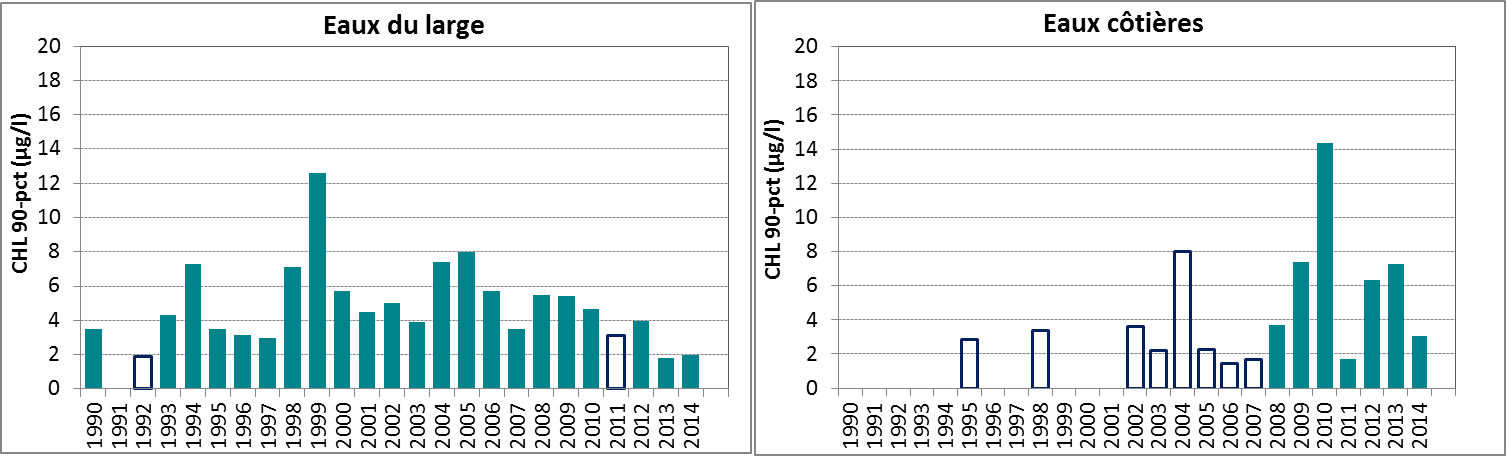
Figure e: Growing season (March-September) mean chlorophyll-a concentration, calculated from monthly means, in the northern North Sea. Assessed in coastal salinity zone (salinity 18 to ≤30) and offshore (salinity >30) over recent years 2006–2014 (upper panel) and over the full period 1990–2014 (lower panel). Coloured bars, years with at least five months with observations; white bars, years with three or four months with observations; years with fewer than three months of observations were not included in the analysis. The dashed line, statistically significant linear trend (p<0.05)
In Figure e, the growing season mean chlorophyll-a concentrations are shown for the offshore and coastal zones of the northern North Sea. The coastal waters of the northern North Sea, comprising Norwegian and United Kingdom coasts, show an uneven distribution of observations. There are many years with few data or many missing months.
In the offshore zone of the northern North Sea, growing season means of chlorophyll-a show a downward trend in the period 2006–2014 (Mann-Kendall test, p<0.05), but no significant trend over the longer period 1990–2014 (Figure e left). This is different from the coastal zone (Figure e right), where no significant trend is observed (Mann-Kendall test, p>0.05). A statistical analysis using 90-percentile values of chlorophyll-a concentration shows similar results (significant downward trend in offshore waters for the period 2006–2014).
Southern North Sea
In Table c, the annual number of available observations during the growing season (March–September) in the southern North Sea is given for coastal and offshore salinity zones. For the period 1990–2014, 7916 observations during the growing season were available.
As for the northern North Sea, chlorophyll-a observations in the southern North sea are not always distributed proportionally over all months in the growing season for the period 1990–2014, which can result in a biased growing season mean. Therefore, growing season means were calculated from monthly means and the monthly means were derived from daily means for both salinity zones.
| Year | Coastal waters | Offshore waters |
|---|---|---|
| 1990 | 6 | 160 |
| 1991 | ||
| 1992 | 1 | 37 |
| 1993 | 5 | 68 |
| 1994 | 3 | 83 |
| 1995 | 167 | 265 |
| 1996 | 47 | 247 |
| 1997 | 53 | 278 |
| 1998 | 15 | 132 |
| 1999 | 17 | 265 |
| 2000 | 21 | 117 |
| 2001 | 130 | 253 |
| 2002 | 129 | 226 |
| 2003 | 100 | 247 |
| 2004 | 103 | 283 |
| 2005 | 129 | 231 |
| 2006 | 139 | 250 |
| 2007 | 130 | 202 |
| 2008 | 104 | 226 |
| 2009 | 111 | 293 |
| 2010 | 178 | 273 |
| 2011 | 179 | 284 |
| 2012 | 285 | 297 |
| 2013 | 257 | 323 |
| 2014 | 190 | 377 |
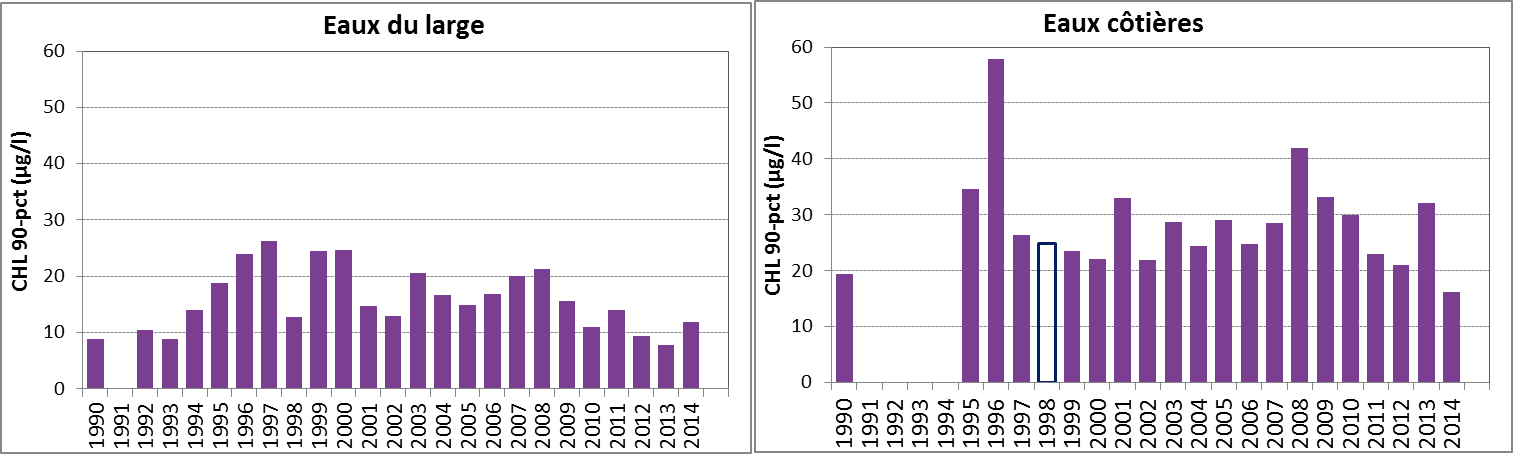
In Figure f, the growing season mean chlorophyll-a concentrations are shown for the offshore and coastal zones of the southern North Sea.
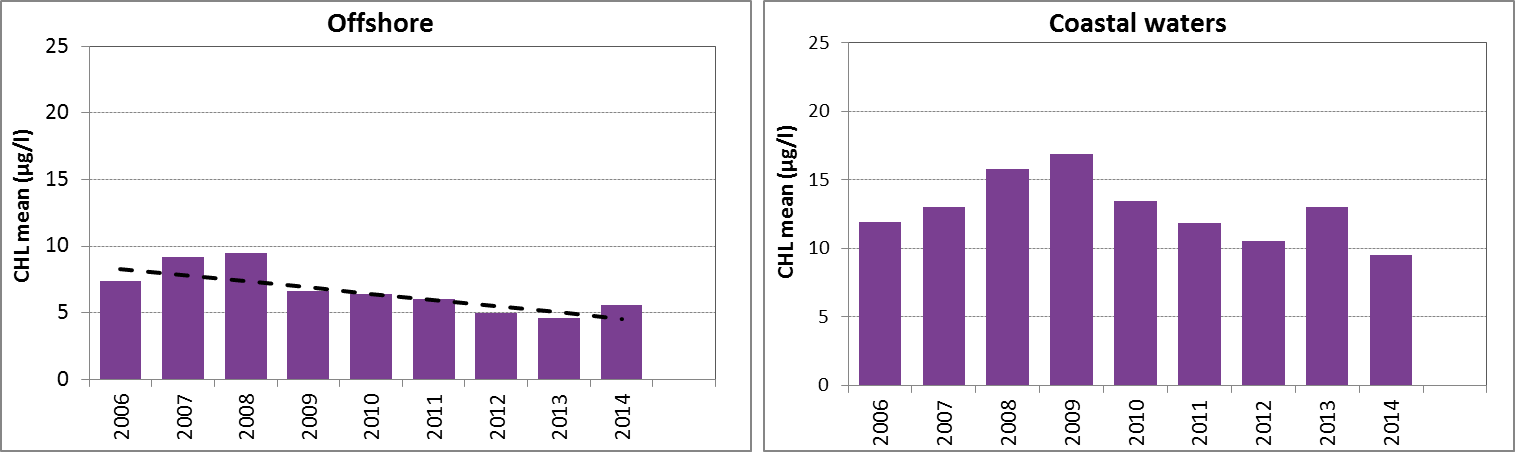
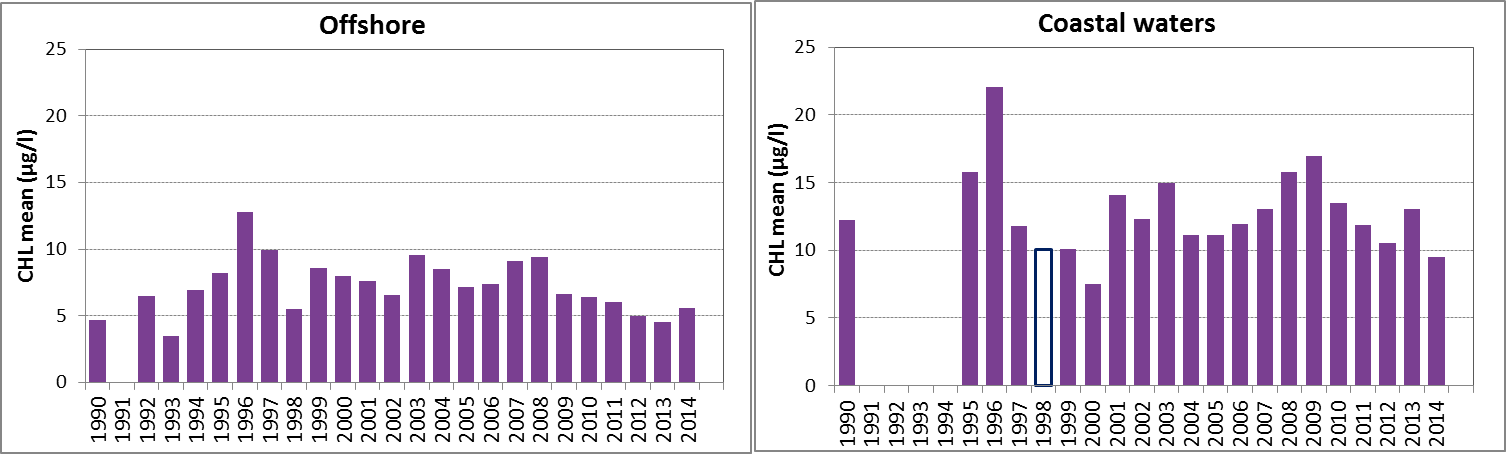
Figure f: Growing season (March-September) mean chlorophyll-a concentrations, calculated from monthly means, in the southern North Sea. Assessed in coastal salinity zone (salinity 18 to ≤30) and offshore (salinity >30) over the recent years 2006–2014 (upper panel) and over the whole period 1990–2014 (lower panel). Coloured bars, years with at least five months with observations; white bars, years with three or four months with observations; years with fewer than three months of observations were not included in the analysis. The dashed line, statistically significant linear trend (p<0.05)
In the southern North Sea, there is a downward trend in chlorophyll-a concentration in the offshore zone, during the period 2006–2014 (Mann-Kendall test, p<0.05) but not during the longer period 1990–2014 (Figure f left). The trends in coastal waters are not significant (p>0.05) (Figure f right). A statistical analysis using 90-percentile values of chlorophyll-a concentration shows similar results (significant downward trend in offshore waters for the period 2006–2014).
Skagerrak, Kattegat and Sound
On the basis of salinity, Skagerrak was divided into coastal waters (salinity ≤27) and offshore waters. For the Kattegat and Sound, salinity was a poor indicator of the coastal / offshore divide due to the brackish Baltic Sea outflow and the dynamic nature of the Skagen front. Trend lines over the assessment period were added where applicable. Figure c gives the spatial distribution of mean chlorophyll-a in the surface waters of the Skagerrak, Kattegat and Sound during the growing season (March–September) for the period 2006–2014.
Skagerrak
In Table d the annual number of available observations in the growing season (March–September) is given for the coastal and offshore zones in the Skagerrak. For the period 1990–2014, 7076 observations during the growing season were available.
| Year | Coastal waters | Offshore waters |
|---|---|---|
| 1990 | 212 | 476 |
| 1991 | 123 | 273 |
| 1992 | 103 | 219 |
| 1993 | 131 | 157 |
| 1994 | 131 | 172 |
| 1995 | 217 | 203 |
| 1996 | 96 | 237 |
| 1997 | 83 | 175 |
| 1998 | 88 | 211 |
| 1999 | 118 | 142 |
| 2000 | 149 | 155 |
| 2001 | 134 | 175 |
| 2002 | 177 | 162 |
| 2003 | 132 | 201 |
| 2004 | 151 | 191 |
| 2005 | 123 | 141 |
| 2006 | 106 | 159 |
| 2007 | 105 | 138 |
| 2008 | 113 | 56 |
| 2009 | 145 | 97 |
| 2010 | 196 | 80 |
| 2011 | 62 | 38 |
| 2012 | 53 | 37 |
| 2013 | 78 | 40 |
| 2014 | 75 | 40 |
Chlorophyll-a observations in the Skagerrak are not always distributed proportionally over all months in the growing season in the period 1990–2014, although the distribution is more even than for the North Sea observations. Therefore, growing season means were calculated from monthly means and monthly means were derived from daily means for both salinity zones.
In Figure g, the growing season mean chlorophyll-a concentrations are shown for the offshore and coastal zones of the Skagerrak.
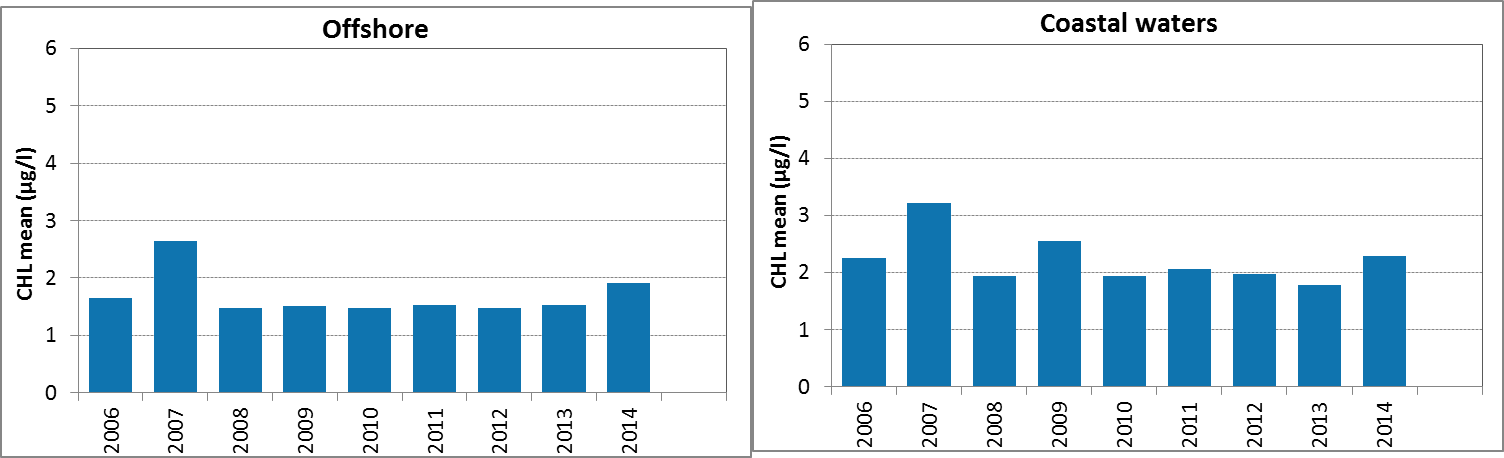
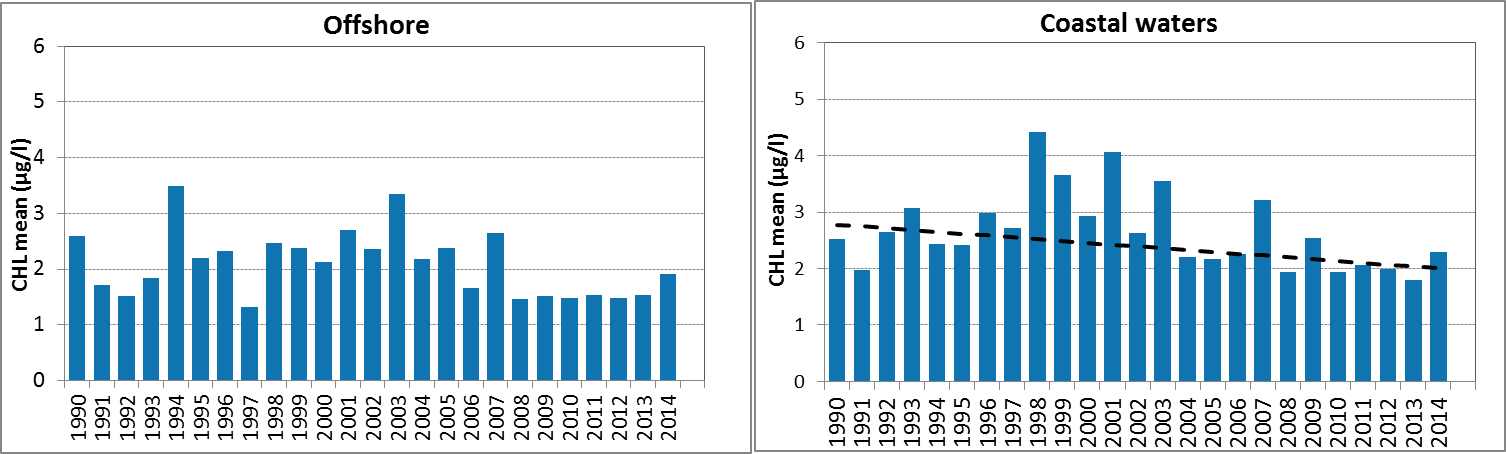
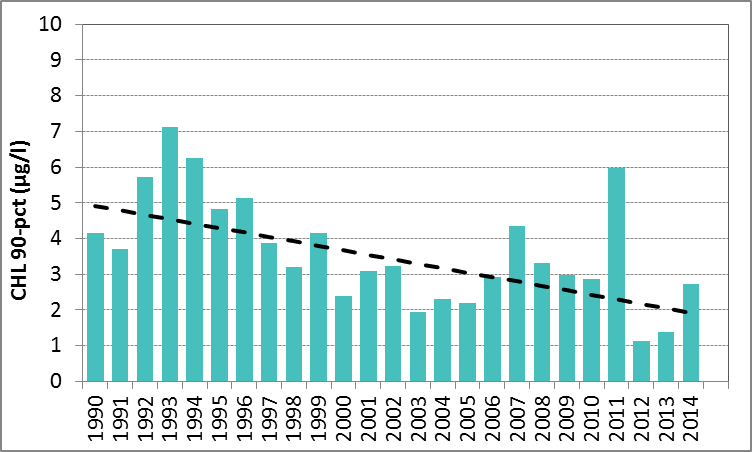
Figure g: Growing season (March-September) mean chlorophyll-a concentrations, calculated from monthly means, in the Skagerrak. Assessed in offshore (salinity >27) and coastal salinity zone (salinity ≤27) over recent years 2006–2014 (upper panel) and over the full period 1990–2014 (lower panel). Coloured bars, years with at least five months with observations. The dashed line, statistically significant linear trend (p<0.05)
In the coastal waters (salinity ≤27) of the Skagerrak, growing season mean chlorophyll-a concentrations show a downward trend during the period 1990–2014 (Mann-Kendall test p<0.05). In the offshore waters the concentrations showed no significant trend. In contrast, a statistical analysis with the 90-percentile values of chlorophyll-a concentration showed a significant downward trend (Mann-Kendall test p<0.05) in the offshore waters for the period 1990–2014, but not for coastal waters.
Kattegat
In Table e the annual numbers of available observations for the growing season (March–September) are given for the Kattegat. For the period 1990–2014, 4787 observations during the growing season were available.
| Year | |
|---|---|
| 1990 | 207 |
| 1991 | 201 |
| 1992 | 237 |
| 1993 | 218 |
| 1994 | 233 |
| 1995 | 228 |
| 1996 | 181 |
| 1997 | 195 |
| 1998 | 209 |
| 1999 | 214 |
| 2000 | 203 |
| 2001 | 233 |
| 2002 | 215 |
| 2003 | 233 |
| 2004 | 193 |
| 2005 | 184 |
| 2006 | 192 |
| 2007 | 195 |
| 2008 | 206 |
| 2009 | 205 |
| 2010 | 141 |
| 2011 | 78 |
| 2012 | 68 |
| 2013 | 159 |
| 2014 | 159 |
Chlorophyll-a observations in the Kattegat are not always distributed proportionally over all months in the growing season in the period 1990–2014, although the distribution is more even than for the North Sea observations. Therefore, growing season means were calculated from monthly means and monthly means were derived from daily means.
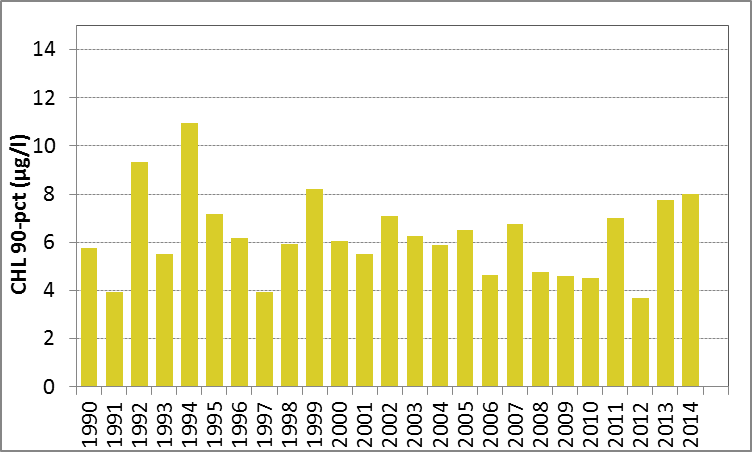
In Figure h the growing season mean chlorophyll-a concentrations are shown for the Kattegat. There were no significant trends (Mann-Kendall test, p>0.05) in chlorophyll-a concentration for either the period 1990–2014 or the period 2006–2014.
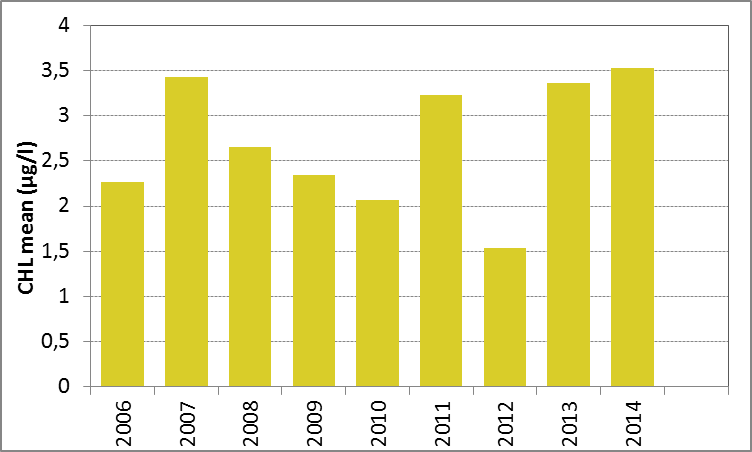
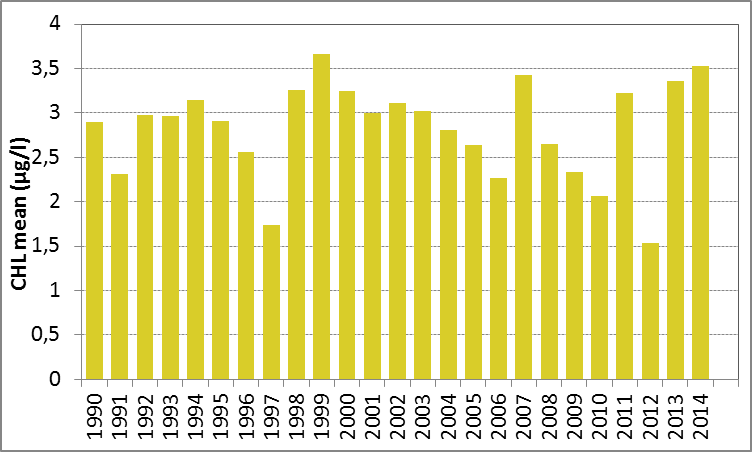
Figure h: Growing season (March-September) mean chlorophyll-a concentration, calculated from monthly means, in the Kattegat. Assessed over recent years 2006–2014 (upper panel) and over the full period 1990–2014 (lower panel). Coloured bars, years with at least five months with observations
Sound
In Table f the annual number of available observations in the growing season (March–September) are given for the Sound. For the period 1990–2014, 923 observations during the growing season were available.
| Year | |
|---|---|
| 1990 | 14 |
| 1991 | 15 |
| 1992 | 13 |
| 1993 | 21 |
| 1994 | 21 |
| 1995 | 24 |
| 1996 | 20 |
| 1997 | 30 |
| 1998 | 64 |
| 1999 | 56 |
| 2000 | 56 |
| 2001 | 52 |
| 2002 | 52 |
| 2003 | 54 |
| 2004 | 48 |
| 2005 | 55 |
| 2006 | 54 |
| 2007 | 48 |
| 2008 | 46 |
| 2009 | 46 |
| 2010 | 50 |
| 2011 | 22 |
| 2012 | 21 |
| 2013 | 20 |
| 2014 | 21 |
Chlorophyll-a observations in the Sound are not always distributed proportionally over all months in the growing season in the period 1990–2014, although the distribution is more even than for the North Sea observations. Therefore, growing season means were calculated from monthly means and monthly means were derived from daily means.
In Figure I the growing season mean chlorophyll-a concentrations are shown for the Sound. The growing season mean chlorophyll-a concentrations showed a significant decrease for 1990–2014 (Mann-Kendall test, p<0.001). A similar analysis using the 90-percentile values of the chlorophyll-a concentrations also showed a significant downward trend (Mann-Kendall test, p<0.01). No trends were observed for 2006–2014.
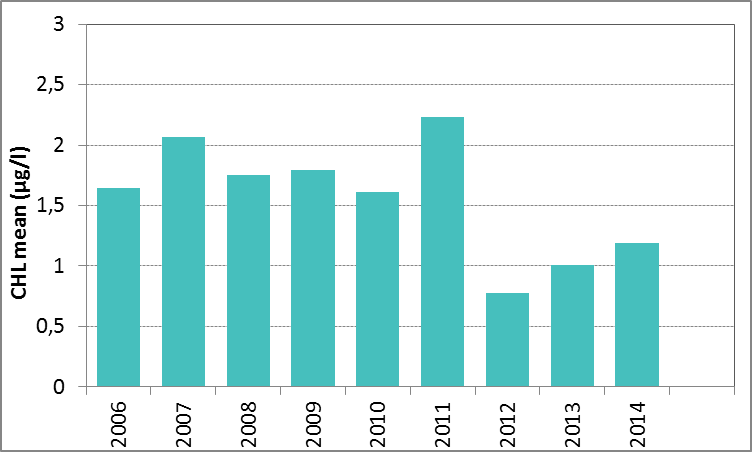
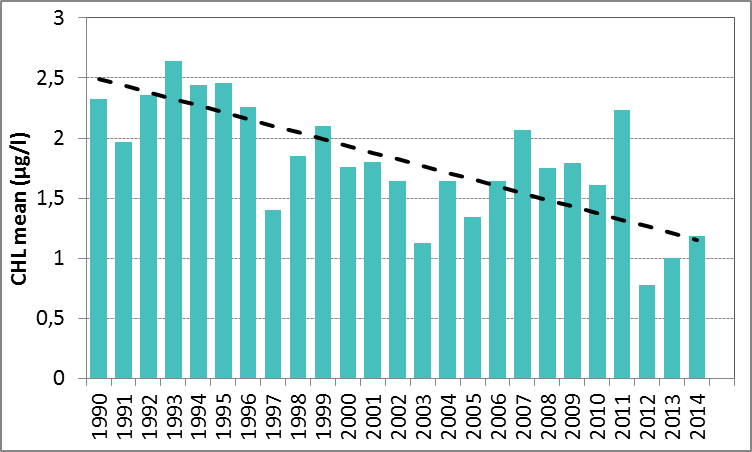
Figure i: Growing season (March–September) mean chlorophyll-a concentration, calculated from monthly means, in the Sound. Assessed over recent years 2006–2014 (upper panel) and over the full period 1990–2014 (lower panel). Coloured bars, years with at least five months with observations. The dashed line, statistically significant linear trend (p<0.05)
Celtic Seas
In Table g, the annual number of available observations in the growing season (March–September) in the Celtic Seas is given for coastal and offshore salinity zones. For the period 1990–2014, 8295 observations during the growing season were available. Data availability before 2007 was limited.
| Year | Coastal waters | Offshore waters |
|---|---|---|
| 1990 | 5 | 8 |
| 1991 | 6 | 21 |
| 1992 | 6 | 13 |
| 1993 | 2 | 11 |
| 1994 | 9 | 3 |
| 1995 | 2 | 68 |
| 1996 | 6 | 50 |
| 1997 | 5 | 64 |
| 1998 | 109 | |
| 1999 | ||
| 2000 | 10 | |
| 2001 | 96 | |
| 2002 | 3 | 121 |
| 2003 | 102 | |
| 2004 | 1 | 240 |
| 2005 | 1 | 185 |
| 2006 | 1 | 283 |
| 2007 | 209 | 552 |
| 2008 | 276 | 525 |
| 2009 | 322 | 544 |
| 2010 | 208 | 684 |
| 2011 | 257 | 776 |
| 2012 | 344 | 753 |
| 2013 | 284 | 865 |
| 2014 | 55 | 210 |
As in the northern North Sea chlorophyll-a observations in the Celtic Seas are not always distributed proportionally over all months in the growing season in the period 1990–2014. Therefore, growing season means were calculated from monthly means and monthly means were derived from daily means for both salinity zones.
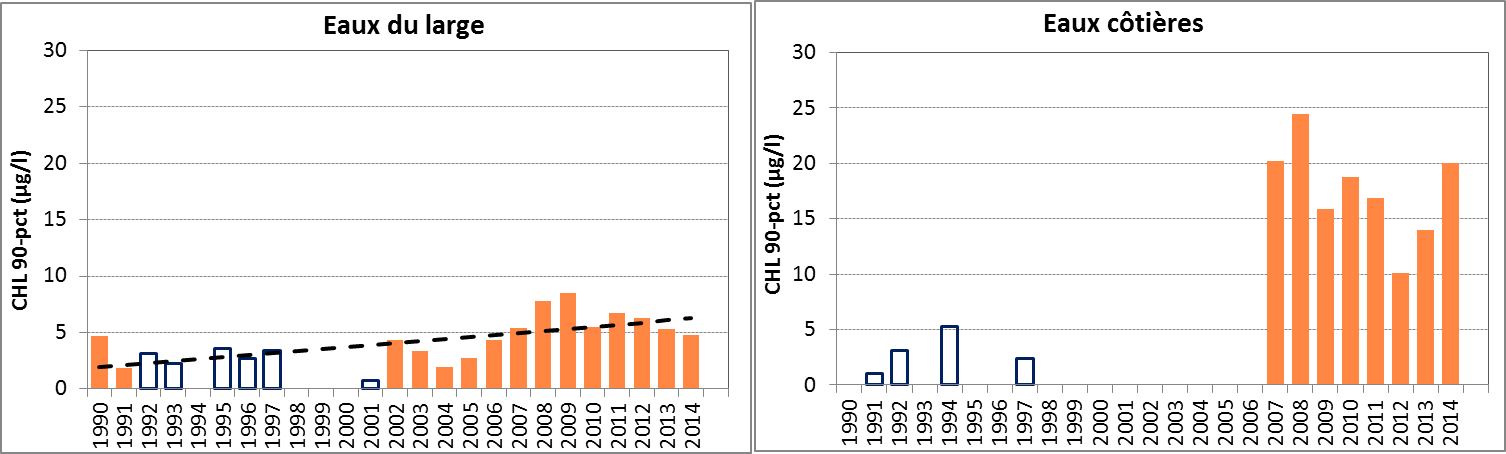
In Figure j the growing season mean chlorophyll-a concentrations are shown for the offshore and coastal zones of the Celtic Seas. The offshore data (>30) for the Celtic Seas still relate to monitoring sites that are close (within a few kilometres) to the coast. The growing season mean chlorophyll-a concentrations as well as the 90-percentile values in the offshore waters showed a slight but significant increase for 1990–2014 (Mann-Kendall test, p<0.05). No trends were observed for 2006–2014.
The chlorophyll-a concentrations shown for the Celtic Seas may be biased relative to other areas due to different analytical methodologies used by different reporting laboratories. The slight upward trend may also be influenced by the different methodologies used, and confidence in this trend assessment is low.
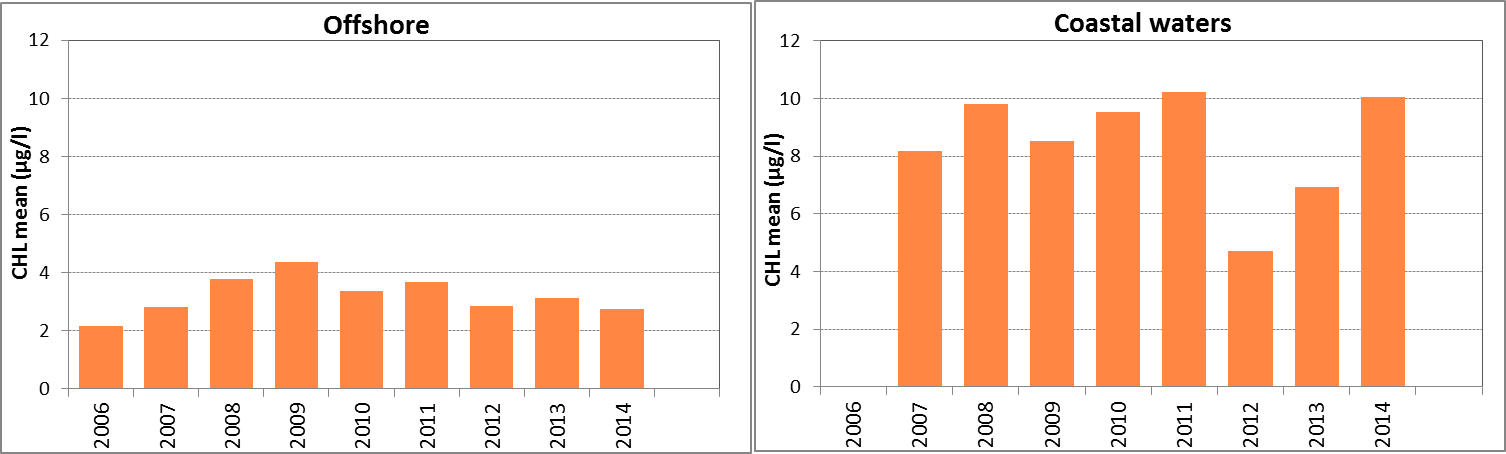
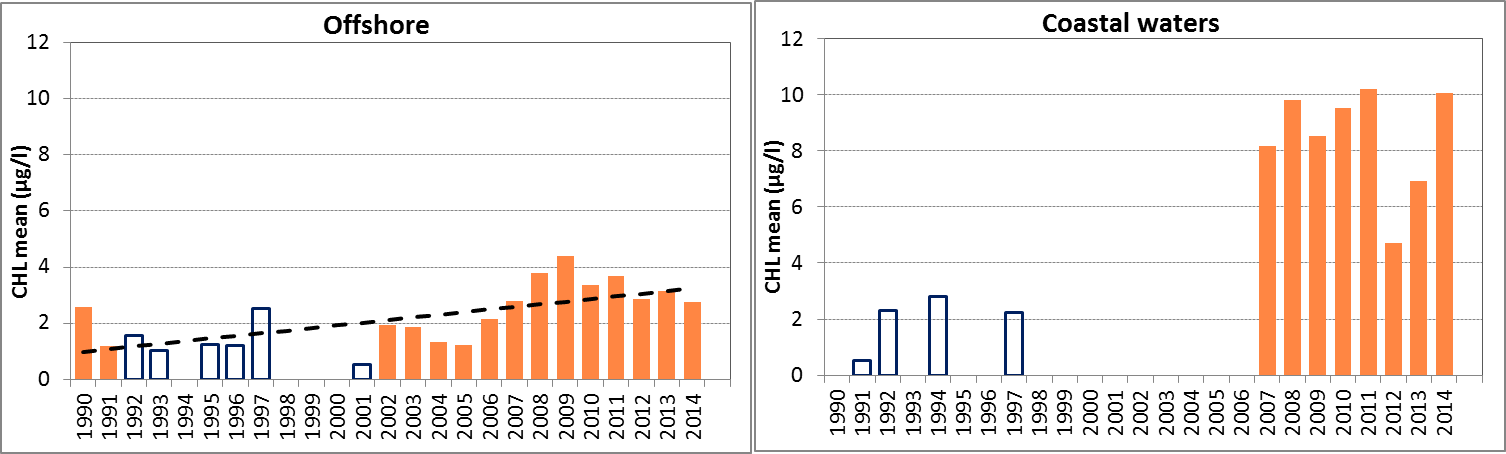
Figure j: Growing season (March–September) mean chlorophyll-a concentration, calculated from monthly means, in the Celtic Seas. Assessed in offshore (salinity >30) and in the coastal salinity zone (salinity 18 to ≤30) over recent years 2006–2014 (upper panel) and over the full period 1990–2014 (lower panel). Coloured bars, years with at least five months with observations; white bars, years with three or four months with observations; years with fewer than three months of observations were not included in the analysis. The dashed line, statistically significant linear trend (p<0.05)
Confidence Rating
There is high confidence in the assessment methodology. The determination of chlorophyll-a concentrations, either as growing season means or as growing season 90-percentiles, has been used for many years in the Common Procedure for the identification of eutrophication (OSPAR Agreement 2013-8) as well as in other assessments (such as the European Union Water Framework Directive). However, the definition of the growing season can differ between the southern and northern OSPAR regions, and this may require some attention once the indicator is also applied in the southern parts of the OSPAR area.
There is high confidence in the data, with generally adequate spatial and temporal coverage of the data, in those areas that have been assessed. However, there are differences between OSPAR regions. The spatial and temporal coverage of the data is very good in most parts of the Greater North Sea (the southern North Sea, Skagerrak, Kattegat and Sound), where data series exist for the entire assessment period 1990–2014. In the northern North Sea, there are some years with data gaps, but more importantly, the spatial coverage is more limited. In the English Channel the data series showed too many gaps to perform a trend assessment. There are also differences between Contracting Parties in monitoring approach and analytical methodology to determine chlorophyll-a concentrations, which decreases the comparability of the data.
In the Celtic Seas, the spatial and temporal coverage of the data has more limitations. Adequate data series exist since 2002. The spatial coverage of the data is mostly limited to data close inshore to the Irish coast and there are relatively few data in the United Kingdom and French parts of the Celtic Seas. The spatial distribution of monitoring effort generally relates to known or expected risks of eutrophication.
For the Bay of Biscay and Iberian Coast, there were insufficient data for a trend assessment.
Conclusion
Les teneurs en chlorophylle-a sont plus élevées dans les eaux côtières que dans les eaux du large. Les teneurs les plus élevées se trouvent le long de la côte continentale de la mer du Nord méridionale.
Au cours de la période d’évaluation (1990–2014), les tendances des teneurs en chlorophylle-a étaient nettement à la baisse statistiquement pendant la saison de croissance dans deux zones, le Skagerrak et le Sund. On a relevé une tendance à la hausse significative dans les eaux au large des mers Celtiques mais des données manquent pour certaines années. Il n’y avait aucune tendance significative pour les années 1990 à 2014, dans d’autres zones. On a relevé des tendances nettement à la baisse statistiquement pour la période de 2006 à 2014, dans les parties au large de la mer du Nord méridionale et septentrionale.
On n’observe pas toujours, dans les systèmes marins et côtiers, un rapport direct entre les apports et les teneurs de nutriments d’une part et les teneurs en chlorophylle-a d’autre part. Ceci est dû à des décalages dans le temps et des facteurs autres que les nutriments qui influencent la croissance et la perte de biomasse de phytoplancton (telles que la luminosité, le broutage, les modifications de la composition des espèces et les processus de transport) et la variabilité spatiale et interannuelle souvent importante dans les conditions de croissance au sein de la zone évaluée.
The assessment for chlorophyll-a for 1990–2014 has been carried out for the Greater North Sea and the Celtic Seas using all available data for all years of this assessment period. For the English Channel and the Bay of Biscay and Iberian coast, the dataset had too many gaps to enable a trend analysis.
Overall, the results show a gradient with higher chlorophyll-a concentrations in coastal waters and lower concentrations in offshore waters. The highest chlorophyll-a concentrations are observed along the continental coast of the southern North Sea from Belgium to Denmark.
Both the growing season means and 90-percentiles show a downward trend in chlorophyll-a concentration in the Sound. In the Skagerrak, a downward trend in coastal waters was observed for chlorophyll-a means, and a downward trend for 90-percentiles was observed in the offshore waters.
An upward trend in chlorophyll-a concentration was observed in offshore waters of the Celtic Seas (both growing season means and 90-percentiles). There were relatively large data gaps in this time series. Moreover, the chlorophyll-a data come from different reporting laboratories using different analytical methods, which may have caused a bias in the results. Therefore, confidence in the observed trend is low.
The more recent assessment period (2006–2014) shows a significant downward trend in the growing season mean chlorophyll-a concentrations in the southern and northern North Sea offshore waters.
The spatial distribution of chlorophyll-a concentrations generally reflects the distribution in nutrient concentrations. However, the observed trends in chlorophyll-a in some assessment areas and the lack of trends in other areas do not show a clear link with observed trends for nutrient inputs and nutrient concentrations. Scientific studies show that it can be difficult to observe a direct relation between nutrient inputs / concentrations and chlorophyll-a concentrations. The effect of changes in nutrient inputs on chlorophyll-a concentrations is often complex, due to the fact that there are many other factors in addition to nutrient concentrations, influencing chlorophyll-a concentrations.
However, there is evidence of the effects of reduced nutrient inputs on phytoplankton production or biomass, for example in the Wadden Sea (Philippart et al., 2007; Van Beusekom et al., 2009) and in Danish estuaries and coastal waters (Lyngsgaard et al., 2014; Riemann et al., 2016; Staehr et al., 2016). The relatively large spatial scale of the assessment areas that is currently used for the Common indicator Chlorophyll-a may have masked the response of the indicator to reduced nutrient inputs. The coastal waters of the southern North Sea, for example, are an area with many gradients in physical and chemical conditions affecting the response of phytoplankton growth and biomass to nutrient inputs. An analysis of the available data at a smaller spatial scale than the current assessment areas might give a more sensitive response of chlorophyll-a to changes in nutrient input.
Lacunes des connaissances
Les méthodes d’analyse de la chlorophylle-a et la conception de la surveillance varient d’un pays à l’autre, entravant la comparabilité des résultats de la surveillance.
La télédétection par satellite est une autre méthode permettant de mesurer la chlorophylle-a dans l’ensemble de la zone maritime OSPAR car elle fournit une source commune de données et offre une solution en cas de pénurie des données dans de nombreuses zones. On a commencé à envisager comment appliquer et organiser cette méthode en mer du Nord, notamment la validation sur place des données satellites et des lignes directrices de l’échantillonnage et de l’analyse harmonisés.
L’évaluation actuelle utilise des zones d’évaluation à grande échelle où l’hétérogénéité spatiale entrave la détection des tendances, mettant en évidence la nécessité d’évaluations spatiales à plus petite échelle.
Harmonising and standardising monitoring and analytical methods between countries is needed for a better comparability of data. This might be difficult because of national conventional techniques and the potential loss of historical data.
In the European project “Towards a Joint Monitoring Programme for the North Sea and Celtic Sea”, chlorophyll-a formed the basis for one of the case studies. In the report on the case study chlorophyll-a (Baretta-Bekker et al., 2015) three aspects are discussed, which are summarised below.
Distribution of observations in time and space: An analysis was undertaken of chlorophyll-a data availability for the assessment of chlorophyll-a in the Greater North Sea (Baretta-Bekker et al., 2015: Annex I). Results showed that monitoring methodology varies between countries. Some countries have fixed stations, which they regularly visit a number of times per year, while other countries apparently monitor irregularly. This would not be a problem if the observations were more or less evenly divided over the growing season, but this is not the case. In some national datasets, the emphasis is on the spring period, while in others emphasis is on the late summer months, and some countries only have monitoring data for a few months. Figure k shows the total number of observations per country and the total number of locations (locations have been defined by the unique combination of year, latitude and longitude) visited per month in the period 2001–2006 by country.
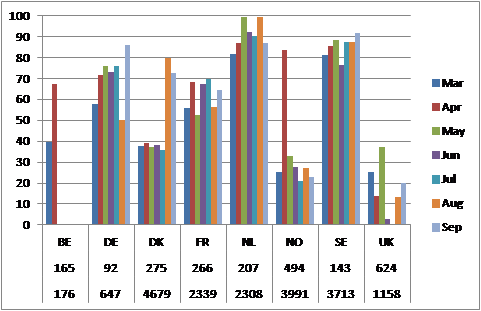
Figure k: Percentage of monitoring stations sampled per month by country. The numbers under the country acronyms show the number of different stations (upper row) and the total number of observations made in the period 2001–2006 (lower row). BE, Belgium; DE, Germany; DK, Denmark; FR, France; NL, the Netherlands; SE, Sweden; UK, United Kingdom. Source: Baretta-Bekker et al. (2015: Annex I)
Chlorophyll-a analytical methods: Baretta-Bekker et al. (2015: Annex II) reviewed the analytical methods currently in use, and the possible consequences for the assessment results. The main differences between methods are the detection method and the solvent used to extract pigments (ethanol, methanol or acetone), but also the type of filter used, the way the filter is stored, and the time before the sample is analysed, all of which may influence results.
Some countries use high performance liquid chromatography (HPLC) as the detection method, while others use fluorometry / photometry. There is a relatively large difference between analytical methods in the precision of chlorophyll-a determination. The ratio between the measurements is dependent on phytoplankton species composition rather than a fixed number, implying that conversion from one method to the other is not possible with standard conversion factors.
The results of the recent comparison by QUASIMEME (Quality Assurance of Information for Marine Environmental Monitoring in Europe) of the results of the different extraction and detection methods are discussed by Baretta-Bekker et al. (2015: Annex II).
There is no single standard extraction technique recommended by OSPAR for the determination of chlorophyll-a, but OSPAR emphasises the importance of recording the method used when reporting data; including storage period and storage temperature, time, and quality assurance techniques.
The different analytical methods used by Contracting Parties and the differences in distribution of the observations imply that the calculated growing season mean concentrations of chlorophyll-a are not directly comparable, and that these differences may contribute significantly to the variance between the observations. It should be noted that in some areas, such as German waters, the results of HPLC and spectrometry are in good agreement, depending on the composition of the plankton community for example.
Remote-sensing observation: Baretta-Bekker et al. (2015: Annex III) described the application of remote sensing chlorophyll-a estimates from satellite images. Satellite remote sensing is a good method for measuring chlorophyll-a across the entire OSPAR Maritime Area. It can provide a common data source and offers a solution for data scarcity in many areas. Work has commenced to investigate how this can be applied and organised in the North Sea, in the European project Joint Monitoring Programme of the Eutrophication of the North Sea with Satellite data (JMP EUNOSAT). This includes development of a survey programme for in situ validation of satellite data, involving guidelines for harmonised sampling and analysis. Under the Common Procedure for the identification of eutrophication, assessments are carried out for specific national assessment areas. These areas were defined taking into account hydrodynamic factors like freshwater influence, (vertical) mixing, and depth. The areas used in the present assessment for the Common indicator Chlorophyll-a are meant to deliver relatively large-scale assessments. The large spatial heterogeneity within these areas hampers trend detection and masks the links between nutrient inputs / concentrations and chlorophyll-a concentrations. Finer spatial scales, i.e. the ecohydrodynamic zones, taking into account transport patterns and stratification is trialled in the Indicator assessment PH2 – Changes in Plankton Biomass and Abundance for chlorophyll-a. Options for aligning the assessment scales between the various indicators for phytoplankton need to be studied.
Baretta-Bekker, Hanneke, Anne Sell, Francisco Marco-Rius, Julia Wischnewski, Pamela Walsham, Lynda, Malin Mohlin, Karin Wesslander, Hans Ruiter, Francis Gohin, Lisette Enserink, 2015. The chlorophyll case study in the JMP NS/CS project. Document produced as part of the EU project: ‘Towards joint Monitoring for the North Sea and Celtic Sea’ (Ref: ENV/PP 2012/SEA). 72 pp.
- Annex I: Baretta-Bekker, Hanneke. Inventory of the Chlorophyll-a data in the ICES database. 23 pp.
- Annex II: Walsham, Pamela, Lynda Webster, Malin Mohlin, Karin Wesslander, Hanneke Baretta-Bekker and Hans Ruiter. Differences in methodologies for chlorophyll analysis and implications for data reporting and assessments under the Marine Strategy Framework Directive. 20 pp.
- Annex III: Gohin, Francis and Hanneke Baretta-Bekker Chlorophyll assessment based on satellite observations, a feasibility study. 9 pp. link: http://www.informatiehuismarien.nl/projecten/joint-monitoring-programme/ and choose Case study Chlorophyll
Cloern, J.E. (2001). Our evolving conceptual model of the coastal eutrophication problem. Marine Ecology Progress Series 210: 223-253.
Cloern, J.E., S.Q. Foster & A.E. Kleckner (2014). Phytoplankton primary production in the world's estuarine-coastal ecosystems. Biogeosciences 11: 2477-2501.
Duarte, C.M., D.J. Conley, J. Carstensen & M. Sánchez-Camacho (2009). Return to Neverland: Shifting baselines affect eutrophication restoration targets. Estuaries and Coasts 32: 29-36.
ECJ 2009. European Court of Justice Judgment of the Court (Third Chamber) of 10 December 2009. European Commission v United Kingdom of Great Britain and Northern Ireland. Failure of a Member State to fulfil obligations – Environment – Directive 91/271/EEC – Urban waste water treatment - Article 3(1) and (2), Article 5(1) to (3) and (5) and Annexes I and II – Initial failure to identify sensitive areas – Concept of ‘eutrophication’ – Criteria – Burden of proof – Relevant date when considering the evidence – Implementation of collection obligations – Implementation of more stringent treatment of discharges into sensitive areas. Case C-390/07 European Court Reports 2009 I-00214
Lyngsgaard, M.M., S. Markager & K. Richardson (2014). Changes in the vertical distribution of primary production in response to land-based nitrogen loading. Limnology and Oceanography 59: 1679-1690.
OSPAR, 2010. Quality Status Report 2010. OSPAR commission. London. 176 pp.
OSPAR Agreement 2010-3. The North-East Atlantic Environment Strategy. Strategy of the OSPAR Commission for the Protection of the Marine Environment of the North-East Atlantic 2010–2020
OSPAR Agreement 2013-8. Common Procedure for the Identification of the Eutrophication Status of the OSPAR Maritime Area. Supersedes Agreements 1997-11, 2002-20 and 2005-3
Philippart, C.J.M., J.J. Beukema, G.C. Cadée, R. Dekker, P.W. Goedhart, J.M. Iperen, M.F. Leopold & P.M.J. Herman (2007). Impacts of Nutrient Reduction on Coastal Communities. Ecosystems 10: 96-119.
Riemann, B., J. Carstensen, K. Dahl, H. Fossing, J.W. Hansen, H.H. Jakobsen, A.B. Josefson, D. Krause-Jensen, S. Markager, P.A. Stæhr, K. Timmermann, J. Windolf & J.H. Andersen (2016). Recovery of Danish Coastal Ecosystems After Reductions in Nutrient Loading: A Holistic Ecosystem Approach. Estuaries and Coasts 39: 82-97.
Staehr, P.A., J. Testa & J. Carstensen (2017). Decadal Changes in Water Quality and Net Productivity of a Shallow Danish Estuary Following Significant Nutrient Reductions. Estuaries and Coasts: 40: 63-79.
Van Beusekom, J.E.E., M. Loebl & P. Martens (2009). Distant riverine nutrient supply and local temperature drive the long-term phytoplankton development in a temperate coastal basin. Journal of Sea Research 61: 26-33.