

Winter Nutrient Concentrations in the Greater North Sea, Celtic Seas and Bay of Biscay and Iberian Coast

Background
OSPAR’s strategic objective with regard to eutrophication is to tackle eutrophication through limiting inputs of nutrients and organic matter to levels that do not give rise to adverse effects on the marine environment, with the vision of a clean, healthy and biologically diverse North-East Atlantic. This indicator on winter nutrient concentrations is one of a suite of eutrophication indicators. When assessed and considered together in the OSPAR Common Procedure in a multi-step method the suite of indicators can be used to diagnose eutrophication.
Nutrients such as nitrogen and phosphorus enter the marine environment from the atmosphere, land runoff including rivers, or by direct discharges into the sea. Human activities can result in large quantities of nutrients entering the sea from sources that include agriculture, combustion processes (road traffic, shipping, power plants), municipal and industrial wastewater treatment and aquaculture. Higher nutrient inputs will cause higher total nutrient concentrations in the sea. However, the uptake by plant, in particular phytoplankton means that the inorganic fractions can remain low in the growing season. Therefore, winter concentrations of inorganic fractions (nitrite, nitrate and ammonium for nitrogen, sum = DIN and phosphate = DIP) are a good indicator for eutrophication and represent a starting point for the primary production in the following growing season.
Interaction of nutrient-rich sediment plumes from land with upwelling can cause phytoplankton blooms, as shown in Figure 1 for the French west coast based on nutrient input from different sources.
In the present assessment as part of the fourth application of the Common Procedure (COMP4), a regionally coherent assessment of winter nutrient concentrations is performed at the level of transboundary ecologically relevant assessment areas using agreed common thresholds. The automated assessment tool COMPEAT was used to assess winter nutrient concentrations and along with chlorophyll-a and dissolved oxygen concentrations also the overall eutrophication status.
")
Figure 1: Sediment plumes from land interacting with upwelling to cause phytoplankton blooms along the French west coast. Picture from Godard Space Flight Center (NASA)
Eutrophication is the result of the excessive enrichment of water with nutrients. This may cause accelerated growth of algae and / or higher forms of plant life ( Commission Decision 2017/848 ). This may result in an undesirable disturbance to the balance of organisms present and thus to the overall water quality. Undesirable disturbances can include shifts in the composition and extent of flora and fauna and the depletion of oxygen due to decomposition of accumulated biomass (Brockmann et al., 2018; Van Beusekom et al., 2019). Such disturbances then have other effects, such as changes in habitats and biodiversity, blooms of nuisance algae or macroalgae, decrease in water clarity and decrease in fish stocks due to food shortage when benthic animals die, or direct fish kills due to low oxygen concentrations. Identifying causal links between these disturbances and nutrient enrichment can be complicated by other pressures. Cumulative effects, including climate change, may have similar effects on biological communities and dissolved oxygen, further complicating efforts to demonstrate causal links.
The North-East Atlantic Environment Strategy (NEAES) 2030 contains the OSPAR Commission’s strategic objective to achieve clean seas for the North-East Atlantic by 2030. This includes tackling eutrophication through ‘limiting inputs of nutrients and organic matter to levels that do not give rise to adverse effects on the marine environment’ (OSPAR, 2021). This strategic objective requires assessment of eutrophication to be based on the ecological consequences of nutrient enrichment and not just on nutrient enrichment alone, i.e., finding reliable evidence for accelerated growth of algae and/or macrophytes caused by anthropogenic nutrient enrichment, leading to undesirable disturbance. Eutrophication is diagnosed using OSPAR’s harmonised criteria of nutrient inputs and concentrations, chlorophyll concentrations, and dissolved oxygen levels supplemented by phytoplankton, macrophytes and changes in zoobenthos where appropriate (OSPAR, 2022). As there is no single indicator of disturbance caused by marine eutrophication, OSPAR applies a multi-step method using the harmonised criteria. Eutrophication is considered to have occurred if there is evidence for all of the stages shown in Figure a, and of causal links between them.
. Common Indicators are highlighted in red")
Figure a: Generic conceptual framework to assess eutrophication in all categories of surface waters illustrating the main cause/effect linkages (OSPAR, 2022). Common Indicators are highlighted in red
For the current assessment, four harmonised eutrophication criteria have been assessed: nutrient inputs, winter concentrations of dissolved inorganic phosphate and nitrogen, chlorophyll concentrations and dissolved oxygen levels near the seafloor. These are highlighted in Figure a. The individual assessment results of any one of these four common indicators do not diagnose eutrophication by themselves. However, the indicator assessments provide useful information about trends and are important for informing management measures.
Elevated nutrient concentrations promote the growth of phytoplankton and other plant life. Dissolved inorganic nutrient concentrations of nitrogen and phosphorus act as indicators for quantifying the pressures of human activities and for evaluating the success of measures taken. Changes in nutrient concentrations and ratios can have ecosystem effects such as altering phytoplankton community composition (Burson et al., 2016; Van Beusekom et al., 2019; Greenwood et al., 2019).
Nutrient concentrations are generally higher in coastal waters and are mainly determined by riverine nutrient inputs (discharge and direct inputs). Due to mixing processes, nutrient concentrations decrease seaward and are lower in offshore areas.
Winter nutrient concentrations of DIN and DIP were assessed in three previous applications of the Common Procedure (OSPAR 2003, 2008, 2017) for the identification of eutrophication in the OSPAR Maritime Area and were also part of the OSPAR Quality Status Report 2010 (OSPAR, 2010). All of these assessments followed the methodology agreed in the Common Procedure. Nevertheless, assessments were based on nationally defined assessment areas and national threshold values, which limited comparability between countries (Topcu and Brockmann, 2021). The current (fourth) application of the COMP reflects the adaptive management of the ecosystem approach, incorporating a complete revision in assessment areas and threshold values, based on the best available scientific knowledge from EU projects such as JMP EUNOSAT (Enserink et al., 2019), and further developed in OSPAR’s own Eutrophication Modelling group ICG-EMO.
In this indicator assessment, nutrient concentrations of DIN and DIP in OSPAR Regions II, III and IV have been assessed with the COMPEAT tool (see ‘Data analysis’ below), using harmonised and coherent thresholds.
The current assessment contributes to Operational Objective S1.O1 under the NEAES: ‘By 2022 OSPAR will implement an automated eutrophication assessment tool to deliver harmonised and transparent assessments for OSPAR and the Marine Strategy Framework Directive and to provide support for the development of the Sustainable Development Goal 14.1.1 Index of Coastal Eutrophication in 2025’.
Assessment areas
For the 4th application of the Common Procedure (COMP), new harmonised assessment areas have been defined that represent ecologically relevant areas in OSPAR Regions II, III and IV (Figure b). The assessment has been expanded since the Intermediate Assessment 2017 and many areas in OSPAR Regions III and IV in the south-western part of the OSPAR Maritime Area are assessed for the first time as they were not part of previous COMP assessments (OSPAR, 2017).
Figure b: Overview of ecologically relevant assessment areas based on duration of stratification, mean surface salinity, depth, suspended particulate matter and primary production. For a more complete description of the method used to define the areas refer to Enserink et al., 2019. Assessment area codes and names are listed in Table a. Available at: https://odims.ospar.org/en/submissions/ospar_comp_au_2023_01/
These assessment areas can be categorized in four different types with distinct characteristics: river plumes, coastal waters, shelf, and oceanic areas. River plumes are areas located closest to the coast and within the influence of rivers with variable salinity and strongly influenced by river discharges and nutrient inputs. Coastal waters are areas other than river plumes, with mean salinity ≤34,5. Shelf areas are areas with salinity > 34,5 and depths < 200 m, while oceanic/beyond shelf are defined according to depths > 200 m.
Results of the nutrient assessment and the trend analysis are grouped according to the four assessment area types. In addition, results of individual assessment areas are shown based on specific processes or developments where relevant.
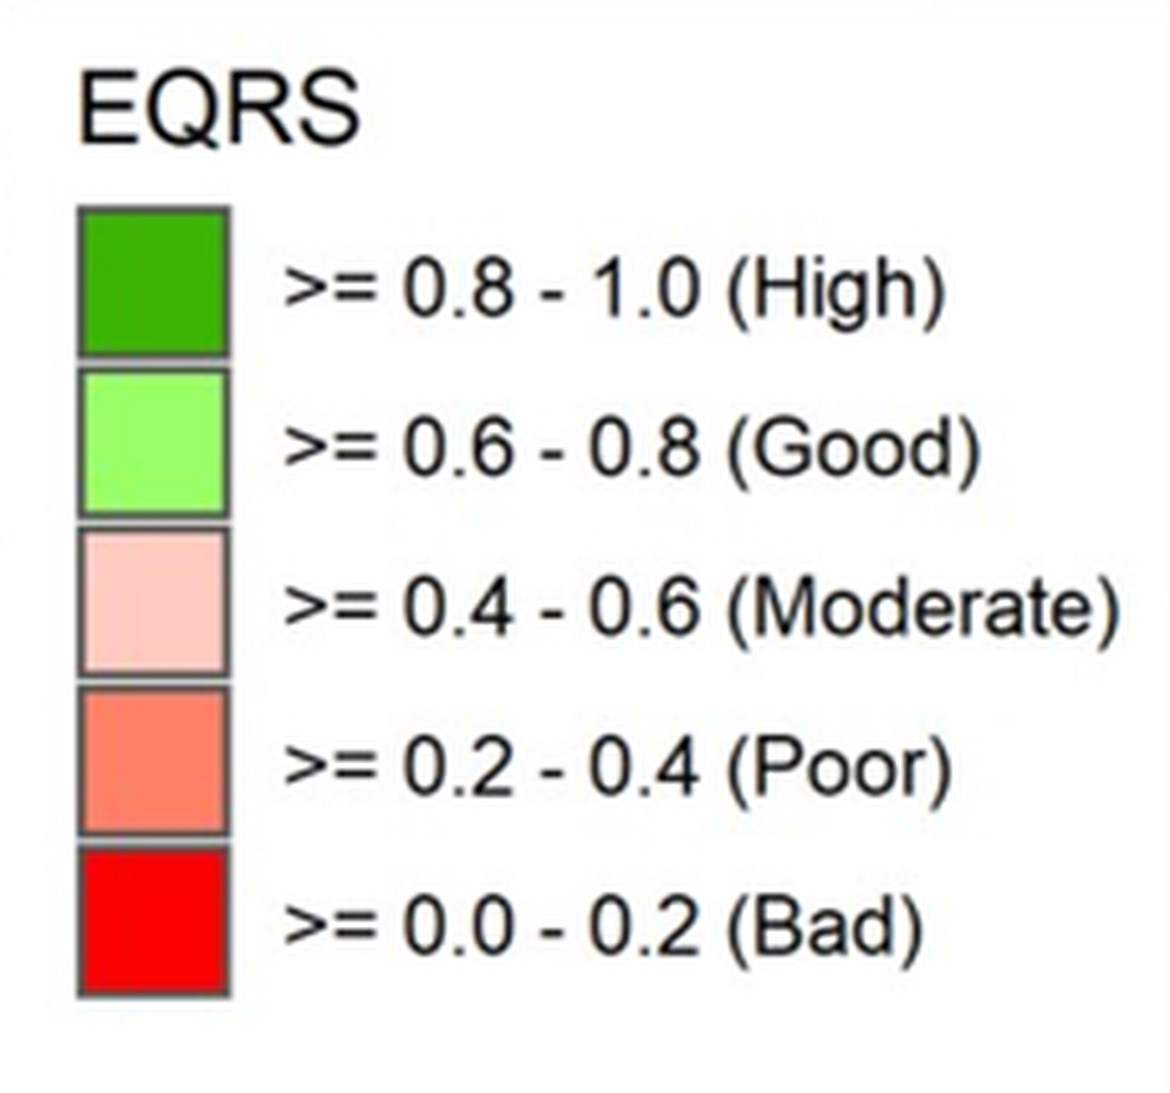
Table a: Assessment areas of the North-East Atlantic grouped into categories of river plumes, coastal, shelf, and oceanic areas including allocation to OSPAR Regions (based on the largest share when region boundaries split assessment areas, indicated in bold). The outcome of the COMP4 assessment is also shown as EQRS values with colour coding showing the status, areas not assessed are indicated in grey.
Categories of COMP 4 assessment areas | Area code | Area name | OSPAR Region | Ecological Quality Ratio Scaled (EQRS) DIN | Ecological Quality Ratio Scaled (EQRS) DIP |
|---|---|---|---|---|---|
River plumes | ADPM | Adour plume | IV | NA | NA |
ELPM | Elbe plume | II | 0,29 | 0,51 | |
EMPM | Ems plume | II | 0,34 | 0,67 | |
GDPM | Gironde plume | IV | NA | NA | |
HPM | Humber plume | II | 1,00 | 0,97 | |
LBPM | Liverpool Bay plume | III | NA | NA | |
LPM | Loire plume | IV | NA | NA | |
MPM | Meuse plume | II | 0,58 | 1,00 | |
RHPM | Rhine plume | II | 0,36 | 0,83 | |
SCHPM1 | Scheldt plume 1 | II | 0,40 | 0,91 | |
SCHPM2 | Scheldt plume 2 | II | 1,00 | 1,00 | |
SHPM | Shannon plume | III | 0,39 | 0,95 | |
SPM | Seine plume | II | 0,65 | 0,71 | |
THPM | Thames plume | II | 0,73 | 0,81 | |
Coastal areas | CFR | Coastal FR channel | II | 0,64 | 0,59 |
CIRL | Coastal IRL 3 | III | 0,78 | 0,82 | |
CNOR1 | Coastal NOR 1 | II | NA | NA | |
CNOR2 | Coastal NOR 2 | II | NA | NA | |
CNOR3 | Coastal NOR 3 | II | 0,72 | 0,85 | |
CUK1 | Coastal UK 1 | III | 0,85 | 1,00 | |
CUKC | Coastal UK channel | II | 0,90 | 0,93 | |
CWAC | Coastal Waters AC (D5) | IV | 0,59 | 0,86 | |
CWBC | Coastal Waters BC (D5) | IV | 0,86 | 0,93 | |
CWCC | Coastal Waters CC (D5) | IV | 0,91 | 1,00 | |
ECPM1 | East Coast (permanently mixed) 1 | II | 0,95 | 0,90 | |
ECPM2 | East Coast (permanently mixed) 2 | II | 0,95 | 0,98 | |
GBC | German Bight Central | II | 0,39 | 0,76 | |
IRS | Irish Sea | III | 0,83 | 0,79 | |
| KC | Kattegat Coastal | II | 0,39 | 0,52 | |
| KD | Kattegat Deep | II | 0,42 | 0,58 | |
NAAC1A | Noratlantic Area NOR-NorC1(D5)A | IV | 1,00 | 1,00 | |
NAAC1B | Noratlantic Area NOR-NorC1(D5)B | IV | NA | NA | |
NAAC1C | Noratlantic Area NOR-NorC1(D5)C | IV | NA | NA | |
NAAC1D | Noratlantic Area NOR-NorC1(D5)D | IV | NA | NA | |
NAAC2 | Noratlantic Area NOR-NorC2(D5) | IV | 1,00 | 1,00 | |
NAAC3 | Noratlantic Area NOR-NorC3(D5) | IV | 1,00 | 1,00 | |
OC | Outer Coastal DEDK | II | 0,56 | 0,79 | |
SAAC1 | Sudatlantic Area SUD-C1(D5) | IV | 1,00 | NA | |
SAAC2 | Sudatlantic Area SUD-C2(D5) | IV | NA | NA | |
SAAP2 | Sudatlantic Area SUD-P2(D5) | IV | NA | NA | |
| SNS | Southern North Sea | II | 0,66 | 0,88 | |
Shelf areas | ASS | Atlantic Seasonally Stratified | III, IV | 0,85 | 0,95 |
| CCTI | Channel coastal shelf tidal influenced | II | 0,84 | 0,79 | |
| CWM | Channel well mixed | II, III | 0,96 | 1,00 | |
| CWMTI | Channel well mixed tidal influenced | II | 0,75 | 0,87 | |
| DB | Dogger Bank | II | 0,83 | 0,95 | |
| ENS | Eastern North Sea | II | 0,84 | 0,85 | |
GBCW | Gulf of Biscay coastal waters | IV | NA | NA | |
GBSW | Gulf of Biscay shelf waters | IV | NA | NA | |
IS1 | Intermittently Stratified 1 | II, III | 0,99 | 0,99 | |
IS2 | Intermittently Stratified 2 | II | 0,97 | 0,99 | |
NAAP2 | Noratlantic Area NOR-NorP2(D5) | IV | 1,00 | 1,00 | |
NAAPF | Noratlantic Area NOR-Plataforma | IV | NA | NA | |
| NNS | Northern North Sea | II | 0,96 | 0,88 | |
| NT | Norwegian Trench | II | 0,87 | 0,86 | |
| SAAP1 | Sudatlantic Area SUD-P1(D5) | IV | NA | NA | |
| SK | Skagerrak | II | 0,43 | 0,82 | |
| SS | Scottish Sea | II,III | 0,94 | 0,96 | |
Oceanic / beyond shelf | ATL | Atlantic | II, IV,V | 0,90 | 0,89 |
| NAAO1 | Noratlantic Area NOR-NorO1(D5) | IV | NA | NA | |
| OWAO | Ocean Waters AO (D5) | IV | NA | NA | |
| OWBO | Ocean Waters BO (D5) | IV | NA | NA | |
| OWCO | Ocean Waters CO (D5) | IV | NA | NA | |
| SAAOC | Sudatlantic Area SUD-OCEAN(D5) | IV | NA | NA |
Assessment period
For the spatial distribution of winter nutrient concentrations and the assessment of short-term trends, the COMP4 assessment period 2015–2020 is used. For the assessment of long-term trends in nutrient concentrations, the assessment period is 1990–2020 to continue the trend development since the COMP3 assessment. To reflect developments since the QSR 2010, the period 2010-2020 is also considered to identify the current trends.
Data sources
Data for all nutrient compounds used in the assessment have been obtained from the database of the International Council for the Exploration of the Sea (ICES), partly supplemented by national data. The data were retrieved from the database in June 2022.
Data analysis
For the data analysis the automated tool COMPEAT, developed by ICES, was used for the first time. The R script and additional information is available on GitHub (https://github.com/ices-tools-prod/COMPEAT). Mean nutrient concentrations were calculated for all assessment areas in COMPEAT using the winter period from December to February, where data was available. The mean is calculated across years from all data during the winter months, i.e., data of the month of December of a given year are averaged with data of the subsequent months January and February of the following year (December, January, February in sequence). This method smooths short-time variability and data resolution and avoids the dominance of frequently sampled areas. Annual (seasonal) means of nutrient concentrations and subsequent assessment results and status classification related to achieved or failed thresholds have been calculated in COMPEAT. Assessment results are summarised in tables and visualised in bar charts and maps, which are produced as output files in the tool. Time-series of nutrient concentrations over the entire assessment period (1990-2020), including trend analysis, were carried out outside the COMPEAT tool.
For trend assessments, the Mann-Kendall non-parametric test for linear trends was used to calculate significance (https://cran.r-project.org/web/packages/TTAinterfaceTrendAnalysis/TTAinterfaceTrendAnalysis.pdf). The Mann Kendall trend test is used to analyse data collected over time for consistently increasing or decreasing trends. This test was carried out in R version 4.2.1 with R package TTAinterfaceTrendAnalysis v.1.5.8 for temporal trend analysis. Statistically significant trends (p<0,05) are included in the description of the assessment results. The trend assessment was carried out for the long-term period 1990-2020 and separately for different COMP assessment periods (COMP1-4). In addition, the period since the QSR 2010 was analysed to identify possible trends. Due to the high variability of data, long-term data series are better suited for detecting statistically significant trends.
Data coverage
Spatial and temporal data coverage is generally adequate in the areas assessed (see confidence rating in ‘Results extended’ for detailed maps on temporal and spatial confidence). Limitations in the availability of annual data are apparent in some assessment areas. It is unclear whether the limited data availability in these areas is due to a lack of reporting to the ICES database or due to a lack of measurements. There are also assessment areas without nutrient data where no assessment was possible. In general, monitoring is more frequent and spatially more densely distributed in coastal areas compared to offshore areas, consistent with monitoring strategies that reflect the higher variability closer to the coast associated with impacts from land.
The overview of annual data for DIN and DIP between 1990-2020 per assessment area category in Figure c shows similar developments for DIN and DIP data. In shelf areas, the trendline indicates a more or less stable number of data over time, with peaks in some years (due to an exceptionally high number of observations in few areas), but also a remarkable decrease in the number of data in the last two years. In oceanic areas, the trendline is slightly increasing due to a higher number of data in the period after the QSR 2010, but also shows some data gaps in individual years. Due to a large difference in the number of available DIN and DIP data in 1994, the trendlines for DIN and DIP in oceanic areas are slightly different. The amount of data in coastal areas shows a slightly decreasing trend with varying numbers over time, and similar to shelf areas the lowest number of data in 2020, which is most likely due to reduced monitoring because of Covid-19 restrictions. The strongest decreasing trend for the number of data has been observed in river plumes, showing a pronounced decrease since 2004 and a subsequent lower level of data.
Number of DIN and DIP data per year in River plumes
Number of DIN and DIP data per year in Coastal areas
Number of DIN and DIP data per year in Shelf areas
Number of DIN and DIP data per year in Oceanic areas
Figure c: Number of annual data of DIN and DIP between 1990 and 2020 in the different categories of river plumes, coastal, shelf and oceanic areas
Dealing with data gaps
All data available from the ICES database were used for the assessment of winter nutrient concentrations. Data from automated measurements or buoy data were not yet made available to ICES. Data gaps were not interpolated or otherwise filled.
Data variability
Interannual variability (standard deviation) in offshore areas is generally lower than in coastal areas or river plumes. Fewer data in an assessment area often result in lower standard deviations compared to areas with more data. This probably indicates well-designed, risk-based monitoring programmes. Offshore areas with low variability can be sampled infrequently, while efforts are concentrated in regions where variability is greater and thus where more samples are needed to ensure sufficient confidence in the resulting assessment.
Results
The assessment of winter nutrient concentrations was performed with COMPEAT for the most recent COMP4 period (2015-2020) and also backwards for the previous assessment periods of COMP 1 (1990-2000), COMP2 (2001-2006) and COMP3 (2006-2014). Assessment areas and thresholds agreed for the application of COMP4 have also been used for assessing previous periods to identify developments over time, and therefore differ from assessment areas and national thresholds that were used previously.
Assessment results of winter DIN concentrations in the COMP4 period are shown in Figure 2. In most areas, the thresholds were met as illustrated by the green colour scheme for the classes good and high based on the scaled ecological quality ratio (EQRS). However, in the south-eastern North Sea, Skagerrak and Kattegat and several river plumes, DIN concentrations remain above thresholds, resulting in a moderate or poor status classification and indicating possible eutrophication problems. The result for each assessment unit is shown as EQRS-values in Table a.
In total, twelve areas were classified as moderate or worse due to high winter DIN concentrations. In terms of area per category being in not good status, these areas represent 61% of the river plumes, 24% of coastal waters and less than 1% of shelf waters in the OSPAR area assessed (Regions II, III and IV). The majority of areas in moderate or worse status (10 out of 12 areas) was located in Region II.
Figure 2: Assessment results of winter DIN for the period 2015-2020 in OSPAR Regions II, III and IV. Available at: https://odims.ospar.org/en/submissions/ospar_din_eqrs_2020_06/
| Area code | Area name | Category | OSPAR Region | Status/EQRS class | Confidence |
|---|---|---|---|---|---|
| ELPM | Elbe plume | River plume | II | Poor | Moderate |
| EMPM | Ems plume | River plume | II | Poor | Low |
| MPM | Meuse plume | River plume | II | Moderate | Moderate |
| RHPM | Rhine plume | River plume | II | Poor | High |
| SCHPM1 | Scheldt plume 1 | River plume | II | Poor | Moderate |
| SHPM | Shannon plume | River plume | III | Poor | - |
| CWAC | Coastal Waters AC | Coastal | IV | Moderate | Low |
| GBC | German Bight central | Coastal | II | Poor | Moderate |
| OC | Outer Coastal DEDK | Coastal | II | Moderate | High |
| KC | Kattegat Coastal | Coastal | II | Poor | High |
| KD | Kattegat Deep | Coastal | II | Moderate | High |
| SK | Skagerrak | Shelf | II | Moderate | High |
The confidence in areas with winter DIN concentrations above thresholds was predominantly classified as moderate or high. Only the Ems plume and Portuguese coastal waters (CWAC) were classified as low, while confidence assessment in the Shannon plume was not possible based on only two available data points resulting in a less reliable status classification. Most of the areas with elevated DIN concentrations along the continental coast from Belgium to Denmark also showed chlorophyll concentrations above thresholds.
Assessment results of winter DIP concentrations in the COMP4 period are shown in Figure 3. In the vast majority of areas, the thresholds for winter DIP concentrations were achieved resulting in good, or high, status classifications. Only in the Kattegat (coastal and deep areas), the Elbe plume and the French coastal channel area, DIP concentrations were above thresholds leading to moderate status classifications.
Figure 3: Assessment results of winter DIP for the period 2015-2020 in OSPAR Regions II, III and IV. Available at: https://odims.ospar.org/en/submissions/ospar_dip_eqrs_2020_06/
Only four out of 43 areas assessed were above the threshold and classified as moderate, corresponding to 38% of the river plumes and 11% of coastal waters in the OSPAR area assessed (Regions II, III and IV) being in not good status (surface area in km2). All four areas in moderate status were located in Region II. In all other areas, winter DIP concentrations were below the threshold, resulting in good and predominantly high status.
In the trend assessment for the period 2015-2020 no significant trends could be determined. In areas with moderate or worse status classification for winter DIN and DIP concentrations, decreasing trends were observed in several river plumes such as Meuse, Rhine and Scheldt plumes, but these were not statistically significant.
Confidence rating of assessments
The confidence assessment in COMPEAT includes temporal and spatial confidence aspects as well as accuracy of classification. The different aspects are combined to obtain the overall confidence result (Figure 4). The temporal confidence for DIN indicated high confidence in large parts of OSPAR Region II with only a few exceptions, while in the shelf and oceanic areas of Regions III and IV moderate or low confidence was determined due to less frequent monitoring in these areas. In some offshore areas, notably in the Atlantic, reduced monitoring is appropriate due to the low risk of eutrophication in these areas, according to CEMP Guidelines (OSPAR, 2016). Spatial confidence was predominantly moderate or low. Only in some areas of the south-eastern North Sea, the spatial distribution was assessed as high. The accuracy of classification was high in the majority of areas, meaning a high certainty in the resulting status classification. In some areas such as Seine and Thames plumes as well as the French coastal channel area, the accuracy is moderate or low, so that the classification of the status result is less certain due to DIN concentrations close to the threshold, partly in combination with high standard deviation or a low number of observations.


Figure 4: Confidence assessment results for DIN in the period 2015-2020 for temporal, spatial, accuracy and overall confidence. Note that confidence is assessed on the basis of all available data in COMPEAT, regardless of whether the data are actually included in the overall assessment or whether it is decided not to use them due to an insufficient data base (e.g., in Portuguese oceanic areas).
The confidence assessments for DIP as shown in Figure 5 are very similar to DIN with only few differing classifications. The accuracy for DIP is moderate only in the Seine plume, while all other areas were classified as high indicating a high level of certainty in the status classification.
Figure 5: Confidence assessment results for DIP in the period 2015-2020 for temporal, spatial, accuracy and overall confidence. Note that confidence is assessed on the basis of all available data in COMPEAT, regardless of whether the data are actually included in the overall assessment or whether it is decided not to use them due to an insufficient data base.
The development of winter DIN concentrations during the different assessment periods of COMP1 (1990-2000), COMP2 (2001-2006), COMP3 (2006-2014) and COMP4 (2015-2020) is reflected in changing status classifications over time in some areas as illustrated in Figure d. The Southern North Sea area is an example of decreasing DIN concentrations and improving status during the last 30 years of DIN measurements. In the COMP1 period, DIN concentrations resulted in a poor status, while in both following periods of COMP2 and COMP3 decreasing DIN concentrations led to a moderate status classification. In the most recent COMP4 period, the DIN threshold was achieved, and the status classified as good. The trend assessment over the entire period indicated decreasing trends for DIN and also for DIP in the Southern North Sea area, but only for DIN a statistically significant trend could be determined.
In the Outer coastal DEDK area, DIN concentrations also decreased during the COMP periods but, contrary to the Southern North Sea area, were still above the threshold in the most recent COMP4 period. DIP concentrations for ‘Outer costal DEDK’ were classified as moderate in COMP1, 2 and 3, but achieved the threshold in COMP4, resulting in good status. Trend analysis showed a significant decrease for DIP over the entire period 1990-2020, but for DIN the generally declining trend was not statistically significant.
Figure d: Assessment results of winter DIN for all assessment periods of COMP1 (1990-2000), COMP2 (2001-2006), COMP3 (2006-2014) and COMP4 (2015-2020)
The only area where a significant increasing trend for DIN was observed was the Atlantic (ATL) due to an increase in DIN concentrations, mainly in the last two COMP periods. However, the status is classified as high in all assessment periods and no eutrophication risk exists in this area. Interestingly, the trend analysis indicated a significant decrease for DIP.
In Figure e the development of winter DIP concentrations during the different assessment periods is shown. While the general trend over the entire period showed a significant improvement in status similar to DIN, in some areas a deterioration between assessment periods (predominantly between COMP 2 and 3) was observed, e.g., in a few Channel areas (CUKC, CWMTI and CFR), Southern North Sea and Eastern North Sea. This is partly consistent with input data showing an increase for phosphorus in the 2006-2014 period in river inputs of several countries, such as Belgium, France, and the Netherlands, following lower values in 2005. Since higher DIP concentrations were also observed in shelf areas such as the Northern North Sea and the Channel between 2006 and 2014, the Atlantic inflow may also have contributed to an increase in DIP concentrations in addition to riverine nutrient inputs. Extreme weather events and floods during this period also led to higher nutrient inputs in individual years, more pronounced for DIP compared to DIN.
Figure e: Assessment results of winter DIP for all assessment periods of COMP1 (1990-2000), COMP2 (2001-2006), COMP3 (2006-2014) and COMP4 (2015-2020)
To illustrate the different developments of DIN and DIP concentrations in a number of adjacent areas, EQRS values are shown in relation to the good/moderate boundary over the different COMP assessment periods. Figure f shows for the selected neighbouring areas of Southern North Sea, German Bight central and Outer coastal DEDK that only the Southern North Sea has reached a good status for DIN in the last assessment period. The other two areas remain below the good/moderate boundary, but show an increase in EQRS values, although not continuous, and less distance to the good-moderate boundary compared to the first COMP period. The development for DIP was different and EQRS values were already close to the good/moderate boundary in all three areas in the first two assessment periods, deteriorating in COMP3, but achieving good status in the most recent COMP4 period. The substantial increase of EQRS values for DIP from COMP3 to COMP4 is most likely due to further reductions in total phosphorus inputs, which is also reflected in Figure g for different river plumes along the continental coast entering the Southern North Sea by status improvements based on decreasing DIP concentrations. Data availability and overall confidence scores are similar for both periods and show no major differences.
Figure f: Assessment results of winter DIN as EQRS values over all COMP periods in Southern North Sea, German Bight central and Outer coastal DEDK. The good/moderate boundary (0.6) is indicated by the dashed line
Figure g indicates the development of DIN and DIP concentrations as EQRS values in different river plumes along the continental coast of the Southern North Sea.
Figure g: Assessment results of winter DIN and DIP concentrations as EQRS values over all COMP periods in river plumes along the continental coast: Scheldt plume, Meuse plume, Rhine plume, Ems plume and Elbe plume. The good/moderate boundary (0.6) is indicated by the dashed line.
None of the river plumes along the continental coast achieved good status for DIN during the four COMP assessment periods. They are approaching the good/moderate boundary, especially the Meuse plume, but also showed fluctuations in the different assessment periods with some ups and downs and no continuous improvement. Four of the five selected river plumes achieved good or even high status for DIP in COMP4, only the Elbe plume is still classified as moderate. DIP EQRS values were already closer to the good/moderate boundary in COMP1 compared to DIN and continued to improve until the last COMP4 period.
In Figure h, the development in the Kattegat and Skagerrak is shown, as these areas are still in not good status for DIN and predominantly also for DIP in the most recent assessment period, except for the Skagerrak where a high status for DIP has been achieved. Chlorophyll concentrations in the Kattegat have also been classified as moderate (Kattegat deep) and poor (Kattegat coastal) like DIN, while the Skagerrak achieved good status for chlorophyll in the COMP4 period along with a moderate classification for DIN.
Figure h: Assessment results of winter DIN and DIP concentrations as EQRS values over all COMP periods in Kattegat coastal, Kattegat deep and Skagerrak. The good/moderate boundary (0,6) is indicated by the dashed line.
The trend analysis indicated decreasing trends in all three areas for DIN and DIP over the entire assessment period from 1990-2020, but only for DIP in the Skagerrak a statistically significant decrease was detected. Improving EQRS values were observed for both DIN and DIP during the assessment periods, but the pattern was more continuous for DIP and showed some deteriorations for DIN between COMP periods, e.g., in the Skagerrak and Kattegat coastal. A direct link between increasing DIN concentrations and thus decreasing EQRS values is in agreement with increasing nitrogen inputs to Kattegat from Danish runoff since 2010. However, the situation in the Kattegat and Skagerrak area is complex due to the inflow of Baltic water from the south and the North Atlantic inflow.
In comparison with the previous assessment periods, the number of assessment areas in moderate, poor or bad status and total surface area for DIN and DIP concentrations exceeding thresholds has decreased (Figure i). While the number of areas as well as the total surface area showed a more continuous decrease for DIN, the development was different for DIP, experiencing an increase during COMP2 and COMP3 periods with a final very low number of areas not in good status in the most recent period of COMP4. The increase of DIP in the number of areas in moderate or worse status during COMP2 and COMP3 periods was mainly due to increases in shelf areas, in particular in the Eastern North Sea and some Channel areas (CFR, CWMTI and CUKC) leading to a significant increase in the surface area in not-good status. Between COMP3 and COMP4, DIP concentrations decreased substantially both in coastal and shelf areas in the southern and south-eastern North Sea (SNS, ENS, GBC and OC DEDK).
Figure i: Number of assessment areas (left) and surface area (right) for DIN and DIP in moderate, poor or bad status in the four COMP periods grouped into river plumes, coastal and shelf areas. Only assessment areas with results in all four COMP periods and moderate or high confidence were included.
As an example of the development of DIP concentrations in all four COMP periods, the pattern in the Eastern North Sea area (ENS) is shown in Figure j.
In the COMP1 period, DIP concentrations were predominantly below the threshold and the period mean was classified as good status. Five out of six years in the COMP2 period were also below the threshold, but the year 2004 with exceptional high DIP concentrations determined the period mean resulting in moderate status for the Eastern North Sea. Increasing DIP concentrations in the following years were predominantly above the threshold (in seven out of nine years) which led to a deteriorated period mean and a still moderate classification. The number of annual observations (indicated in Figure j) showed that this was not due to individual outliers or insufficient data as a similar pattern was also observed in other adjacent areas. In the COMP4 period only one year was above the threshold while all other years were clearly below the threshold resulting in a good status classification.
Figure j: Time-series of DIP concentrations in the Eastern North Sea for the period 1990-2020. The DIP threshold is shown as dashed line and the green line shows the number of annual observations.
In time-series of selected assessment areas for the entire assessment period 1990-2020, different developments of DIN and DIP concentrations could be observed. In the Rhine plume a significant decreasing trend for both DIN and DIP was determined. DIN concentrations are still above the threshold and the status of the Rhine plume is moderate in the most recent assessment period, while for DIP a good status has already been achieved. Figure k shows the annual concentrations of DIN and DIP from 1990-2020, related thresholds, trendlines and statistical values of the trend assessment (Sen’s slope, p values).
Figure k: Time-series of DIN and DIP concentrations in the Rhine plume for the period 1990-2020. Thresholds for the assessment of DIN and DIP are indicated as a grey dashed line.
In the Elbe plume, DIN and DIP concentrations showed also decreasing trends, but only for DIP the trend was statistically significant (Figure l). The status of the Elbe plume is for both nutrients still above thresholds, resulting in poor status for DIN and moderate status for DIP in the COMP4 period.
Figure l: Time-series of DIN and DIP concentrations in the Elbe plume for the period 1990-2020. Thresholds for the assessment of DIN and DIP are indicated as the black dashed line.
Further significant decreasing trends have been detected in different river plumes. To relate the trend assessment results to the status assessment of the different areas, Table b and Table c summarize the detected trends per area category. This is intended to emphasise significant decreasing trends in areas that are still in moderate, poor, or bad status and where improvements are needed, or increasing trends in areas of high or good status that could potentially lead to deterioration in status.
| Area category | COMP4 classification | Increasing trend | No trend | Decreasing trend | No or limited data |
|---|---|---|---|---|---|
| River plumes | M/P/B status | 0 | 5 | 2 | 3 |
| H/G status | 0 | 4 | 0 | ||
| Coastal areas | M/P/B status | 0 | 4 | 0 | 11 |
| H/G status | 0 | 6 | 6 | ||
| Shelf areas | M/P/B status | 0 | 1 | 0 | 3 |
| H/G status | 0 | 9 | 4 | ||
| Oceanic areas | M/P/B status | 0 | 0 | 0 | 5 |
| H/G status | 1 | 0 | 0 |
| Area category | COMP4 classification | Increasing trend | No trend | Decreasing trend | No or limited data |
|---|---|---|---|---|---|
| River plumes | M/P/B status | 0 | 1 | 1 | 3 |
| H/G status | 0 | 3 | 6 | ||
| Coastal areas | M/P/B status | 0 | 3 | 0 | 11 |
| H/G status | 0 | 8 | 5 | ||
| Shelf areas | M/P/B status | 0 | 0 | 0 | 3 |
| H/G status | 0 | 8 | 6 | ||
| Oceanic areas | M/P/B status | 0 | 0 | 0 | 5 |
| H/G status | 0 | 0 | 1 |
In areas classified as moderate or worse, no increasing trends were detected for DIN and DIP. Significant decreasing trends were predominantly observed in areas that are already in good or high status in the COMP4 period. In the category of river plumes, two rivers classified as moderate or worse showed significant decreasing trends for DIN (Meuse, Rhine) and one river for DIP (Elbe). Significant decreasing trends were not detected in coastal areas being in not good status.
Trend assessment results since the QSR 2010 (2010-2020) revealed a few differences to the long-term trends in certain areas, but mostly consistent results. For Norwegian coastal waters (CNOR3), a significantly increasing trend was observed since 2010 for DIN with a Sen’s slope of 10%/year. For DIP, the trend was also increasing in this period, but not statistically significant. The status classification of the most recent period is good for DIN and high for DIP in Norwegian coastal waters, but further increasing nutrient concentrations may be approaching the boundary to not good status. Since nutrient data for DIN and DIP in this area are only available until 2016, a final estimate remains open.
Conclusion
In most areas assessed, winter nutrient concentrations of DIN and DIP were below thresholds resulting in good or high status classification in the COMP4 period 2015-2020. DIN concentrations exceeding thresholds were observed in twelve assessment areas, while DIP concentrations above thresholds were found in four assessment areas. These areas were mainly located in OSPAR Region II in river plumes and coastal waters along the continental coast from France to Denmark and Sweden. The number of areas in moderate, poor, or bad status as well as the total surface area decreased compared to previous COMP periods. A significant increase was detected in the Atlantic for DIN, while DIP concentrations showed a significant decrease over the last 30 years. All other identified significant trends for DIN and DIP reflected decreasing concentrations in the entire assessment period 1990-2020.
Knowledge Gaps
One of the main knowledge gaps is still the estimation of threshold values. Currently, the same deviation (50%) is used for all indicators and areas. This approach is clearly not in accordance with our ecological knowledge and needs further adjustments.
Other knowledge gaps are reduced monitoring providing less data over time and estimates for transport of nutrients between assessment units. The role of estuaries and the coastal zone in removal of nutrients is important and needs further investigation, in particular when the state of estuarine ecosystems improve as a consequence of the efforts under the Water Framework Directive.
COMP4 is the first assessment that uses common threshold values based on a harmonised modelling approach. However, for some areas the model results for a reference situation were not realistic, so adjustments were necessary undermining full harmonisation. The reference conditions and threshold values therefore need to be revisited as a basis for agreeing on nutrient reduction needs, as foreseen in NEAES objective S1.O3.
To supplement the assessment of dissolved nutrients, total nutrients need to be included in the eutrophication assessment in the future to provide an overall picture of nutrient processes throughout the year and not only in winter. Total nutrient concentrations have the great advantage compared to DIN and DIP, that they are not sensitive to the definition of winter versus growing season and reflect the total amount of nutrients available in the ecosystem. Better informed models could support the inclusion of total nutrients where in-situ measurements are lacking.
In general, models are required to estimate long-distance transport of nutrients and their regional effects, which is still a knowledge gap listed in the OSPAR Science Agenda (OSA).
There is also a need to better understand the implications of data variability in trend assessments to make use of this information for predictions of whether and when thresholds can be achieved. This is an important aspect in the context of required nutrient reductions and necessary measures to accomplish them.
Declining monitoring frequency in some areas and reduced sampling activities in general should be considered for future assessments, and solutions should be investigated to fill existing and potential future data gaps through additional data sources and data types, e.g., modelled nutrient data.
As part of the lessons learnt process from the first COMPEAT assessment, efforts should be made to improve the technical quality of the tool to include more indicators and to refine the calculation procedures. This includes, for example, the possible inclusion of nutrients in the overall eutrophication assessment through weighting and adjustments in the confidence assessment related to different data types and area-specific class boundaries. The suitability of the winter assessment season, covering December, January, and February, needs to be investigated in light of changing climate and increasing biological activity also in winter, which may lead to area-specific adjustments to the assessment season for future nutrient assessments. Furthermore, the impact of climate change on nutrient land-runoff needs to be investigated in more detail and how exceptional years due to floods or droughts should be considered in the calculation process of COMPEAT (e.g., by weighing of individual years instead of period means) in future.
Linking observations of area-specific nutrient developments with nutrient input data should be analysed in more detail to strengthen the linkages. Relationships to pelagic and benthic indicators need to be investigated further to make use of the assessment results for interpretation of the eutrophication assessment and possible inclusion in the integration procedure of a further developed COMPEAT tool.
Brockmann, U., D. Topcu, M. Schuett, W. Leujak, W. (2018). Eutrophication assessment in the transit area German Bight (North Sea) 2006–2014 - improvements and limitations. Marine Pollution Bulletin, 136, 68–78.
Burson, A., M. Stomp, L. Akil, C.P.D. Brussard, J. Huisman (2016): Unbalanced reduction of nutrients has created an offshore gradient from phosphorus to nitrogen limitation in the North Sea. Limn. Oceanogr. 2016, doi 10: 1002, Ino 10257, 20pp.
Commission Decision (EU) 2017/848 of 17 May 2017 laying down criteria and methodological standards on good environmental status of marine waters and specifications and standardised methods for monitoring and assessment, repealing Decision 2010/477/EU.
EC (2019). Nutrient enrichment and eutrophication in Europe’s seas - Moving towards a healthy marine environment. EEA Report No 14/2019, ISSN 1977–8449. Available at: https:// doi.org/10.2800/092643, 48pp
Enserink, L., Blauw, A., van der Zande, D., Markager S. (2019). Summary report of the EU project ‘Joint monitoring programme of the eutrophication of the North Sea with satellite data’ (Ref: DG ENV/MSFD Second Cycle/2016). 21 pp
Greenwood, N., M.J. Devlin, M. Best, L. Fronkova, C.A. Graves, A. Milligan, J. Barry, J., S.M. van Leeuwen (2019). Utilizing eutrophication assessment directives from transitional to marine systems in the Thames estuary and Liverpool Bay, UK. Frontiers in Marine Science, 6, 116–140.
OSPAR (2010). Quality Status Report 2010. OSPAR Commission, London, 176 pp.
OSPAR (2003). First OSPAR Integrated Report on the Eutrophication Status of the OSPAR Maritime Area based upon the first application of the Comprehensive Procedure. OSPAR Commission, London, Eutrophication Series Publication No 189/2003, 59 pp.
OSPAR (2008). Second OSPAR Integrated Report on the Eutrophication Status of the OSPAR Maritime Area OSPAR Commission, London, Eutrophication Series Publication No 372/2008, 107 pp.
OSPAR (2017). Third OSPAR Integrated Report on the Eutrophication Status of the OSPAR Maritime Area. OSPAR Commission, London, Publication No 694/2017, 164 pp.
OSPAR (2016). CEMP Guidelines for coordinated monitoring for eutrophication, CAMP and RID. Agreement 2016-05. Revised in 2021.
OSPAR (2013). Common Procedure for the Identification of the Eutrophication Status of the OSPAR Maritime Area. Agreement 2013-8. Supersedes Agreements 1997-11, 2002-20 and 2005-3.
OSPAR (2021). Strategy of the OSPAR Commission for the Protection of the Marine Environment of the North-East Atlantic 2030. Agreement 2021-01: North-East Atlantic Environment Strategy.
OSPAR (2022). Revision of the Common Procedure for the Identification of the Eutrophication Status of the OSPAR Maritime Area. OSPAR Agreement 2022-07.
Topcu, D., U. Brockmann (2021). Consistency of thresholds for eutrophication assessments, examples and recommendations. Environ. Monit. Assess, 193: 677, 15pp.
Van Beusekom, J.E.E., J. Carstensen, T. Dolch, A. Grage, R. Hofmeister, H. Lenhart, O. Kerimoglu, K. Kolbe, J. Pätsch, J. Rick, L. Rönn, H. Ruiter (2019). Wadden Sea Eutrophication: Long-Term Trends and Regional Differences. Front. Mar. Sci 6:370. Available at: https://doi.org/10.3389/fmars.2019.00370
Contributors
Lead Authors: Birgit Heyden and Wera Leujak
Supported by: Intersessional Correspondence Group on Eutrophication (ICG-EUT), Technical Group for the revision and application of the Common Procedure and the Hazardous Substances and Eutrophication Committee (HASEC).
Citation
Heyden, B. and Leujak, W. 2022. Winter Nutrient Concentrations in the Greater North Sea, Celtic Seas and Bay of Biscay and Iberian Coast.In: OSPAR, 2023: The 2023 Quality Status Report for the Northeast Atlantic. OSPAR Commission, London. Available at: https://oap.ospar.org/en/ospar-assessments/quality-status-reports/qsr-2023/indicator-assessments/winter-nutrient-concentrations
| Assessment type | Indicator Assessment |
|---|---|
| Summary Results | https://odims.ospar.org/en/submissions/ospar_conc_nutr_msfd_2022_06/ |
| SDG Indicator | 14.1 By 2025, prevent and significantly reduce marine pollution of all kinds, in particular from land-based activities, including marine debris and nutrient pollution |
| Thematic Activity | Eutrophication |
| Relevant OSPAR Documentation | OSPAR Agreement 2010-03 The North-East Atlantic Environment Strategy. Strategy of the OSPAR Commission for the Protection of the Marine Environment of the North-East Atlantic 2010–2020 |
| Date of publication | 2022-06-30 |
| Conditions applying to access and use | https://oap.ospar.org/en/data-policy/ |
| Data Snapshot | https://odims.ospar.org/en/submissions/ospar_nutrient_conc_snapshot_2022_06/ |
| Data Results | https://odims.ospar.org/en/submissions/ospar_nutrient_conc_results_2022_06/ |
| Data Source | https://www.ices.dk/data/data-portals/Pages/DOME.aspx |