

Abundance, Composition and Trends of Beach Litter
Background
The reduction of marine litter pollution is one of the great environmental challenges facing society today. Under its North-East Atlantic Environment Strategy (NEAES) 2010 - 2020, OSPAR had the strategic objective “to substantially reduce marine litter in the OSPAR Maritime Area to a level where properties and quantities of marine litter do not cause harm to the coastal and marine environment”.
One of the indicators currently used at OSPAR level to assess marine litter pollution is the “Abundance, composition and trends of marine litter washed ashore and/or deposited on coastlines, including analysis of its spatial distribution and, where possible, sources”, referred to as “beach litter”. The indicator, also used in the EU Marine Strategy Framework Directive (MSFD), reflects spatial differences and temporal changes in abundance, composition and sources of marine litter in the coastal environment and is used as a proxy for litter pollution in the OSPAR marine environment.
The present assessment describes beach litter quality status and trends in the OSPAR Area. To provide a snapshot of the current situation, litter abundance and composition were assessed from 2018 to 2020 and current trends over a six year period, from 2015 to 2020. All parameters were calculated using median-based robust calculation methods which are representing the most typical pollution situation without being influenced by extreme values1.

Beach Litter in Norway © Bo Eide
To complement the present report, factsheets were elaborated to provide key results at both OSPAR Area and OSPAR Region scales. Specific factsheets were also prepared for MSFD-country sub regions to support European Union (EU) Member States in their MSFD reporting.
Beach litter is defined by OSPAR as any persistent, manufactured or processed, solid material discarded, disposed of, from inland or abandoned in the marine and coastal environment, and encountered on beaches. A part of this litter originates from the sea, through deliberate or accidental losses from vessels (including cargos and waste), and is transported to, and deposited on the coast from the sea by winds, waves and water currents. Another part is directly deposited on the coast - e.g. by beach users - or is the result of fly-tipping. Litter is also deposited further inland on riverbanks, directly into rivers, in urban areas and in the countryside and is subsequently transported by rivers, rain and wind into the marine environment and onto beaches. In addition, sewage infrastructures discharge litter items directly or indirectly, via rivers and sewage outlets into the sea and these items can be washed ashore.
The present report aims at assessing in OSPAR Maritime Area and Regions: (i) marine beach litter quality status, (ii) current beach litter trends and (iii) extent to which OSPAR objectives have been achieved.
To do so, it provides an assessment of the abundance, composition, distribution and trends of marine litter washed ashore and / or deposited on coastlines of the OSPAR Area. The total litter abundance, based on median values (hereafter refered to as medians1), reflects the magnitude of the pollution in adjacent waters and coastal areas. Composition shows how common the different litter types (e.g. string and cords, cotton bud sticks, caps and lids, cigarette filters) or litter material categories (e.g. plastic, wood) are. Composition is assessed using medians, and if appropriate percentages, of individual litter types or litter categories. The distribution highlights regional specificities that can relate to regional differences in sources, activities, human habits and transport mechanisms (through ocean current, tides, wind, buoyancy of items, etc.). Trends in the abundance of total litter, individual litter types or litter categories (e.g. plastics, single-use plastics, maritime related items) reflect changes in the level of pollution.
The report also provides information on the coverage of both the OSPAR Regional Action Plan on Marine Litter (ML RAP) 2014 - 2020 and European Directive 2019/904, also known as the Single-use plastics Directive (SUP), by assessing percentages of litter directly targeted, or not, by these two measures.
It also assesses the adequacy of the OSPAR beach litter survey list by evaluating percentages of litter which are identified by the list, non-identified, and those which are non-identifiable because they are too fragmented.
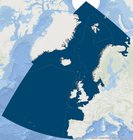
The present assessment relies on survey sites distributed in the five OSPAR Regions, as presented in Figure a. Only sites with a sufficient number of surveys and / or long enough time series are included (Table a). For the beach litter status assessment from 2018 to 2020, 1 137 surveys collected on 114 survey sites are considered. For the trends assessment from 2015 to 2020, 1 693 surveys collected on 83 sites are considered. These data represent the most extensive set of fit-for-purpose beach litter monitoring data in the North-East Atlantic.
Figure a: Locations of the 114 OSPAR survey sites considered in the assessment. Available via: https://odims.ospar.org/en/maps/?layers=ospar_beach_litter_survey_sites_2022_06_001,ospar_inner_boundary_2016_01_002,ospar_outer_boundary_2016_01_001
Table a: OSPAR beach litter survey sites considered in the assessment and associated data availability. Purple cells indicate years and surveys which are not used in the assessment and / or highlight when a survey site is not included in status or trend analyses.
Survey site reference number | OSPAR Region | Country | Survey site name | Number of surveys available | Inclusion in status assessment (Yes/No) | Inclusion in trends assessment (Yes/No) | ||||||
2015 | 2016 | 2017 | 2018 | 2019 | 2020 | Total number of surveys considered | ||||||
DE001 | Greater North Sea | Germany | Sylt (island) | 4 | 3 | 4 | 4 | 4 | 4 | 23 | Yes | Yes |
DE002 | Greater North Sea | Germany | Scharhörn (island) | 3 | 3 | 3 | 3 | 3 | 2 | 17 | Yes | Yes |
DE003 | Greater North Sea | Germany | Minsener Oog (island) | 4 | 4 | 4 | 4 | 4 | 4 | 24 | Yes | Yes |
DE005 | Greater North Sea | Germany | Juist | 4 | 4 | 4 | 4 | 4 | 4 | 24 | Yes | Yes |
DE006 | Greater North Sea | Germany | Sylt Hörnum North | 0 | 0 | 0 | 4 | 4 | 4 | 12 | Yes | No |
DE007 | Greater North Sea | Germany | Mellum West | 0 | 0 | 3 | 4 | 4 | 4 | 12 | Yes | No |
DE008 | Greater North Sea | Germany | Juist Wilhelmshöhe | 0 | 0 | 3 | 4 | 4 | 4 | 12 | Yes | No |
DK001 | Greater North Sea | Denmark | MSFD Nymindegab Strand | 3 | 3 | 3 | 3 | 3 | 3 | 18 | Yes | Yes |
DK004 | Greater North Sea | Denmark | MSFD Skagen Skagen Strand | 3 | 3 | 3 | 3 | 3 | 3 | 18 | Yes | Yes |
DK006 | Greater North Sea | Denmark | MSFD Limfjorden | 0 | 0 | 0 | 2 | 3 | 3 | 8 | Yes | No |
DK007 | Greater North Sea | Denmark | Risoe-Roskilde | 3 | 4 | 4 | 4 | 4 | 4 | 23 | Yes | Yes |
ES001 | Bay of Biscay and Iberian Coast | Spain | A Lanzada | 4 | 4 | 4 | 4 | 4 | 3 | 23 | Yes | Yes |
ES002 | Bay of Biscay and Iberian Coast | Spain | Baldaio | 4 | 4 | 4 | 4 | 4 | 3 | 23 | Yes | Yes |
ES003 | Bay of Biscay and Iberian Coast | Spain | Valdevaqueros beach | 4 | 4 | 4 | 4 | 4 | 3 | 23 | Yes | Yes |
ES004 | Bay of Biscay and Iberian Coast | Spain | O Rostro | 4 | 4 | 4 | 4 | 4 | 3 | 23 | Yes | Yes |
ES005 | Bay of Biscay and Iberian Coast | Spain | La Vega | 4 | 4 | 4 | 4 | 4 | 3 | 23 | Yes | Yes |
ES007 | Bay of Biscay and Iberian Coast | Spain | Agiti | 4 | 4 | 4 | 4 | 4 | 3 | 23 | Yes | Yes |
ES008 | Bay of Biscay and Iberian Coast | Spain | Menacoz | 4 | 4 | 4 | 4 | 4 | 3 | 23 | Yes | Yes |
ES010 | Bay of Biscay and Iberian Coast | Spain | Covas | 4 | 4 | 4 | 4 | 4 | 3 | 23 | Yes | Yes |
ES011 | Bay of Biscay and Iberian Coast | Spain | Castilla | 4 | 4 | 4 | 3 | 4 | 3 | 22 | Yes | Yes |
ES012 | Bay of Biscay and Iberian Coast | Spain | Castilnovo | 4 | 4 | 4 | 3 | 3 | 3 | 21 | Yes | Yes |
ES013 | Bay of Biscay and Iberian Coast | Spain | Oyambre | 4 | 4 | 4 | 4 | 4 | 3 | 23 | Yes | Yes |
ES014 | Bay of Biscay and Iberian Coast | Spain | Rodas | 4 | 4 | 4 | 4 | 4 | 3 | 23 | Yes | Yes |
FR004 | Greater North Sea | France | Les Basses Falaises | 0 | 0 | 0 | 0 | 4 | 3 | 7 | Yes | No |
FR015 | Greater North Sea | France | Le Mont St Frieux | 0 | 2 | 4 | 4 | 4 | 3 | 17 | Yes | Yes |
FR016 | Greater North Sea | France | Les Boucaniers | 0 | 3 | 4 | 2 | 4 | 3 | 16 | Yes | Yes |
FR021 | Greater North Sea | France | Les Dunes | 0 | 1 | 4 | 4 | 4 | 3 | 16 | Yes | Yes |
FR022 | Greater North Sea | France | L'Hôpital | 0 | 0 | 3 | 4 | 4 | 3 | 11 | Yes | No |
FR006 | Celtic Seas | France | Kourrijou | 4 | 4 | 4 | 4 | 4 | 4 | 24 | Yes | Yes |
FR007 | Celtic Seas | France | Koubou | 4 | 4 | 4 | 4 | 4 | 4 | 24 | Yes | Yes |
FR008 | Celtic Seas | France | Kerizella | 4 | 4 | 4 | 4 | 4 | 4 | 24 | Yes | Yes |
FR011 | Celtic Seas | France | Larmor | 4 | 4 | 4 | 4 | 4 | 3 | 23 | Yes | Yes |
FR012 | Celtic Seas | France | Trielen | 4 | 4 | 4 | 4 | 3 | 3 | 22 | Yes | Yes |
FR019 | Celtic Seas | France | La Grandville | 0 | 2 | 4 | 4 | 4 | 3 | 17 | Yes | Yes |
FR020 | Celtic Seas | France | La Grève des Courses | 0 | 2 | 4 | 4 | 4 | 3 | 17 | Yes | Yes |
FR027 | Celtic Seas | France | Le Cosmeur | 0 | 0 | 0 | 0 | 3 | 3 | 6 | Yes | No |
FR002 | Bay of Biscay and Iberian Coast | France | Le Stang | 0 | 0 | 0 | 0 | 4 | 3 | 7 | Yes | No |
FR017 | Bay of Biscay and Iberian Coast | France | La Barre | 4 | 4 | 4 | 4 | 4 | 3 | 23 | Yes | Yes |
FR023 | Bay of Biscay and Iberian Coast | France | Donnant | 0 | 0 | 0 | 3 | 4 | 3 | 10 | Yes | No |
FR031 | Bay of Biscay and Iberian Coast | France | Pen Loc'h | 0 | 0 | 0 | 0 | 3 | 3 | 6 | Yes | No |
FR032 | Bay of Biscay and Iberian Coast | France | Boëd | 0 | 0 | 0 | 0 | 3 | 4 | 7 | Yes | No |
FR033 | Bay of Biscay and Iberian Coast | France | La Marche aux Bœufs | 0 | 0 | 0 | 0 | 3 | 3 | 6 | Yes | No |
FR035 | Bay of Biscay and Iberian Coast | France | Les Selliers | 0 | 0 | 0 | 3 | 4 | 3 | 10 | Yes | No |
FR038 | Bay of Biscay and Iberian Coast | France | La Cornerie | 0 | 1 | 0 | 3 | 4 | 3 | 10 | Yes | No |
FR039 | Bay of Biscay and Iberian Coast | France | Les Trois Pierres | 0 | 0 | 0 | 4 | 4 | 3 | 11 | Yes | No |
FR040 | Bay of Biscay and Iberian Coast | France | La Baie de Gatseau | 0 | 0 | 0 | 3 | 4 | 3 | 10 | Yes | No |
FR042 | Bay of Biscay and Iberian Coast | France | Le Grand Crohot Sud | 0 | 0 | 0 | 2 | 4 | 3 | 9 | Yes | No |
FR043 | Bay of Biscay and Iberian Coast | France | La Pointe du Teich | 0 | 0 | 0 | 2 | 4 | 3 | 9 | Yes | No |
FR044 | Bay of Biscay and Iberian Coast | France | Le Banc d'Arguin | 0 | 0 | 0 | 3 | 4 | 3 | 10 | Yes | No |
FR045 | Bay of Biscay and Iberian Coast | France | Le Wharf | 0 | 0 | 0 | 3 | 4 | 2 | 9 | Yes | No |
IR001 | Celtic Seas | Ireland | Long Strand | 4 | 4 | 4 | 4 | 4 | 4 | 24 | Yes | Yes |
IR002 | Celtic Seas | Ireland | Silver Strand | 4 | 4 | 4 | 4 | 4 | 4 | 24 | Yes | Yes |
IR003 | Celtic Seas | Ireland | Carnesore | 4 | 4 | 4 | 4 | 4 | 4 | 24 | Yes | Yes |
IR004 | Celtic Seas | Ireland | Clogherhead - South | 4 | 4 | 4 | 4 | 4 | 4 | 24 | Yes | Yes |
IS002 | Arctic Waters | Iceland | Budavik | 0 | 2 | 3 | 3 | 3 | 2 | 13 | Yes | Yes |
IS003 | Arctic Waters | Iceland | Bakkavik | 0 | 2 | 4 | 4 | 3 | 3 | 16 | Yes | Yes |
IS007 | Arctic Waters | Iceland | Vikur | 0 | 0 | 0 | 2 | 3 | 2 | 7 | Yes | No |
NL001 | Greater North Sea | Netherlands | Bergen | 4 | 4 | 4 | 4 | 4 | 4 | 24 | Yes | Yes |
NL002 | Greater North Sea | Netherlands | Noordwijk | 4 | 4 | 4 | 4 | 4 | 4 | 24 | Yes | Yes |
NL003 | Greater North Sea | Netherlands | Veere | 4 | 4 | 4 | 4 | 4 | 4 | 24 | Yes | Yes |
NL004 | Greater North Sea | Netherlands | Terschelling | 4 | 4 | 4 | 4 | 3 | 4 | 23 | Yes | Yes |
NO005 | Greater North Sea | Norway | Kviljo | 2 | 2 | 2 | 2 | 2 | 2 | 12 | Yes | Yes |
PT001 | Bay of Biscay and Iberian Coast | Portugal | Praia da Barra | 4 | 4 | 4 | 4 | 4 | 3 | 23 | Yes | Yes |
PT004 | Bay of Biscay and Iberian Coast | Portugal | Ilha de Faro | 4 | 4 | 4 | 4 | 4 | 3 | 23 | Yes | Yes |
PT005 | Bay of Biscay and Iberian Coast | Portugal | Batata | 4 | 4 | 4 | 4 | 4 | 3 | 23 | Yes | Yes |
PT007 | Bay of Biscay and Iberian Coast | Portugal | Cabedelo | 4 | 4 | 4 | 4 | 4 | 4 | 24 | Yes | Yes |
PT008 | Bay of Biscay and Iberian Coast | Portugal | Osso da Baleia | 4 | 4 | 4 | 4 | 4 | 3 | 23 | Yes | Yes |
PT009 | Bay of Biscay and Iberian Coast | Portugal | Amoeiras | 4 | 4 | 4 | 4 | 4 | 3 | 23 | Yes | Yes |
PT010 | Bay of Biscay and Iberian Coast | Portugal | Fonte da Telha | 4 | 4 | 4 | 4 | 4 | 3 | 23 | Yes | Yes |
PT011 | Bay of Biscay and Iberian Coast | Portugal | Monte Velho | 4 | 4 | 4 | 4 | 4 | 3 | 23 | Yes | Yes |
PT012 | Bay of Biscay and Iberian Coast | Portugal | Barranha | 4 | 4 | 4 | 4 | 4 | 3 | 23 | Yes | Yes |
PT014 | Bay of Biscay and Iberian Coast | Portugal | Paredes de Vitória | 0 | 0 | 3 | 4 | 4 | 3 | 11 | Yes | No |
PT015 | Bay of Biscay and Iberian Coast | Portugal | Furadouro Sul | 0 | 0 | 0 | 4 | 4 | 2 | 10 | Yes | No |
PT016 | Bay of Biscay and Iberian Coast | Portugal | Aberta-Pedrogão | 0 | 0 | 0 | 4 | 4 | 3 | 11 | Yes | No |
PT017 | Bay of Biscay and Iberian Coast | Portugal | Baleal Leste | 0 | 0 | 1 | 4 | 4 | 3 | 11 | Yes | No |
PT019 | Bay of Biscay and Iberian Coast | Portugal | São Félix da Marinha | 0 | 0 | 0 | 1 | 4 | 3 | 8 | Yes | No |
PT018 | Wider Atlantic | Portugal | Areia - Corvo - Azores | 0 | 4 | 4 | 4 | 4 | 3 | 19 | Yes | Yes |
PT020 | Wider Atlantic | Portugal | Almoxarife - Faial - Azores | 0 | 4 | 4 | 4 | 4 | 2 | 18 | Yes | Yes |
PT021 | Wider Atlantic | Portugal | Praia do Norte - Faial - Azores | 0 | 4 | 4 | 4 | 4 | 2 | 18 | Yes | Yes |
PT022 | Wider Atlantic | Portugal | Praia da Maia - São Miguel - Azores | 0 | 4 | 4 | 3 | 4 | 2 | 17 | Yes | Yes |
PT023 | Wider Atlantic | Portugal | Pedreira - São Miguel - Azores | 0 | 4 | 3 | 2 | 2 | 2 | 13 | Yes | Yes |
PT024 | Wider Atlantic | Portugal | São Lourenço - Santa Maria - Azores | 0 | 4 | 4 | 3 | 4 | 3 | 18 | Yes | Yes |
SE004 | Greater North Sea | Sweden | Haby | 3 | 3 | 3 | 3 | 3 | 3 | 18 | Yes | Yes |
SE005 | Greater North Sea | Sweden | Edsvik | 2 | 3 | 3 | 3 | 3 | 3 | 17 | Yes | Yes |
SE006 | Greater North Sea | Sweden | Saltö | 2 | 3 | 3 | 3 | 3 | 3 | 17 | Yes | Yes |
SE007 | Greater North Sea | Sweden | Grönevik | 3 | 2 | 3 | 3 | 3 | 3 | 17 | Yes | Yes |
SE008 | Greater North Sea | Sweden | Edshultshall | 3 | 3 | 3 | 3 | 3 | 3 | 18 | Yes | Yes |
SE009 | Greater North Sea | Sweden | Gröderhamn | 3 | 3 | 3 | 3 | 3 | 3 | 18 | Yes | Yes |
UK011 | Greater North Sea | United Kingdom | Cramond Beach | 4 | 4 | 4 | 4 | 4 | 2 | 22 | Yes | Yes |
UK043 | Greater North Sea | United Kingdom | Jubilee Beach | 5 | 7 | 4 | 4 | 3 | 2 | 25 | Yes | Yes |
UK047 | Greater North Sea | United Kingdom | Kinghorn Harbour | 3 | 4 | 4 | 4 | 3 | 1 | 19 | Yes | Yes |
UK048 | Greater North Sea | United Kingdom | Formby (Freshfields) | 1 | 3 | 5 | 3 | 3 | 1 | 16 | Yes | Yes |
UK049 | Greater North Sea | United Kingdom | Robin Hood's Bay | 1 | 4 | 4 | 4 | 4 | 1 | 18 | Yes | Yes |
UK050 | Greater North Sea | United Kingdom | Saltburn | 2 | 4 | 4 | 4 | 3 | 2 | 19 | Yes | Yes |
UK002 | Celtic Seas | United Kingdom | Tan-y-Bwlch Beach | 4 | 4 | 4 | 4 | 3 | 3 | 22 | Yes | Yes |
UK020 | Celtic Seas | United Kingdom | Sand Bay | 4 | 4 | 4 | 6 | 4 | 2 | 24 | Yes | Yes |
UK021 | Celtic Seas | United Kingdom | Langland Bay | 3 | 4 | 3 | 4 | 4 | 2 | 20 | Yes | Yes |
UK025 | Celtic Seas | United Kingdom | Ardglass | 0 | 4 | 4 | 4 | 4 | 3 | 19 | Yes | Yes |
UK026 | Celtic Seas | United Kingdom | Ballyhornan | 0 | 4 | 4 | 4 | 4 | 3 | 19 | Yes | Yes |
UK028 | Celtic Seas | United Kingdom | Ballywalter | 0 | 4 | 4 | 4 | 4 | 3 | 19 | Yes | Yes |
UK031 | Celtic Seas | United Kingdom | Hazelbank | 0 | 2 | 0 | 0 | 3 | 3 | 6 | Yes | No |
UK032 | Celtic Seas | United Kingdom | Kilkeel North | 1 | 4 | 4 | 4 | 4 | 3 | 20 | Yes | Yes |
UK033 | Celtic Seas | United Kingdom | Portavogie | 0 | 4 | 4 | 4 | 4 | 3 | 19 | Yes | Yes |
UK034 | Celtic Seas | United Kingdom | Rathlin | 0 | 4 | 4 | 4 | 4 | 1 | 17 | Yes | Yes |
UK035 | Celtic Seas | United Kingdom | Rostrevor | 0 | 4 | 4 | 4 | 4 | 2 | 18 | Yes | Yes |
UK036 | Celtic Seas | United Kingdom | Runkerry | 0 | 4 | 4 | 3 | 4 | 2 | 17 | Yes | Yes |
UK037 | Celtic Seas | United Kingdom | Tyrella | 0 | 4 | 4 | 4 | 4 | 2 | 18 | Yes | Yes |
UK038 | Celtic Seas | United Kingdom | White Park Bay | 0 | 4 | 4 | 4 | 4 | 2 | 18 | Yes | Yes |
UK039 | Celtic Seas | United Kingdom | Tal-y-Foel | 1 | 3 | 3 | 5 | 2 | 1 | 15 | Yes | Yes |
UK045 | Celtic Seas | United Kingdom | Lunderston Bay | 1 | 3 | 4 | 3 | 5 | 2 | 18 | Yes | Yes |
IM001 | Celtic Seas | United Kingdom | Castletown | 0 | 0 | 5 | 4 | 4 | 0 | 8 | Yes | No |
IM002 | Celtic Seas | United Kingdom | Douglas | 0 | 0 | 5 | 4 | 4 | 1 | 9 | Yes | No |
IM003 | Celtic Seas | United Kingdom | Kirk Michael | 0 | 0 | 4 | 4 | 4 | 0 | 8 | Yes | No |
IM004 | Celtic Seas | United Kingdom | Ramsey | 0 | 0 | 4 | 3 | 4 | 1 | 8 | Yes | No |
The assessment follows OSPAR’s beach litter monitoring and assessment methodology, which is described in OSPAR’s Coordinated Environmental Monitoring Programme (CEMP) guidelines on marine monitoring and assessment of beach litter (OSPAR Agreement 2020-02). This methodology advises surveying four times a year fixed 100 m beach sections, on which all beach litter items (> 5 mm) visible on the sand surface, are collected, identified and counted using the OSPAR survey list (Figure b). It is important to note that selection of survey sites is not made randomly and results can only be regarded as representative for the group of beaches monitored.
The assessment of beach litter pollution is based on time series of abundance of individual litter types, litter categories and total count of litter items recorded on OSPAR beach litter survey sites. Non-identifiable meso-plastic fragments (5 mm to 2,5 cm) are not included in the assessment because they are monitored with less accuracy, due to their small size and the occurrence of very high numbers on some beaches (Hanke et al., 2019). Only identifiable litter types and macro-litter fragments (> 2,5 cm) are considered in the present assessment.
.")
Figure b: Example of litter collected during an OSPAR beach litter survey (beach “Le Stang”, France, Bay of Biscay and Iberian Coast Region, 09/01/2020, photo by Cedre).
It is important to appreciate the dynamics of beached litter to understand what assessments of beach litter data can tell us. In between any two beach litter surveys, litter items that have been washed ashore by tides or deposited directly on to the beach can be buried, washed or blown away again by subsequent tides and winds. Also during strong wave action buried litter items can resurface (Tudor and Williams, 2004) and litter can be blown onto a site from adjacent land or streets. Therefore, the number of litter items recorded during one survey generally constitutes a minimum value for litter being deposited at the site. However, on beaches in small bays, enclosed for example by rocky promontories, the dynamics of litter is different. Such sites can trap litter, which is subsequently only redistributed within the bay by waves and wind action. Therefore, the number of litter items recorded during a survey could potentially represent litter accumulation over time.
The composition of litter recorded on beaches also reflects its ability to reach the shore. The litter washed ashore is biased towards litter items that float and those that do not disintegrate, dissolve or decay quickly in the marine environment. The main category of litter found on beaches is plastic (also named artificial polymer material), which often floats and does not disintegrate rapidly in water (OSPAR Intermediate Assessment 2017; Addamo, 2017). The main components of the other common categories all float and/or decay slowly (wood, bottles, jars, light bulbs, tins and cans). Metal and glass from seaborne sources, are therefore probably under-represented because they are more likely to sink than items made of plastic, rubber and wood. Paper is probably also under-represented because it will generally disintegrate more rapidly in water than other materials. This significantly reduces the likelihood of environmental harm caused by paper litter. On beaches used intensively for recreation, the greater part of beach litter is often composed of items abandoned by beach visitors (e.g. sweetand fast-food packaging and cigarette butts) rather than litter washed ashore.
Confidence assessment
In the present assessment, there is high confidence in both the methodology and data availability except for the Arctic Waters Region where data are limited, especially for trends assessment.
Sites and surveys
The survey sites of the OSPAR Beach Litter Monitoring Programme are located on the North-East Atlantic coasts of Denmark (including beaches in East Greenland and Faeroe islands), France, Germany, Iceland, Ireland, the Netherlands, Norway, Portugal, Spain, Sweden, and the United Kingdom (Figure a).
In the present assessment, only survey sites with sufficient data availability were included to ensure a robust assessment. In total, 114 out of the 211 survey sites registered in the OSPAR Beach Litter Database are considered. Survey sites were selected according to the decision scheme presented in Figure c. For the beach litter status assessment (from 2018 to 2020), only sites with at least three surveys per year over two years are selected (114 sites with 1 137 surveys). For the trends assessment (from 2015 to 2020), only survey sites with at least two surveys per year over five years are included (83 sites with 1 693 surveys). In general at least three surveys per years are needed and available (Schulz et al., 2017), but the use of two surveys per year allows to include more data for the Arctic Waters Region. A detailed list of sites and surveys included in the assessment are presented in Table a.

Figure c: Decision scheme for inclusion of survey sites in the beach litter assessment
The surveys are carried out according to OSPAR’s Coordinated Environmental Monitoring Programme (CEMP) guidelines for marine monitoring and assessment of beach litter. Collected data are reported in the OSPAR Beach Litter Database.
The beaches, on which the survey sites are situated, mainly comprise sand or gravel and are exposed to the open sea. They are in most cases accessible to surveyors all year round for surveying and litter removal. However some sites, such as in the north of the OSPAR Area (Arctic Waters Region), are not accessible or not possible to survey during the winter survey period. For this assessment, a minimum of two surveys per year has been allowed for Arctic areas but a minimum number of three surveys per year will be used in the future. The beaches have a minimum length of 100 m, are generally free of buildings all year round, and are (in most cases) not subject to litter collection activities (beach cleaning). National coordinators of the surveys have used expert judgement and local knowledge of coastal areas when selecting the survey sites. For example, in some countries local conditions do not allow for selection of beaches mainly comprising sand, and in some locations it is not possible to select beaches of 100 m in length. The start and end points of the survey sites are marked clearly and registered into the OSPAR Beach Litter Database, to ensure that exactly the same site is monitored for all surveys.
Litter sampling and classification
According to the Beach litter CEMP guidelines, at each survey site, all litter items should be recorded four times a year using the OSPAR beach litter monitoring protocol. The survey periods are as follows: winter (between mid-December and mid-January), spring (April), summer (between mid-June and mid-July), and autumn (between mid-September and mid-October). However, due to limitations dictated by weather conditions, availability of manpower etc. not all survey sites included in this analysis have been surveyed as regularly as this for the whole period (see Table a). Some survey sites have only recently been added to the monitoring programme and surveys on other sites have been discontinued.
During each survey, the number of individual pieces of litter is recorded and allocated to one of the 112 predefined litter types, identified with a unique OSPAR identification number (ID), which are in the OSPAR beach litter survey list (Table b).
The survey list allows for the registration of identifiable items, unknown items and litter fragments in different size categories. Litter items which do not fit into a definite litter type category, are registered under the litter types “other” for the given material or use category (e.g. litter type “other plastic/polystyrene items”, OSPAR ID 48). Multilingual photo guides are available to assist surveyors with the identification and categorisation of litter items. All litter items are normally removed from the beach during the survey.
Paraffin and other chemicals, which - although included in the OSPAR Beach Litter Database - are recorded using a different method than for litter items, are not analysed here.
Assessment method
The assessment method used in the present report is described in the Beach litter CEMP guidelines and is briefly described below. Non-identifiable meso-plastic fragments (5 mm to 2,5 cm) and waxes/other pollutants are excluded from the analysis.
For the present assessment, each litter type is classified:
- according to its material composition as defined in MSFD recommendations (MSFD Technical Group on Marine Litter – TG-ML., 2013): Artificial polymer material (also known as plastic), Rubber, Cloth / Textile, Paper / cardboard, Processed / worked wood, Metal, Glass / ceramics and Undefined;
- as either Single-use plastics (SUP), Maritime-related plastic items (SEA) or other items. The attribution to the SUP category relies on the attribution defined in MSFD recommendations (MSFD TG-ML Online Photo Catalogue of the Joint List of Litter Categories). The SEA category is based on the FISH category defined in MSFD recommendations (Hanke et al., 2019), except that non- plastic items are excluded. In addition, the name “FISH” was replace by SEA as “FISH”appears to be too restrictive knowing the category also includes aquaculture-related items. It must be noted that some slight differences exist between SUP and FISH MSFD categories and the SUP and SEA categories used in the present assessment due to differences between OSPAR and MSFD beach litter survey lists.
- as litter type either directly targeted or not by existing measures, specifically OSPAR ML RAP 2014 – 2020 and EU SUP Directive 2019/904.
- as either identified litter type, non-identified litter type, and non-identifiable plastic fragments. Identified litter types include all items which can be identified and attributed to defined litter types. Non-identified litter types include all items which do not correspond to existing litter types in the OSPAR survey list and are recorded in “other” categories. Non-identifiable plastic fragments correspond to plastic fragments which are too fragmented to be identified.
Categories attribution for each litter type is detailed in Table b.
Analyses were performed using the software package litteR (Walvoort et al., 2021) and Excel.
Calculations were performed using median-based robust statistical methods which are appropriate (i) for the skewed beach litter data distributions (Schulz et al., 2017, 2019) and (ii) to support decision-making as they provide a snapshot of the typical situation without influence of extreme events. It must be noted that median values are in general lower than mean (average) values, because the extreme values are excluded from the calculations. In addition, median values of all individual litter types do not directly add up to a Total Count value, and adjusted calculation methods are needed to combine median values (see e.g. the calculation of median-based percentages below).
Status is assessed over a three-year period (from 2018 to 2020) and trends over a six-year period (from 2015 to 2020).
Analyses were done at beach scales and results were aggregated at higher spatial scales (OSPAR Maritime Area and Regions) using the blocking method (Van Belle and Hughes, 1984). In the present assessment, it is considered that at least three sites are needed to make calculations at an aggregated scale. If fewer than three sites are available, results should be used with care and are considered to be indicative (with lower information). This is for example the case for trend results in the Arctic Waters Region I.
At survey site scale, abundances were assessed by calculating the median of survey data for a single site and trends were assessed by calculating slopes and associated p-value using the median-based Theil-Sen method.
At higher scales (OSPAR Maritime Area and Regions), abundances were assessed by calculating the median of medians obtained for each survey site and trends were assessed by calculating the medians of slopes obtained for each survey site and the p-value of aggregated survey sites.
All percentages were calculated by dividing the median of a selected litter group by the sum of all litter groups considered (e.g. percentage of Artificial polymer material is obtained by dividing the median of Artificial polymer material by the sum of the medians of all material categories).
Top 10 or Top 15 litter types were assessed based on ranking of medians of individual litter types.
Most widespread litter types were also identified by ranking litter types according to the number of survey site Top 10 they are present in).
Medians and trends were calculated for specific items targeted by OSPAR’s Regional Action Plan on Marine Litter (ML RAP) 2014 – 2020: plastic bags, cigarette filters, cotton buds sticks, hunting cartridges and balloons.
The methods used to calculate abundances, percentages, trends and Top 10 at the survey site and higher scales are summarised in Table b.
Table b: OSPAR beach litter survey list and associated categories attribution. Measures considered are the ML RAP 2014 – 2020 and the EU SUP Directive 2019/904.
OSPAR ID | Litter type | Included in Total Count | Single-use plastics (SUP) | Maritime-related plastic items (SEA) | Identifiable ? | Targeted by measures? |
ARTIFICIAL POLYMER MATERIAL (PLASTIC) | ||||||
5 | 4/6-pack yokes | x | x |
| identified | not directly targeted |
2 | Bags | x | x |
| identified | directly targeted RAP action 44 SUP Directive |
3 | Small plastic bags | x | x |
| identified | not directly targeted |
112 | Plastic bag ends | x | x |
| identified | not directly targeted |
4 | Drinks (bottles, containers and drums) | x | x |
| identified | directly targeted SUP Directive |
5 | Cleaner (bottles, containers and drums) | x | x |
| identified | not directly targeted |
6 | Food containers incl. fast food containers | x | x |
| identified | not directly targeted |
7 | Cosmetics (bottles & containers) | x |
|
| identified | not directly targeted |
8 | Engine oil containers and drums < 50 cm | x |
|
| identified | not directly targeted |
9 | Engine oil containers and drums > 50 cm | x |
|
| identified | not directly targeted |
10 | Jerry cans | x |
|
| identified | not directly targeted |
11 | Injection gun containers | x |
|
| identified | not directly targeted |
12 | Other bottles, containers and drums | x |
|
| identified | not directly targeted |
13 | Crates | x |
|
| identified | not directly targeted |
14 | Car parts | x |
|
| identified | not directly targeted |
15 | Caps/lids | x | x |
| identified | directly targeted SUP Directive |
16 | Cigarette lighters | x |
|
| identified | not directly targeted |
17 | Pens | x |
|
| identified | not directly targeted |
18 | Combs/hair brushes | x |
|
| identified | not directly targeted |
19 | Crisp/sweet packets and lolly sticks | x | x |
| identified | directly targeted SUP Directive |
20 | Toys & party poppers | x |
|
| identified | not directly targeted |
21 | Cups | x | x |
| identified | directly targeted SUP Directive |
22 | Cutlery/trays/straws | x | x |
| identified | directly targeted SUP Directive |
23 | Fertiliser/animal feed bags | x |
|
| identified | not directly targeted |
24 | Mesh vegetable bags | x |
|
| identified | not directly targeted |
25 | Gloves (typical washing up gloves) | x |
|
| identified | not directly targeted |
113 | Gloves (industrial/professional gloves) | x |
|
| identified | not directly targeted |
26 | Crab/lobster pots | x |
| x | identified | directly targeted RAP action 35 SUP Directive |
114 | Lobster and fish tags | x |
| x | identified | directly targeted RAP action 35 SUP Directive |
27 | Octopus pots | x |
| x | identified | directly targeted RAP action 35 SUP Directive |
28 | Oyster nets or mussel bags incl. plastic stoppers | x |
| x | identified | directly targeted RAP action 35 SUP Directive |
29 | Oyster trays | x |
| x | identified | directly targeted RAP action 35 SUP Directive |
30 | Plastic sheeting from mussel culture | x |
| x | identified | directly targeted RAP action 35 SUP Directive |
31 | Rope (diameter more than 1 cm) | x |
| x | identified | directly targeted RAP action 35 SUP Directive |
32 | String and cord (diameter less than 1 cm) | x |
| x | identified | directly targeted RAP action 35 SUP Directive |
115 | Nets and pieces of net < 50 cm | x |
| x | identified | directly targeted RAP action 35 SUP Directive |
116 | Nets and pieces of net > 50 cm | x |
| x | identified | directly targeted RAP action 35 SUP Directive |
33 | Tangled nets/cord/rope and string | x |
| x | identified | directly targeted RAP action 35 SUP Directive |
34 | Fish boxes | x |
| x | identified | not directly targeted |
35 | Fishing line (angling) | x |
| x | identified | directly targeted RAP action 35 SUP Directive |
36 | Light sticks (tubes with fluid) | x |
| x | identified | directly targeted RAP action 35 SUP Directive |
37 | Float/Buoys | x |
| x | identified | directly targeted SUP Directive |
38 | Buckets | x |
|
| identified | not directly targeted |
39 | Strapping bands | x |
|
| identified | not directly targeted |
40 | Industrial packaging, plastic sheeting | x |
|
| identified | not directly targeted |
41 | Fibre glass | x |
|
| identified | not directly targeted |
42 | Hard hats | x |
|
| identified | not directly targeted |
43 | Shtogun cartridges | x |
|
| identified | directly targeted RAP action 48 |
44 | Shoes/sandals | x |
|
| identified | not directly targeted |
45 | Foam sponge | x |
|
| identified | not directly targeted |
117 | Plastic/polystyrene pieces 0 - 2,5 cm |
|
|
| excluded | excluded |
46 | Plastic/polystyrene pieces 2,5 - 50 cm | x |
|
| non-identifiable | not directly targeted |
47 | Plastic/polystyrene pieces > 50 cm | x |
|
| non-identifiable | not directly targeted |
48 | Other plastic/polystyrene items | x |
|
| non-identified | not directly targeted |
64 | Cigarette butts | x | x |
| identified | directly targeted RAP action 48 SUP Directive |
97 | Condoms | x |
|
| identified | not directly targeted |
98 | Cotton bud sticks | x | x |
| identified | directly targeted RAP action 48 SUP Directive |
99 | Sanitary towels/panty liners/backing strips | x | x |
| identified | directly targeted SUP Directive |
100 | Tampons and tampon applicators | x | x |
| identified | directly targeted SUP Directive |
101 | Toilet fresheners | x |
|
| identified | not directly targeted |
103 | Containers/tubes | x |
|
| identified | not directly targeted |
104 | Syringes | x |
|
| identified | not directly targeted |
121 | Bagged dog faeces | x |
|
| identified | not directly targeted |
RUBBER | ||||||
49 | Balloons, incl. plastic valves, ribbons, strings etc. | x | x |
| identified | directly targeted RAP action 48 |
50 | Boots | x |
|
| identified | not directly targeted |
52 | Tyres and belts | x |
|
| identified | not directly targeted |
53 | Other rubber pieces | x |
|
| non-identified | not directly targeted |
CLOTH | ||||||
54 | Clothing | x |
|
| identified | not directly targeted |
55 | Furnishing | x |
|
| identified | not directly targeted |
56 | Sacking | x |
|
| identified | not directly targeted |
57 | Shoes (leather) | x |
|
| identified | not directly targeted |
59 | Other textiles | x |
|
| non-identified | not directly targeted |
PAPER / CARDBOARD | ||||||
60 | Bags | x |
|
| identified | not directly targeted |
61 | Cardboard | x |
|
| identified | not directly targeted |
118 | Cartons e.g. tetrapak (milk) | x |
|
| identified | not directly targeted |
62 | Cartons e.g. tetrapk (other) | x |
|
| identified | not directly targeted |
63 | Cigarette packets | x |
|
| identified | not directly targeted |
65 | Cups | x |
|
| identified | not directly targeted |
66 | Newspapers & magazines | x |
|
| identified | not directly targeted |
67 | Other paper items | x |
|
| non-identified | not directly targeted |
PROCESSED / WORKED WOOD | ||||||
68 | Corks | x |
|
| identified | not directly targeted |
69 | Pallets | x |
|
| identified | not directly targeted |
70 | Crates | x |
|
| identified | not directly targeted |
71 | Crab/lobster pots | x |
|
| identified | directly targeted RAP action 35 |
119 | Fish boxes | x |
|
| identified | directly targeted RAP action 35 |
72 | Ice lolly sticks/chip forks | x |
|
| identified | not directly targeted |
73 | Paint brushes | x |
|
| identified | not directly targeted |
74 | Other wood < 50 cm | x |
|
| non-identified | not directly targeted |
75 | Other wood > 50 cm | x |
|
| non-identified | not directly targeted |
METAL | ||||||
76 | Aerosol/Spray cans | x |
|
| identified | not directly targeted |
77 | Bottle caps | x |
|
| identified | not directly targeted |
78 | Drink cans | x |
|
| identified | not directly targeted |
120 | Disposable BBQs | x |
|
| identified | not directly targeted |
79 | Electric appliances | x |
|
| identified | not directly targeted |
80 | Fishing weights | x |
|
| identified | directly targeted RAP action 35 |
81 | Foil wrappers | x |
|
| identified | not directly targeted |
82 | Food cans | x |
|
| identified | not directly targeted |
83 | Industrial scrap | x |
|
| identified | not directly targeted |
84 | Oil drums | x |
|
| identified | not directly targeted |
86 | Paint tins | x |
|
| identified | not directly targeted |
87 | Lobster /crab pots and tops | x |
|
| identified | directly targeted RAP action 35 |
88 | Wire, wire mesh, barbed wire | x |
|
| identified | not directly targeted |
89 | Other metal pieces < 50 cm | x |
|
| non-identified | not directly targeted |
90 | Other metal pieces > 50 cm | x |
|
| non-identified | not directly targeted |
GLASS AND CERAMICS | ||||||
91 | Bottles | x |
|
| identified | not directly targeted |
92 | Light bulbs/tubes | x |
|
| identified | not directly targeted |
93 | Other glass items | x |
|
| non-identified | not directly targeted |
94 | Construction materials e.g. tiles | x |
|
| identified | not directly targeted |
95 | Octopus pots | x |
|
| identified | directly targeted RAP action 35 |
96 | Other ceramic/pottery items | x |
|
| non-identified | not directly targeted |
UNDEFINED | ||||||
102 | Other sanitary items | x |
|
| non-identified | not directly targeted |
105 | Other medical items (swabs, bandaging etc.) | x |
|
| non-identified | not directly targeted |
Table c: List of statistical indicators calculated at each geographical scale and corresponding calculation methods
Beach litter indicator | Survey site scale | Higher scales (OSPAR Area and Regions) |
|---|---|---|
Abundance | Median of survey site data for the three-year period from 2018 to 2020 | Median of survey sites medians |
Percentage | 100 × median of the category considered divided by the sum of medians of the different categories | |
Trend | Theil-Sen slope of survey site data for the six-year period from 2015 to 2020 p-value of Theil-Sen slope | Median of survey sites slopes p-value of aggregated survey sites |
Top 10/15 | Ranking of medians of individual litter types and presentation of the 10/15 highest ranking types | |
Results
The median total count in the OSPAR Area over the period from 2018 to 2020 is 252 items/100 m. Although there is no adopted operational total abundance objective at the OSPAR level, this value is much higher than the European Threshold Value (EU TV) of 20 items/100 m (van Loon et al., 2020). The magnitude of beach litter pollution varies between the five OSPAR Regions from 50 to 360 items/100 m, being minimal in the Wider Atlantic Region and maximal in the Bay of Biscay and Iberian Coast Region.
The analysis of litter composition highlights a predominance of items made of artificial polymer materials, also known as plastics. At the OSPAR Maritime Area scale, plastic items represent 94% of the pollution, with a median of 194 items/100 m whereas other materials do not exceed 3 items/100 m. Similar results are observed at the OSPAR Regions scale with plastic representing between 92% (Celtic Seas) and 97% (Arctic Waters) of litter observed.
Single-use plastics (SUP) and maritime-related plastic items (SEA) are of great interest since these use categories are targeted by the EU Directive 2019/904 to reduce the impact of certain plastic products on the environment. The SUP category includes also specific litter items that are directly targeted by OSPAR’s Regional Action Plan on Marine Litter (ML RAP) 2014-2020, e.g. plastic bags, cigarette filters, cotton bud sticks, hunting cartridges, and balloons. In the OSPAR Maritime Area, the median number of items of SUP and SEA use categories are 45 items/100 m and 36 items/100 m respectively. Overall, these groups represent respectively 26% and 21% of litter observed. The highest percentage of SUP is observed in Bay of Biscay and Iberian Coast (37%) whereas the highest percentage of SEA items is observed in the Greater North Sea (25%). SUP and SEA items are directly targeted by Governments’ measures and are expected to decrease in the coming years.
Over the last six years, decreasing trends in total and plastic counts are observed at the OSPAR Maritime Area scale and in all Regions, except in Arctic Waters where robust results could not be obtained due to low data availability. However, these decreasing trends appear to be rather small, decreases in total count ranging from 9 to 12 items/year in OSPAR Regions and being of 11 items/year at the OSPAR Area scale. Decreasing trends are also observed for SUP and SEA in Greater North Sea, Celtic Seas, and Bay of Biscay and Iberian Coast Regions, with slopes ranging from -2 to -5 items/100 m per year.
At the OSPAR Maritime Area scale, 54% of litter items recorded are directly targeted by measures in EU Directive 2019/904 or the ML RAP indicating a rather good coverage. A good adequacy is observed between the OSPAR survey list and the beach litter composition as only 8% of litter items is non-identified whereas 79% are identified and the remaining 13% being non-identifiable plastic fragments.
Assessment of abundance between 2018 and 2020
The median total count of the OSPAR Maritime Area over a three-year period between 2018 and 2020, is 252 litter items per 100 m of coastline, which is much higher than the Threshold Value of 20 litter items/100 m adopted at European level (van Loon et al., 2020). To reach this Threshold Value, a reduction of the total count would be required in the OSPAR Area.
The median total counts of the different OSPAR Regions over the period from 2018 to 2020 are presented in Table d and their spatial distribution is shown in Figure d. It appears that pollution levels vary between OSPAR Regions, from 50 litter items/100 m for the OSPAR Region Wider Atlantic to 360 litter items/100 m for the OSPAR Region Bay of Biscay and Iberian Coast. Abundance in the Wider Atlantic is significantly lower than in the four other Regions. Nevertheless, all the median total counts are higher than the European Threshold Value, indicating beach litter is abundant whatever the OSPAR Region.
At the beach scale, pollution levels range from 10 to 16 272 litter items/100 m (see Figure e and table in Appendix 1 ).
It must be noted that several phenomena can influence beach litter abundance. Regular beach clean-up can decrease the pollution level whereas transboundary transport of pollution due to wind and currents can exacerbate it in some areas like the Skagerrak sub region (e.g. on the Sweden coast). Though these phenomena are known to occur, their extent and effect on beach litter monitoring is currently not well quantified in the OSPAR Maritime Area.
Figure d: Median total counts in the five OSPAR Regions over the three-year period from 2018 to 2020. Available via https://odims.ospar.org/en/submissions/ospar_median_total_counts_beach_2022_06_001/
Figure e: Median total counts for the 114 survey sites considered in the status assessment, over the three-year period from 2018 to 2020. The numerical results per survey site are presented in Appendix 1 . Available via https://odims.ospar.org/en/submissions/ospar_median_total_counts_beach_2022_05_001/
Table d: Median total and plastic counts (from 2018 to 2020) and associated trends (from 2015 to 2020) in the OSPAR Area and Regions.
Geographical scale | Median total count (items/100 m) | Trend (slope in items/100 m per year) ↓ significant decrease ↑ significant increase | Median plastic count (items/100 m) | Trend (slope in items/100 m per year) ↓ significant decrease ↑ significant increase | |
OSPAR Area | 252 | ↓ -11 | 194 | ↓ -9 | |
Arctic Waters | 252 | -6a | 172 | -16a | |
Greater North Sea | 205 | ↓ -9 | 161 | ↓ -8 | |
Celtic Seas | 278 | ↓ -12 | 145 | ↓ -11 | |
Bay of Biscay and Iberian Coast | 360 | ↓ -11 | 284 | ↓ -11 | |
Wider Atlantic | 50 | ↓ -11 | 35 | ↓ -11 | |
a trend slopes provided for information (lower confidence due to a limited number of sites and / or surveys) |
| ||||
Material composition of beach litter between 2018 and 2020
The composition of beach litter pollution in the OSPAR Maritime Area and Regions is presented in Figure f. A major part comes from artificial polymer material (plastic) category with a median of 194 litter items/100 m recorded at the OSPAR Maritime Area scale. All other material categories have medians equal or inferior to 3 litter items/100 m. Similar results are observed in OSPAR Regions as artificial polymer material remains the most important material, from 35 litter items/100 m for OSPAR Region Wider Atlantic (95% of the beach litter pollution of the Region) to 284 litter items/100 m for OSPAR Region Bay of Biscay and Iberian Coast (95% of the beach litter pollution of the Region). This confirms that artificial polymer materials also known as plastics, represent the most important part of the pollution regardless of the geographical scale, indicating this material must be tackled in priority to substantially reduce beach litter pollution.
Use categories: single-use plastics and maritime-related plastic items
The use categories “Single-use Plastics” (SUP) and “Maritime-related plastic items” (SEA) are of great interest in the OSPAR Area since they are targeted by measures. In addition, the two groups represent a considerable part of beach litter pollution (47%) (Figure g). The details of their median counts are presented for the OSPAR Maritime Area and Regions in Table e.
At the OSPAR Maritime Area scale, SUP show a median total count of 45 items/100 m. When looking at the regional distribution of this use group, the OSPAR Region Bay of Biscay and Iberian Coast appears to be the most affected by the presence of SUP, with a median value of 93 items/100 m, representing 37% of the pollution. The three OSPAR Regions - Arctic Waters, Greater North Sea, and Celtic Seas - present similar median values, with 30 items/100 m (13% of the Region’s pollution), 37 items/100 m (24% of the Region’s pollution) and 37 items/100 m (23% of the Region’s pollution), respectively. Finally, the OSPAR Region Wider Atlantic presents the lowest median values in SUP items with 6 items/100 m (15% of the Region pollution).
The use group “Maritime-related plastic items” (SEA), which includes plastic fishing and aquaculture related litter as well as strings and cords (which can come from different sources but are often mainly related to fishing), has a median value of 36 litter items/100 m in the OSPAR Area. Though the Greater North Sea presents the highest percentage of SEA items (25%), the regional distribution is rather homogeneous between Regions, except for the Wider Atlantic, which has recorded very low quantities of SEA items (1 item/100 m as median value, 3% of the Region’s pollution). The four other Regions have medians ranging from 29 litter items/100 m for the OSPAR Region Celtic Seas to 51 litter items/100 m for the OSPAR Region Bay of Biscay and Iberian Coast, and SEA items represent between 12% (Arctic Waters) and 25% (Greater North Sea) of the pollution, indicating that maritime activities are regular sources of litter pollution in the OSPAR Area.
Table e: Median counts in Single-use plastics (SUP) and Maritime-related plastic items (SEA) (from 2018 to 2020) and associated trends (from 2015 to 2020) in the OSPAR Area and Regions.
Geographical scale | Median SUP count (items/100 m) | Trend (slope in items/100 m per year) ↓ significant decrease ↑ significant increase | Median SEA count (items/100 m) | Trend (slope in items/100 m per year) ↓ significant decrease ↑ significant increase | |
OSPAR Area | 45 | ↓ -4 | 36 | ↓ -2 | |
Arctic Waters | 30 | -4a | 30 | -5a | |
Greater North Sea | 37 | ↓ -4 | 40 | ↓ -2 | |
Celtic Seas | 37 | ↓ -5 | 29 | ↓ -2 | |
Bay of Biscay and Iberian Coast | 93 | ↓ -4 | 51 | ↓ -4 | |
Wider Atlantic | 6 | 0 | 1 | 0 | |
a trend slopes provided for information (lower confidence due to a limited number of sites and / or surveys) | |||||
Trends over the six-year period from 2015 to 2020
Several significant decreases in litter abundance are observed over the period from 2015 to 2020 as detailed in Table d. Significant decreases in both total counts and plastic items are observed at the OSPAR Maritime Area scale and in all Regions except Arctic Waters (not enough data). Decreases in total counts range from 9 to 12 items/100 m per year whereas decreases in plastic counts range from 8 to 11 items/100 m per year, indicating that these decreasing trends remain rather limited.
Decreasing trends are also observed for SUP and SEA items at the OSPAR Area scale and in three Regions: Greater North Sea, Celtic Seas, and Bay of Biscay and Iberian Coast with reductions ranging from 2 to 5 items/100 m per year (Table e). It should be noted that the SUP Directive was implemented after the reporting period considered in the present assessement, so it has not been the reason for the reduction in SUP litter items.
At the beach scale and considering the 83 survey sites selected for the trend assessment, 25 survey sites present significant decreasing trends of total count (30%) and five surveys sites present significant increasing trends (6%) over the last six years (2015 to 2020). Overall, results indicate that a few sites show increasing trends, only a limited number of survey sites exhibit decreasing trends and no trend can be attributed to the majority of survey sites (see Figure h).
Figure h: Trends in total count for the 83 survey sites considered in the trends assessment, over the six-year period from 2015 to 2020. The numerical trends per survey site are presented in Appendix 1 . Available via https://odims.ospar.org/en/submissions/ospar_beach_litter_trend_2022_08_001/
Top litter types and most widespread top litter items in the OSPAR Maritime Area and Regions
The top 15 litter types in the OSPAR Maritime Area are presented in Figure i. Among the 15 litter types presented, four litter types belong to the maritime-related plastic items (SEA) category, including “string and cord (diameter less than 1 cm)” litter type, which presents a median value of 17 litter items/100 m (24% of the beach litter pollution) in the OSPAR Maritime Area. In addition, six litter types belong to Single-use plastics (SUP) category: “caps and lids” (8 litter items/100 m; 12%), “crisp/sweet packets and lolly sticks” (6 litter items/100 m; 9%), “drinks (bottles, containers and drums)”, “cutlery/trays/straws” and “cotton bud sticks” (2 litter items/100 m both; 3%) and “sanitary towels/panty liners/backing strips” (1 litter item/100 m, 1%). All these litter types show the importance of the use categories “Single-use plastics” and “Maritime-related plastic items”. However, unidentified plastic/polystyrene pieces (2,5 - 50 cm) is still the most abundant litter type with a median value of 21 litter items/100 m (30%) in the OSPAR Maritime Area. This confirms the important fragmentation of plastic in the environment, increasing the number of items, making recovery more difficult and raising concern in terms of environmental impact with an increasing risk of ingestion as litter breaks down into smaller parts.
")
Figure i: Top 15 litter types in OSPAR Area (from 2018 to 2020)
In addition to being the most abundant litter type, “plastic/polystyrene pieces (2,5 – 50 cm)” is also the most widespread top litter type, being recorded in the top 10 of 94% of the survey sites, as indicated by Table f showing the top litter types present in more than 15% of the survey sites. Other widespread top litter types are “String and cord (diameter less than 1 cm)” (82% of the survey sites), “Caps/lids” (79% of the survey sites), “Crisp/sweet packets and lolly sticks” (73% of the survey sites), “Other plastic/polystyrene items” (49% of the survey sites) and “Cotton bud sticks (44% of the survey sites).
It is also worth to note the presence of “cigarette butts” in top litter items in 32% of the survey sites though absent from the top litter type rank of the OSPAR Maritime Area with a median value of 0 item/100 m (Table f). This is explained by an important spatial heterogeneity, “cigarette butts” being mainly observed in the OSPAR Region Bay of Biscay and Iberian Coast (Top 6), where a median value of 6 cigarette butts/100 m is recorded.
Overall, the analysis of top litter types shows there are a limited number of abundant individual litter types and an important number of litter types exhibiting low abundances (medians of 1 or 2 items/100 m), indicating spatial heterogeneity and a large diversity in beach litter composition in the OSPAR Maritime Area (Figure i).
Table f: Most widespread litter types on the 114 considered sites from 2018 to 2020 (most widespread litter types are ranked according to the number of survey site Top 10 they are present in)
OSPAR ID | Litter type | Most widespread litter type ranking | Number of survey sites where the litter type is in the Top 10 | Percentage of survey sites where the litter type is in the Top 10 |
46 | Plastic/polystyrene pieces (2,5-50 cm) | 1 | 107 | 94% |
32 | String and cord (diameter less than 1 cm) | 2 | 93 | 82% |
15 | Caps/lids | 3 | 90 | 79% |
19 | Crisp/sweet packets and lolly sticks | 4 | 83 | 73% |
48 | Other plastic/polystyrene items | 5 | 56 | 49% |
98 | Cotton bud sticks | 6 | 50 | 44% |
31 | Rope (diameter more than 1 cm) | 7 | 41 | 36% |
4 | Drinks (bottle, containers and drums) | 8 | 38 | 33% |
64 | Cigarette butts | 9 | 37 | 32% |
74 | Other wood < 50 cm | 10 | 36 | 32% |
115 | Nets and pieces of net < 50 cm | 11 | 35 | 31% |
45 | Foam sponge | 12 | 34 | 30% |
33 | Tangled nets/cord/rope and string | 13 | 27 | 24% |
3 | Small plastic bags | 14 | 24 | 21% |
43 | Shotgun cartridges | 15 | 21 | 18% |
22 | Cutlery/trays/straws | 15 | 21 | 18% |
6 | Food containers including fast food containers | 15 | 21 | 18% |
28 | Oyster nets or mussel bags including plastic stoppers | 18 | 18 | 16% |
49 | Balloons including plastic valves, ribbons, etc. | 18 | 18 | 16% |
Case studies on potential sources of beach litter pollution in Germany and Spain
The identification of beach litter sources is of great importance in the development of measures and the subsequent assessment of their efficiency. Though there is no method adopted yet at the OSPAR level to assess beach litter sources, Contracting Parties were asked to test the Matrix Scoring Technique (Tudor and Williams, 2004) and several, such as Germany and Spain, launched studies.
Germany case study
In Germany, the Matrix Scoring Technique was applied to the OSPAR beach litter data from the Country-sub region Germany – Greater North Sea in the time period from 2011 to 2017 (Schäfer, Scheele and Papenjohann, 2019) following the recommendation of Veiga et al., (2016). In the Matrix Scoring Technique litter types are attributed to potential sources. The German application used ten source categories ( Appendix 2 ). The method uses likelihood categories in combination with a scoring system, which allows qualitative statements to be made, such as “it is very likely that…” or “it is unlikely that…” but also quantitative assessments of relative quantities of litter and their attribution to various sources.
The assessment included a detailed examination of identifiable litter items from the OSPAR Country-sub region Germany – Greater North Sea, which could be attributed to OSPAR litter types, the consideration of the prevailing regional hydrological and wind conditions, drift, and the opinions of regional stakeholders and experts. The examination of litter items included 1 712 photographs of a total of 1 120 litter items collected on the German North Sea coast, leading to a good overview of the variability of litter items in each OSPAR litter category. The following information was recorded for each item:
- Type of packaging e.g. type of drink bottle or of food container
- Product type
- Product brand
- Manufacturer
- Writing on the item or on labels i.e. language, best-before-date, barcode, website
- Size
- Physical condition e.g. broken, damaged, abraded and the occurrence of fouling i.e. growth of animals and plants on the item in order to assess the amount of time the item has been in the marine environment.
A total of 17 074 marine litter items recorded during OSPAR beach litter surveys were included in the matrix scoring analysis; 62% (10 670) of the litter items could be attributed to individual sources. The remaining 38% (6 404) of the litter items could not be allocated because they were either unidentifiable fragments or objects recorded under the OSPAR litter categories “other items” of the various material classes.
These “other items” are a mixture of litter types, which, individually, do not occur frequently on the survey sites. Fragments are the disintegrated remains of diverse plastic objects. Both were excluded from the further analysis, because they could not be allocated to sources.
One of the main conclusions was that marine litter found on the German North Sea coast is chiefly released by local or regional activities. On the basis of drift experiments, Schöneich-Argent and Freund (2020) also concluded that litter emitted locally into the freshwater and marine environment generally stays local. However, there is evidence that some floating litter items from distant sources, e.g. in France or the Netherlands, are transported to the German North Sea with coastal water currents.
Sea-based sources were considered to account for 60% of the litter items recorded and land-based sources for the remaining 40%. Fishing activities were considered to account for about a third of the litter items and tourism and recreational activities for a further fifth. The proportion of litter items considered attributable to each of the ten sources are presented in Appendix 2 .
Spain case study
A very similar method was applied in Spain using also the Matrix scoring system with some differences in the sources considered and the scores assigned to each litter item according to regional specific characteristics. The assessment made by Spain using the beach litter results for the period between 2013 and 2018, corresponding to 275 surveys on 12 survey sites located in all cases in the OSPAR Region Bay of Biscay and Iberian Coast, shows that the most frequent sources of litter in those beaches are fishing (19%) and tourism (16%) followed by “other activities on land” (15%) which includes the riverine inputs, aquaculture (10%) and shipping (10%). Sea-based sources were considered as responsible for 42% of the litter items recorded and land-based sources for the remaining 58%.
The two case studies conducted in Germany and Spain suggest that sea-based sources contribute importantly and fishing, recreational activities and tourism are identified as important contributors of beach litter pollution. Overall, regardless of the precise contributions of specific sources to beach litter pollution, stringent measures to reduce and eliminate litter emissions from all sources will probably be needed to reach OSPAR objectives and the EU beach litter TV in the future.
Measures coverage and OSPAR survey list adequacy
The good adequacy of the OSPAR Regional Action Plan on Marine Litter (ML RAP) 2014-2020and the EU SUP Directive 2019/904 is estimated by assessing the total number of litter items directly targeted by these measures (Figure j). At the OSPAR Maritime Area scale, 54% of the litter items recorded are directly targeted either by the Directive or the ML RAP and 46% are not directly targeted. This shows that the Directive and the ML RAP measures directly cover a good proportion of beach litter pollution, but there is still room for improvement.
Looking more closely at these figures, an important part, 13%, of the beach litter pollution appears to be non-identifiable as it includes the fragments of artificial polymer materials recorded in surveys. These litter items could be linked to multiple sources or activities, which prevents the implementation of dedicated measures to combat them. They are, however, most probably also the result of disintegration of e.g. single-use plastics (SUP) and maritime-related plastic items (SEA) which are covered by measures. In addition, 8% of the beach litter pollution is made of non-identified litter items. This value reflects the capacity of the OSPAR litter reference list to cover all the items collected. To improve the coverage of the OSPAR list, the addition of new litter types could be considered, however this would not guarantee a reduction of the proportion of non-identified litter items.

Figure j: Assessment of OSPAR survey list adequacy and measures coverage in the OSPAR Area from 2018 to 2020. Measures considered are the ML RAP 2014 – 2020 and the EU SUP Directive 2019/904.
Complementary information
Key results obtained at the OSPAR Maritime Area and Regions scales are summarised in Technical Supplements 1-6.
Technical supplement 1 - Beach litter pollution status - OSPAR Area
Technical supplement 2 - Beach litter pollution status - Arctic Waters
Technical supplement 3 - Beach litter pollution status - Bay of Biscay and Iberian Coast
Technical supplement 4 - Beach litter pollution status - Celtic Seas
Technical supplement 5 - Beach litter pollution status - Greater North Sea
Technical supplement 6 - Beach litter pollution status - Wider Atlantic
Conclusion
Beach litter is abundant in the OSPAR Maritime Area and Regions. Plastic appears to be predominant in all Regions. Single-use plastics and maritime-related plastic litter are important components of beach litter pollution in the OSPAR Maritime Area though some regional specificity in proportions of these two groups of litter types is observed.
At present, an important reduction in abundance is required at the OSPAR level to reach the threshold value of 20 litter items/100 m adopted at the EU level, which is an indicative value of beach litter status in the OSPAR Maritime Area.
Significant decreasing trends are observed in all Regions (except in Arctic Waters where they could not be assessed robustly), especially for total counts and plastics. However, levels of marine litter remain high.
Overall, the present assessment shows that current measures should be continued and strengthened, and additional measures taken, to obtain a greater reduction of beach litter in the OSPAR Maritime Area in order to substantially reduce beach litter pollution and achieve OSPAR objectives, especially the objective S4.O3 recently adopted in the North-East Atlantic Environment Strategy 2020-2030 of reduction by at least 50% by 2025 and by at least 75% by 2030, of the prevalence of the most commonly found single-use plastic items and of maritime-related plastic items on beaches.
Beach litter is abundant in the OSPAR Maritime Area and in OSPAR Regions. Plastic appears to be predominant in all OSPAR Regions, reaching a median value of 194 litter items/100 m at the OSPAR Maritime Area scale and representing 94% of the pollution. The Bay of Biscay and Iberian Coast is the Region presenting the highest level of pollution whereas the Arctic Waters Region has the lowest. Single-use plastic and maritime-related plastic items present median values of 45 items/100 m and 36 items/100 m respectively on the OSPAR coastline (respectively 26% and 21% of the pollution). However, regional specificities are observed in term of litter composition in the different OSPAR Regions, single-use plastics being predominant in the Bay of Biscay and Iberian Coast Region (37% of the pollution) and maritime-related plastic items being predominant in the Greater North Sea Region (25% of the pollution).
At present, an important reduction in total count would be required at the OSPAR level to reach the Threshold Value (TV) of 20 litter items/100 m adopted at the EU level, which is an indicative value of beach litter status in the OSPAR Maritime Area. All OSPAR Regions exhibit assessment values above the EU TV.
Significant decreasing trends are observed in litter abundance in the OSPAR Maritime Area and in four of the five OSPAR Regions over the last six years. However, reductions appear limited suggesting the 2010-2020 North-East Atlantic Environment Strategy objective requiring a substantial reduction has not been achieved in any OSPAR Region.
Case studies conducted in Germany and Spain suggest that sea based sources contributes importantly to pollution as respectively, 60% and 42% of litter are identified as originating from these sources on German and Spanish coastlines. Fishing and recreational activities and tourism are identified as important contributors of beach litter pollution.
The classification of the beach litter items by the OSPAR survey list seems adequate since 79% of litter collected are identified by the OSPAR survey list and only 8% are not identified. Results confirm the presence of numerous non-identifiable fragments reaching 13% of litter found on the OSPAR coastline which cannot be used to identify pollution sources.
Existing measures have been well selected as they appear to address 54% of litter found on OSPAR coastline, directly targeted by either OSPAR’s Regional Action Plan on Marine Litter (ML RAP) 2014-2020 or the EU SUP Directive 2019/904.
Overall, and in view of observed trends, results suggest actions should be continued and strengthened to speed up the reduction of marine litter in the OSPAR Maritime Area.
Knowledge Gaps
Transboundary pollution is known to occur in the OSPAR Maritime Area, however this phenomenon is not well quantified and should be studied.
The composition and origins of the numerous plastic fragments observed should be investigated.
More information should be collected on non-identified items and on certain litter types targeted by OSPAR’s Regional Action Plan on Marine Litter (ML RAP) which are not included in the survey list used so far.
More studies should be performed to identify litter sources.
More comprehensive information on environmental conditions and human activities need to be made available for all the survey sites in a useable form.
The effects of weather phenomena should be analysed to assess their influence on beach litter data.
The present assessment allows the identification of existing knowledge gaps which hinder a precise assessment of beach litter pollution. These gaps are:
- Nearly 13% of beach litter observed in the OSPAR Maritime Area are non-identifiable fragments. These large quantities of fragments appear to be problematic as they could be linked to various sources or activities. This therefore prevents the implementation of dedicated measures. More research is needed to improve the knowledge of the composition and sources of fragments;
- The non-identified litter items represent 8%, of which the litter type “other plastic/polystyrene items” is present in the top litter types with a median value of 3 items/100 m, indicating they do not have a proper category to be classified in and cannot be counted individually. Further investigations should be made to improve knowledge of these items and assess if they require to be targeted by action and as a consequence, if they need to be individually monitored;
- Some litter types are known to be abundant on European coastlines (e.g. foamed polystyrenes). As a consequence, these groups of items are already targeted by measures (OSPAR’s Regional Action Plan on Marine Litter). However, in some cases, they are not individually monitored in the OSPAR beach litter surveys. It is recommended to adapt the monitoring litter list to existing measures in order to ensure a better knowledge of their abundance and a proper assessment of the efficiency of measures;
- Sources of beach litter have not been identified in the present study except on the German and Spanish coasts. This type of source characterisation may in the future be improved and applied at a larger scale. Beyond the identification of sources of the different litter types, the development of new methodologies could make it possible to estimate transboundary pollution, i.e. to determine the proportion of litter items that did not originate from the country, region or area where they have been collected. In that sense, the MSFD Technical Group on Marine Litter (TG ML) has planned to develop a suitable model to estimate transboundary pollution in the mid-term future (van Loon et al., 2020). This method could lead to being able to estimate the proportion of litter items of the present study that comes from outside the OSPAR Maritime Area or that is transferred between OSPAR Regions.
- The survey sites which supplied the data used in the analysis of beach litter for the OSPAR Regions are situated on beaches, which are very variable in their topography, hydrography, geography, proximity to point source,s and human use, all of which can influence the amount of litter deposited on the beach. Differences in the topography, geography of the beaches and hydrodynamic conditions (tides, waves, currents, etc.) were succinctly considered in aggregation method but need to be considered further in future assessments.
- Weather phenomena can also influence litter deposition. In future, the effects of weather phenomena, such as the North Atlantic Oscillation (NAO), should be analysed to assess their influence on abundance and trends in the beach litter data set.
Addamo, A. M., Laroche, P., Hanke, G. (2017) Top Marine Beach Litter Items in Europe, EUR 29249 EN, Publications Office of the European Union, Luxembourg, ISBN 978-92-79-87711-7, doi:10.2760/496717, JRC108181.
https://publications.jrc.ec.europa.eu/repository/bitstream/JRC108181/technical_report_top_marine_litter_it ems_eur_29249_en_pdf.pdf
Directive (EU) 2019/904 of the European Parliament and of the Council of 5 June 2019 on the reduction of the impact of certain plastic products on the environment.
https://eur-lex.europa.eu/legal-content/EN/TXT/HTML/?uri=CELEX:32019L0904&from=FR
Hanke, G., Walvoort, D., van Loon, W., Addamo, A.M., Brosich, A., del Mar Chaves Montero, M., Molina Jack, M.E., Vinci, M., Giorgetti, A. (2019) EU Marine Beach Litter Baselines, EUR 30022 EN, Publications Office of the European Union, Luxemburg, ISBN 978-92-76-14243-0, doi: 10.2760/16903 , JRC114129.
https://publications.jrc.ec.europa.eu/repository/bitstream/JRC114129/eu-marine-litter-baselines.pdf
OSPAR Beach Litter Database https://beachlitter.ospar.org/
OSPAR Intermediate Assessment 2017. Beach Litter - Abundance, Composition and Trends. https://oap.ospar.org/en/ospar-assessments/intermediate-assessment-2017/pressures-humanactivities/marine-litter/beach-litter/
OSPAR Marine Litter Region Action Plan. https://www.ospar.org/documents?v=34422
OSPAR CEMP Guidelines for marine monitoring and assessment of beach litter: https://www.ospar.org/work-areas/cross-cutting-issues/cemp
van Loon, W., Hanke, G., Fleet, D., Werner, S., Barry, J., Strand, J., Eriksson, J., Galgani, F., Gräwe, D., Schulz, M., Vlachogianni, T., Press, M., Blidberg, E., Walvoort, D. (2020) A European Threshold Value and Assessment Method for Macro Litter on Coastlines. EUR 30347 EN, Publications Office of the European Union, Luxembourg, ISBN 978-92-76-21444-1, doi: 10.2760/54369 , JRC121707. https://ec.europa.eu/jrc/en/publication/european-threshold-value-and-assessment-method-macro-littercoastlines
Schäfer, E., Scheele, U. Papenjohann, M. (2019) Identifying sources of marine litter: Application of the Matrix Scoring Technique to the German North Sea region. Report on behalf of Lower Saxony Water Management, Coast Defence and Nature Conservation Agency (NLWKN) and Schleswig-Holstein Agency for Coastal Defence, National Park and Marine Conservation (LKN.SH).
Schöneich-Argent, R. and Freund, H. (2020) Trashing our own “backyard” – Investigating dispersal and accumulation of floating litter from coastal, riverine, and offshore sources in the German Bight using a citizen science-based wooden drifter recapture approach. Marine Environmental Research, 162, p.105115.
Schulz, M., van Loon, W., Fleet, D. M., Baggelaar, P., & van der Meulen, E. (2017). OSPAR standard method and software for statistical analysis of beach litter data. Marine pollution bulletin, 122(1-2), 166-175. https://www.sciencedirect.com/science/article/pii/S0025326X17305246
Schulz, M., Walvoort, D. J., Barry, J., Fleet, D. M., & van Loon, W. M. (2019). Baseline and power analyses for the assessment of beach litter reductions in the European OSPAR region. Environmental Pollution, 248, 555-564. https://www.sciencedirect.com/science/article/pii/S0269749118350565
MSFD Technical Group on Marine Litter (2013). Guidance on Monitoring of Marine Litter in European Seas. EUR 26113 EN – Joint Research Centre – Institute for Environment and Sustainability. https://mcc.jrc.ec.europa.eu/main/dev.py?N=41&O=439
MSFD Technical Group on Marine Litter. Online Photo Catalogue of the Joint List of Litter Categories. https://mcc.jrc.ec.europa.eu/main/photocatalogue.py?N=41&O=457&cat=all
Tudor, D. and Williams, A. (2004) Development of a ‘Matrix Scoring Technique’ to determine litter sources at a Bristol Channel beach. Journal of Coastal Conservation, 10(1), pp.119-127.
Van Belle, G., & Hughes, J. P. (1984). Nonparametric tests for trend in water quality. Water resources research, 20(1), 127-136. https://agupubs.onlinelibrary.wiley.com/doi/abs/10.1029/WR020i001p00127
Veiga, J.M., Fleet, D., Kinsey, S., Nilsson, P., Vlachogianni, T., Werner, S., Galgani, F., Thompson, R.C., Dagevos, J., Gago, J., Sobral, P. and Cronin, R.; 2016; Identifying Sources of Marine Litter. MSFD GES TG Marine Litter Thematic Report; JRC Technical Report; EUR 28309; doi: 10.2788/018068 . https://mcc.jrc.ec.europa.eu/main/dev.py?N=41&O=436
Walvoort, D. and van Loon, W. (2021). litteR software for statistical analysis of litter data. https://cran.r-project.org/web/packages/litteR/index.html
Footnotes
1 The median value is the centre value found in the middle of a set of numbers sorted from low to high value. The median is better suited as the centre value for skewed distributions such as beach litter data, since it is not affected by extreme values. The mean value is the arithmetic average of a set of numbers and is strongly influenced by extreme values (outliers). Therefore the mean (average) is not robust for the assessment of beach litter data.
Contributors
Lead authors: Camille Lacroix and Silvère André
Supporting authors: Willem van Loon
Supported by: OSPAR Beach litter expert group, EIHA and the OSPAR Secretariat
Citation
Lacroix, C., André, S., and van Loon, W. 2022. Abundance, Composition and Trends of Beach Litter. In: OSPAR, 2023: The 2023 Quality Status Report for the North-East Atlantic. OSPAR Commission, London.
| Assessment type | Indicator Assessment |
|---|---|
| Summary Results | https://odims.ospar.org/en/submissions/ospar_beach_litter_msfd_2022_06/ |
| SDG Indicator | 14.1 By 2025, prevent and significantly reduce marine pollution of all kinds, in particular from land-based activities, including marine debris and nutrient pollution |
| Thematic Activity | Human Activities |
| Relevant OSPAR Documentation | OSPAR Agreement 2020-02 - CEMP Guidelines for marine monitoring and assessment of beach litter |
| Date of publication | 2022-06-30 |
| Linkage | https://cran.r-project.org/web/packages/litteR/index.html |
| Conditions applying to access and use | https://odims.ospar.org/en/data_policy/ |
| Data Source | https://beachlitter.ospar.org/ |
| Conditions applying to access and use | https://oap.ospar.org/en/data-policy/ |
| Data Snapshot | https://odims.ospar.org/en/submissions/ospar_beach_litter_data_snapshot_2022_06/ |
| Data Results | https://odims.ospar.org/en/submissions/ospar_beach_litter_data_results_2022_06/ |
| Data Source | https://beachlitter.ospar.org/ |