

Inputs of Nutrients to the OSPAR Maritime Area
Background
OSPAR’s strategic objective regarding eutrophication is to tackle eutrophication, through limiting inputs of nutrients and organic matter to levels that do not give rise to adverse effects on the marine environment. The procedure to assess progress towards this objective takes into account the causes, and direct and indirect effects of eutrophication. Enriching the sea with nutrients can lead to eutrophication problems if this results in undesirable disturbances such as excessive growth of phytoplankton (algae), causing oxygen depletion in bottom waters leading to behavioural changes or even death of fish and other species. Elevated nutrient concentrations are thus an important indicator of where eutrophication might occur.
Nutrients, such as nitrogen and phosphorous, enter the marine environment from the atmosphere, rivers, land runoff, or by direct discharges into the sea. Human activities can result in large quantities of nutrients entering the sea (Figure 1 and Figure 2). Data from long-term monitoring help scientists to quantify the effects of human activities and evaluate the success of measures taken to reduce nutrient inputs. One of the main directions in the OSPAR Eutrophication Strategy 2010-2020 was to cooperate to set appropriate nutrient reduction targets for problem areas with regard to eutrophication.
Nutrient emissions are regulated through OSPAR Recommendations and several EU Directives. Atmospheric emissions are also regulated through the UNECE Convention on Long-range Transboundary Air Pollution.
This assessment describes inputs of the nutrients, nitrogen and phosphorus to OSPAR Regions I – IV, and to the OSPAR Maritime Area. OSPAR Region V, the Wider Atlantic, has little in the way of land-based sources and most atmospheric inputs originate beyond the boundaries of the OSPAR Maritime Area.

Figure 1: Exhaust emissions, including from shipping, are a significant source of atmospheric nitrogen deposition at sea. © https://www.shutterstock.com

Figure 2: Open cage fish farms are a source of nutrients to the surrounding waters. © https://www.shutterstock.com
Eutrophication is the result of excessive enrichment of water with nutrients. This may cause accelerated growth of algae and / or higher forms of plant life ( Commission Decision 2017/848 ). This may result in an undesirable disturbance to the balance of organisms present and thus to the overall water quality. Undesirable disturbances can include shifts in the composition and extent of flora and fauna and the depletion of oxygen due to decomposition of accumulated biomass. Such disturbances then have other effects, such as changes in habitats and biodiversity, blooms of nuisance algae or macroalgae, decrease in water clarity and behavioural changes or even death of fish and other species. Identifying causal links between these disturbances and nutrient enrichment can be complicated by other pressures. Cumulative effects, including climate change, may have similar effects on biological communities and dissolved oxygen, further complicating efforts to demonstrate causal links.
The OSPAR Commission’s strategic objective, with regard to eutrophication, is to tackle eutrophication, through limiting inputs of nutrients and organic matter to levels that do not give rise to adverse effects on the marine environment; (OSPAR, 2021). The OSPAR Eutrophication Strategy 2010-2020 required assessment of eutrophication to be based on the ecological consequences of nutrient enrichment and not just on nutrient enrichment alone, i.e., finding reliable evidence for accelerated growth of algae and / or macrophytes caused by anthropogenic nutrient enrichment, leading to undesirable disturbance. Eutrophication is diagnosed using OSPAR’s harmonised criteria of nutrient inputs, concentrations and ratios, chlorophyll-a concentrations, phytoplankton indicator species, macrophytes, dissolved oxygen levels, incidence of fish kills and changes in zoobenthos (OSPAR, 2022). As there is no single indicator of disturbance caused by marine eutrophication, OSPAR applies a multi-step method using the harmonised criteria (OSPAR, 2022). Eutrophication is considered to have occurred if there is evidence for all of the stages shown in Figure a, and of causal links between them (ECJ, 2009).
For OSPAR’s Quality Status Report 2023, four harmonised criteria have been assessed at a regional scale: nutrient inputs, nutrient concentrations , chlorophyll-a concentrations and dissolved oxygen levels. These are highlighted in Figure a. The individual assessment results of any one of these five common indicators do not diagnose eutrophication by themselves. However, the assessments provide useful information about trends and are important for informing management measures.
")
Figure a: Generic conceptual framework to assess eutrophication in all categories of surface waters illustrating the main cause/effect linkages (OSPAR, 2022)
The criteria marked ² are not relevant in all countries’ waters. The common indicator assessed here (inputs of nutrients) is outlined in red

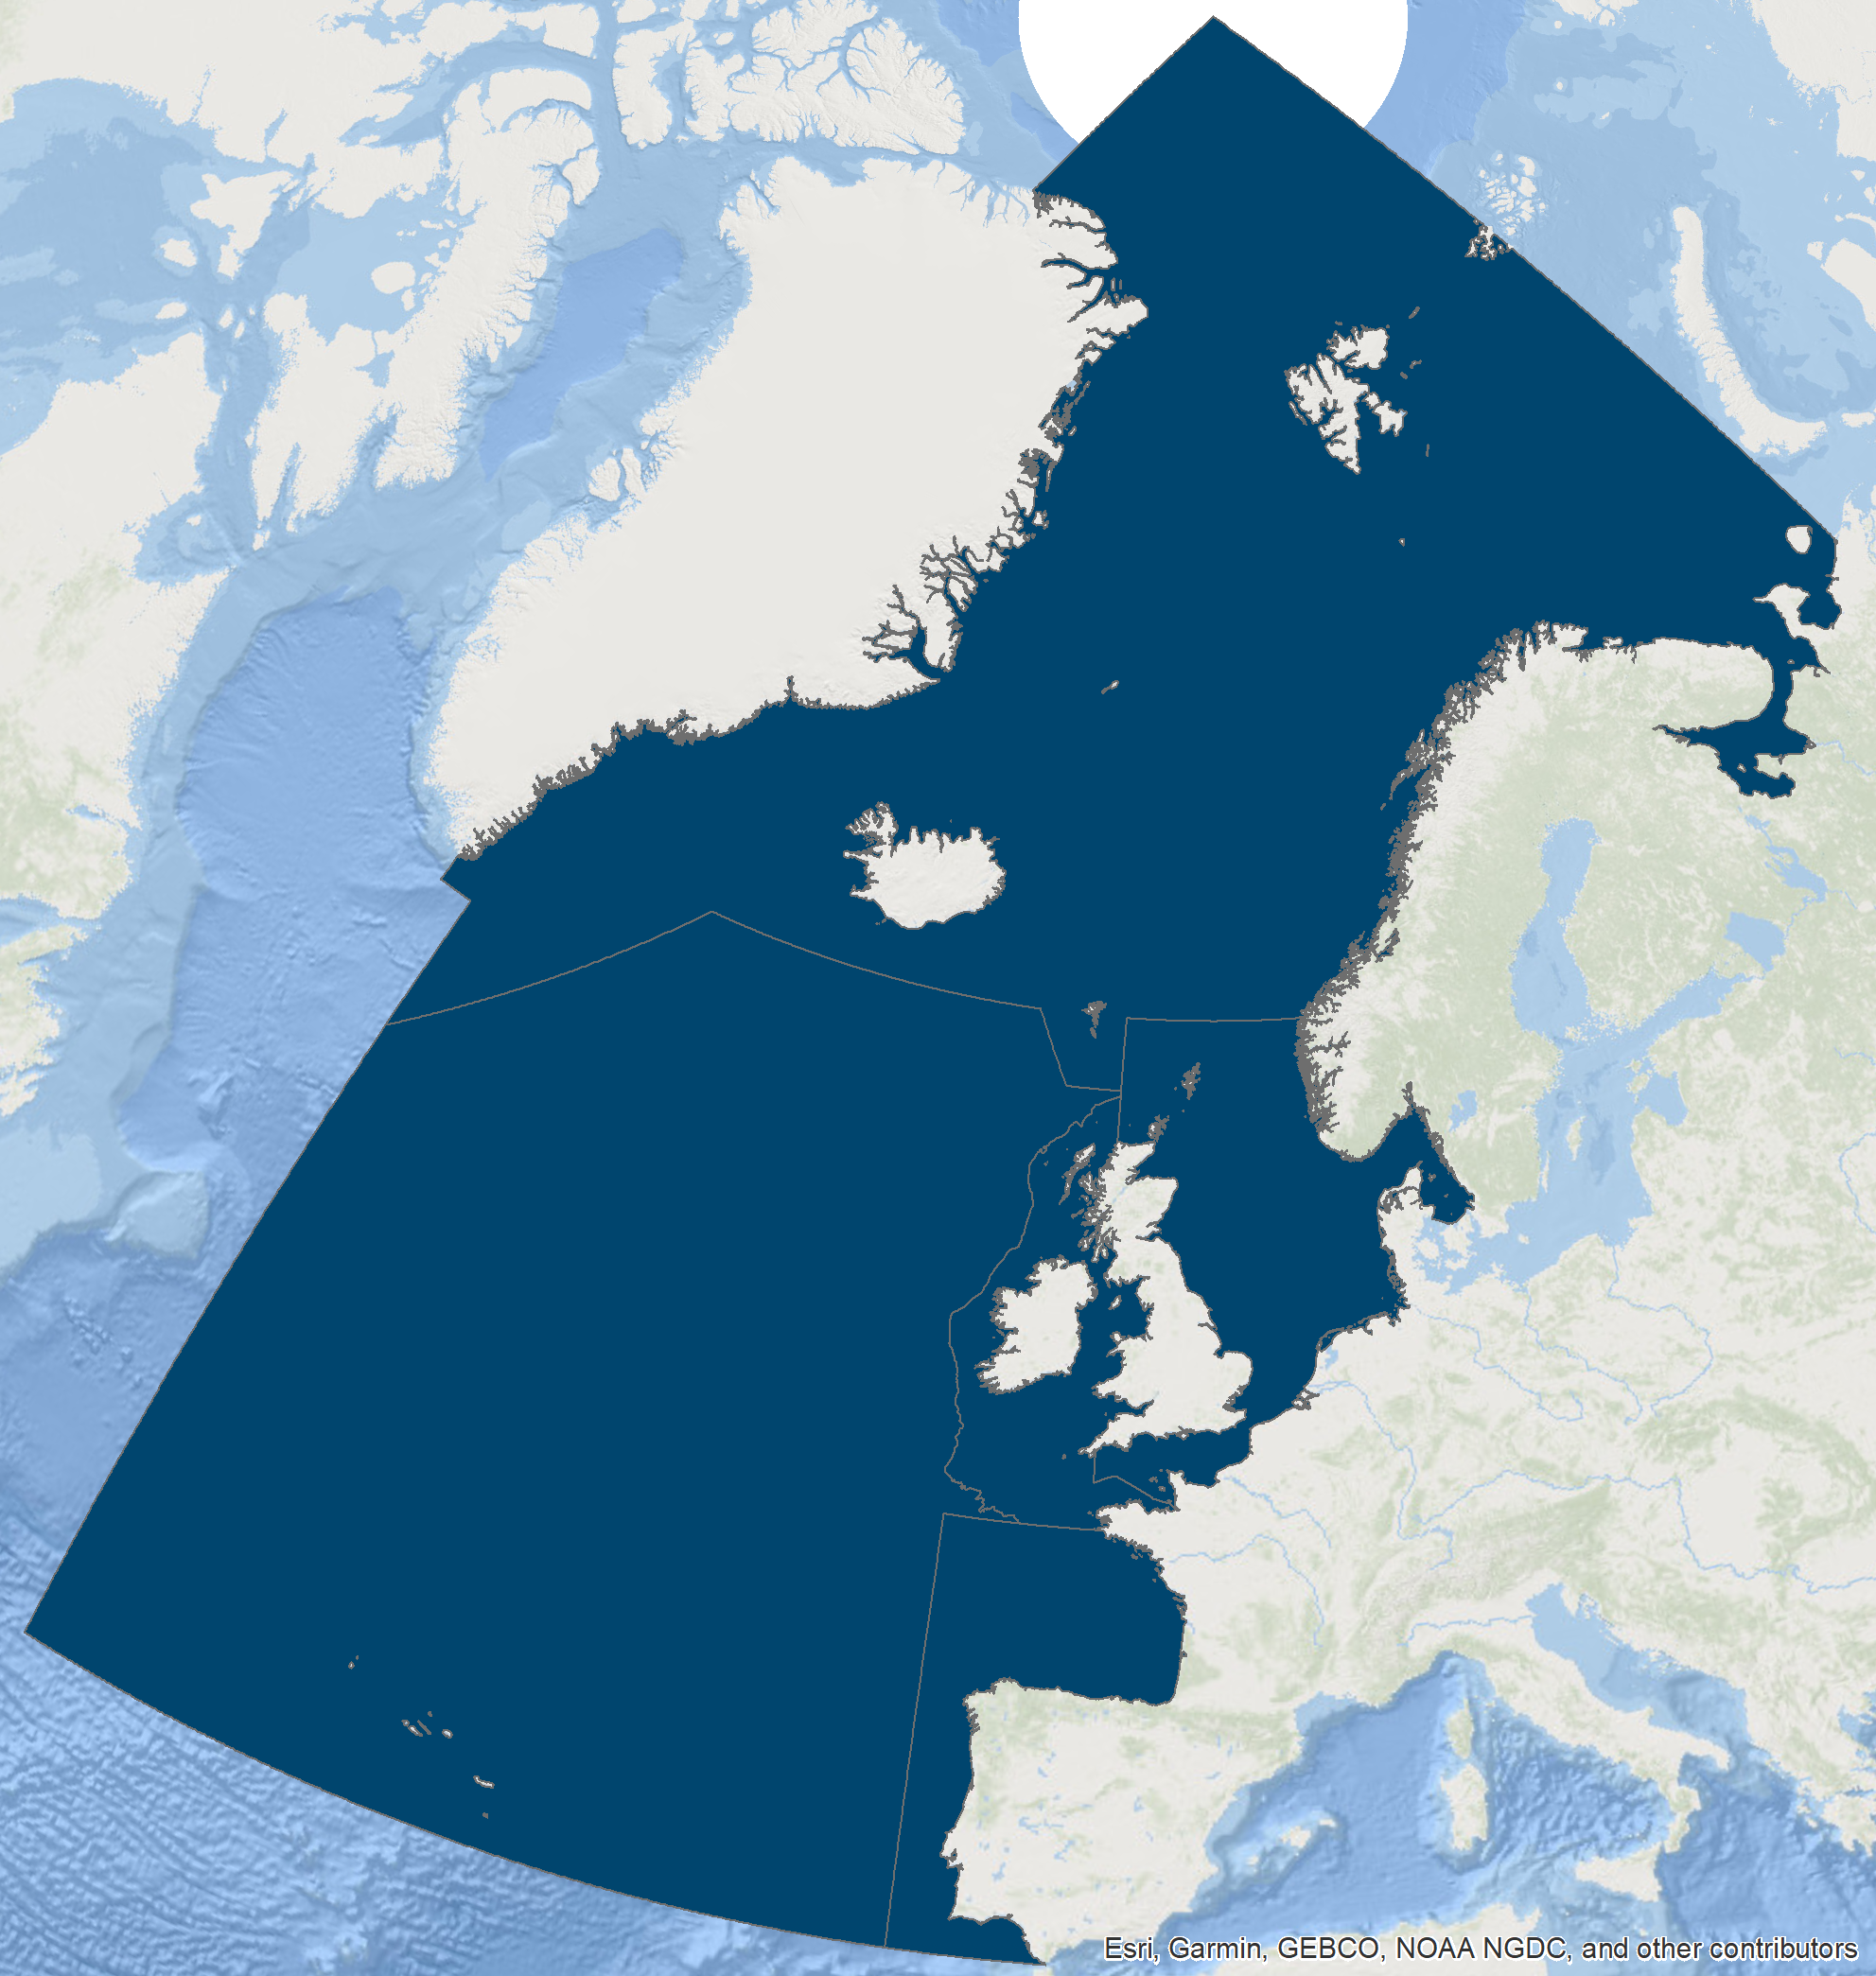
Figure b: Riverine catchment areas supplying nutrients to the OSPAR Maritime Area
This assessment describes inputs of the nutrients nitrogen (via air and water) and phosphorus (via water) to the OSPAR Maritime Area, and in particular to the four land-adjacent OSPAR Regions, Arctic Waters, Greater North Sea, Celtic Seas, and Bay of Biscay and Iberian Coast. Data on waterborne total nitrogen and total phosphorus inputs are collected by the OSPAR countries. Inputs from atmospheric nitrogen deposition are calculated from the sum of oxidised and reduced, wet and dry nitrogen deposition, which has been provided from modelling by the European Monitoring and Evaluation Programme (EMEP) under the UNECE Convention on Long-Range Transboundary Air Pollution (CLRTAP, Gauss et al., 2022). There is no general modelling of atmospheric phosphorus deposition, as it is seen as a background source, mainly from natural background sources. In this assessment atmospheric phosphorus deposition is not included.
Waterborne inputs enter the OSPAR Maritime Area (Figure b) from rivers, point sources (such as factories, fish farms and water treatment plants discharging directly into estuaries or the sea), and direct deposition from the air. Data on inputs via rivers are from monitoring sites, or are estimated or modelled for unmonitored catchments.
The aim of the assessment is to show changes in nutrient inputs from 1990 to the present, using the most accurate and complete data.
The assessment has been expanded since the Intermediate Assessment of 2017 to cover all four OSPAR Regions for which data exist. These are Arctic Waters, Greater North Sea, Celtic Seas, and Bay of Biscay and Iberian Coast.
OSPAR’s Eutrophication Strategy 2010-2020 built on long-standing commitments from countries to reduce inputs of nutrients to eutrophication problem areas (OSPAR, 2021). Countries that are likely to contribute nutrient inputs to eutrophication problem areas are committed to reducing inputs to those areas by 50% relative to inputs in 1985, pending new nutrient reduction targets (OSPAR, 2010).
Data sources:
Data sources include riverine, atmospheric and direct inputs. Data are held in the OSPAR programme (OSPAR, 2014) database by the data-host. Data originate from national reporting of monitoring commitments under OSPAR’s Riverine Inputs and Direct Discharges Monitoring Programme (RID) and cover riverine inputs (monitored), estimated / modelled inputs from unmonitored catchments and diffuse sources, and point source inputs (industry, sewage treatment plants, fish farming and urban runoff). The earliest data are from 1989 and the time series extends to 2019. Reporting for some countries began after 1989 and this limits the amount of data available for analysis. Complete reporting for the Bay of Biscay and Iberian Coast did not begin until 1997.
Riverine data are supplemented by atmospheric deposition data provided by EMEP (European Monitoring and Evaluation Programme). EMEP data in this case are from numerical model analyses of nitrogen emissions, which are reported by countries to the UNECE Convention on Long-range Transboundary Air Pollution. All OSPAR countries are also members of EMEP. The EMEP numerical model uses modelled meteorological fields to estimate the spread and deposition of these substances from source to sink, including atmospheric chemical processes. This assessment uses only direct deposition to the sea surface: atmospheric deposition onto land can reach the sea but would be picked up by the RID. A detailed description of the EMEP Nitrogen and Sulphur Model, including the source code, can be found at EMEP . EMEP results come from Klein et al., 2021. Data are available from 1990.
Data aggregation and analysis
OSPAR monitoring of riverine inputs occurs at the mouths of larger rivers. The exact minimum size varies from Contracting Party to Contracting Party. Inputs from areas between the river mouths – so called “unmonitored areas” - are determined using a harmonised modelling framework (the HARP-NUT guidelines) as are direct discharges. The results are aggregated geographically into larger and larger catchments up to a national total. As well as the annual nutrient inputs, the annual water flow is also reported allowing flow normalisation of the riverine inputs. This flow normalisation makes use of the relationship between water flow and inputs to remove the variability caused by wet and dry years. In this assessment, the HELCOM flow normalisation approach (HELCOM, 2019) has been implemented. Riverine nutrient inputs were flow normalised at the smallest geographical scale possible before aggregating to national totals to each region. The flow normalisation increased the confidence in trend analyses and improved data quality as spurious results were easier to identify, giving Contracting Parties the opportunity to re-report data where necessary.
Atmospheric nutrient inputs cannot be flow normalised in the same way. However, Bartnicki et al., (HELCOM, 2019) developed a method of weather normalisation where the spreading and deposition of each year’s emitted nitrogen is modelled using representative meteorological years. This results in a range of possible depositions for each year’s emissions. The median deposition is considered to be the “weather normalised” deposition and is also presented here.
Results
Inputs of nutrients to the OSPAR Maritime Area as a whole have decreased significantly since the start of monitoring in 1990. Nitrogen inputs have decreased by about 44 kilotonnes (kt) every year (1 350 kt since 1990), while phosphorus inputs have decreased by 2,4 kt each year (70 kt since 1990). By removing inter-annual variability through flow normalisation, it is possible to detect significant – though smaller - decreases since the last QSR of about 28 kt nitrogen per year and 1,6 kt phosphorus. In 2019, the OSPAR Regions received approximately 2 900 kt of nitrogen via air and water and approximately 70 tonnes of waterborne phosphorus. Excluding the atmospheric nitrogen component from the analysis shows nitrogen inputs decreasing by only 6 kt per year with no significant trend apparent in the last 10 years even after flow normalisation. This indicates the importance of air quality improvements – reducing combustion for energy generation, heating, and transport as well as ammonium emissions from livestock - in reducing nitrogen inputs to the wider Maritime Area.
OSPAR Region I, Arctic Waters, has seen substantial increases in waterborne inputs. Total nitrogen loads have increased from 30 kt per year in 1990 to more than 80 kt in 2019. Similarly, total phosphorus inputs have increased from 2 to 9 kt per year. This increase is due to direct discharges – mainly from aquaculture - rather than changes in land use. These figures are likely to be an underestimate as not all Arctic Contracting Parties have reported their direct discharges from aquaculture. Despite this, the total change in nitrogen inputs to the Arctic shows a decrease of about 4 – 8 kt per year due to the reduction in atmospheric deposition. Thus, nutrient inputs to the coastal Arctic have increased substantially, while the offshore Arctic has experienced reduced nitrogen inputs.
Nutrient inputs to Region II, the Greater North Sea continue to decline from both waterborne and atmospheric sources. The total nitrogen loads decrease by almost 20 kt per year although this rate reduces to 13 kt when the atmospheric contribution is removed. This component is particularly important as it comprises only bioavailable, inorganic nitrogen and is delivered directly to the sea surface. Total nitrogen inputs are almost two-thirds of what they were in 1990. Total phosphorus inputs are around a third of the 1990 value, having reduced from almost 90 kt in 1990 to just over 30 kt in 2019.
Total nitrogen inputs to the Celtic Seas have also decreased by about a third over the period 1990 to 2018. Extreme weather events in 2015 and 2019 resulted in the same nitrogen inputs as at the start of the time series. These events were so extreme that normalisation was unable to fully remove this variation from the time series.
There is good confidence in the data used and good confidence in the methodology. Some methodology changes are detectable in the time series but are not sufficiently large to alter the overall picture.

Figure 3: Nutrients, such as nitrogen and phosphorous, enter the marine environment from the atmosphere, rivers, land runoff, or by direct discharges into the sea © Lucy Ritchie
Nutrient inputs to the OSPAR Maritime Area (Figure c, Figure d, Figure e, Figure f, Figure g, Figure h, Figure i, Figure j, Figure k, Figure l and Figure m) have decreased significantly since 1990. Reduced emissions of nitrogen to air have led to a reduction of almost 600 kt in annual atmospheric nitrogen deposition. The greatest reductions occur in the Arctic and Greater North Sea. The reduction in atmospheric nitrogen inputs to Region I is sufficient to turn 1,3 - 1,7 kt / year increase in waterborne nitrogen inputs into a 4 kt / year decrease in total nitrogen inputs (Table a and Table b).
Figure c: Total Nitrogen loads to the OSPAR Maritime Area.
Figure c, Figure d, Figure e, Figure f and Figure g show combined normalized airborne and waterborne nitrogen inputs to the OSPAR Maritime Area, Arctic Ocean, Greater North Sea, Celtic Seas and Bay of Biscay and Iberian Coast respectively, showing countries of origin. Missing data are replaced by a mean value based on data reported from that country for the period 1990–2019. The dashed line indicates a statistically significant trend (p<0,05; calculated with Scipy.Stats.Kendalltau). Atmospheric deposition for 1990 – 1994 represents actual, not normalised deposition.
Figure d: Total Nitrogen loads to the Arctic Ocean
Figure e: Total Nitrogen loads to the Greater North Sea
Figure f: Total Nitrogen loads to the Celtic Seas
Figure g: Total Nitrogen loads to the Bay of Biscay and Iberian Coast
Figure h: Total Nitrogen loads to the Arctic Ocean
As Figure d, but only showing waterborne total nitrogen inputs to Arctic Waters. The dashed line indicates a statistically significant trend (p<0.05; calculated with Scipy.Stats.Kendalltau). Atmospheric deposition not shown.
Figure i: Total Phosphorus loads to the OSPAR Maritime Area
Figure i, Figure j, Figure k, Figure l, Figure m show normalized waterborne phosphorus inputs to the OSPAR Maritime Area, Arctic Ocean, Greater North Sea, Celtic Seas and Bay of Biscay and Iberian Coast respectively, showing countries of origin. Missing data are replaced by a mean value based on data reported from that country for the period 1990–2019. The dashed line indicates a statistically significant trend (p<0,05; calculated with Scipy.Stats.Kendalltau). Atmospheric phosphorus deposition is considered a natural process and is not monitored.
Figure j: Total Phosphorus loads to the Arctic Ocean
Figure k: Total Phosphorus loads to the Greater North Sea
Figure l: Total Phosphorus loads to the Celtic Seas
Figure m: Total Phosphorus loads to the Bay of Biscay and Iberian Coast
| Nitrogen | Phosphorus | |||
|---|---|---|---|---|
| Atmospheric + Waterborne | Waterborne | Waterborne | ||
| I - IV | Combined | -45 | -5,9 | -2,4 |
| I | Arctic Waters | -4,1 | +1,7 | +0,3 |
| II | Greater North Sea | -19 | -8,8 | -1,7 |
| III | Celtic Seas | -5,7 | -2,5 | -0,5 |
| IV | Iberian Coast and Bay of Biscay | - | - | -0,4 |
| Nitrogen | Phosphorus | |||
|---|---|---|---|---|
| Atmospheric + Waterborne | Waterborne | Waterborne | ||
| I - IV | Combined | -28 | - | -1,5 |
| I | Arctic Waters | -2,2 | +1,3 | +0,2 |
| II | Greater North Sea | -21 | -13 | -1,9 |
| III | Celtic Seas | - | - | - |
| IV | Iberian Coast and Bay of Biscay | -7,5 | -6,2 | - |
Since 1990, phosphorus inputs to the Greater North Sea have decreased by almost two-thirds, from about 90 kt/y to just over 30 kt/yr. The greatest changes occurred between about 2000 and 2005, although further significant input reductions have occurred since the last QSR in 2010. A similar, 50% reduction is visible in the Celtic Seas data and in the total phosphorus loads to Regions I to IV combined, suggesting that collectively the 50% emission reduction agreed in PARCOM Recommendation 88/2 may have been achieved, at least for phosphorus.
Riverine inputs to the Bay of Biscay and Iberian Coast are strongly affected by regional flood events. Furthermore, the time series of available data is shorter than for the Greater North Sea and recent reporting is less complete, making it difficult to draw conclusions on trends. However, phosphorus inputs between 1997 and 1999 were typically about 20 kt/y, while phosphorus inputs of about 13 kt/y are now found. Analyses show a statistically significant downward trend in phosphorus inputs to the Bay of Biscay and Iberian Coast, but not for nitrogen.
In the Greater North Sea, the proportionally greater reduction in phosphorus input compared to nitrogen input (Figure n) leads to an overall change in the relative amounts of molar nitrogen and phosphorus in the inflowing freshwater. Changes in the molar ratio can have ecosystem effects such as altering the phytoplankton community composition. Such changes in nutrient limitation have been observed in the North Sea (Burson et al., 2016). Similar changes occur in the Celtic Seas and in the Bay of Biscay and Iberian Coast, from around 40 (1997) to about 60 (2019). Estimates of atmospheric phosphorus inputs assume that it is a natural process rather than caused by human activities. A deposition rate of 5 kg P / km2 / yr (as used by HELCOM, 2015) increases phosphorus loading to Regions II, III and IV by 10 – 20%, so does not significantly affect the changes in molar ratio in these regions. In Region I (Arctic Waters) this estimate of atmospheric phosphorus inputs is about three times greater than the waterborne input to Region I, and is enough to suggest primary production is nitrogen limited, as reported by recent studies (e.g., Mills et al., 2018)
Area-specific nutrient inputs indicate the intensity of nutrient losses from the catchment and are reported as mass of nutrients per unit area of catchment. Highest area-specific waterborne inputs of nitrogen and phosphorus come from the Celtic Seas’ catchment, followed closely by the Greater North Sea. The area-specific nitrogen inputs to the Bay of Biscay and Iberian Coast (Table c and Figure g) are about 70% of those to the Greater North Sea, while the area-specific phosphorus inputs are about half of those in the Celtic and North Seas. This probably reflects the different climates across the two regions but may also reflect differences in agriculture and other nutrient management measures. Lowest area specific inputs are found in the Arctic regions.

Figure n: Changes in the relative amounts of nitrogen and phosphorus entering the four OSPAR Regions. Upper plot shows only the relative waterborne inputs, with positive trends indicating increasing phosphorus limitation except in the Arctic, as measures in the catchment reduce phosphorus inputs more effectively than nitrogen
| Catchment area (thousand km²) | Annual mean area-specific waterborne inputs (tonnes/km²) | ||
|---|---|---|---|
| Nitrogen | Phosporus | ||
| Arctic Waters | 292 | 0,18 | 0,02 |
| Greater North Sea (1990-2019) | 959 | 1,04 | 0,06 |
| Celtic Seas | 176 | 1,23 | 0,07 |
| Bay of Biscay and Iberian Coast (1997-2019) | 658 | 0,70 | 0,03 |
Data reporting in the Bay of Biscay and Iberian Coast has been intermittent. Spanish data are unavailable prior to 1997 while data reporting from Portugal has been intermittent in recent years. Missing data from individual rivers have been replaced by mean values when calculating the national inputs, which may explain the difficulty in detecting significant trends for this Region. The extreme variability of nutrient inputs in this region shows the importance of having a complete dataset if trends, flow normalisation and the impacts of measures are to be determined. Particularly high nitrogen inputs occurred in 1994, 1995 and 2002, associated with central European flood events (Engel, 1997; Förster, 2008). Extreme nitrogen inputs occurred from UK rivers to the Celtic Seas in 2015 and 2019, without corresponding high phosphorus inputs, which raise suspicions about data quality and prevent the determination of significant trends in the recent data.
Flow normalisation allows significant trends to be detected even in the most recent 10 years of data in many regions. The method is dependent on having full data reporting (flow and inputs) for the individual rivers. By reducing the variability associated with weather, trends due to measures in the catchments become detectable. However, some changes appear to be due to methodological changes by Contracting Parties (e.g., the increase in nitrogen inputs from France to the Greater North Sea between 2006 and 2007).
Conclusion
Inputs of nitrogen and phosphorus to the four continental-adjacent OSPAR Regions taken altogether have decreased substantially since OSPAR monitoring started in 1990. This good news is tempered by significantly increasing waterborne nutrient inputs to Region I (Arctic Waters). This increase is likely an underestimate as not all Contracting Parties in the Region report inputs from aquaculture.
Flow normalisation reduces weather-dependent variability in data and allows the effects of measures and other changes to be detected. Significant trends in phosphorus inputs were detectable in all four Regions for the period 1990 to 2019 and in two Regions (and the combined input) for the period since the last QSR. Trends in nitrogen inputs were detectable in all areas except for Region IV (Bay of Biscay and Iberian Coast) for the period 1990 to 2019 although this Region shows a significant decreasing trend since the last QSR.
Reductions in total nitrogen inputs are due in large part to reductions in atmospheric emissions2. The reduction rate in the total input is more than twice the reduction rate of the waterborne inputs alone for the whole period. The relatively greater success in reducing phosphorus compared to nitrogen may increase phosphorus limitation in coastal waters.
OSPAR countries have agreed three Recommendations to reduce nutrient inputs to the OSPAR Maritime Area. Under PARCOM Recommendation 88/2 (1988) coastal states around the Greater North Sea agreed to reduce nutrient inputs by 50% relative to the 1985 levels. PARCOM Recommendations 89/2 (PARCOM, 1989) and 92/7 (PARCOM, 1992) identified measures necessary to reduce inputs, which have since been incorporated and in several cases augmented by European Union Directives covering for example wastewater treatment, nitrates in agriculture, industrial emissions and water and marine management. Furthermore, atmospheric emissions are regulated through the Gothenburg Protocol of the United Nations Economic Commission for Europe (UNECE) Convention on Long-range Transboundary Air Pollution, which is implemented by EU Member States through the National Emissions Ceilings Directive (2016/2284/EU)3.
The result of these measures is a clear reduction in nutrient inputs to OSPAR Regions, with the exception of phosphorus inputs to Region I.
Knowledge Gaps
OSPAR Contracting Parties lack knowledge of the critical nutrient inputs required to eliminate eutrophication from the OSPAR Maritime Area and to avoid eutrophication occurring in the future. This knowledge gap is being addressed urgently under the North-East Atlantic Environment Strategy.
Inputs of Nutrients assessment is based on a combination of observations, statistical analyses, and dynamic numerical models. Observations of river flow and chemical concentration could be improved by increasing measurement frequency, particularly under high flow conditions. Assessing nutrient inputs from unmonitored areas is dependent on high quality reporting from industry and agriculture and modelling tools adapted to local conditions. Atmospheric input estimates and pathways are sensitive to model resolution and could be improved, for example by data assimilation and more detailed emissions data. Atmospheric phosphorus deposition is effectively unknown, with no observations over the sea, few observations over land and no operational modelling.
OSPAR Contracting Parties aim to measure 90% of riverine inputs from their territories. This is achieved through gauging stations to measure discharge with frequent water sampling throughout the year, ideally focused on periods of high flow. The remaining 10% of inputs originate from ‘unmonitored’ areas downstream of and in between these gauging stations. Estimates of this 10% come from modelling. Discharges from point sources (such as industry and water treatment works) are then added through national and European reporting pathways. Despite these intentions, local conditions mean that not all Contracting Parties are able to measure 90% of riverine inputs and rely on modelled estimates for a larger proportion of their data reporting.
Monitoring and modelling guidelines are well established within OSPAR, and consistent monitoring data exists for most countries since 1989. However, identifying periods of high flow and then monitoring before they decline is not always possible and this can result in the estimates from individual rivers being less accurate than desired. This is particularly relevant because extreme weather events with periods of high flow could become more frequent in the future under continued warming. OSPAR’s RID monitoring programme involves compromises between monitoring cost and data coverage. Further sensor development should enable more frequent observations which will reduce uncertainty in input estimates. More frequent observations would improve estimates of the effectiveness of measures and through this knowledge the cost-effectiveness of future Programmes of Measures.
Atmospheric data rely on emissions data reported under the UNECE Convention on Long-range Transboundary Air Pollution and the European Union Industrial Emissions Directive (2010/75/EU)4. While the European Monitoring and Evaluation Programme (EMEP) model is validated against observed deposition, accurate reporting of emissions from all sectors is necessary. Analysing atmospheric nitrogen deposition per country could help identify where to target nitrogen reduction measures.
Bartnicki, J., A. Gusev, W. Aas, M. Gauss, J. E. Jonson. 2017. Atmospheric Supply of Nitrogen, Cadmium, Mercury, Lead, and PCDD/Fs to the Baltic Sea in 2015, EMEP MSC-W Technical report 2/2017. Available at: http://emep.int/publ/helcom/2017/
Burson, Am, A, Stomp, Maayke, Akil, Larissa, Brussaard, Corina P. D. y Huisman, Jef. 2016, "Unbalanced reduction of nutrient loads has created an offshore gradient from phosphorus to nitrogen limitation in the North Sea". Limnology and Oceanography. p. 869-888
Engel, H. 1997. Destructive Water: Water-Caused Natural Disasters, their Abatement and Control (ed. A J Askew, G H Leavesley, H F Lins, F Nobilis, R S Parker, V R Schneider & F M van de Ven, Proceedings of the Conference held at Anaheim, California, June 1996). IAHS Publ. no. 239. Available at: http://hydrologie.org/redbooks/a239/iahs_239_0021.pdf
ECJ 2009. European Court of Justice Judgment of the Court (Third Chamber) of 10 December 2009. European Commission v United Kingdom of Great Britain and Northern Ireland. Failure of a Member State to fulfil obligations – Environment – Directive 91/271/EEC – Urban waste water treatment - Article 3(1) and (2), Article 5(1) to (3) and (5) and Annexes I and II – Initial failure to identify sensitive areas – Concept of ‘eutrophication’ – Criteria – Burden of proof – Relevant date when considering the evidence – Implementation of collection obligations – Implementation of more stringent treatment of discharges into sensitive areas. Case C-390/07 European Court Reports 2009 I-00214;
Förster S. 2008. An analysis of hydraulic, environmental and economic impacts of flood polder management at the Elbe River. Universität Potsdam Doctoral Thesis. Available at: https://publishup.uni-potsdam.de/opus4-ubp/frontdoor/index/index/docId/2539
Gauss, M and Klein, H. 2022. EMEP MSC-W - Nitrogen Depositions to the OSPAR Maritime Area in the period 1995-2019. Available at: https://oap.ospar.org/en/ospar-assessments/quality-status-reports/qsr-2023/other-assessments/atmos-deposition-n-emep-w
Klein, H, Gauss, M, Nyiri, A, Tsyro, S and Fagerli, H .2021. MSC-W Data Note 1/2021 Individual Country Reports: Transboundary air pollution by sulphur, nitrogen, ozone and particulate matter in 2019. Available at: https://www.emep.int/mscw/index.html
HELCOM, 2015. Updated Fifth Baltic Sea pollution load compilation (PLC-5.5). Baltic Sea Environment Proceedings No. 145. Available at: https://helcom.fi/wp-content/uploads/2019/08/BSEP145_Highres.pdf
HELCOM, 2019, HELCOM Guidelines for the annual and periodical compilation and reporting of waterborne pollution inputs to the Baltic Sea (PLC-Water). Available at: https://helcom.fi/wp-content/uploads/2019/08/PLC-Water-Guidelines-2019.pdf
Mills, Matthew M., Brown, Zachary W., Laney, Samuel R., Ortega-Retuerta, Eva., Lowry, Kate E., Arrigo, Kevin R., "Nitrogen Limitation of the Summer Phytoplankton and Heterotrophic Prokaryote Communities in the Chukchi Sea". Frontiers in Marine Science. 2018, vol 5.
OSPAR Agreement 2010-03 The North-East Atlantic Environment Strategy. Strategy of the OSPAR Commission for the Protection of the Marine Environment of the North-East Atlantic 2010–2020. Available at: https://www.ospar.org/convention/agreements
OSPAR Agreement 2013-08 Common Procedure for the Identification of the Eutrophication Status of the OSPAR Maritime Area. Available at: https://www.ospar.org/convention/agreements
OSPAR Agreement 2014-04 Riverine Inputs and Direct Discharges Monitoring Programme (RID) applicable from 1 January 2015. Available at: https://www.ospar.org/convention/agreements
OSPAR Agreement 2016-01 OSPAR Coordinated Environmental Monitoring Programme (CEMP). Revised in 2017 and updated in 2020. Available at: https://www.ospar.org/convention/agreements
OSPAR Agreement 2021-01 Strategy of the OSPAR Commission for the Protection of the Marine Environment of the North-East Atlantic. Available at: https://www.ospar.org/convention/agreements
PARCOM Recommendation 1988/2 on the Reduction in Inputs of Nutrients to the Paris Convention Area. Available at: https://www.ospar.org/convention/agreements
PARCOM Recommendation 1992/7 on the reduction of nutrient inputs from agriculture into areas where these inputs are likely, directly or indirectly, to cause pollution. Available at: https://www.ospar.org/convention/agreements
PARCOM Recommendation 1989/4 on a Coordinated Programme for the Reduction of Nutrients. Available at: https://www.ospar.org/convention/agreements
Footnotes
1 https://eur-lex.europa.eu/legal-content/EN/TXT/?uri=CELEX%3A32017D0848
2For 1990-2010 there are reduction in the waterborne inputs from many countries (both due to reduced points sources load and reduction in inputs from agriculture in at least from main part of the countries
4 https://eur-lex.europa.eu/legal-content/EN/TXT/?uri=celex%3A32010L0075
Contributors
Lead authors: Philip Axe, Lars Sonesten and Eva Skarbövik
Supporting authors: Wera Leujak and Lasse Tor Nielsen
Supported by: Working Group on Inputs to the Marine Environment, Task Group on Inputs for the QSR and Hazardous Substances and Eutrophication Committee.
Citation
Axe, P., Sonesten, L., Skarbövik, E., Leujak, W. and Nielsen, L, 2022. Inputs of Nutrients to the OSPAR Maritime Area. In OSPAR, 2023: The 2023 Quality Status Report for the North-East Atlantic. OSPAR Commission, London. Available at: https://oap.ospar.org/en/ospar-assessments/quality-status-reports/qsr-2023/indicator-assessments/inputs-nutrients/
| Assessment type | Indicator Assessment |
|---|---|
| SDG Indicator | 14.1 By 2025, prevent and significantly reduce marine pollution of all kinds, in particular from land-based activities, including marine debris and nutrient pollution |
| Thematic Activity | Eutrophication |
| Relevant OSPAR Documentation | OSPAR Agreement 2010-03 The North-East Atlantic Environment Strategy. Strategy of the OSPAR Commission for the Protection of the Marine Environment of the North-East Atlantic 2010–2020 |
| Date of publication | 2022-06-30 |
| Conditions applying to access and use | https://oap.ospar.org/en/data-policy/ |
| Data Snapshot | https://odims.ospar.org/en/submissions/ospar_inputs_nutrients_snapshot_2022_06/ |
| Data Results | https://odims.ospar.org/en/submissions/ospar_inputs_nutrients_results_2022_06/ |
| Data Source | https://www.nibio.no/en |
| Data Source | https://www.emep.int/ |