

Marine Bird Abundance
Background
Abundance (numbers of adult birds in the non-breeding season or pairs at breeding colonies) is used as an indicator because it is practical to measure, good for assessing long- term changes in community structure and because it changes slowly under natural conditions. Rapid changes in abundance can indicate human-induced impacts and, supported by species-specific assessment threshold values for the extent of decline, can serve as a prompt for management action. Rapid changes in abundance can also be used to identify potentially disruptive increases in some species that might impact on other species (ICES, 2008). For instance, large predatory seabird species have benefited from the provision of food from fishery discards.
For seabirds, this assessment is constructed mainly from data on ‘breeding abundance’. For waterbirds (mostly wildfowl and waders) this assessment is constructed mainly from data on ‘non-breeding abundance’ (numbers of birds using intertidal and inshore areas during migration or over winter). Annual estimates of breeding or non-breeding abundance of each species are compared against assessment threshold values that are designed to reflect the resilience of different species to population decline. It is desirable for the annual ‘relative abundance’ of a species to be above 0,8 (80% of the baseline) for species that lay one egg or above 0,7 (70% of the baseline) for species that lay more than one egg. If 75% or more of species assessed exceed their individual threshold values, an assemblage of bird species is considered to be healthy.
This indicator assessment has relevance to some of the seabird species included in the OSPAR List of Threatened and/or Declining Species and Habitats.
")
Northern gannet Morus bassanus (© Alan D Wilson)
")
Sanderling (© A. Downie)
Justification for the indicator
For most seabirds, abundance is assessed when they are breeding, because they are much easier to count when they aggregate on land to breed in colonies than when they are dispersed at sea over large areas. Most waterbirds are assessed using non-breeding abundance, because they are much easier to count when they aggregate in intertidal and inshore areas during migration or in winter. Waterbirds tend to be more difficult to count during the breeding season, because most species do not breed colonially, and nesting pairs are distributed over large (often very remote) areas. Many waterbird species in this assessment breed inland and in areas outside the OSPAR Maritime Area.
The threshold values used in this indicator assessment were developed for breeding seabird abundance data in order to assess the OSPAR Ecological Quality Objective (EcoQO) on seabird population trends as an index of seabird community health (ICES, 2008, 2010, 2011, 2012). This indicator supersedes the EcoQO which has been set aside. This indicator has gone through extensive testing and development (see ICES, 2013a,b,c,d, 2015). OSPAR’s Quality Status Report (QSR) 2023 indicator threshold values may be considered as equivalent to proposed European Union Marine Strategy Framework Directive (MSFD) criteria threshold values, in that they can also be used for the purposes of their MSFD obligations by those Contracting Parties that wish to do so.
Species included in the indicator assessment
This indicator includes information on marine bird species that, at some point in their annual life cycle, are reliant on coastal and / or offshore marine areas. The indicator is constructed from species-specific trends in annual abundance and includes:
- Breeding abundance: estimated from counts of adult birds or pairs on land at breeding colonies or sites, nesting close to the coast, and using the marine environment (e.g., for food); and
- Non-breeding abundance: estimated from counts of full-grown birds in intertidal areas or close to the shore and counted from land or from the air during migration or over the winter.
In this context, marine birds include the following taxonomic groups that are commonly aggregated as waterbirds and seabirds:
- Waterbirds: shorebirds Charadriiformes; ducks, geese and swans Anseriformes; divers Gaviiformes; spoonbills and ibises Pelecaniformes and grebes Podicipediformes; and
- Seabirds: petrels and shearwaters Procellariiformes; gannets and cormorants Suliformes; skuas, gulls, terns and auks Charadriiformes.
Shorebirds, some duck species, and some gulls feed on benthic invertebrates in soft intertidal sediments and on rocky shores. Geese graze on exposed eelgrass beds Zostera spp. as well as coastal marshes. Diving duck species feed on invertebrate benthos in shallow inshore waters. All other marine birds, including some gulls, spend most of their lives at sea, feeding on prey living within the water column (i.e., plankton, fish and squid) or picking detritus from the sea surface. Divers, piscivorous ducks, grebes, cormorants, most gulls and terns tend to be confined to inshore waters, whereas petrels, shearwaters, gannets, skuas and most auks venture further offshore and beyond the shelf break.
This indicator in principle has relevance for all seabird species included in the OSPAR List of threatened and/or declining species and habitats (OSPAR Agreement 2008-6) although only three species have been included in the assessment because of data availability: Brünnich’s guillemot, also known as a thick-billed murre Uria lomvia, black-legged kittiwake Rissa tridactyla and roseate tern Sterna dougallii. Furthermore, the assessment of lesser black-backed gull in the Arctic Waters (Region I) includes the threatened subspecies Larus fuscus fuscus, but due to mixed colonies (with L. f. intermedius / graellsii), the results cannot be allocated to the threatened subspecies alone.
Abundance indicators can also be constructed from time series data collected at sea / in the offshore environment; a pilot assessment of such a candidate indicator (for the Southern North Sea) is also provided in the QSR 2023: see B1 Marine Bird Abundance - non breeding birds offshore Pilot Assessment
Overview
This indicator assessment begins by constructing a time series of annual estimates of ‘relative breeding abundance’ or ‘relative non-breeding abundance’ of each species in each OSPAR Region or sub-division thereof (see section on Spatial Aggregation and Figure a). For the majority of species, data are available for either breeding abundance or non-breeding abundance; both are available for only five species in the Arctic Waters (Region I), 14 species in the Greater North Sea (Region II) and just one species in the Celtic Seas (Region III). Relative abundance is the number of adult birds or breeding pairs estimated each year as a proportion of a baseline (see section below on parameter / metric). Each species-specific estimate of annual relative abundance is compared against a threshold value. This indicator assessment is based on the proportion of species in a Region or sub-division of that Region that have achieved threshold values for relative abundance in the mean of the most recent six years of the time series. Depending on data availability, the last year of the assessment varies between 2016 and 2020. Separate assessments were carried out for relative breeding abundance and relative non-breeding abundance.
The common indicator assessment conducted for the OSPAR Intermediate Assessment 2017 (IA 2017) covered only three OSPAR Regions (Arctic Waters, Greater North Sea and Celtic Seas). This common indicator assessment for QSR 2023 is now expanded to an additional OSPAR Region: Bay of Biscay and Iberian Coast (Region IV). Data were insufficient to make a viable indicator assessment for Wider Atlantic (Region V) as it comprised only two species; nonetheless these data are presented separately in the expectation that future editions might enable an indicator assessment for the Region. The assessment of Arctic Waters is only based on data from Norway but includes both breeding and non-breeding abundance data from both the Norwegian Sea and Barents Sea (including Jan Mayen and Svalbard). The assessment of the Greater North Sea includes both breeding and non-breeding abundance data from all Contracting Parties. The assessment of the Celtic Seas is based on breeding abundance data from France and the United Kingdom and on non-breeding abundance data from the United Kingdom only.

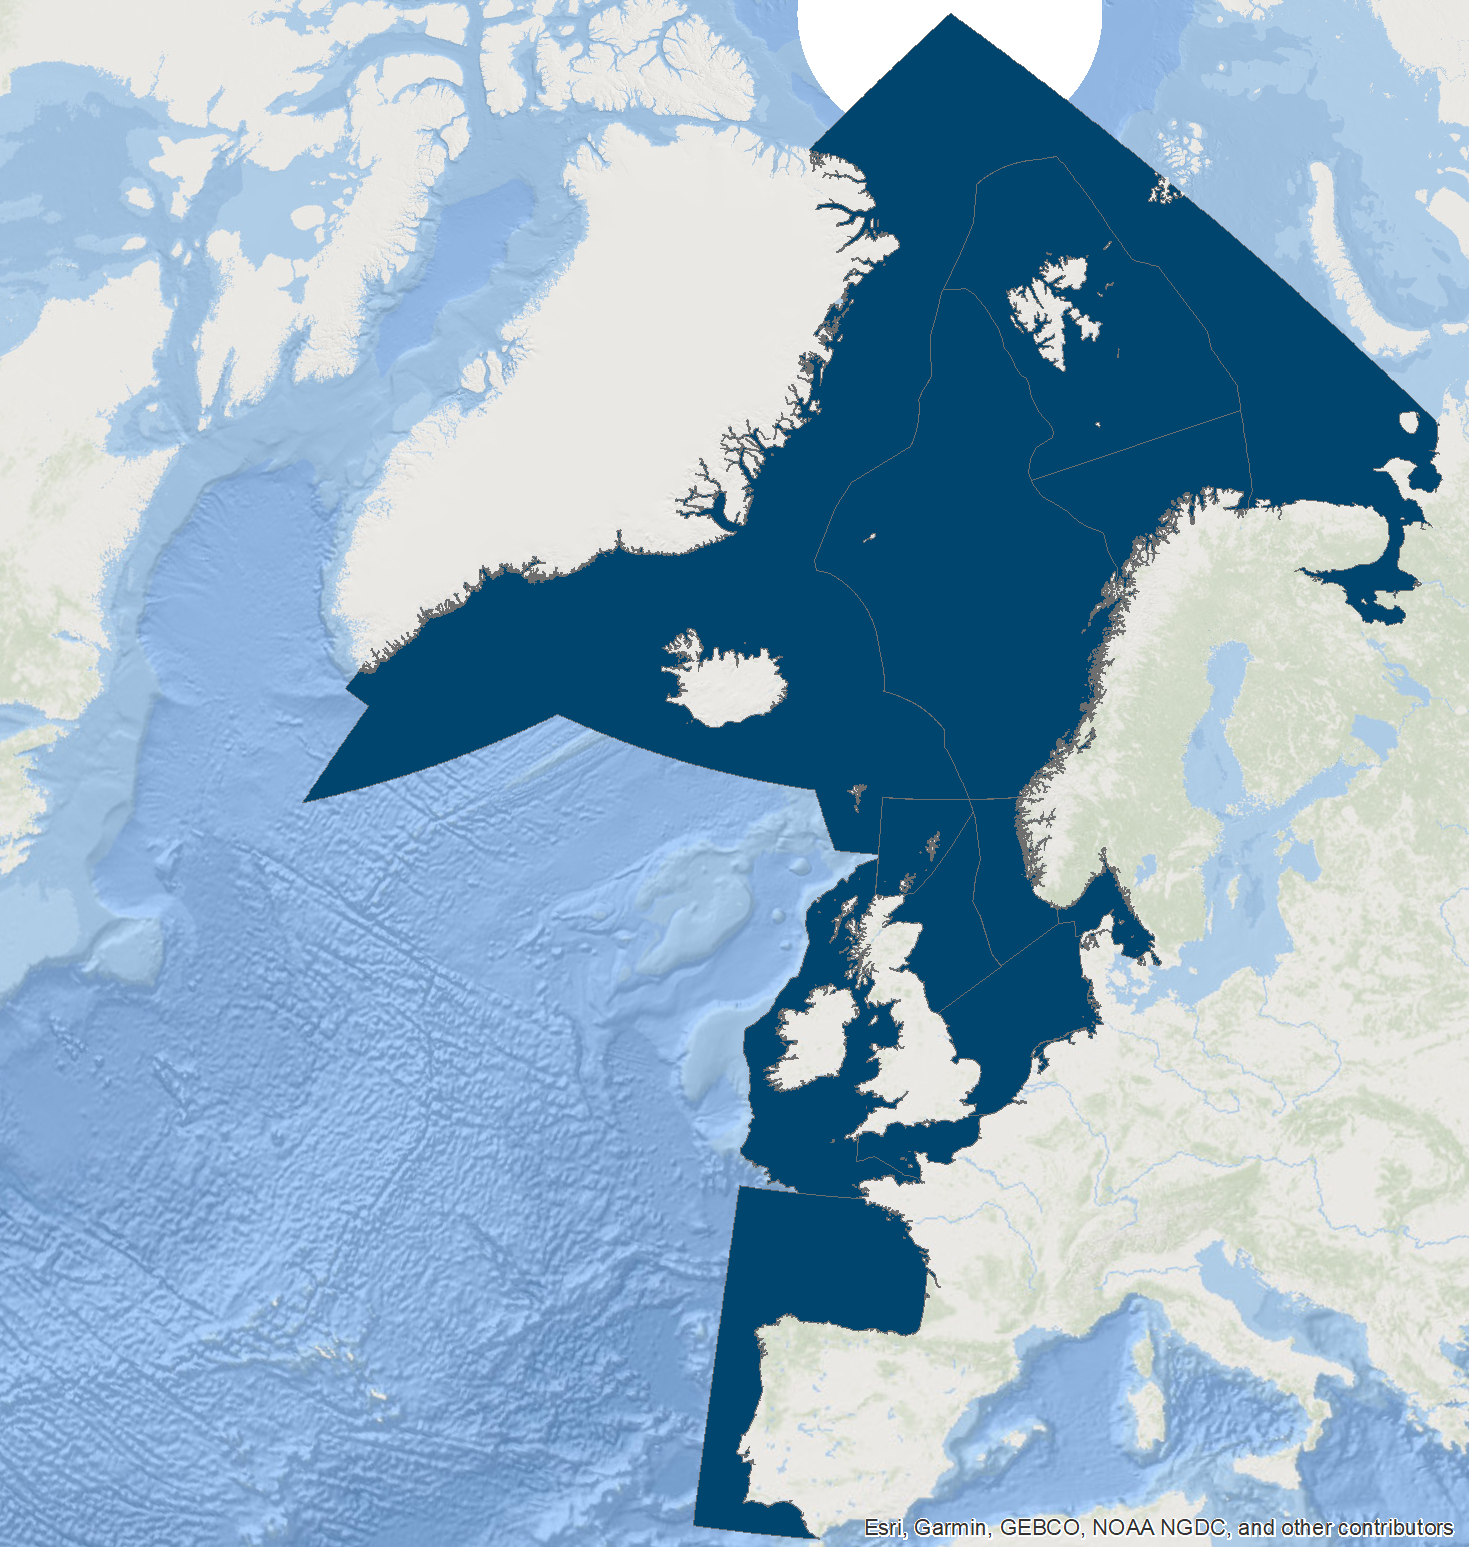
Figure a. Marine bird assessment units
Greater North Sea sub-divisions: a) North-East coast of Britain, b) West coast of Norway, c) Skagerrak and Kattegat, d) Southern North Sea, e) English Channel, f) North coast of Scotland and the Northern Isles
Species-Specific Indicators of Relative Abundance
Data Acquisition
In December 2020, the following data were requested from Contracting Parties on counts of breeding and non-breeding birds collected during the period 1980 to 2020:
- Breeding seabird colonies and breeding waterbirds nesting close to the coast and using the marine environment (e.g., for food): counts of breeding pairs (preferably, or failing that, adult birds) per species per colony per year.
- Wintering and migrating waterbirds: numbers of birds per species per site per year that are counted from land or from the air. These data mostly comprise maximum or single counts conducted in January (n.b. within the Arctic Circle, counts are conducted in March when there is sufficient daylight to do so). Data from the Wadden Sea Trilateral (Germany, the Netherlands and Denmark) Monitoring and Assessment Programme and from the United Kingdom Wetland Bird Survey also comprised a mean of counts conducted throughout a one-year period (from July in one year to June in the next).
Most data refer to individual colonies or sites rather than large stretches of coastline. Exceptions are the Wadden Sea, the Dutch Delta and non-breeding data in the United Kingdom, where data from discrete sample sites have been aggregated to Regions and sub-divisions using modelling (i.e., imputing of missing counts, see section “Trend Analysis”). Species staying offshore during the non-breeding season are not covered by this assessment, but were addressed in a pilot assessment testing a newly developed assessment method.
Spatial Aggregation
Separate indicator assessments were conducted for each species in each OSPAR Region. An assessment was also conducted for each sub-division of the Greater North Sea, and of the Norwegian Arctic Waters (Figure a). These smaller sub-divisions may help to interpret the assessment results. The sub-divisional boundaries are based on a coarse assessment of the main oceanographic features such as currents and depth, and some relatively clear-cut differences in seabird / waterbird community structure and population trends (ICES, 2013c,d).
Data used in this Assessment
When all data from participating Contracting Parties had been collated, it became clear that prior to 1991, the number of annual counts per site was much lower in some areas, with many sites not being surveyed at all. Prior to 1991, a large amount of data would need to be interpolated and confidence in the accuracy of trends in abundance during this period was very low. For this reason, the data used in this indicator assessment were restricted to 1991 onwards.
Table a shows year ranges used for the indicator assessment at Region and Sub-division scale for Breeding and non-breeding data.
Note that for sub-division IId in the Southern North Sea, breeding data were available up to 2019 but has been restricted to year 2017 as 20 breeding species with important counts in the Wadden Sea area have data supplied only up to 2017. In the same sub-division, 39 non-breeding species with important counts in the Wadden Sea have data supplied to 2016, therefore the non-breeding year range was restricted to 2016 despite some data available up to 2020.
| None | None | Breeding | Non-breeding |
|---|---|---|---|
| Im | North Barents Sea | 1991 - 2020 | |
| In | South Barents Sea | 1991 - 2020 | 1991 - 2020 |
| Io | Norwegian Sea | 1991 - 2020 | 1991 - 2020 |
| I | Arctic Waters | 1991 - 2020 | 1991 - 2020 |
| IIa | North-East coast of Britain | 1991 - 2019 | 1991 - 2020 |
| IIb | West coast of Norway | 1991 - 2020 | 1991 - 2020 |
| IIc | Skagerrak / Kattegat area | 1991 - 2020 | 1991 - 2020 |
| IId | Southern North Sea | 1991 - 2017 | 1991 - 2020 |
| IIe | The Channel | 1991 - 2019 | 1991 - 2016 |
| IIf | North coast of Scotland and the Northern Isles | 1991 - 2019 | 1991 - 2020 |
| II | Greater North Sea | 1991 - 2017 | 1991 - 2016 |
| III | Celtic Seas | 1991 - 2019 | 1991 - 2020 |
| IV | Bay of Biscay and Iberian Coast | 1991 - 2016 | |
| V | Wider Atlantic | 2010 - 2020 |
Figure b: Spatial distribution of marine bird breeding colonies and sites, from which abundance data were used for this assessment.

Figure c: Spatial distribution of marine bird wintering sites, from which abundance data were used for this assessment.
Please note that the offshore datapoints in the sub-divisions of the Greater North Sea are not actual sites but modelled estimations of abundance for the entire sub-division. The same applies to data from the German Wadden Sea, from where year-round averages rather than winter counts were supplied.
Trend Analysis
This indicator assessment requires for each species an annual estimate of either breeding or non-breeding abundance (depending on species) per site or colony. Not all the colonies and sites in the data provided had been observed every year. Missing annual observations were interpolated from the observed data using statistical models. The minimum number of years of counts for a particular species required for a colony or site to be included in the analysis was set at two for all species except northern fulmar Fulmarus glacialis, which was set at a minimum of five years (ICES, 2010, 2011).
Some Contracting Parties provided data that had no missing values because these had already been interpolated prior to submission, using tried and tested methods:
- United Kingdom non-breeding abundance, all species (for methodology see Underhill et al., 1994).
- Denmark, Germany, and the Netherlands in the Wadden Sea (Greater North Sea sub-division d) non-breeding abundance, all species (for methodology see Blew and Südbeck, 2005; Kleefstra et al., 2019).
- Denmark, Germany, and the Netherlands in the Wadden Sea (Greater North Sea sub-division d) breeding abundance, all species (for methodology see Koffijberg et al., 2020).
For all other data submitted by Contracting Parties, missing annual observations were interpolated using General Additive Models (GAMs) (Ward et al., 2014). At this stage, colonies with less than 3 years of count were discarded because the GAM could not otherwise converge. The use of GAMs replaced the modified chain approach developed by Thomas (1993) that was used during the IA 2017 for imputation of missing data. This decision was data driven, given that statistical assumptions based on the Thomas fit were not always met in the dataset. The GAM method does not assume any a priori relationship between the dependent variable and the covariates and can be used to identify and estimate non-linear effects of the covariate on the dependent variable. It is therefore a more flexible method, which avoids the production of outliers during the imputation and allows the inclusion in the assessment of a higher number of species that would have been otherwise discarded due to unrealistic results produced by the Thomas fit method.
Applying Regional Weightings to Abundance Trends
Not all the colonies or sites in an assessment unit will be monitored and be present in the dataset. The proportion of a population that is monitored varies between species and between countries. There is a resultant bias, in that those countries where few sites are monitored are under-represented in the trends for a given assessment unit, compared to those countries where a larger proportion of sites are monitored.
To remove such bias, the annual estimates of breeding and non-breeding abundance in each country were weighted according to the size of the population in that country. Each Contracting Party provided recent estimates of total abundance for each species along their coastline within each of the assessment units in Figure a. To apply a regional weighting, each annual estimate of abundance in each assessment unit was divided by a proportion p, where p is the proportion of the total population that is present within the sites or colonies that are included in the data provided. The total number of adult birds or pairs in an assessment unit were, in most instances, taken from national censuses.
As an example, the weighted annual breeding abundance of a species in the Celtic Seas Region, yIII in year j, was calculated from annual estimates of abundance in each constituent country, i.e., the United Kingdom Celtic Seas coast (yUK) and France (yFR) as follows:
yIIIj = (yUKj / pUK) + (yIFRj / pFR)
where pUK and pFR are the proportions of the respective populations in the United Kingdom (UK) and France (FR) that are contained in the sample of colonies that were monitored in each constituent country in the Celtic Seas region (for which data were available).
Regional weightings were not necessary where data contained all the colonies or sites in that area. In Belgium, all the breeding and non-breeding sites in the country are monitored, so no weightings were required for these data. Regional weighting was also not necessary for estimates of annual abundance that had been interpolated before submission. These included trends in breeding and non-breeding abundance in the Dutch, German and Danish Wadden Sea, and trends in non-breeding abundance in the United Kingdom.
Parameter / Metric
To compare the state of species that have very different population sizes, estimates of abundance (measured in numbers of adult birds or breeding pairs) were converted to an indicator metric that uses a single scale (i.e., a proportion) for all species. The indicator metric is relative abundance, which is annual abundance expressed as a percentage of the baseline:
relative abundance = annual abundance / baseline abundance
Baselines
Baseline values were obtained based on predictions using a generalised linear model to detect yearly trend for the first ten years of the observed period (1991 to 2000). All p-values and confidence intervals were calculated using the family error “Quasi-Poisson” to account for data overdispersion. In case of a significant regression over these ten years (regression p value ≤ 0,05), the predicted value for the first year (1991) was used as the baseline value, otherwise the mean of the first ten years, ignoring missing years, served as baseline value. The geometric mean of the last six years (e.g., 2015 to 2020) was assessed against the baseline value. The threshold value for good status is 70% of the baseline value (80% in species laying only one egg per year). It is acknowledged that the year on which the baseline is set will be highly influential in determining the outcome of the indicator, especially in situations where population declines are predominant. The time period considered in the assessment was shifted forward from 1980 to 2020 to 1991 to 2020 because of data scarcity prior 1991. This could potentially risk an ‘optimistic’ bias in the indicator’s outputs, with more species reaching the threshold value relative to the baseline 1991 to 2000 than they would, relative to 1980 to 1989. However, by calculating the baseline from regression analysis on the first 10 years of the time series (or using the mean 1991 to 2000 if no significant regression) rather than simply using the first year of the time series, it was possible to take into account declining trends and minimise the risk of such "optimistic” bias.
Species Selection and Aggregation (Functional Groups)
There were sufficient data to construct species-specific relative abundance plots for 32 breeding species and 45 non-breeding species (see bird abundance summary). Following a review of the Joint ICES/OSPAR Working Group on Seabirds (JWGBIRD), data from other species supplied by the Contracting Parties were excluded from the analysis for the following reasons. In the non-breeding season, some species occur too far offshore to be monitored sufficiently by land-based counts. These species could be included in the indicator in future, if the proposed extension to offshore areas (see pilot assessment B1 Marine bird abundance – non-breeding birds offshore ) is agreed. Other species such as swans were not considered representative of marine habitats, although they use them at times. Further, very small sample sizes of species in certain Regions or sub-divisions did not allow a reliable assessment.
Species were assigned to the functional groups given in Table b.
| Functional group | Typical feeding behaviour | Typical food types | Additional guidance |
|---|---|---|---|
| Surface feeders | Feed within the surface layer (within 1–2 m of the surface) | Small fish, zooplankton and other invertebrates | “Surface layer” defined in relation to normal diving depth of plunge-divers (except gannets) |
| Water column feeders | Feed at a broad depth range in the water column | Pelagic and demersal fish and invertebrates (e.g., squid, zooplankton) | Include only spp. that usually dive by actively swimming underwater; but including gannets. Includes species feeding on benthic fish (e.g., flatfish). |
| Benthic feeders | Feed on the seafloor | Invertebrates (e.g., molluscs, echinoderms) | |
| Wading feeders | Walk / wade in shallow waters | Invertebrates (molluscs, polychaetes, etc.) | |
| Grazing feeders | Grazing in intertidal areas and in shallow waters | Plants (e.g., eelgrass, saltmarsh plants), algae | Geese and dabbling ducks |
Assessments
Species-Specific threshold Values
This assessment uses two different threshold values that are designed to reflect the resilience of different species to declines in their population (see ICES, 2008, 2010, 2011). It is desirable for the annual relative abundance of a species to be above, either:
- 0,8 (i.e., 80% of the baseline) – for species that lay one egg; or
- 0,7 (i.e., 70% of the baseline) – for species that lay more than one egg.
The reason for having two assessment threshold values is because species that lay only one egg are expected to recover more slowly from declines in population size than species that can potentially produce more than one chick per year. If relative abundance is below the appropriate assessment threshold value, it is considered to be in ‘poor’ status and further research and / or management is recommended, depending on what is appropriate.
An upper assessment threshold value of 1,3 (i.e., 130% of the baseline) was applied to the annual relative abundance of all species. This upper assessment threshold value is used to identify potentially disruptive increases in some species that might impact on other species (ICES, 2008). For instance, large predatory seabird species have benefited from the provision of food from fishery discards. The increase in numbers of species such as great black-backed gull and great skua have, in some areas, led to declines in species such as kittiwake that they prey on. However, this has the potential to wrongly identify a species as having a detrimental impact on other species when in fact it is in recovery to levels in excess of the baseline (ICES, 2010, 2011, 2013b). As a result, this upper assessment threshold value is not used as an indicator of status and is only used to provide a trigger for further research and / or management, if increases in one species are likely to result in decreases in others.
Integration of Species-Specific Assessments
The status of marine bird communities was assessed by calculating the proportion of species exceeding the lower threshold values, as previously used for breeding seabirds in the EcoQO on seabird population trends as an index of community health (ICES, 2008), according to the following integration rule:
Changes in abundance of marine birds should exceed species-specific assessment values in 75% or more of species that are assessed.
Humphreys et al. (2012) also recommended a value of 75% for non-breeding shorebirds and coastal breeding waterbirds in the United Kingdom because it is comparable to the assessment threshold values used for shorebirds by the WeBS Alerts system (https://www.bto.org/our-science/projects/wetland-bird-survey/publications/webs-alerts).
In this indicator assessment, relative breeding abundance and relative non-breeding abundance were assessed separately. This is because most species in the breeding assessment are seabirds that use the wider marine environment and most species in the non-breeding assessment use intertidal and inshore areas. The breeding and non-breeding assessments therefore indicate impacts from different suites of pressures, operating in different parts of the marine environment.
To provide greater insight into the likely impacts operating on relative breeding abundance and on relative non-breeding abundance, species-specific assessments were integrated at different spatial scales: for each OSPAR Region and for each sub-division of the Greater North Sea and Arctic Waters. Within each Region and sub-division, species-specific assessments were also integrated for each functional group (described in Table b).
Results
For each OSPAR Region, the percentages of all species within each functional group exceeding assessment threshold values for relative breeding abundance and for relative non-breeding abundance are shown in Table 1.
| Above threshold value (≥75%) | |
| Below threshold value (<75%) |
Table 1. Percentage of species assessed that had a relative abundance above the threshold values in each functional group. Calculations are based on the whole set of species assessed within each Region, thus including species observed in different sub-divisions. Number in parenthesis is the number of species in each grouping. No assessments are available for the Wider Atlantic.
| Norwegian part of Arctic Waters | Greater North Sea | Celtic Seas | Bay of Biscay and Iberian Coast | |||||
| Functional Group | Breeding | Non-Breeding | Breeding | Non-Breeding | Breeding | Non-Breeding | Breeding | Non-Breeding |
| Surface feeders | 67% (6) | 67% (3) | 36% (14) | 60% (5) | 58% (12) | 75% (8) | ||
| Water-column feeders | 50% (8) | 25% (4) | 86% (7) | 75% (4) | 100% (6) | 33% (3) | ||
| Benthic feeders | 50% (4) | 0% (1) | 33% (3) | 0% (2) | ||||
| Wading feeders | 40% (5) | 63% (24) | 47% (17) | |||||
| Grazing feeders | 100% (1) | 100% (1) | 100% (5) | 80% (5) | ||||
| Breeding / Non-breeding total | 57% (14) | 50% (12) | 50% (28) | 66% (41) | 72% (18) | 48% (27) | 75% (8) | |
| All | 54% (26) | 59% (69) | 58% (45) | 75% (8) | ||||
In three out of four of the OSPAR Regions assessed, less than 75% of all species assessed across the functional groups have achieved threshold values for relative breeding abundance, indicating that the bird communities are not healthy. The only exception is the Bay of Biscay and Iberian Coast Region, in which 75% of breeding birds assessed achieve the threshold value (Table 1). In the Norwegian part of the Arctic Waters all functional groups failed the threshold, except for grazing feeders in the non-breeding season (one species). In the Greater North Sea, only water-column feeders and grazing feeders achieved the threshold value in both the breeding and non-breeding season. In the Celtic Seas all the assessed breeding water-column feeders (six species) and most of the non-breeding grazing feeders (five species) achieved the threshold value. In the Bay of Biscay and Iberian Coast, 75% of breeding surface feeders (eight species) achieved the threshold value. Less than 75% of benthic feeders and wading feeders achieved the threshold value in all the OSPAR Regions where these groups were assessed. The patterns found for the Arctic Waters and the Greater North Sea are generally reflected on the spatial level of sub-divisions, although there are some minor deviations (Table 2 and Table 3).
Table 2. Percentage of species assessed in the sub-divisions of the Norwegian part of the Arctic Waters that had a relative abundance above the threshold values in each functional group. Number in parenthesis is the number of species in each grouping.
| North Barents Sea | South Barents Sea | Norwegian Sea | ||||
| Functional group | Breeding | Non-breeding | Breeding | Non-breeding | Breeding | Non-breeding |
| Surface feeders | 0% (2) | 33% (3) | 67% (3) | 67% (6) | 100% (2) | |
| Water-column feeders | 0% (1) | 100% (6) | 33% (3) | 57% (7) | 50% (4) | |
| Benthic feeders | 67% (3) | 25% (4) | ||||
| Wading feeders | ||||||
| Grazing feeders | 100% (1) | 100% (1) | ||||
| Breeding / Non-breeding total | 0% (3) | 78% (9) | 60% (10) | 62% (13) | 55% (11) | |
| All | 0% (3) | 68% (19) | 58% (24) | |||
Table 3. Percentage of species assessed in the sub-divisions of the Greater North Sea that had a relative abundance above the threshold values in each functional group. Number in parenthesis is the number of species in each grouping.
| North-East coast of Britain | West coast of Norway | Skagerrak / Kattegat | Southern North sea | The Channel | North coast of Scotland and the Northern Isles | |||||||
| Functional group | Breeding | Non-breeding | Breeding | Non-breeding | Breeding | Non-breeding | Breeding | Non-breeding | Breeding | Non-breeding | Breeding | Non-breeding |
| Surface feeders | 67% (12) | 33% (6) | 33% (9) | 50% (2) | 64% (11) | 60% (5) | 70% (10) | 18% (11) | ||||
| Water-column feeders | 67% (6) | 0% (2) | 75% (4) | 100% (3) | 100% (2) | 0% (1) | 100% (4) | 100% (2) | 100% (4) | 50% (2) | 29% (7) | 100% (2) |
| Benthic feeders | 0% (1) | 0% (1) | 50% (2) | 0% (1) | 50% (2) | 0% (2) | 0% (1) | |||||
| Wading feeders | 56% (16) | 0% (1) | 33% (3) | 40% (5) | 63% (24) | 53% (19) | 83% (6) | |||||
| Grazing feeders | 80% (5) | 100% (1) | 100% (1) | 100% (5) | 100% (5) | 100% (2) | ||||||
| Breeding / Non-breeding total | 67% (18) | 54% (24) | 45% (11) | 71% (7) | 40% (15) | 33% (3) | 67% (21) | 68% (38) | 79% (14) | 57% (28) | 22% (18) | 73% (11) |
| All | 60% (24) | 56% (18) | 39% (18) | 68% (59) | 64% (42) | 45% (29) | ||||||
Changes in the annual percentage of species achieving threshold values since the early 1990s are shown in Figure 1 (relative breeding abundance) and Figure 2 (relative non-breeding abundance). There has been a decline in the proportion of breeding species achieving threshold values since the mid-2000s or earlier in all OSPAR Regions assessed, with the exception of breeding species in the Bay of Biscay and Iberian Coast Region whose values appear to be stable since mid-2000s with recent values meeting the threshold value. Non-breeding species are declining since the start of the time-series in all OSPAR Regions assessed.
Non-breeding populations of species that predominantly stay offshore during the non-breeding season and therefore not accessible by land-based counts are not included in this assessment. Results of a new method addressing the abundance of non-breeding marine birds at sea are provided in a pilot assessment.
There was high confidence in the methodology and moderate confidence in the data used in this assessment.
Figure 1: Change in the annual proportion of all species achieving threshold values for the relative breeding abundance of marine birds in the Norwegian part of the Arctic Waters (14 species), the Greater North Sea (28 species), the Celtic Seas (18 species) and the Bay of Biscay and Iberian Coast (eight species).
The black line denotes the multi-species threshold value of 75%.
Figure 2: Change in the annual proportion of all species exceeding threshold values for relative non-breeding abundance of marine birds in the Norwegian part of the Arctic Waters (12 species), the Greater North Sea (41 species) and the Celtic Seas (27 species).
The black line denotes the multi-species threshold value of 75%.
The geometric mean relative abundance of the last six years for individual species that have failed to meet threshold values are shown in red in Figure d (breeding abundance) and Figure e (non-breeding abundance).
Key for the following tables:
| Species assessment |
| Relative abundance ≥ 1,3 |
| Relative abundance ≥ 0,7 or 0,8 (depending on clutch size) |
| Relative abundance < 0,7 or 0,8 (depending on clutch size) |
| Insufficient data / low confidence |
Table d. Species-specific assessment of relative breeding abundance for marine birds. Arrows display change of status category compared to the six years rolling mean for 2014, which is the year preceding the current assessment period for most species. (upward: status improvement, downward: status decline).
| OSPAR I | OSPAR II | OSPAR III | OSPAR IV | OSPAR V | ||
Surface feeders | Black-legged Kittiwake | |||||
| Black-headed gull | ||||||
| Mediterranean gull | ||||||
| Common gull | ||||||
| Great black-backed gull | ↑ | |||||
| European herring gull | ||||||
| Lesser black-backed gull | ↓ | ↓ | ||||
| Sandwich tern | ||||||
| Little tern | ↑ | |||||
| Roseate tern | ||||||
| Common tern | ||||||
| Arctic tern | ||||||
| Great skua | ||||||
| Arctic skua | ||||||
| European storm-petrel | ||||||
| Northern fulmar | ||||||
| Manx shearwater | ||||||
| Water column feeders | Brünnich's guillemot | |||||
| Common guillemot | ||||||
| Razorbill | ↑ | ↑ | ||||
| Black guillemot | ||||||
| Atlantic puffin | ↓ | |||||
| Northern gannet | ||||||
| Great cormorant | ||||||
| European shag | ||||||
| Benthic feeders | Common eider | ↓ | ||||
| Wading feeders | Eurasian oystercatcher | |||||
| Pied Avocet | ||||||
| Ringer Plover | ||||||
| Kentish plover | ||||||
| Eurasian spoonbill | ||||||
| Grazing feeders | Barnacle goose |
Table e. Species-specific assessment of relative non-breeding abundance for marine birds. Arrows display change of status category compared to the six years rolling mean for 2014, which is the year preceding the current assessment period for most species (upward: status improvement, downward: status decline).
Note: The assessments are derived from counts in January of each year, except for the Greater North Sea, where all-year values from Wadden Sea are included, also year-round data used for the United Kingdom’s input into Greater North Sea and Celtic Seas. Assessments in southern part of the Barents Sea include data from late February / early March.
| OSPAR I | OSPAR II | OSPAR III | ||
| Surface feeders | Black-headed gull | |||
| Common gull | ||||
| Great black-backed gull | ||||
| European herring gull | ||||
| Lesser black-backed gull | ||||
| Water column feeders | Red-breasted merganser | |||
| Red-necked grebe | ||||
| Great creasted grebe | ||||
| Black guillemot | ||||
| Great cormorant | ||||
| European shag | ↓ | |||
| Benthic feeders | Greater scaup | |||
| King eider | ↑ | |||
| Common eider | ||||
| Long-tailed duck | ||||
| Common goldeneye | ||||
| Wading feeders | Common shelduck | ↓ | ||
| Eurasian teal | ||||
| Northern pintail | ||||
| Eurasian oystercatcher | ||||
| Pied avocet | ||||
| European golden plover | ||||
| Grey plover | ↓ | |||
| Common ringed plover | ||||
| Kentish plover | ||||
| Black-tailed godwit | ||||
| Bar-tailed godwit | ↓ | |||
| Eurasian whimbrel | ||||
| Eurasian curlew | ↓ | |||
| Spotted redshank | ||||
| Common redshank | ||||
| Common greenshank | ||||
| Ruddy turnstone | ||||
| Red knot | ||||
| Sanderling | ↓ | |||
| Purple sandpiper | ↓ | |||
| Dunlin | ||||
| Curlew Sandpiper | ||||
| Ruff | ||||
| Eurasian spoonbill | ||||
| Little egret | ||||
| Grazing feeders | Barnacle goose | |||
| Brent goose | ||||
| Eurasian wigeon | ||||
| Mallard | ||||
| Northern shoveler |
Species-specific trends
The species-specific trends on which this indicator assessment is based are accessible as supplementary material for breeding abundance and non-breeding abundance. Trends were estimated at various spatial scales (i.e., OSPAR Regions and for sub-divisions thereof), depending on there being sufficient data available, for which the trends were estimated for each species. An example of species-specific trend plot is shown in Figure d.
The number of species included in the sub-divisional assessments are fewer than those in the regional assessments, because there are fewer colonies and sites at the smaller scale that have data from a sufficient number of years. Moreover, not all species are distributed across all sub-divisions of a Region.

Figure d: An example of species-specific trend of the B1 indicator.
The figure shows temporal trends in relative abundance of the Arctic Skua in the Greater North Sea obtained from breeding data. Data points represent yearly relative abundance values and the grey line represent the six-year rolling relative abundance geometric mean. The black line indicates the baseline which is calculated from the first ten years of data (see “Assessment Method” for details). The black dotted line indicates the lower threshold value of 0,7 (for species that lay >1 egg) or 0,8 for species that lay 1 egg only); the black dashed line indicates the upper threshold value of 1,3. In this example, the value obtained from the last six years of the time series is below the baseline, meaning that the species has failed the threshold value.
Table f: Species-specific assessment of relative breeding abundance in the sub-divisions of Norwegian part of Arctic Waters (see Figure a). Arrows display change of status category compared to the six years rolling mean for 2014, which is the year preceding the current assessment period for most species (upward: status improvement, downward: status decline).
| OSPAR I | OSPAR Im | OSPAR In | OSPAR Io | ||
| Surface feeders | Black-legged kittiwake | ||||
| Great black-backed gull | ↑ | ↑ | |||
| European herring gull | |||||
| Lesser black-backed gull | |||||
| Arctic tern | |||||
| Great skua | |||||
| Northern fulmar | |||||
| Water column feeders | Brünnichs Guillemot | ||||
| Common guillemot | |||||
| Razorbill | |||||
| Black guillemot | |||||
| Atlantic puffin | ↓ | ||||
| Northern gannet | ↑ | ||||
| Great cormorant | |||||
| European shag |
Table g. Species-specific assessment of relative non-breeding abundance in the sub-divisions of the Norwegian part of the Arctic Waters (see Figure a). Arrows display change of status category compared to the six years rolling mean for 2014, which is the year preceding the current assessment period for most species (upward: status improvement, downward: status decline).
| OSPAR I | OSPAR In | OSPAR Io | ||
| Surface feeders | Common gull | |||
| Great black-backed gull | ↑ | |||
| European herring gull | ↑ | ↑ | ||
| Water column feeders | Red-breasted merganser | |||
| Red-necked grebe | ||||
| Black guillemot | ||||
| Great cormorant | ||||
| European shag | ↓ | ↓ | ||
| Benthic feeders | King eider | ↑ | ||
| Common eider | ||||
| Long-tailed duck | ||||
| Common goldeneye | ||||
| Wading feeders | Eurasian teal | |||
| Eurasian oystercatcher | ||||
| Common redshank | ||||
| Purple sandpiper | ||||
| Grazing feeders | Eurasian wigeon | |||
| Mallard |
Table h: Species-specific assessment of relative breeding abundance in the sub-divisions of the Greater North Sea (see Figure a). Arrows display change of status category compared to the six years rolling mean for 2014, which is the year preceding the current assessment period for most species (upward: status improvement, downward: status decline).
| OSPAR II | OSPAR IIa | OSPAR IIb | OSPAR IIc | OSPAR IId | OSPAR IIe | OSPAR IIf | ||
| Surface feeders | Black-legged kittiwake | ↑ | ||||||
| Black-headed gull | ↑ | |||||||
| Mediterranean gull | ||||||||
| Common gull | ↓ | |||||||
| Great black-backed gull | ↑ | |||||||
| European herring gull | ||||||||
| Lesser black-backed gull | ↓ | ↓ | ||||||
| Sandwich tern | ||||||||
| Little tern | ↑ | |||||||
| Roseate tern | ||||||||
| Common tern | ↑ | |||||||
| Arctic tern | ↑ | |||||||
| Great skua | ||||||||
| Arctic skua | ||||||||
| European storm-petrel | ||||||||
| Northern fulmar | ↓ | |||||||
| Water column feeders | Red-breaster merganser | |||||||
| Common guillemot | ||||||||
| Razorbill | ↑ | ↑ | ||||||
| Black guillemot | ||||||||
| Atlantic puffin | ||||||||
| Northern gannet | ||||||||
| Great cormorant | ||||||||
| European shag | ||||||||
| Benthic feeder | Common eider | ↓ | ↓ | |||||
| Wading feeders | Common shelduck | |||||||
| Eurasian oystercatcher | ||||||||
| Pied avocet | ||||||||
| Common ringed plover | ||||||||
| Kentish plover | ||||||||
| Ruff | ||||||||
| Dunlin | ||||||||
| Eurasian spoonbill | ||||||||
| Grazing feeder | Barnacle goose |
Table i: Species-specific assessment of relative non-breeding abundance in the sub-divisions of the Greater North Sea (see Figure a). Arrows display change of status category compared to the six years rolling mean for 2014, which is the year preceding the current assessment period for most species (upward: status improvement, downward: status decline).
| OSPAR II | OSPAR IIa | OSPAR IIb | OSPAR IIc | OSPAR IId | OSPAR IIe | OSPAR IIf | ||
| Surface feeders | Black-headed gull | |||||||
| Common gull | ||||||||
| Great black-backed gull | ||||||||
| European herring gull | ↑ | |||||||
| Lesser black-backed gull | ||||||||
| Water column feeders | Red-breasted merganser | ↓ | ||||||
| Red-necked grebe | ||||||||
| Great cormorant | ||||||||
| European shag | ||||||||
| Benthic feeders | Greater scaup | |||||||
| Common eider | ||||||||
| Common goldeneye | ||||||||
| Wading feeders | Common shelduck | |||||||
| Eurasian teal | ||||||||
| Northern pintail | ||||||||
| Eurasian oystercatcher | ||||||||
| Pied Avocet | ||||||||
| European golden plover | ||||||||
| Grey plover | ↓ | |||||||
| Common ringed plover | ||||||||
| Kentish plover | ||||||||
| Black-tailed godwit | ↑ | |||||||
| Bar-tailed godwit | ||||||||
| Eurasian whimbrel | ||||||||
| Eurasian curlew | ↓ | |||||||
| Spotted redshank | ||||||||
| Common redshank | ↓ | |||||||
| Common greenshank | ||||||||
| Ruddy turnstone | ↓ | |||||||
| Red knot | ||||||||
| Sanderling | ↑ | ↓ | ||||||
| Purple sandpiper | ↓ | |||||||
| Dunlin | ↓ | |||||||
| Curlew sandpiper | ||||||||
| Ruff | ||||||||
| Eurasian spoonbill | ||||||||
| Little egret | ||||||||
| Grazing feeders | Barnacle goose | |||||||
| Brent goose | ↑ | |||||||
| Eurasian wigeon | ||||||||
| Mallard | ↑ | |||||||
| Northern shoveler | ↑ |
Wider Atlantic
It was not possible to produce a full assessment of the Wider Atlantic due to the limited amount of data available for this region.
Breeding abundance counts from the Wider Atlantic Region were provided by the Azores for the common tern (Sterna hirundo) and the roseate tern (S. dougallii). However, as data were restricted to the period 2010 to 2020 a baseline could not be calculated and thus an assessment was not possible, not least because the size of the Azores population is strongly fluctuating (Piec & Dunn 2021).
Threatened and / or declining species
Assessments of relative abundance was possible for three species included on the OSPAR List of Threatened and/or Declining Species, all referring to breeding birds only. The black-legged kittiwake did not achieve the threshold in all four Regions where it was assessed (Table d). This holds true also for all sub-divisions of the Arctic Waters (Table f), while in the Greater North Sea the threshold was achieved in three out of five sub-divisions (Skagerrak / Kattegat, Southern North Sea, the Channel). Roseate tern was only assessed in the Greater North Sea, where only a small fraction of the European population breeds (most are found in the Celtic Seas and in the Azores in the Wider Atlantic). In the Greater North Sea, namely at the North-East Coast of Britain, the threshold was achieved (Figure d and Figure i). The Brünnich's guillemot, also known as thick-billed murre, only breeds in the Arctic Waters (sub-division North Barents Sea), where the threshold was not achieved (Figure d and Figure g).
Confidence assessment
There is high confidence in the methodology. There is consensus within the scientific community regarding this methodology, which was developed for the OSPAR EcoQO for seabird population trends, but it has not often been applied. There was moderate confidence in the data. The assessment is undertaken using data with a mostly sufficient spatial coverage for the area assessed, but gaps are apparent in certain areas.
Conclusion
Taken as a whole, marine birds (breeding and non-breeding separately and together) were below the threshold value in Arctic Waters, Greater North Sea, and Celtic Seas. This is a similar situation to the assessment reported for IA 2017 and in general, continues a long-term decline in status. The fact that few changes of status were observed since IA 2017 reflects the fact that declines occurred before that assessment.
In the Bay of Biscay and Iberian Coast, bird species achieved the threshold value, although there the number of species assessed was lower, comprising solely surface-feeders during the breeding season. No assessment could be made in the Wider Atlantic, due to data availability.
There was moderate confidence in the data. The assessment is undertaken using data with a mostly sufficient spatial coverage for the area assessed, but gaps are apparent in certain areas (see Knowledge Gaps)
Wading feeders and benthic feeders never achieved the threshold value in all Regions assessed, although it should be noted that only few benthic feeder species could be assessed. Surface-feeders were also generally in bad status, with the exception of eight species assessed in the Bay of Biscay and Iberian Coast.
Water-column feeders fared well in the Greater North Sea (both breeding and non-breeding) and in the Celtic Seas during the breeding season, but poorly in Arctic Waters. Water-column feeders have access to a wider range of prey at different depths than do surface-feeders and benthic-feeders, which may explain their contrasting status. The availability of small forage fish species at the surface (e.g., sandeel, herring, sprat, and capelin) is probably limiting the breeding success or the annual survival of some surface-feeding species.
Grazing feeders (geese and ducks) were above the threshold value in every Region that could be assessed, though the number of species comprising the assessment here was low.
The proportion of species meeting threshold values was explored also at sub-regional scale. No clear sub-regional patterns were evident in Arctic Waters (and numbers of species assessed rather low due to the generally low number of species in that Region), though the good status of all water-column feeders in the South Barents Sea clearly stands out. In the Greater North Sea, functional groups tend to fail threshold value both for breeding and non-breeding populations, but the number of cases above assessment threshold value is higher in the North coast of Scotland and the Northern Isles, the Southern North Sea and the West Coast of Norway.
The findings of this assessment relating to the importance of small forage fish species at the sea surface as a limiting factor for breeding of some species (e.g., black-legged kittiwake -see below) concurs with the results of the Common Indicator Marine Bird Productivity.
As regards species-specific assessments, the following were notable:
Within surface-feeders during the breeding season, black-legged kittiwake, Arctic skua and northern fulmar failed the assessment in all Regions where they could be assessed. In contrast, Mediterranean gull, Sandwich tern, little tern, roseate tern and great skua passed the assessment in all regions where they could be assessed. Within surface-feeders during the non-breeding season great black-backed gull failed the assessment in both Regions assessed.
Within water-column feeders during the breeding season, Brünnich’s guillemot, also known as thick-billed murre, failed the assessment in Arctic Waters, to which it is restricted. Northern gannet, common guillemot, black guillemot and razorbill passed the assessment in all Regions where they could be assessed. Within water-column feeders during the non-breeding season great cormorant passed the assessment in all three Regions.
Within benthic feeders in the non-breeding season, greater scaup and common eider failed the assessment in both Regions in which they were assessed.
Within wading feeders in the non-breeding season, grey plover, purple sandpiper and dunlin failed the assessment in both Regions. Eurasian teal, black-tailed godwit, common redshank, common greenshank, sanderling and little egret passed the assessment in both Regions assessed.
Within grazing feeders in the non-breeding season, brent goose, barnacle goose, Eurasian wigeon and northern shoveler passed the assessment in both Regions.
Knowledge Gaps
The assessment for Arctic Waters lacks data from Greenland, Iceland, and the Faroe Islands. The assessment for the Celtic Seas could not incorporate Irish data, as the data submitted from there were too sparse for inclusion in the assessment. The Bay of Biscay and Iberian coast lacked data from Portugal, as these were not submitted as annual counts. Very limited data were available from the Wider Atlantic. Therefore, it was not possible to produce an assessment for this Region. The spatial completeness of the marine bird abundance assessment suffered from data not being delivered rather than data not existing.
The baselines used in this common indicator assessment were assigned to the start of the data series being assessed. It would be more objective to set baselines that include ‘historical reference levels’, which reflect abundance at a point in the past long before the time series began, or ‘reference levels’, where anthropogenic impacts on population size are assumed to be negligible. Such baselines are currently not available.
Data availability and utilisation
Arctic Waters (OSPAR Region I)
The Arctic sub-region contains the highest concentrations of marine birds in the North-East Atlantic but only data from Norway could be included in the current assessment. Iceland only provided national total counts of breeding birds, which are, by their nature, rare and thus too sparse to be included in the assessment. If logistical constraints prevent whole colony / area counts, then representative plot samples can be used by the indicator. Therefore, this type of more frequent monitoring data, if available, should be provided for future assessments.
The Russian Federation is not a Contracting Party to the OSPAR Convention; therefore, assessments are missing data from there. Greenland and the Faroe Islands are represented in OSPAR by Denmark. None of these countries have provided any data input to the work of the relevant ICES / OSPAR working groups on this subject.
Greater North Sea (OSPAR Region II)
All Contracting Parties bordering the Greater North Sea have provided all their available data on breeding seabirds and waterbirds and on non-breeding waterbirds. Incomplete data were supplied by German Wadden Sea, because time series lasted only until 2016 in non-breeding birds and until 2017 in breeding birds.
Celtic Seas (OSPAR Region III)
The data provided by the Republic of Ireland included breeding counts from seabird surveys between 2010 and 2019 (making up 2,5% of the OSPAR Region III counts). However, most of these data (except for lesser black-backed gull) could not be used for the assessment as they did not pass the inclusion criterion for the indicator: only one colony was available with counts for more than one year.
Bay of Biscay and Iberian Coast (OSPAR Region IV)
The data provided by Portugal were not at colony level but only national estimates of population size for each species and could not therefore be included in the assessment.
Wider Atlantic (OSPAR Region V)
ICES (2008) concluded that sufficient data on breeding seabirds had been collected and collated on the Azores to construct an indicator for OSPAR Region V – Wider Atlantic. Only nine species of seabird breed on the Azores, but of these, good quality monitoring data exists for four: band-rumped storm-petrel, Bulwer’s petrel, roseate tern and common tern. However, it was not possible to produce an assessment of the Wider Atlantic due to the limited amount of data received for this Region. Breeding abundance counts from the Wider Atlantic Region were provided by the Azores for the common tern and the roseate tern. However, as data were restricted to the period 2010-2020, a baseline could not be calculated and thus, an assessment was not possible, not least because in the case of the roseate tern, the size of the Azores population is strongly fluctuating (Piec & Dunn 2021).
Inclusion of at-sea data
As a prelude to incorporating the assessment of seabirds at sea, a pilot assessment B1 Marine bird abundance – non-breeding birds offshore has been undertaken in the framework of the QSR 2023. The pilot assessment covers seven marine bird species wintering in the Belgian-Dutch-German North Sea, which is part of the OSPAR Region IId. A method to combine assessment of wintering birds counted along the coastline (this Common Indicator) and those surveyed at sea (the pilot assessment) by weighting the outcomes according to the proportions of the assessed populations wintering at the coast and at sea, respectively, is available (ICES 2016, Mercker et al., 2021).
For this assessment of non-breeding marine birds, species occurring mostly offshore, and thus, outside the range of land-based counts, were omitted. In future, updates of the indicator assessment data on seabirds at sea collected from boats or planes need to be included to obtain reliable results on trends in species that occur in substantial numbers offshore.
At present, several Contracting Parties carry out, or plan to carry out, national at-sea monitoring programmes. Elsewhere, there are either no at-sea surveys or those that do exist are very limited in spatial and temporal coverage. Overall, coordination of surveys (e.g., regarding timing) between countries is lacking. There is a need to develop a concept for joint survey efforts delivering the necessary data basis for the indicator work on abundance, to implement this concept in the framework of national survey programmes in future years, and to develop a methodological approach for aggregating and analysing the data.
Baselines
Most Contracting Parties did not provide baselines for the QSR 2023. As an alternative, relative breeding abundance was calculated using a baseline obtained from regression analysis or mean of the first ten years of the time series (starting in 1991). ICES (2015) recommended that it is preferable to set baselines objectively, using one of the methods (a) or (b), below.
- 'Historical reference’: where abundance is known at a point in the past long before the time series began, but where the reasons for subsequent change are unknown. Historical population estimates should be used as baselines if they were recorded: before known human impacts; and / or before other major declines in population; or at known plateaus in population trends, following increases and peaks in population size.
- ‘Reference level’: the population size that could be expected if human impacts were negligible (this can be derived from known population sizes either historically or from within available time series). Use of the highest known population estimate when the population has decreased in size, either as a result of human impacts (e.g., periods of severe contamination) or following stochastic natural impacts (e.g., severe weather events). Use of recent population estimates (e.g., previous five-year mean) when a species has been colonising.
However, the above methods are difficult to obtain in practice, given the limited length of the time-series generally available. Few countries were able to supply baselines for the IA 2017 and the COVID pandemic has hindered attempts by JWGBIRD to address this for the QSR 2023. For future assessments, further effort should be made by Contracting Parties to improve the estimation of baselines based on available data.
Populations and subspecies
Some marine bird species in this assessment belong to different flyway‐populations, biogeographical sub-populations or even subspecies. In particular, it is a problem to combine non-breeders in one assessment, because in different areas of origin they can be subject to very different pressures. In the future, efforts should be made to assess populations separately, provided they are distinguishable.
Species selection
This indicator uses the abundance of marine bird species to assess the status of the marine areas they use during the breeding and non-breeding seasons. Thus, it concentrates on species foraging at sea, and many of these birds are on land only for breeding. However, the indicator also addresses coastal habitats such as estuaries, beaches, and saltmarshes, typically hosting wading and grazing feeders. Among these are species that are also widely distributed over wetlands further inland, some of which only occur irregularly in the coastal habitats or only a small share of the population occurs in coastal habitats. This may differ furthermore between the Regions and assessment units. The assessment attempted to include only those species which can be considered representative for marine and coastal habitats to reflect the state of these habitats.
Very rare species
The indicator could not be applied to very rare species, where data were insufficient to run the analysis. For example, for this reason the Iberian guillemot, which is included on the OSPAR List of Threatened and/or Declining Species and Habitats could not be assessed by this indicator. According to the Status Assessment for Iberian guillemot this population breeding exclusively in the Bay of Biscay and Iberian Coast is virtually extinct and is considered unlikely to recover.
ICES. 2008. Report of the Workshop on Seabird Ecological Quality Indicator, 8–9 March 2008, Lisbon, Portugal. ICES CM 2008/LRC:06. 60 pp.
ICES. 2010. Report of the Working Group on Seabird Ecology (WGSE). 15–19 March 2010, Copenhagen. ICES CM 2010/SSGEF:10. 81 pp.
ICES. 2011. Report of the Working Group on Seabird Ecology (WGSE). 1–4 November 2011, Madeira, Portugal. ICES CM 2011/SSGEF:07. 77 pp.
ICES. 2012. ICES advice on EcoQO for seabird populations in OSPAR regions II and III. In Report of the ICES Advisory Committee, 2012. ICES Advice 2012, Book 1, Section 1.5.5.1. Also available as a separate advice sheet at: http://www.ices.dk/sites/pub/Publication%20Reports/Advice/2012/Special%20Requests/OSPAR_EcoQO_for_seabird_populations.pdf
ICES. 2013a. OSPAR request on ecological quality objective for seabird populations in OSPAR Region III (Celtic Seas). In Report of the ICES Advisory Committee, 2013. ICES Advice 2013, Book 1, Section 1.5.6.1. Also available as a separate advice sheet at: http://www.ices.dk/sites/pub/Publication%20Reports/Advice/2013/Special%20requests/OSPAR_EcoQO_region_III.pdf
ICES. 2013b. Report of the ICES Ad hoc Group on Seabird Ecology (AGSE), 28–29 November 2012, ICES Headquarters, Copenhagen, Denmark. ICES CM 2012/ACOM:82. 30 pp.
ICES. 2013c. Report of the Joint ICES/OSPAR Expert Group on Seabirds (WGBIRD), 22–23 October 2013, ICES Headquarters, Copenhagen, Denmark. ICES CM 2013/ACOM:78. 24 pp.
ICES. 2013d. OSPAR request on an update of the ecological quality objective (EcoQO) on seabird population trends. In Report of the ICES Advisory Committee, 2013. ICES Advice 2013, Book 1, Section 1.5.6.9.
ICES. 2015. Report on the Joint ICES/OSPAR Working Group on Seabirds (JWGBIRD), 17-21 November 2014, Copenhagen, Denmark. ICES CM 2014/ACOM:30, 115 pp.
ICES 2016. Report of the OSPAR/HELCOM/ICES Working Group on Marine Birds (JWGBIRD), 10-14 October 2016, Thetford, United Kingdom. ICES CM 2016/ACOM:29, 124 pp.
Blew, J. and Südbeck, P. (Eds.) 2005. Migratory Waterbirds in the Wadden Sea 1980 – 2000. Wadden Sea Ecosystem No. 20. Common Wadden Sea Secretariat, Trilateral Monitoring and Assessment Group, Joint Monitoring Group of Migratory Birds in the Wadden Sea, Wilhelmshaven, Germany.
Humphreys E. M., Risely K., Austin G. E., Johnston A., and Burton N.H.K. 2012. Development of MSFD Indicators, Baselines and Targets for Population Size and Distribution of Marine Birds in the UK. BTO Research Report No. 626.
Kleefstra, R., Hornman, M., Bregnballe, T., Frikke, J., Günther, K., Hälterlein, B., Körber, P., Ludwig, J. & Scheiffarth, G., 2019. Trends of Migratory and Wintering Waterbirds in the Wadden Sea 1987/1988 - 2016/2017. Wadden Sea Ecosystem No. 39. Common Wadden Sea Secretariat, Joint Monitoring Group of Migratory Birds in the Wadden Sea, Wilhelmshaven, Germany.
Koffijberg, K., Bregnballe, T., Frikke, J., Gnep, B., Hälterlein, B., Hansen, M.B., Körber, P., Reichert, G., Umland, J., & van der Meij, T. 2020. Breeding Birds in the Wadden Sea: Trends 1991- 2017 and results of total counts in 2006 and 2012. Wadden Sea Ecosystem No. 40. Common Wadden Sea Secretariat, Joint Monitoring Group of Breeding Birds in the Wadden Sea, Wilhelmshaven, Germany.
Mercker, M., Markones, N., Borkenhagen, K., Schwemmer, H., Wahl, J. & Garthe S. 2021. An integrated framework to estimate seabird population numbers and trends. Journal of Wildlife Management 85: 751-771
Piec, D. & Dunn, E.K. 2021. International (East Atlantic) Species Action Plan for the Conservation of the roseate tern Sterna dougallii (2021-2030). Developed under the framework of the Roseate Tern LIFE Project (LIFE14 NAT/UK/000394). European Commission 2021.
Thomas, G.E. (1993) Estimating annual total heron population counts. Appl. Statistics 42: 473-486.
Ward, E.J., Holmes, E.E., Thorson, J.T. and Collen, B., 2014. Complexity is costly: a meta‐analysis of parametric and non‐parametric methods for short‐term population forecasting. Oikos, 123(6), pp.652-661.
Underhill, L.G. & Prŷs-Jones, R. (1994) Index numbers for waterbird populations. I. Review and methodology. J. Appl. Ecol., 31, 463-480.
Contributors
Lead authors: Volker Dierschke, Stefano Marra, Matt Parsons, Marco Fusi
Supporting authors: Graham French
Supported by: The Joint OSPAR/HELCOM/ICES Expert Group on Seabirds (JWGBIRD), Intersessional Correspondence Group on the Coordination of Biodiversity Assessment and Monitoring (ICG-COBAM), and OSPAR Biodiversity Committee (BDC)
Citation
Dierschke, V., Marra, S., Parsons, M., Fusi, M., French, G. 2022. Marine Bird Abundance. In: OSPAR, 2023: The 2023 Quality Status Report for the North-East Atlantic. OSPAR Commission, London. Available at: https://oap.ospar.org/en/ospar-assessments/quality-status-reports/qsr-2023/indicator-assessments/marine-bird-abundance
| Assessment type | Indicator Assessment |
|---|---|
| Summary Results | https://odims.ospar.org/en/submissions/ospar_birds_abund_msfd_2022_06/ |
| SDG Indicator | 14.2 By 2020, sustainably manage and protect marine and coastal ecosystems to avoid significant adverse impacts, including by strengthening their resilience, and take action for their restoration in order to achieve healthy and productive oceans |
| Thematic Activity | Biological Diversity and Ecosystems - Targeted actions for the protection and conservation of species, habitats and ecosystem processes |
| Relevant OSPAR Documentation | Agreement 2016-09 CEMP Guideline: Common Indicator – Marine Bird Abundance (B1) |
| Date of publication | 2022-06-30 |
| Conditions applying to access and use | https://oap.ospar.org/en/data-policy/ |
| Data Snapshot | https://odims.ospar.org/en/submissions/ospar_birds_abund_snapshot_2022_06/ |
| Data Results | https://odims.ospar.org/en/submissions/ospar_birds_abund_results_2022_06/ |