

Wide-scope target and suspect screening of emerging contaminants and their transformation products in marine biota samples from the North-East Atlantic
Introduction
Human activities at sea and on land as well as the emerging threats of climate change put considerable pressures on marine ecosystems. Anthropogenic contaminants reach the marine environment primarily from terrestrial sources but can also arise from sea-based activities such as shipping, fishing, exploration and extraction of oil and gas or other minerals, or the harnessing of offshore energy resources (Tornero & Hanke 2016).
Routine monitoring programmes such as those completed under the Water Framework Directive and the Regional Seas Conventions, provide the provisions against pollution of marine waters by chemical substances. Additionally, the Marine Strategy Framework Directive (MSFD, 2008/56/EC) aims to provide an integrative marine environment status assessment and considers both coastal and offshore environment. The identification of substances that are not listed as WFD PS (priority substances) or RBSP (river basin-specific pollutants), but that entail a significant risk to the marine environment is part of the provisions under the MSFD (Commission Decision 2017/848/EU).

Figure 1: Schematic illustrating the complexity of myriad compounds in the marine ecosystem
Monitoring programmes to support these mandates are generally very targeted in nature. While targeted programmes provide valuable information on the presence and often the potential for deleterious effects relative to a variety of Environmental Criteria / Threshold values for specific lists of priority substances, they cannot deliver information on the myriad range of substances that may be present in the environment. Many of these chemicals and chemical mixtures have now been characterised as contaminants of emerging concern (CECs).
In 2020, the OSPAR Working Group on Monitoring and on Trends and Effects of Substances in the Marine Environment (MIME) set up a collaborative project entitled CONnECT (CONtaminants of Emerging Concern and Threat in the marine environment) which aimed to complete the first coordinated target and suspect screening of CECs in the OSPAR maritime area.
This collaboration, including the NORMAN Association (Primarily the Laboratory of Analytical Chemistry of the National and Kapodistrian University of Athens (NKUA) and the Environment Institute (Slovak Republic)), aimed to deliver a “one-stop-shop” approach of integrated services comprising screening of several thousands of organic pollutants and their transformation products by wide-scope target (>2 400 substances) and suspect (>65 000 substances) screening methodologies coupled with risk assessment profiling to evaluate the extent and range and potential risk associated with contaminants of emerging concern in OSPAR marine matrices.
For this purpose, 52 samples including biota (mainly molluscs and fish) and 2 sediments from 11 OSPAR Contracting Parties were delivered to NKUA for analysis. Organic contaminants were extracted from the matrices following generic analytical protocols and the final extracts were analysed by complimentary Liquid Chromatography (LC) or Gas Chromatography (GC) High Resolution Mass Spectrometry (HRMS) techniques. The detected pollutants include historically monitored parameters such as PCBs and PAH in addition to the CECs were prioritised on the basis of their frequency of occurrence in the samples and exceedance of ecotoxicological thresholds using the prioritisation scheme utilised by the Network of reference laboratories, research centres and related organisations for monitoring of emerging environmental substances (NORMAN) Network. The integrated approach utilising NORMAN prioritisation approaches as employed in this study is increasingly being recognised by the EU and regional seas conventions as being of importance for identifying potential contaminant threats to the aquatic environment. In December 2020, in support of this collaboration, OSPAR became an Associate Member of the NORMAN Association.
Key objectives of the study were to complete;
- Wide-scope target screening for >2 400+ substances (LC-HR-MS, LC-MS-MS and GC-APCI-HR-MS);
- Suspect screening of 65 000+ compounds including their semi-quantification using LC-HR-MS and GC-APCI-HR-MS;
- Non-target data => NORMAN Digital Sample Freezing Platform (DSFP) for retrospective screening.
- The first (geographically extensive) comprehensive target and suspect screening analysis of pollutants of emerging concern in biota from OSPAR marine waters.
- Upload of the LC-HR-MS and GC-APCI-HR-MS chromatograms into NORMAN Digital Sample Freezing Platform (DSFP) for retrospective screening.
- Prioritisation of detected compounds in order to assess results of the screening for their environmental toxicological relevance.
- Reporting on the occurrence of targeted substances including heatmaps on presence of suspect compounds.
- Identification of substances not currently listed under e.g., WFD PS or RBSP or OSPAR’s LCPA and/or LSPC that may entail a significant risk to the marine environment (as provided for under the MSFD.
- Assessment of the readiness of integrated analytical screening and ecological assessment and prioritisation techniques to support future OSAPR contaminant monitoring goals.
- Generation of lists of potential contaminant threats at both a local Contracting Party level but also on an OSPAR regional basis.
- Generation of CEC data to support MIME activities in the area of future prioritisation.
- Supporting OSPAR’s vision of a clean, healthy and biologically diverse North-East Atlantic, which is productive, used sustainably and resilient to climate change and ocean acidification.
Sample collection and analysis
In total 52 samples (38 molluscs, 10 fish, 1 egg, 1 arthropod and 2 sediments) were analysed as part of the project, see associated coordinates and sample information in Annex 1. A total of 11 OSPAR Contracting Parties collaborated on the pilot project with funding provided by the individual Contracting Parties. Species and sample codes are listed in Annex 1 and locations are graphically represented in Figure 2.
Sample Preparation and analysis
Biota samples were provided either as fresh tissues samples which were lyophilized (and homogenized prior to analysis) or as freeze-dried material. Sediment samples were received as dried material. As different physico-chemical properties exist for the wide range of both historically monitored contaminants and contaminants of emerging concern (CECs) that were analysed for, two generic sample preparation methods per sample were followed. NORMAN’s sample preparation protocols were followed using Accelerated Solvent Extraction (ASE) and Solid Phase Extraction (SPE) to prepare biota and sediment samples for subsequent instrumental analysis. More polar, less volatile and thermally unstable compounds were extracted by a method specific for LC-amenable compounds, whereas a different sample preparation method was followed for the extraction of more volatile and thermostable Gas Chromatography (GC)-amenable compounds.
Wide-scope target, suspect (semi-quantitative) and non-target (NTS) screening followed using liquid (LC) and gas chromatography (GC) coupled with RPLC-ESI-QTOF and GC-APCI-QTOF high resolution mass spectrometry (HRMS), (See Figure 3 and extended analytical protocols in Annex 2).

Figure 2: Geographic representation of sampling locations and biota type

Figure 3: Summary schematic of analytical procedures
Data analysis: Wide-scope target screening
Target screening was performed with the use of the NORMAN in-house developed databases of 2 411 contaminants https://www.norman-network.com/nds/SLE/ (https://doi.org/10.5281/zenodo.3723478). The Screening Detection Limit (SDL) was established as the lowest concentration level tested for which a compound is detected in all spiked samples, at the expected retention time and with specific mass error of the precursor ion. Compound-specific validation was performed for quantification purposes of the compounds detected with the screening method. Compound-specific limit of detection (LOD) and limit of quantification (LOQ) values were calculated after the treatment and analysis of samples spiked with the detected compounds and structure-related isotope labelled compounds. Contaminants that were detected in traces below the LOQ (concentration levels between the LOD and LOQ values) were reported as BQL (below the quantification limit). For statistical treatment of the results, substitution of BQL with LOQ/2 may be performed, as indicated by the QA/QC Directive (2009/90/EC).
Data analysis: Suspect screening
Suspect screening (>65 000 compounds) was performed for environmentally relevant pollutants from the NORMAN Substance Database (SusDat; https://www.norman-network.com/nds/susdat/). Mass accuracy was estimated at below 2 mDa run for ions with m/z 50-1 000. All raw chromatograms and supporting meta-data were imported into the NORMAN Digital Sample Freezing Platform (DSFP) (http://www.norman-data.eu/) - a novel tool developed for revealing the presence of suspects and identification of unknown compounds in environmental samples, enabling the potential to further screen data in the future, without the need to rerun samples.
Risk Assessment methodologies
PNEC values for biota were derived from existing PNECs for freshwater (PNECfw; available in the NORMAN Ecotoxicity Database for 64,447 NORMAN SusDat compounds; see also https://www.norman-network.com/nds/ecotox/), using the equation
PNECfw*BCF (for fish)
and
PNECfw*BCF/4 (for molluscs);
where BCF is the bioconcentration factor for fish from the US EPA CompTox Database (for values, see NORMAN Substance Factsheets at https://www.norman-network.com/nds/factsheets/).

Figure 4: Example schematic of NORMAN Risk assessment and prioritisation processes, incorporating Risk assessment – exceedance of PNEC/EQS values, Hazard assessment – PBMT, CMR, ED scores and Exposure assessment – Frequency of Appearance/Detection; annual production, widespread of use
Results and discussion
Wide-scope screening of CONnECT biota and sediment samples
Analysis of all biota and sediment samples was separated into TARGET (2411 substances) and SUSPECT (>65 000 substances) screening (see Figure 3), subsequent to the screening exercise separate risk assessments were completed.
OSPAR Contracting Parties provided a range of species for the pilot study. Molluscs (mainly blue mussels, Mytilus edulis), followed by fish samples from Denmark, Ireland and the Netherlands, were the dominant sample biota types. Overall, 125 contaminants were determined during target screening (of 2 411 compounds) of the 50 biota samples tested.
For the purposes of later risk assessment results of analyses for all samples were expressed in μg/kg wet weight. Detailed data on the frequency of detection, risk assessment for molluscs (38 samples) and fish (10 samples) and detected concentration ranges in CONnECT biota samples are provided in Annex 3. Based on the available information about substances’ main use, chemical class or application, a main use category (e.g., plant protection product (PPP), pharmaceutical etc.) was proposed for each compound, although it is clear that some compounds may have multiple uses. Quantified and/or semi-quantifiable LOD and LOQ values are reported in supporting annexes.
The risk associated with the exceedance of toxicity threshold values was assessed by comparing the measured concentrations with the combined use of environmental quality standards (EQS) for biota (Directive 2013/39/EU) and predicted no-effect concentration (PNEC) values from the NORMAN Ecotoxicology Database (https://www.norman-network.com/nds/ecotox/lowestPnecsIndex.php). For some compounds risk assessment could not be performed since EQS and PNEC values were not available. Compounds whose concentrations were below the method’s Screening Detection Limit (0,254 μg/kg wet weight) are listed in Annex 3.
The most frequently detected class of compounds, was industrial chemicals including PAHs (n=13), PFAS (n=12), PCBs (n=5) with other compounds (n=16) such as phenols, benzotriazoles and surfactants also detected. Six detected antipsychotic and antidepressant drugs were present mainly in molluscs but with a relatively low overall Frequency of Appearance (FoA) of (0,021-0,083) while the sweeteners aspartame, saccharine and acesulfame were detected at BQL levels mainly in molluscs.
Most of the detected compounds could be classified as industrial chemicals (n=46) and/or personal care products, pharmaceuticals and their transformation products (TPs) (n=39). Other categories including antipsychotic and antidepressant drugs, plant protection products and their TPs, stimulants and their TPs, and sweeteners were also detected overall accounting for 28% of the detected compounds (n=33). Methylparaben, an anti-fungal agent often used in a variety of cosmetics and personal care products, was the most frequently detected compound (occurring in 46 samples, with a FoA score of 0,958). The occurrence of the parabens group of compounds in biological tissues are now being reported in a number of biomonitoring studies. Given their widespread application in everyday consumer products, there is considerable potential for the inadvertent cross-contamination of environmental samples such as those analysed in CONnECT. The potential for artefact introduction for parabens (and other similar common-use chemicals) needs to be fully resolved during screening project results evaluation, this being an important aspect in supporting risk assessment and on the potential development of future monitoring. The polycyclic aromatic hydrocarbons pyrene, anthracene and chrysene and 4-acetamido-antipyrine, metabolite of the opioid analgesic meptazinol, also presented high frequency of detection across the tested samples (FoA: 0,815, 0,625, 0,565 and 0,565, respectively). Overall, 23 compounds (mainly industrial chemicals) were detected in ≥10 samples (FoA ≥0,208).
On average 16 organic compounds were detected (i.e., detections plus BQL) in molluscs, with the highest number (n=32) observed in a blue mussel sample from France (Villerville), collected at the mouth of the Seine River. Between 7 to 20 compounds were detected in fish species from the Netherlands and Denmark. Most of the compounds were detected at BQL levels or at concentrations below 60 μg/kg w.w. Compounds including, sotalol, PCB-138, N,N-dimethyldodecylamine N-oxide and methylparaben (see above re potential for cross-contamination), reached maximum concentrations of 63.8, 73.2, 165 and 719 μg/kg w.w., respectively.
Seven compounds, (not listed in Annex 3), were detected only in prawn (flesh) and in a higher trophic level egg of Guillemot (both from Ireland). These included the pharmaceuticals flunisolide, 4-formylamino-antipyrine and N-acetyl mesalazine, the plant protection products dinoterb and pentachlorobenzene, the stimulant hydroxy-cotinine. Since these matrices differ from the main study species values were not reported for these compounds; however, their presence is important to note for future expanded studies.
Wide-scope target screening of sediments samples
Two sediment samples (<0,063 µm) originating from the North Sea, were provided by the Federal Maritime and Hydrographic Agency (Bundesamt für Seeschifffahrt und Hydrographie, BSH) in Germany. Overall, 21 compounds were detected in the tested samples, including 12 industrial chemicals (mainly polycyclic aromatic hydrocarbons (PAHs), 6 personal care products and pharmaceuticals, and 3 plant protection products and their TPs. The results of analysis and related risk assessment are shown in Annex 6.
Two thirds of the detected compounds (n=14, see blue text in Annex 6) were also detected in at least one biota sample. The silty sediment (sample #33; see Annex 1) was found to be more contaminated compared to the sandier sample (#34) both in terms of total number of detected compounds (n=21 and 11 in sample #33 and #34, respectively), and on the cumulative concentration of detected organic compounds (513 and 279 μg/kg in sample #33 and #34, respectively).
Compounds detected only in sediment sample #33 were mainly pharmaceuticals. Detected concentrations ranged from 0.587 (4,4-DDE in #33) to 75.9 μg/kg (fluoranthene in CONnECT #34). The SDL for the non-detected compounds was 5,0 and 0,3 μg/kg for the LC- and GC- amenable compounds, respectively.
Suspect screening of all CONnECT biota and sediment samples
Overall, 134 contaminants were detected in the 52 tested samples. The majority of the substances (n=49) were classified as industrial chemicals. Most of the industrial chemicals detected are included in the European Chemicals Agency (ECHA) database, indicating wide production of these chemicals in the EU.
A few characteristic examples are [2-(acryloyloxy)ethyl]trimethylammonium, ethyl 2,4-dimethylbenzoate, hexahydrophthalic anhydride, tris(2,4-di-tert-butylphenyl) phosphite, acetyl tributyl citrate, 12-oxooctadecanoic acid, octanedioic acid, dioctyl hexanedioate, tridecanedioic acid and diacetone acrylamide (all compounds produced at between 10,000-100,000 annual tonnage).
Annex 7 presents the substance NORMAN ID, common compound name, level of identification, CAS number and Std. InChIKey. Substances were grouped based on their Use Category (see Annex 7).
12 out of the 134 substances were identified at the level of probable structure by library spectrum match (NORMAN classification Level 2A) whereas other compounds were identified at the level of tentative candidates (Level 3). 38 compounds were detected with frequency of appearance (FoA) higher than 50%.
The biota sample with the highest number of detected suspected compounds (n=72) Ostrea edulis from the North Sea (the Netherlands) followed by a blue mussel sample from Kinvara in Ireland (n=71). One Danish fish sample (CONnECT #20 from outside Aarhus) contained the lowest number of detected suspects (n=11). In suspect screening, mollusc samples contained on average 54 compounds whereas fish samples contained on average 41 compounds.
Detected substances as well as their concentration (logarithmic scale) can be presented in the form of “heat-maps” to support visualisation where compounds with highest FoA are presented on the top of the heatmap, (see Annex 8). The highest FoA was observed for the industrial chemical 2-propen-1-yl 2-(cyclohexyloxy)acetate (e.g., used as a fragrant) with annual production tonnage 100-1000, and the (intermediate in chemical and pharmaceutical synthesis) 4-piperidone and the vitamin C metabolite threonate.
In sediments 37 and 33 compounds were detected in North Sea sediment samples (#33 and #34 respectively). The highest concentration was observed for the coating and plasticiser intermediates diacetone acrylamide (220-250 μg/kg d.w.) and acetyl tributyl citrate (ATBC), both of which are produced at high tonnage (1 000-10 000 and 10 000-100 000 t/a, respectively). High concentration levels were also observed for two phthalate esters: diisobutyl phthalate (110-180 μg/kg d.w.) and isodecyl undecyl phthalate (100-120 μg/kg d.w.); and the surfactant pentaethylene glycol (50-100 μg/kg d.w.). Similar to the parabens group of compounds the potential for cross-contamination (e.g., for ATBC) in screening studies needs to be considered. All other substances were detected at concentration ranges below 80 μg/kg d.w. and the majority of them (31 compounds) below 10 μg/kg d.w.
Risk assessment of TARGET analysis in all CONnECT biota and sediment samples
Due to the relatively limited number of biota samples (n=50) only a simplified risk assessment of individual contaminants was feasible based on exceedance of available (PNEC and EQS) toxicity threshold values. It should be noted that for several compounds either PNECs or BCFs were not available and, consequently, no risk assessment could be carried out. In cases where contaminants were detected at BQL levels, LOQ/2 concentration was used for risk estimation. Such outcomes also suggest that there is a need for more sensitive analytical method for these specific analytes (see Annex 9). Analyses of 38 molluscs samples revealed the presence of 63 compounds that exceeded their ecotoxicological threshold value in at least one sample. Most of the compounds exceeded their PNEC values (Frequency of Exceedance; FoE) in less than 10 samples (0,24).
Methylparaben (used e.g., as an anti-fungal in cosmetics) was highest in the rankings. Its presence and risk evaluation categorises it as potentially of high environmental concern, as its concentration exceeded the PNEC value in 36 of 38 mollusc samples. Butylparaben was detected at concentration levels above its PNEC in 12 samples. Parabens are in widespread use in our everyday lives and as noted previously the potential for inadvertent cross-contamination of samples needs consideration during such risk assesmsnets. There would be merit for more focused evaluation (e.g., via more focused / targeted analysis) for these compounds. The currently regularly monitored PAHs, pyrene, anthracene and chrysene exceeded their ecotoxicological threshold in 35, 29 and 27 samples respectively, indicating the importance of ongoing monitoring for such well known pollutants.
A full listing of the risk assessment (target analysis) results for compounds exceeding their PNEC values in molluscs plus fish (n=48 samples) including maximum detected concentrations lowest PNEC used in the assessment and final risk score (Sum of FoA+FoE+EoE) is presented in Annex 3. Separate risk assessments for molluscs (n=38) and fish (n=10) are compiled in Annexes 4 and 5 respectively.
Regarding the Extent of PNEC Exceedance (EoE), EoE=1 was observed for 4 compounds (pilocarpine, perfluorooctanesulfonamide (PFOSA), lopinavir and reproterol), whereas the highest final risk score was calculated for methylparaben (see Annex 3). For the majority of the compounds exceeding their PNECs (68%), the maximum detected concentrations were up to 60-fold higher compared to their respective PNECs. The maximum detected concentrations of perfluorooctanesulfonamide (PFOSA), the pharmaceutical lopinavir and darunavir, reproterol (e.g., use in asthma spray), pilocarpine (surface disinfectant), the PAH, pyrene and methylparaben exceeded their ecotoxicological thresholds by three orders of magnitude, indicating a potential high environmental risk.
One should note that the lowest PNECs for the majority of the aforementioned compounds used for the risk assessment were at low-ppb and ppt levels. A careful scrutiny of the ecotoxicological threshold values and further experimental toxicity evidence is suggested to support the outcomes of this risk assessment (see Annex 9).
Twenty compounds exceeded their respective PNEC values in the ten fish samples (See Annex 5), of these, twelve substances showed exceedance of PNEC only in one sample. Octocrylene, darunavir, perfluorooctanoic acid (PFOA), and lauryl diethanolamide exceeded their ecotoxicological threshold value in 3 samples, while the detected concentrations in 2 fish samples were above the respective PNEC for perfluorodecanoic acid (PFDA). The antidepressant venlafaxine, that is included in the EU Watch List of 2020 (EU 2020/1161) was detected in one fish sample at concentration levels exceeding its PNEC by 5-times.
An EoE score =>0,20 was observed for six compounds, while the maximum risk in fish was again presented by methylparaben, having the maximum FoA and FoE among all compounds. The maximum detected concentration for perfluorooctanesulfonamide (PFOSA), was 2 orders of magnitude higher than its respective PNEC. It should be noted that the PNEC is at ng/Kg level. LOQ/2 concentration levels were used for some compounds. The use of more sensitive analytical methods, with LODs lower than respective PNECs, and more extensive sampling strategy for fish across OSPAR countries would be recommended to support a conclusive and robust risk assessment (see Annex 9).
Overall, 21 compounds were detected in the two sediment samples analysed. Twelve industrial chemicals (mainly polycyclic aromatic hydrocarbons (PAHs)), 6 personal care products and pharmaceuticals, and 3 plant protection products and their TPs were identified. Only one out of the 21 detected contaminants in the two sediments from Germany (CONnECT #33-#34) exceeded its respective EQS. The maximum detected concentrations for anthracene were 2 orders of magnitude higher than the respective PNEC in both samples. Benzotriazole (BTR) and dimethyl phthalate were detected at BQL levels that are higher than the respective PNECs, suggesting that a more sensitive method for their determination might be required.
Risk assessment of SUSPECT screening in biota and sediments
Risk assessment of suspect screening data was conducted using the same methodology as in target screening with the only difference being that suspect screening produced semi-quantitative concentration levels. The purpose of the risk assessment was to rank the detected suspects based on their potential risk. To perform risk assessment, PNECs were retrieved from the NORMAN Ecotoxicology database. Derivation of PNEC was not successful for 30 substances and thus these substances were not included in the risk assessment. For risk assessment purposes, the lowest PNEC was selected in the order of:
(a) EQS values;
(b) experimental PNEC values from reference laboratories;
(c) in silico predicted PNEC. The priority was evaluated based on three indicators:
(i) Frequency of Appearance (FoA);
(ii) Frequency of PNEC Exceedance (FoE), and
(iii) Extent of PNEC Exceedance (EoE).
The first indicator expresses in how many sites the compound was detected above the limit of detection (LOD). The second indicator considers the frequency of monitoring sites with observations of a compound above a certain effect threshold. For the calculation of this indicator, a compound’s maximum observed concentration at each site (MECsite) is compared to the lowest PNEC. Subsequently, the number of sites where the threshold was exceeded was divided by the total number of sites where the respective compound was monitored.
The third indicator ranks compounds with regard to the extent of the effects expected. It is defined as the 95th percentile of all MECsite values per compound (MEC95) divided to the PNEC. The resulting hazard ratio was then scaled from 0 to 1.
The Risk Score is the linear combination of the indicators scaled from 0 to 1. On completion, the compounds were ranked based on their risk. Top prioritised compounds were the pharmaceutical 5'-methylthioadenosine, the PPP kinoprene, the industrial chemical 2,4,6-tris(1-methylethyl)benzoic acid, the PPP empenthrin and the industrial chemicals 2-naphthyl laurate and 12-oxooctadecanoic acid (see Annex 7).
A similar risk prioritisation algorithm was applied only for the two sediment samples. Compounds exhibiting the highest concentration levels also showed the highest risk score. Only compounds with total Risk score >1,0) are presently listed. The top-ranking substances (Ethyl 2,4-dimethylbenzoate, Tris(2,4-di-tert-butylphenyl) phosphite, Hexahydrophthalic anhydride, Acetyl tributyl citrate and 2,4,6-Tris(1-methylethyl)benzoic acid) may be of concern and deserve further attention as candidates for regulatory monitoring.
Data perspectives
The wide-scope screening data organised in NORMAN Data Collection Templates were uploaded into the LIFE APEX Database System (https://www.norman-network.com/apex/lacod/; a part of the NORMAN Database System), currently accessible only to the project partners and sample providers. A dedicated area was created for OSPAR’s MIME Working Group members. In the end of the LIFE APEX project the data are planned to be transferred to the open access NORMAN Database System – EMPODAT database (https://www.norman-network.com/nds/empodat/).
It is recommended to store data systematically from further screening campaigns of OSPAR countries in the NORMAN Database System (https://www.norman-network.com/nds/ ), which will allow for their review in comparison with data from other European countries and North America. Also, it is recommended to encourage OSPAR’s MIME Working Group to provide NORMAN with commonly agreed biota and sediments ecotoxicity threshold values (PNECs) for as many substances as possible. This is to facilitate more precise prioritisation.
Additional efforts are taking place within NORMAN to develop a specific prioritisation scheme taking into account model-predicted PBT (persistence, bioaccumulation, toxicity) values for all substances listed in the Substance Database (https://www.norman-network.com/nds/susdat/). Once ready, they can be re-applied on the substances identified in the analysed samples in the current screening/monitoring programmes. Also, there is an ongoing discussion with the European Chemicals Agency (ECHA) to increase the importance of environmental occurrence data in the substance evaluation scheme and receiving feedback on which of the REACH substances (including their transformation products) might be preferably targeted in the updated WFD and MSFD monitoring schemes.
Conclusions and recommendations
A wide-scope target and suspect screening of 52 samples i.e., 50 biota (48 molluscs and fish, one sea bird egg and one prawn) and 2 sediment samples from 11 OSPAR Contracting Parties was carried out by LC-ESI-HR-MS and GC-APCI-HR-MS techniques. The wide-scope target screening comprised analysis of 2 411 targeted substances in each sample, with additional suspect screening providing information on presence/absence (and semi-quantitative estimates) of a further 65 690 substances. PNEC biota values from the NORMAN Ecotoxicology Database, derived from the freshwater PNECs, were used for the risk assessment.
Overall, 125 contaminants were determined in the 50 tested biota samples. Most of the detected compounds in 48 molluscs and fish samples were industrial chemicals (n=46) and personal care products, pharmaceuticals and their TPs (n=39). Other categories included antipsychotic and antidepressant drugs, plant protection products and their transformation products, stimulants and products, and sweeteners. The non-routinely monitored compound, methylparaben (an anti-fungal agent often used in a variety of cosmetics and personal care products), was the most frequently detected compound (in 46 samples), whereas the regularly monitored polycyclic aromatic hydrocarbons pyrene, anthracene and chrysene and 4-acetamido-antipyrine, metabolite of the opioid analgesic meptazinol, presented high frequency of detection across the tested samples. The latter grouping indicating the importance of continued monitoring of “historic” contaminants.
Due to the relatively limited number of samples only a simplified risk assessment of individual contaminants could be carried out based on exceedance of available toxicity threshold values. PNEC values for biota were derived from existing PNECs for freshwater available in the NORMAN Ecotoxicity Database for 64 447 NORMAN SusDat compounds.
Analyses of 38 molluscs samples revealed the presence of 63 compounds, which exceeded their ecotoxicological threshold value in at least one sample whereas 20 compounds exceeded their respective PNEC values in the 10 analysed fish samples.
Overall, 21 compounds were determined in the two sediment samples, including 12 industrial chemicals (mainly polycyclic aromatic hydrocarbons (PAHs)), 6 personal care products and pharmaceuticals, and 3 plant protection products and their TPs. Only one of the detected contaminants (anthracene) exceeded its respective EQS.
Suspect screening revealed a presence of 134 contaminants (in addition to the determined wide-scope target substances) in the 52 tested samples. The majority of the substances (49) were classified as industrial chemicals. Most of the detected industrial chemicals are included in the ECHA database, indicating wide production of these chemicals in the EU.
The sample with the highest number of detected suspected compounds (72) was Ostrea edulis from the North Sea (Netherlands) followed by Mytilus edulis sample from Ireland (71). The sample with the lowest number of detected suspects (11) was the fish sample from Denmark (CONnECT #20). Molluscs and fish samples contained on average 54 and 41 compounds, respectively.
Using the same prioritisation procedure as for wide-scope target screening, top ranking compounds were the pharmaceutical 5'-methylthioadenosine, PPP kinoprene, industrial chemical 2,4,6-tris(1-methylethyl)benzoic acid, PPP empenthrin and industrial chemicals 2-naphthyl laurate and 12-oxooctadecanoic acid.
A total of 37 and 33 compounds were detected in the two sediment samples. The highest concentration was observed for diacetone acrylamide (220-250 μg/kg d.w.) and acetyl tributyl citrate, both of which are produced at high tonnage (1 000-10 000 and 10 000-100 000 t/a, respectively). High concentration levels were also observed for two phthalate esters: diisobutyl phthalate (110 180 μg/kg d.w.) and isodecyl undecyl phthalate (100-120 μg/kg d.w.); and the surfactant pentaethylene glycol (50-100 μg/kg d.w.).
All LC-HR-MS and GC-APCI-HR-MS chromatograms were uploaded into the NORMAN DSFP and they are available for retrospective screening for any compound detectable by those techniques without the need for additional sampling and analysis. Access to these data is restricted only to the persons identified as eligible by OSPAR’s MIME Working Group.
References
Aalizadeh, Reza and Alygizakis, Nikiforos A. and Schymanski, Emma L. and Krauss, Martin and Schulze, Tobias and Ibáñez, María and McEachran, Andrew D. and Chao, Alex and Williams, Antony J. and Gago-Ferrero, Pablo and Covaci, Adrian and Moschet, Christoph and Young, Thomas M. and Hollender, Juliane and Slobodnik, Jaroslav and Thomaidis, Nikolaos S., Development and Application of Liquid Chromatographic Retention Time Indices in HRMS-Based Suspect and Nontarget Screening, Analytical Chemistry 93, 33 (2021), 11601-11611. Available at: https://pubs.acs.org/doi/10.1021/acs.analchem.1c02348
Andreas Androulakakis, Nikiforos Alygizakis, Georgios Gkotsis, Maria-Christina Nika, Varvara Nikolopoulou, Erasmia Bizani, Elizabeth Chadwick, Alessandra Cincinelli, Daniela Claßen, Sara Danielsson, Rene W.R.J. Dekker, Guy Duke, Natalia Glowacka, Hugh A.H. Jansman, Oliver Krone, Tania Martellini, Paola Movalli, Sara Persson, Anna Roos, Emily O'Rourke, Ursula Siebert, Gabriele Treu, Nico W. van den Brink, Lee Anthony Walker, Rob Deaville, Jaroslav Slobodnik, Nikolaos S. Thomaidis, Determination of 56 per- and polyfluoroalkyl substances in top predators and their prey from Northern Europe by LC-MS/MS, Chemosphere, Volume 287, Part 2, 2022, 131775. Available at: https://www.sciencedirect.com/science/article/pii/S0045653521022475
Dulio, V., Koschorreck, J., van Bavel, B. et al. The NORMAN Association and the European Partnership for Chemicals Risk Assessment (PARC): let’s cooperate!. Environ Sci Eur 32, 100 (2020). Available at: https://doi.org/10.1186/s12302-020-00375-w.
Liška, I., Wagner, F., Sengl, M., Deutsch, K., Slobodník, J., Paunovic, M. (eds.) (2021). Joint Danube Survey 4 Scientific Report: A Shared Analysis of the Danube River. International Commission for the Protection of the Danube River, Vienna. ISBN: 978-3-200-07450-7. Available at: http://www.danubesurvey.org/jds4/publications/scientific-report
Nikiforos A. Alygizakis, Peter Oswald, Nikolaos S. Thomaidis, Emma L. Schymanski, Reza Aalizadeh, Tobias Schulze, Martina Oswaldova, Jaroslav Slobodnik, NORMAN digital sample freezing platform: A European virtual platform to exchange liquid chromatography high resolution-mass spectrometry data and screen suspects in “digitally frozen” environmental samples, TrAC Trends in Analytical Chemistry, Volume 115, 2019, Pages 129-137. Available at: https://www.sciencedirect.com/science/article/pii/S0165993619300354
Pablo Gago-Ferrero, Anna A. Bletsou, Dimitrios E. Damalas, Reza Aalizadeh, Nikiforos A. Alygizakis, Heinz P. Singer, Juliane Hollender, Nikolaos S. Thomaidis, Wide-scope target screening of >2000 emerging contaminants in wastewater samples with UPLC-Q-ToF-HRMS/MS and smart evaluation of its performance through the validation of 195 selected representative analytes, Journal of Hazardous Materials, Volume 387, 2020, 121712. Available at: https://www.sciencedirect.com/science/article/pii/S0304389419316668
Slobodnik, J., Alexandrov, B., Komorin, V., Mikaelyan, A., Guchmanidze, A., Arabidze, M., Korshenko, A. National Pilot Monitoring Studies and Joint Open Sea Surveys in Georgia, Russian Federation and Ukraine, 2017. Available at: https://emblasproject.org/wp-content/uploads/2019/07/EMBLAS-II_NPMS_JOSS_2017_ScReport_ANNEXES-1-7_FinDRAFT2.pdf
Slobodnik, J., Hollender, J., Schulze, T. et al. Establish data infrastructure to compile and exchange environmental screening data on a European scale. Environ Sci Eur 31, 65 (2019). Available at: https://doi.org/10.1186/s12302-019-0237-6.
# | Latitude | Longitude | Species | Country | Location | Institution |
1 | 57.321 | -1.993 | Mytilus edulis | Great Britain | Ythan | Marine Scotland - Science, Scottish Government |
2 | 57.133 | -2.067 | Mytilus edulis | Great Britain | Aberdeen | Marine Scotland - Science, Scottish Government |
3 | 53.52143 | 8.24118 | Mytilus edulis | Germany | Eckwarderhörne | German Environmental Specimen Bank |
4 | 53.02428 | 8.43895 | Mytilus edulis | Germany | Königshafen | German Environmental Specimen Bank |
5 | 53.52143 | 8.24118 | Mytilus edulis | Germany | Eckwarderhörne | German Environmental Specimen Bank |
6 | 53.52143 | 8.24118 | Mytilus edulis | Germany | Eckwarderhörne | German Environmental Specimen Bank |
7 | 58.60333 | 11.24583 | Mytilus edulis | Sweden | Fjällbacka | Swedish Musuem of Natural History |
8 | 58.36694 | 11.45833 | Mytilus edulis | Sweden | Brofjorden | Swedish Musuem of Natural History |
9 | 50.67814 | -3.46498 | Mytilus edulis | Great Britain | Exeter | CEFAS |
10 | 51.51223 | 0.58461 | Mytilus edulis | Great Britain | Convey Island | CEFAS |
11 | 59.58711 | 5.15203 | Mytilus edulis | Norway | Espevær, Outer Bømlafjord | Norwegian Institute of Water Research |
12 | 59.88362 | 10.711 | Mytilus edulis | Norway | Gressholmen, Inner Oslofjord | Norwegian Institute of Water Research |
13 | 59.09511 | 11.13678 | Mytilus edulis | Norway | Singlekalven, Hvaler | Norwegian Institute of Water Research |
14 | 67.29631 | 14.39564 | Mytilus edulis | Norway | Bodø harbour | Norwegian Institute of Water Research |
15 | 52.20023 | -6.9704 | Crassostrea gigas | Ireland | Cheekpoint | Marine Institute |
16 | 53.85777 | -9.63723 | Mytilus edulis | Ireland | Clew Bay North | Marine Institute |
17 | 53.16428 | -8.95204 | Mytilus edulis | Ireland | Kinvara | Marine Institute |
18 | 56.001 | 7.01861 | Pleuronectes platessa | Denmark | Reference North Sea | Aarhus University |
19 | 56.16667 | 14.58333 | Pleuronectes platessa | Denmark | Reference Baltic | Aarhus University |
20 | 56.18556 | 10.98556 | Pleuronectes platessa | Denmark | Outside Aarhus, Denmarks 2. largest city | Aarhus University |
21 | 56.93359 | 9.55021 | Pleuronectes platessa | Denmark | Fjord close to Denmarks 6th largest city | Aarhus University |
22 | 55.5667 | 12.48346 | Pleuronectes platessa | Denmark | Harbour/Copenhagen | Aarhus University |
23 | 54.78349 | 10.55026 | Pleuronectes platessa | Denmark | Baltic Sea south of funen | Aarhus University |
24 | 55.98802 | 11.30045 | Mytilus edulis | Denmark | Reference North Sea | Aarhus University |
25 | 55.04695 | 14.69312 | Mytilus edulis | Denmark | Reference Baltic | Aarhus University |
26 | 57.07 | 9.95667 | Mytilus edulis | Denmark | Marina, Aalborg (third largest city in DK) | Aarhus University |
27 | 56.60268 | 10.2897 | Mytilus edulis | Denmark | Fjord from Denmarks largest river and sixt largest city of DK | Aarhus University |
28 | 55.25735 | 11.2 | Mytilus edulis | Denmark | Great Belt | Aarhus University |
29 | 55.66915 | 12.57632 | Mytilus edulis | Denmark | Copenhagen Harbour | Aarhus University |
30 | 55.19735 | 11.2592 | Mytilus edulis | Denmark | Industrial outlet | Aarhus University |
31 | 41.9702 | -8.88665 | Mytilus edulis | Spain | Oia | Instituto Espanol de Oceanofrafia |
32 | 42.21962 | -8.77673 | Mytilus edulis | Spain | Praia de Samil | Instituto Espanol de Oceanofrafia |
33 | 54.05 | 7.96667 | Sediment | Germany | North Sea | Bundesamt für Seeschifffahrt und Hydrographie, BSH |
34 | 54.83333 | 6.583333 | Sediment | Germany | North Sea | Bundesamt für Seeschifffahrt und Hydrographie, BSH |
35 | 43.37678 | 4.88429 | Mytilus galloprovincialis | France | Anse de Carteau 2 | Institut Français de Recherche pour l'Exploitation de la Mer (IFREMER) |
36 | 48.877667 | -1.769833 | Mytilus edulis | France | Chausey | Institut Français de Recherche pour l'Exploitation de la Mer (IFREMER) |
37 | 49.404078 | 0.123666 | Mytilus edulis | France | Villerville | Institut Français de Recherche pour l'Exploitation de la Mer (IFREMER) |
38 | 52.25 | 4.416667 | Flounder | Netherlands | Noordzeekust | Rijkswaterstaat, Ministry of Infrastructure and Water Management |
39 | 51.433333 | 3.95 | Flounder | Netherlands | Westerschelde | Rijkswaterstaat, Ministry of Infrastructure and Water Management |
40 | 53.383333 | 6.9 | Flounder | Netherlands | Eems-Dollard: Paap | Rijkswaterstaat, Ministry of Infrastructure and Water Management |
41 | 51.40475 | 3.96876 | Oysters | Netherlands | Westerschelde: Knuitershoek | Rijkswaterstaat, Ministry of Infrastructure and Water Management |
42 | 53.37458 | 6.90011 | Oysters | Netherlands | Eems-Dollard: Bocht van Watum | Rijkswaterstaat, Ministry of Infrastructure and Water Management |
43 | 51.40475 | 3.96876 | Oysters | Netherlands | Westerschelde: Knuitershoek | Rijkswaterstaat, Ministry of Infrastructure and Water Management |
44 | 53.37458 | 6.90011 | Oysters | Netherlands | Eems-Dollard: Bocht van Watum | Rijkswaterstaat, Ministry of Infrastructure and Water Management |
45 | 51.40475 | 3.96876 | Oysters | Netherlands | Westerschelde: Knuitershoek | Rijkswaterstaat, Ministry of Infrastructure and Water Management |
46 | 53.37458 | 6.90011 | Oysters | Netherlands | Eems-Dollard: Bocht van Watum | Rijkswaterstaat, Ministry of Infrastructure and Water Management |
47 | 54.229739 | -4.691501 | Atlantic cod | Ireland | Castletownbere | Marine Institute |
48 | 52.14882 | -6.99199 | Dublin Bay prawn | Ireland | Dunmore east | Marine Institute |
49 | 53.38731 | -6.11648 | Blue mussels | Ireland | Sutton | Marine Institute |
50 | 51.83151 | -8.30014 | Blue mussels | Ireland | Ringaskiddy | Marine Institute |
51 | 54.23102 | -8.56434 | Blue mussels | Ireland | Ballisodare | Marine Institute |
52 | 54.269234 | -8.75164032 | Guillemot egg | Ireland | Aughris Head Sligo | Marine Institute |
Sample collection and analysis
52 samples (38 molluscs, 10 fish, 1 egg, 1 arthropod and 2 sediments) were delivered from OSPAR contracting parties to NKUA Athens. The first batch of samples (CONnECT 1-32) was delivered from February to December 2020, while the second batch (CONnECT 33-46) from April to May 2021. Moreover, six biota samples were provided by the Irish Marine Institute in December 2019 (CONnECT 47-52). Species and sample codes are listed in Annex 1 and locations are graphically represented in Figure 2.
Sample Pre-treatment
Biota samples were provided either as fresh tissues samples which were lyophilized (at -55°C, 0.05 mbar) using a Telstar Lyoquest Freeze Dryer, and homogenized prior to analysis or as freeze-dried material where the percentage water content was provided by participants. These data were then used to express the results of biota on a wet weight (w.w.) to support final risk assessment.
Analysis of contaminants of emerging concern in biota samples
A simultaneous extraction of contaminants of contaminants considered as both legacy and of emerging concern (CECs) and legacy chemicals with different physico-chemical properties was carried out using generic sample preparation protocols. An Accelerated Solvent Extraction (ASE) and Solid Phase Extraction (SPE) were employed prior to the analysis with wide-scope target and suspect screening methodologies followed by liquid (LC) and gas chromatography (GC) coupled with high resolution mass spectrometry (HRMS).
Two generic sample preparation methods per sample were followed. More polar, less volatile and thermally unstable compounds were extracted by the method specific for LC-amenable compounds, whereas a different sample preparation method was followed for the extraction of more volatile and thermostable Gas Chromatography (GC)-amenable compounds, see details below.
Extraction of LC-amenable contaminants from biota samples
ASE was used for the extraction of CECs from the biota matrices, followed by a clean-up step using in-house mixed mode SPE cartridges. Individual steps of the sample preparation protocol are presented in Figure 5 and described below:
- 1 g of each sample was weighed and mixed with 4 g of samples’ dispersant sodium sulfate (Na2SO4), using mortar and pestle.
- A mix of isotopically labelled internal standards was spiked in each sample, and left in contact with the matrix for at least 30 min prior to the extraction. Representative compounds from different classes of the LC target list were selected.
- Samples were placed in ASA extraction cells (Figure 5) and the analytes were extracted using 60 ml Methanol: Acetonitrile (2:1) @50oC. Post extraction, where samples were not fully transparent, the extract was further filtered through a filter paper prior to pre-concentration using a rotary evaporator (at 40°C) to a final volume of 3-4 ml. Milli-Q water was added to adjust the final volume to 15 ml.

Figure 5: Samples extraction using Dionex ASE
Sample clean-up by SPE
Layered ‘mixed bed’ cartridges (see Figure 6) consisted of Oasis HLB (200 mg) and a mixture of Strata-X-AW (weak anion exchanger), Strata-X-CW (weak cation exchanger) and Isolute ENV+ (300 mg of total mixture). Conditioning of the cartridges was performed with 3 mL of methanol and 3 mL of Milli-Q water and then the samples were loaded in the SPE cartridges. The cartridges were dried by passing air through them for 0.5 to 1 h (applying vacuum facility in the SPE box; cartridges were visually inspected for complete dryness). The elution of the analytes from the adsorbent material was performed by a basic solution (6 mL of ethylacetate/methanol (50/50, v/v) containing 2% ammonia hydroxide (v/v)), followed by an acidic solution (4 mL of ethylacetate/methanol (50/50, v/v) containing 1.7% formic acid (v/v)).

Figure 6: Mixed-mode SPE cartridges used in sample clean-up
Post SPE clean-up the following steps were completed;
- The SPE extract was evaporated using nitrogen stream at 40-45°C till dryness.
- 250 μL of the mix of methanol (LC-MS grade) and Milli-Q water (50/50, v/v) were used for the final reconstitution of each sample and the reconstituted sample was homogenized using Vortex stirring for 1 min. During the sample preparation, approximately a 4-fold sample enrichment was achieved.
- The final extract was filtered through the Regenerated Cellulose (RC) filter (Chromafil - pore size: 0.2 μm; filter diameter: 15 mm), using a syringe, into a 2 mL glass vial with an insert placed inside. After the analysis by LC-ESI-QToF MS the vials were stored in the freezer at -80°C.

Figure 7: Sample preparation steps for LC amenable compounds
Extraction of GC-amenable contaminants from biota samples
ASE protocols for GC amenable compounds differed from those LC amenable compounds. Individual steps of the sample preparation for the determination of GC-amenable compounds are presented in Figure 8 and as summarised below:
- 1 g of each sample was weighed and mixed with 4 g of samples’ dispersant sodium sulphate (Na2SO4) using mortar and pestle.
- A mix of isotopically labelled internal standards was spiked into each sample, and left in contact with the matrix for at least 30 min prior to the extraction. Representative compounds from different classes of the GC target list of NKUA were selected.
- The analytes were extracted by ASE (Dionex™ ASE™ 350, Thermo Fisher Scientific).
- A solvent mixture of Hexane:Dichloromethane (2:1) was employed with extraction completed at 100oC.

Figure 8: Sample preparation protocol for GC-amenable compounds
Similar to LC amenable compounds where samples were not fully transparent after extraction, the extract was filtered through a filter paper. 50 μL of isooctane, used as a keeper was added and the extract was pre-concentrated by rotary evaporation (max. temperature 30 °C) to 10 mL prior to clean up by SPE.
Samples were cleaned-up using Strata® FL-PR Florisil ((170 μm, 80 Å), 5 g/ 20 mL, Giga Tubes, Phenomenex) cartridges. Conditioning of the cartridges was performed using 20 mL of 10% isopropanol in dichloromethane, followed by 30 mL of hexane. After conditioning, the samples were loaded in the SPE cartridges and the eluent was collected. The elution of the analytes from the adsorbent material was performed using 20 mL of dichloromethane/hexane (50/50 v/v), followed by 20 mL of hexane. The whole extract (cleaned extract and elution solvents) was placed into an evaporation flask.
Upon completion 50 μL of isooctane was added, the extract was pre-concentrated by rotary evaporation (max. temperature 30 °C) to 10 mL. The extract was then further evaporated using a nitrogen stream (max. temperature 30 °C) to a final volume of 250 μL in hexane. During the sample preparation 4-fold enrichment of the extracts was achieved. The final extract was filtered through the Regenerated Cellulose (RC) filter (Chromafil - pore size: 0,2 μm; filter diameter: 15 mm), using a syringe, into a 2 mL glass vial with an insert placed inside each vial. Samples were then analysed by GC-APCI-QToF MS and the vials finally stored at -80°C.
Extraction of LC-amenable contaminants from sediment samples
0,2 g freeze-dried sediment sample was placed in a plastic centrifuge tube (15 mL). Polar to semi-polar CECs were extracted with 2 mL methanol/Milli-Q water (pH 2.5, formic acid 0,5 % and 0,1 % EDTA), 50/50 (v/v), by vortex (1 min), followed by ultrasonic extraction for 15 min at 50 °C. After the extraction, the extract was centrifuged for 10 min at 4000 rpm and the supernatant was collected in a glass test tube. This procedure was repeated two more times. In total 6 mL of supernatant were collected. Then the total extract was evaporated to dryness under a gentle steam of N2 at 40 °C. Reconstitution of the analytes was performed with 0.2 mL methanol/Milli-Q water (50/50 v/v). Finally, the extract was filtered through a Regenerated Cellulose (RC) filter (Chromafil - pore size: 0,2 μm; filter diameter: 15 mm) and transferred to a glass vial for LC-ESI-QToF MS analysis.
Extraction of GC-amenable contaminants from sediment samples
10 g of each freeze-dried sediment sample were weighed into a 50 mL centrifuge tube. Two different organic mixtures of solvents were used for the extraction of the analytes. Firstly, 40 mL of dichloromethane/hexane (50/50, v/v) were added into the centrifuge tube and ultrasonic extraction was followed at 25ᵒC for 16 min. After centrifugation at 4,000 rpm for 6 minutes, the supernatant was collected into a ground glass flask.
Extraction was completed a total of three times with hexane/acetone (50/50, v/v) as the extraction mixture. The three extracts (120 mL in total) were combined and evaporated to 1 mL with the use of a rotary evaporator. The remnant was cleaned-up through a glass chromatography column, packed with glass wool plug, 3 g of silica and 3 g of aluminium oxide. Activated anhydrous Na2SO4 (1 g) was added on the top of the column. Silica has been activated before use, by baking at 180°C for 12 h, while alumina was activated at 250°C for 3 h.
The column was conditioned with 30 mL of dichloromethane/hexane (50/50, v/v) followed by 30 mL of hexane/acetone (50/50, v/v). The extract of the sample was loaded and the elution of the analytes was realized with 30 mL of dichloromethane/ hexane (50/50, v/v) followed by 30 mL of hexane/acetone (50/50, v/v). 10 μl of isooctane was added as a keeper and the extract (60 mL in total) was evaporated near dryness. Finally, the sample was reconstituted to 200 μL hexane and filtered through a Regenerated Cellulose (RC) filter (Chromafil - pore size: 0.2 μm; filter diameter: 15 mm) and transferred to a glass vial for GC-APCI-QToF MS analysis.
Instrumental analysis
All samples were analysed by both liquid and gas chromatography hyphenated with a high-resolution mass spectral analyser. Summary information on instrumental analysis by RPLC-ESI-QTOF and GC-APCI-QTOF is provided below.
Reversed-Phase Liquid Chromatography High Resolution Mass Spectrometry
Chromatographic analysis was completed using an Ultra High Performance Liquid Chromatography (UHPLC) apparatus with an HPG-3400 pump (Dionex UltiMate 3000 RSLC, Thermo Fisher Scientific). An Acclaim TM RSLC 120 C18 (100 × 2.1 mm, 2.2 μm; Thermo Fisher Scientific) column was utilised using Ultrapure Water by Milli-Q-UV system (Millipore), Methanol, LC-MS Grade (Merck), Formic acid - eluent additive for LC-MS (Fluka Analytical) and Ammonium formate, LC-MS Ultra and ammonium acetate for mass spectrometry - eluent additives for UHPLC-MS (Fluka Analytical). Mass Spectrometer completed on a Hybrid Quadrupole Time of Flight Mass Analyzer (QTOF-MS) (Maxis Impact, Bruker Daltonics).
QTOF-MS was completed with an electrospray ionization interface (ESI) operated in both positive and negative mode using the following MS parameters;
- Scan mode: a) 1st run in Data Independent mode: broad band Collision Induced Dissociation (bbCID) acquisition mode (acquisition of full scan MS spectra (4 eV) and MS/MS (25 eV) spectra in a single run) and b) 2nd run in Data Dependent mode (acquisition of full scan MS spectra and MS/MS spectra of the 5 most abundant ions per MS scan in a single run). m/z (mass to charge ratio) range: 50 - 1000 Da with a Scan rate of 2 Hz.
- External calibration of QToF-MS was performed just before analysis with 10 mM of sodium formate in a mixture of water/isopropanol (50/50, v/v). The theoretical exact masses of calibration ions with formulas Na(NaCOOH)1-14 in the range of 50−1000 Da were used.
- Internal calibration was performed by calibrant injection at the beginning of each chromatogram (1st segment, 0,1−0,25 min).
Gas Chromatography High Resolution Mass Spectrometry
The GC-APCI-QTOF system consisted of a Bruker 450 GC, a CP-8400 AutoSampler and a hybrid quadrupole time of flight mass spectrometer (QTOF-MS) (Maxis Impact, Bruker Daltonics). GC was operated in splitless injection mode (Restek Split liner w/Glass Frit (4 mm x 6.3 x 78.5)) and the splitless purge valve was activated 1 min after injection. The injection volume was 1 μL. A Restek Rxi-5Sil MS column of 30 m (0.25 mm i.d. x 0.25 μm film thickness) was used with helium as a carrier gas at the constant flow of 1.5 mL min-1.
The GC oven was programmed as follows: 55 °C initial hold for 3 min, increase at a rate of 15 °C min-1 to 180 °C, then increase with a step of 6,5 °C min-1 to 280 °C and hold for 5 min followed by an increase of 10 °C min-1 to 300 °C and hold for 5.28 min. The temperature of splitless injector port, GC-MS transfer line and MS source were maintained at 280, 290 and 250 °C, respectively.
Operating parameters of APCI interface were: capillary voltage, 5000 V; corona voltage, 2000 V; end plate offset, 500 V; nebulizer, 3.5 bar; drying gas, 1.5 L min−1. The QToF MS system operated in two different acquisition modes. In broadband collision-induced dissociation (bbCID), a Data Independent Acquisition (DIA) mode, in which two sequential full scan events are triggered. The first scan at low collision energy (4 eV) results in a MS full scan over the range of m/z 50–1000. The second scan at high collision energy (25 eV) results in a MS/MS all ion fragment mode also in the range of m/z 50–1000. In Data Dependent Acquisition (DDA) mode, the first scan at low collision energy (4 eV) results in a MS full scan over the range of m/z 50–1000, whereas the second scan results in a full scan MS spectra and in MS/MS spectra of the 5 most abundant ions per MS scan in a single run in the range of m/z 50–1000. The scan rate was 8 Hz per cycle.
The QToF mass spectrometer was calibrated with perfluorotributylamine (FC43) prior to the beginning of every analysis (external calibration) and at the first seconds (1st segment, 0,1−0,25 min) of every chromatogram (internal calibration).
Data analysis: Wide-scope target screening
Target screening was performed with the use of in-house developed databases of 2,411 contaminants (the LC target list is available as S21 UATHTARGETS in Suspect List Exchange https://www.norman-network.com/nds/SLE/ (https://doi.org/10.5281/zenodo.3723478) and the GC target is available as S65 UATHTARGETSGC ((https://doi.org/10.5281/zenodo.3753372)) and the software TASQ Client 2.1 and DataAnalysis 5.1 (Bruker Daltonics, Bremen, Germany). The detection was based on specific screening parameters (mass accuracy <2 mDa, retention time shift ±0,2 min, isotopic fitting <100 mSigma (for confirmation of positives)), whereas the presence of adduct and fragment ions confirmed the analytes.
The Screening Detection Limit (SDL) was established as the lowest concentration level tested for which a compound is detected in all spiked samples, at the expected retention time and with specific mass error of the precursor ion. The SDL was not compound-specific, but a generic reporting value derived after method validation. Further, thorough compound-specific validation was performed for quantification purposes of the compounds detected with the screening method. Compound-specific limit of detection (LOD) and limit of quantification (LOQ) values were calculated after the treatment and analysis of samples spiked with the detected compounds and structure-related isotope labelled compounds. Contaminants that were detected in traces below the LOQ (concentration levels between the LOD and LOQ values) were reported as BQL (below the quantification limit). For statistical treatment of the results, substitution of BQL with LOQ/2 may be performed, as indicated by the QA/QC Directive (2009/90/EC).
Data analysis: Suspect screening
Suspect screening was performed for environmentally relevant pollutants from the NORMAN Substance Database (SusDat; https://www.norman-network.com/nds/susdat/) in all raw chromatograms which were imported into the NORMAN Digital Sample Freezing Platform (DSFP) (http://www.norman-data.eu/) - a novel tool developed for revealing the presence of suspects and identification of unknown compounds in environmental samples. The calibrant masses were used to recalibrate the whole chromatogram using HPC fitting algorithm, which is embedded in DataAnalysis 5.1 (Bruker Daltonics, Bremen, Germany).
This calibration method ensured mass accuracy below 2 mDa during the whole chromatographic run for ions with m/z 50-1000. For exporting files in mzML format, CompassXport 3.0.9.2 (Bruker Daltonics, Bremen, Germany) was used. Chromatograms acquired under bbCID were separated in low and high collision energy layer chromatograms. All mzML files and their meta-data (instrumental, sample meta-data, matrix-specific meta-data and retention time of RTI calibrant substances) were uploaded to Digital Sample Freezing Platform (DSFP). DSFP is based on an integrated workflow, which follows standard operating procedure (SOP) to process the mzML files and all meta-data for generation of harmonized Data Collection Templates (DCTs). This data reduction technique resulted in an automatic generation of DCTs, which include condensed information from bulky raw LC-HRMS files, see https://doi.org/10.1016/j.trac.2019.04.008.
Wide-scope target screening of CONnECT biota samples
Overall, 125 contaminants were determined in the 50 tested biota samples (CONnECT 1-32 and CONnECT 35-52). All OSPAR contracting parties provided molluscs (mainly blue mussels, (Mytilus edulis); in addition, ten fish samples from Denmark, Ireland and the Netherlands were also analysed.
Results of analyses for all samples, were expressed in μg/kg wet weight. Data on the frequency of detection, risk assessment for molluscs (38 samples) and fish (10 samples) and detected concentration ranges in CONnECT biota samples are provided in Annex 1. Based on the available information about substances’ main use, chemical class or application, a main use category was proposed for each compound, although some compounds may have multiple uses. For every detected compound, LOD and LOQ values were reported. The risk associated with the exceedance of toxicity threshold values has been assessed by comparing the measured concentrations with the environmental quality standards (EQS) for biota as in the Directive 2013/39/EU and predicted no-effect concentration (PNEC) values from the NORMAN Ecotoxicology Database (https://www.norman-network.com/nds/ecotox/lowestPnecsIndex.php). For some compounds risk assessment could not be performed since EQS and PNEC values were not available. Compounds whose concentrations were below the method’s Screening Detection Limit (0,254 μg/kg wet weight) are listed in Annex 1.
Most of the detected compounds were industrial chemicals (n=46) and personal care products, pharmaceuticals and their transformation products (TPs) (n=39). The other categories (antipsychotic and antidepressant drugs, plant protection products and TPs, stimulants and TPs, and sweeteners) overall accounted for 28% of the detected compounds (n=33). Methylparaben, an anti-fungal agent often used in a variety of cosmetics and personal care products, was the most frequently detected compound (in 46 samples, FoA: 0,958). The polycyclic aromatic hydrocarbons pyrene, anthracene and chrysene and 4-acetamido-antipyrine, metabolite of the opioid analgesic meptazinol, also presented high frequency of detection across the tested samples (FoA: 0,815, 0,625, 0,565 and 0,565, respectively). Overall, 23 compounds (mainly industrial chemicals) were detected in ≥10 samples (FoA ≥0,208).
The most frequently detected class of compounds, was industrial chemicals including PAHs (n=13), PFAS (n=12), PCBs (n=5) and other compounds (n=16), such as phenols, benzotriazoles and surfactants. The six detected antipsychotic and antidepressant drugs were present mainly in molluscs and presented low overall FoA (0,021-0,083) while the sweeteners aspartame, saccharine and acesulfame were detected at BQL levels mainly in molluscs. An average number of 15 organic compounds were detected in molluscs, while the highest number (n=32) was observed in blue mussels from France (CONnECT 35: Villerville), collected at the mouse of the Seine river. Regarding the fish samples, the total number of detected compounds ranged from 7 to 20 (in CONnECT 23 and 18). Most of the compounds were detected at BQL levels or at concentrations below 60 μg/kg w.w. Maximum concentrations of sotalol, PCB-138, N,N-dimethyldodecylamine N-oxide and methylparaben, were 63,8, 73,2, 165 and 719 μg/kg w.w., respectively.
Additional 7 compounds were detected only in CONnECT 48 and 52 (muscles of Dublin Bay prawn and egg of Guillemot, respectively, both from Ireland), including the pharmaceuticals flunisolide, 4-formylamino-antipyrine and N-acetyl mesalazine, the plant protection products dinoterb and pentachlorobenzene, the stimulant hydroxy-cotinine and PCB 28. Since they were analysed in different matrices, statistical values were not reported for these compounds.
Risk assessment of all CONnECT biota samples
Due to the relatively limited number of samples only a simplified risk assessment of individual contaminants was feasible based on exceedance of available toxicity threshold values.
PNEC values for biota were derived from existing PNECs for freshwater (PNECfw; available in the NORMAN Ecotoxicity Database for 64 447 NORMAN SusDat compounds; see also https://www.norman-network.com/nds/ecotox/), using the equation
PNECfw*BCF (for fish)
and
PNECfw*BCF/4 (for molluscs);
where BCF is the bioconcentration factor for fish from the US EPA CompTox Database (for values, see NORMAN Substance Factsheets at https://www.norman-network.com/nds/factsheets/ ).
It should be noted that for several compounds either PNECs or BCFs were not available and, consequently, no risk assessment could be carried out. In cases where contaminants were detected at BQL levels, LOQ/2 concentration was used for risk estimation. Such outcomes also suggest that there is a need for more sensitive analytical method for these specific analytes.
Analyses of molluscs samples revealed presence of 63 compounds, which exceeded their ecotoxicological threshold value in at least one sample (Annex 4). Most of the compounds exceeded their PNEC values (Frequency of Exceedance; FoE) in less than 10 samples (0.24). However, methylparaben seems to be of high environmental concern, as its concentration exceeded the PNEC value in 36 samples. Pyrene, anthracene and chrysene exceeded their ecotoxicological threshold in 35, 29 and 27 samples respectively, whereas butylparaben was detected at concentration levels above its PNEC in 12 samples.
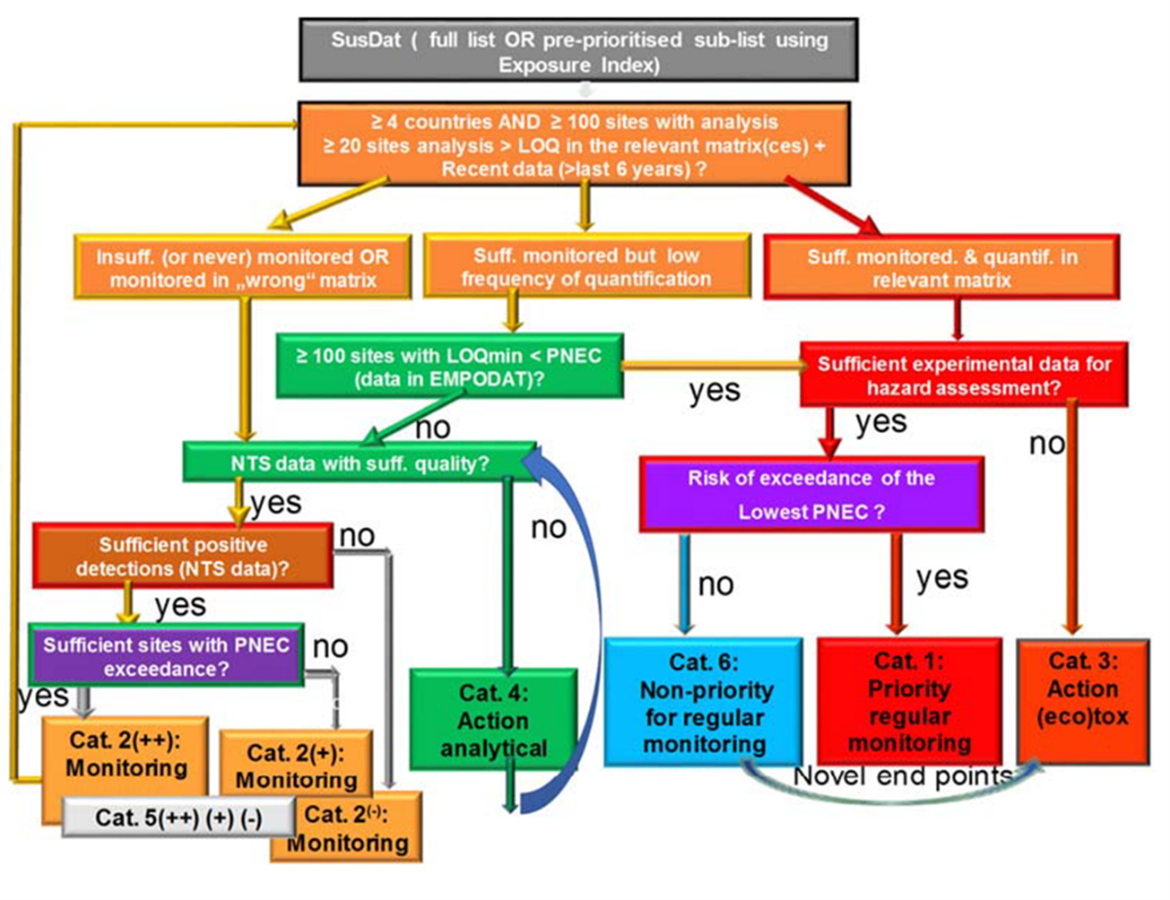
All compounds in categories – CATEGORY 1: ready for regulation
Risk assessment – exceedance of PNEC/EQS values
Hazard assessment – PBMT, CMR, ED scores
Exposure assessment – Frequency of Appearance/Detection; annual production, widespread of use
Analyte | Classification | FoA | FoA | Detection range | FoE | EoE | Final |
molluscs | fish | (μg/Kg w,w,) | score | score | score | ||
Methylparaben | PCPs | 0,95 | 1 | BQL-718 | 0,938 | 0,5 | 2,4 |
Pyrene | Ind. Chem. - PAHs | 0,92 | 0,4 | BQL-53,8 | 0,813 | 0,5 | 2,13 |
Anthracene | Ind. Chem. - PAHs | 0,76 | 0,1 | BQL-30,7 | 0,625 | 0,5 | 1,75 |
Pilocarpine | Pharms & TPs | 0,21 | N.D. | 1,05-17,8 | 0,167 | 1 | 1,33 |
Chrysene | Ind. Chem. - PAHs | 0,71 | N.D. | BQL-15,1 | 0,563 | 0,2 | 1,33 |
Perfluorooctanesulfonamide (PFOSA) | Ind. Chem. - PFAS | 0,16 | 0,1 | BQL-8,77 | 0,146 | 1 | 1,29 |
Lopinavir | Pharms & TPs | 0,053 | 0,1 | BQL-12,3 | 0,063 | 1 | 1,13 |
Reproterol | Pharms & TPs | 0,053 | N.D. | BQL-16,0 | 0,042 | 1 | 1,08 |
Desisopropyl-Atrazine | PPPs & TPs | 0,21 | N.D. | BQL-27,8 | 0,167 | 0,5 | 0,833 |
Harman | Stimulants & TPs | 0,18 | 0,1 | BQL-33,6 | 0,167 | 0,5 | 0,833 |
N,N-Dimethyldodecylamine | Ind. Chem. | 0,5 | 0,7 | BQL-21,9 | 0,104 | 0,1 | 0,746 |
4-Acetamido-Antipyrine | Pharms & TPs | 0,53 | 0,7 | BQL-41,8 | 0,042 | 0,1 | 0,704 |
Darunavir | Pharms & TPs | 0,026 | 0,3 | BQL-37,9 | 0,083 | 0,5 | 0,667 |
Benzo(k)fluoranthene | Ind. Chem. - PAHs | 0,079 | N.D. | 1,33-20,9 | 0,063 | 0,5 | 0,625 |
Methoprene | PPPs & TPs | 0,079 | N.D. | BQL-4,93 | 0,063 | 0,5 | 0,625 |
Phenanthrene | Ind. Chem. - PAHs | 0,34 | 0,3 | 0,729-14,7 | 0,188 | 0,1 | 0,621 |
Lauryl diethanolamide | PCPs | 0,18 | 0,3 | 5,73-57,0 | 0,208 | 0,2 | 0,617 |
Butylparaben | PCPs | 0,32 | N.D. | BQL-5,28 | 0,25 | 0,1 | 0,6 |
Sotalol | Pharms & TPs | 0,053 | N.D. | 20,1-63,7 | 0,042 | 0,5 | 0,583 |
Ethylparaben | PCPs | 0,26 | 0,3 | BQL-26,2 | 0,063 | 0,2 | 0,533 |
Nicotine | Stimulants & TPs | 0,16 | 0,3 | BQL-25,9 | 0,125 | 0,2 | 0,513 |
Nor-Nicotine | Stimulants & TPs | 0,18 | 0,3 | BQL-35,2 | 0,146 | 0,1 | 0,454 |
Lidocaine-N-oxide | Pharms & TPs | 0,24 | N.D. | BQL-44,1 | 0,167 | 0,1 | 0,454 |
Perfluorooctanoic acid (PFOA) | Ind. Chem. - PFAS | 0,079 | 0,3 | BQL | 0,125 | 0,2 | 0,45 |
Dapiprazole | Pharms & TPs | 0,13 | N.D. | BQL-6,23 | 0,104 | 0,2 | 0,408 |
Ketoprofen | Pharms & TPs | N.D. | 0,5 | BQL-24,0 | 0,104 | 0,2 | 0,408 |
N,N-Dimethyltetradecylamine | Ind. Chem. | 0,26 | N.D. | BQL-15,1 | 0,083 | 0,1 | 0,392 |
N-Methyldodecylamine | Ind. Chem. | 0,18 | 0,4 | BQL-29,0 | 0,063 | 0,1 | 0,392 |
Perfluorooctanesulfonic acid (PFOS) | Ind. Chem. - PFAS | 0,18 | 0,6 | BQL-28,9 | 0,021 | 0,1 | 0,392 |
Guaifenesin | Pharms & TPs | 0,18 | 0,1 | BQL-44,4 | 0,125 | 0,1 | 0,392 |
Flecainide | Pharms & TPs | 0,21 | N.D. | BQL-0,920 | 0,125 | 0,1 | 0,392 |
Chlordimeform | PPPs & TPs | 0,24 | 0,1 | BQL-41,0 | 0,063 | 0,1 | 0,371 |
Naphthalene | Ind. Chem. - PAHs | 0,079 | 0,1 | 0,510-13,9 | 0,083 | 0,2 | 0,367 |
Octocrylene | PCPs | 0,026 | 0,3 | 2,90-28,9 | 0,083 | 0,2 | 0,367 |
Mexiletine | Pharms & TPs | 0,18 | N.D. | 1,16-8,79 | 0,104 | 0,1 | 0,35 |
Didecyldimethylammonium (DADMAC (C10:C10)) | Ind. Chem. | 0,13 | 0,4 | BQL-21,6 | 0,042 | 0,1 | 0,329 |
Aspartame | Sweeteners | 0,053 | 0,1 | BQL | 0,063 | 0,2 | 0,325 |
Bisphenol S | Ind. Chem. | 0,11 | 0,1 | BQL-23,5 | 0,104 | 0,1 | 0,308 |
Bisoprolol | Pharms & TPs | 0,13 | N.D. | BQL | 0,104 | 0,1 | 0,308 |
Diethofencarb | PPPs & TPs | 0,13 | N.D. | BQL-17,0 | 0,104 | 0,1 | 0,308 |
Procainamide | Pharms & TPs | 0,026 | 0,1 | 5,43-15,8 | 0,042 | 0,2 | 0,283 |
Phenazone | Pharms & TPs | 0,13 | 0,2 | 2,90-13,0 | 0,021 | 0,1 | 0,267 |
Analyte | Classification | FoA | FoA | Detection range | FoE | EoE | Final |
Sertraline | Antips. & Antidepr. Drugs | 0,11 | N.D. | BQL-5,74 | 0,083 | 0,1 | 0,267 |
Benzophenone-4 | PCPs | 0,079 | 0,1 | BQL-4,68 | 0,063 | 0,1 | 0,246 |
Fluorene | Ind. Chem. - PAHs | 0,21 | 0,2 | 0,105-3,02 | 0,021 | 0 | 0,229 |
2-Hydroxy-Benzothiazole | Ind. Chem. | 0,079 | N.D. | BQL-11,7 | 0,063 | 0,1 | 0,225 |
Oxfendazole | Pharms & TPs | 0,079 | N.D. | BQL-1,78 | 0,063 | 0,1 | 0,225 |
Saccharine | Sweeteners | 0,079 | N.D. | BQL | 0,063 | 0,1 | 0,225 |
Triethylcitrate | Ind. Chem. | 0,026 | 0,3 | BQL | 0,021 | 0,1 | 0,204 |
Perfluorodecanoic acid (PFDA) | Ind. Chem. - PFAS | N.D. | 0,2 | BQL | 0,042 | 0,1 | 0,183 |
Ritalinic acid | Antips. & Antidepr. Drugs | 0,079 | N.D. | BQL-4,10 | 0,021 | 0,1 | 0,183 |
Pendimethalin | PPPs & TPs | 0,053 | N.D. | BQL-1,20 | 0,042 | 0,1 | 0,183 |
Albuterol / Salbutamol | Pharms & TPs | 0,026 | N.D. | 8,99 | 0,021 | 0,1 | 0,142 |
Budesonide | Pharms & TPs | 0,026 | N.D. | BQL | 0,021 | 0,1 | 0,142 |
Venlafaxine | Antips. & Antidepr. Drugs | N.D. | 0,1 | 1,71 | 0,021 | 0,1 | 0,142 |
Maprotiline | Antips. & Antidepr. Drugs | 0,026 | N.D. | 9,94 | 0,021 | 0,1 | 0,142 |
Molindone | Antips. & Antidepr. Drugs | 0,026 | N.D. | 8,22 | 0,021 | 0,1 | 0,142 |
Simazine | PPPs & TPs | N.D. | 0,1 | BQL | 0,021 | 0,1 | 0,142 |
Carteolol | Pharms & TPs | 0,053 | N.D. | 2,04-4,74 | 0,042 | 0 | 0,0833 |
Methiocarb-sulfone | PPPs & TPs | 0,079 | N.D. | BQL-2,11 | 0,021 | 0 | 0,0833 |
Benzotriazole (BTR) | Ind. Chem. | 0,053 | N.D. | 0,656-1,55 | 0,021 | 0 | 0,0625 |
Oxprenolol | Pharms & TPs | 0,053 | N.D. | BQL-1,66 | 0,021 | 0 | 0,0625 |
Benzothiazole (BTH) | Ind. Chem. | 0,026 | N.D. | BQL | 0,021 | 0 | 0,0417 |
Benzo(a)pyrene | Ind. Chem. - PAHs | 0,026 | N.D. | 8,17 | 0,021 | 0 | 0,0417 |
PCB 180 | Ind. Chem. - PCBs | 0,026 | N.D. | BQL-8,02 | 0,021 | 0 | 0,0417 |
Levetiracetam | Pharms & TPs | N.D. | 0,1 | 8,58 | 0,021 | 0 | 0,0417 |
Alachlor-OXA | PPPs & TPs | 0,026 | N.D. | BQL | 0,021 | 0 | 0,0417 |
Hordenine | Stimulants & TPs | 0,026 | N.D. | 53,4 | 0,021 | 0 | 0,0417 |
Cotinine | Stimulants & TPs | 0,026 | N.D. | 4,59 | 0,021 | 0 | 0,0417 |
Benzododecinium (Benzyl-dimethyl-dodecylammonium) | Ind. Chem. | 0,18 | 0,1 | BQL-16,5 | N.A. | ||
Benzotriazole-5-carboxylic acid | Ind. Chem. | 0,16 | N.D. | BQL-1,72 | |||
Amidephrine | Pharms & TPs | 0,079 | 0,1 | BQL-16,9 | |||
Mepindolol | Pharms & TPs | N.D. | 0,1 | 7,96 | |||
O-Desmethyldinor-Tramadol | Pharms & TPs | 0,13 | N.D. | BQL-9,44 | |||
O-Desmethylnor-Tramadol | Pharms & TPs | 0,079 | N.D. | BQL-8,45 | |||
Nifoxipam | Antips. & Antidepr. Drugs | 0,026 | N.D. | BQL | |||
Metolachlor CGA 368208 | PPPs & TPs | 0,13 | N.D. | BQL-11,5 | |||
Anabasine | Stimulants & TPs | 0,11 | N.D. | BQL-8,76 | |||
N-Butylbenzenesulfonamide | Ind. Chem. | 0,026 | N.D. | BQL-3,77 | no exceedance | ||
N,N-Dimethyldodecylamine N-oxide | Ind. Chem. | 0,053 | 0,1 | 2,58-164 | |||
N,N-Dimethyltetradecylamine-N-oxide | Ind. Chem. | 0,053 | 0,1 | 2,13-43,8 | |||
Tributylamine | Ind. Chem. | 0,11 | 0,6 | BQL-2,35 | |||
2-4-Dinitrophenol (DNP) | Ind. Chem. | 0,079 | 0,1 | BQL-2,17 | no exceedance | ||
Benzo(a)anthracene | Ind. Chem. - PAHs | 0,5 | N.D. | BQL-11,1 | |||
Benzo(b)fluoranthene | Ind. Chem. - PAHs | 0,26 | N.D. | BQL-3,96 | |||
Fluoranthene | Ind. Chem. - PAHs | 0,63 | N.D. | 0,12-12,9 | |||
Acenaphthene | Ind. Chem. - PAHs | 0,026 | N.D. | 2,53 | |||
Acenaphthylene | Ind. Chem. - PAHs | 0,053 | N.D. | BQL-1,99 | |||
PCB 101 | Ind. Chem. - PCBs | 0,26 | 0,2 | BQL-12,7 | |||
PCB 138 | Ind. Chem. - PCBs | 0,29 | 0,3 | BQL-73,2 | |||
PCB 153 | Ind. Chem. - PCBs | 0,26 | 0,2 | BQL-29,2 | |||
PCB 52 | Ind. Chem. - PCBs | 0,079 | 0,2 | BQL-3,28 | |||
Perfluorobutanesulfonic acid (PFBS) | Ind. Chem. - PFAS | 0,026 | 0,1 | BQL | |||
Perfluoroheptanesulfonic acid (PFHpS) | Ind. Chem. - PFAS | N.D. | 0,2 | BQL | |||
Perfluorohexanesulfonic acid (PFHxS) | Ind. Chem. - PFAS | N.D. | 0,2 | BQL-0,537 | |||
Perfluorononanoic acid (PFNA) | Ind. Chem. - PFAS | N.D. | 0,3 | BQL-0,241 | |||
PFOS (sum branched isomers) | Ind. Chem. - PFAS | N.D. | 0,3 | BQL-1,14 | |||
Perfluoroundecanoic acid (PFUdA) | Ind. Chem. - PFAS | N.D. | 0,1 | BQL | |||
Perfluorobutanoic acid | Ind. Chem. - PFAS | 0,079 | 0,1 | 0,516-3,57 | |||
PerfluorohexanoiC acid (PFHxA) | Ind. Chem. - PFAS | 0,026 | N.D. | 1,81-4,40 | |||
Benzophenon 3 (=2-Hydroxy-4-methoxybenzophenon) | PCPs | N.D. | 0,1 | BQL | |||
Acamprosat | Pharms & TPs | 0,11 | N.D. | BQL-12,1 | |||
Prilocaine | Pharms & TPs | 0,053 | N.D. | BQL | |||
Thiabendazole | Pharms & TPs | 0,11 | 0,3 | BQL | |||
Tramadol | Pharms & TPs | 0,11 | 0,2 | BQL | |||
Deprenyl / Selegiline | Pharms & TPs | 0,026 | 0,1 | BQL-10,3 | |||
Salicylic acid | Pharms & TPs | 0,079 | 0,1 | 3,97-23,5 | |||
4-Formyl-antipyrine | Pharms & TPs | N.D. | 0,1 | 0,655-3,47 | |||
DEET (Diethyltoluamide) | PPPs & TPs | N.D. | 0,4 | BQL | |||
Isoprocarb | PPPs & TPs | N.D. | 0,5 | BQL-3,63 | |||
Siduron | PPPs & TPs | N.D. | 0,1 | BQL | |||
4,4-DDE | PPPs & TPs | 0,053 | 0,1 | BQL-45,4 | |||
Hexachlorobenzene | PPPs & TPs | 0,079 | 0,1 | BQL-55,8 | |||
Atrazine | PPPs & TPs | N.D. | 0,1 | 2,33 | |||
Fenpropidin | PPPs & TPs | 0,13 | N.D. | BQL-0,519 | |||
Benfluralin | PPPs & TPs | 0,11 | 0,1 | BQL-0,668 | |||
Trifluralin | PPPs & TPs | 0,11 | 0,2 | 0,160-0,445 | |||
Acesulfame | Sweeteners | 0,053 | N.D. | BQL | |||
BQL: Below the Limit of Quantification, TPs: Transformation products, Pharms: Pharmaceuticals, PCPs: Personal Care Products, Antips.: Antipsychotics, Antidepr.: Antidepressants, PPPs: Plant Protection Products, Ind. Chem.: Industrial Chemicals, PCBs: Polychlorinated Biphenyls, PAHs: Polycyclic Aromatic Hydrocarbons, PFAS: Per- and polyfluoroalkyl substances,, N.D.: Not detected, N.A.: Not available, FoA: Frequency of appearance, FoE: Frequency of exceedance, EoE: Extent of exceedance.
Analyte | Max Detected con. | Lowest PNEC | FoA | FoE | EoE | Final score |
Methylparaben | 719 | 0,64 | 0,95 | 0,95 | 0,5 | 2,39 |
Pyrene | 53,9 | 0,028 | 0,92 | 0,92 | 0,5 | 2,34 |
Anthracene | 30,8 | 0,033 | 0,76 | 0,76 | 0,5 | 2,03 |
Chrysene | 15,2 | 0,15 | 0,71 | 0,71 | 0,2 | 1,62 |
Butylparaben | 5,28 | 1,09 | 0,32 | 0,32 | 0,1 | 0,73 |
Phenanthrene | 14,8 | 2,2 | 0,34 | 0,24 | 0,1 | 0,68 |
Lidocaine-N-oxide | 44,2 | 4,45 | 0,24 | 0,21 | 0,1 | 0,55 |
Pilocarpine | 17,9 | 0,009 | 0,21 | 0,21 | 1 | 1,42 |
Atrazine-desisopropyl | 27,9 | 0,06 | 0,21 | 0,21 | 0,5 | 0,92 |
Nor-nicotine | 35,3 | 5,25 | 0,18 | 0,18 | 0,1 | 0,47 |
Harman | 33,6 | 0,12 | 0,18 | 0,18 | 0,5 | 0,87 |
Lauryl diethanolamide | 57,1 | 0,858 | 0,18 | 0,18 | 0,2 | 0,57 |
Flecainide | 0,92 | 0,178 | 0,21 | 0,16 | 0,1 | 0,47 |
Guaifenesin | 44,5 | 12,7 | 0,18 | 0,16 | 0,1 | 0,44 |
Nicotine | 25,9 | 1,17 | 0,16 | 0,16 | 0,2 | 0,52 |
Perfluorooctanesulfonamide (PFOSA) | 8,77 | 0,002 | 0,16 | 0,16 | 1 | 1,32 |
N,N-Dimethyldodecylamine | 21,9 | 2,01 | 0,5 | 0,13 | 0,1 | 0,73 |
Mexiletine | 8,8 | 3,18 | 0,18 | 0,13 | 0,1 | 0,42 |
Bisoprolol | 5,25* | 2,5 | 0,13 | 0,13 | 0,1 | 0,36 |
Dapiprazole | 6,24 | 0,075 | 0,13 | 0,13 | 0,2 | 0,46 |
Diethofencarb | 17 | 1,5 | 0,13 | 0,13 | 0,1 | 0,36 |
N,N-Dimethyltetradecylamine | 15,1 | 1,04 | 0,26 | 0,11 | 0,1 | 0,47 |
Sertraline | 5,7 | 0,323 | 0,11 | 0,11 | 0,1 | 0,31 |
Bisphenol S | 18,8 | 1,86 | 0,11 | 0,11 | 0,1 | 0,31 |
Ethylparaben | 26,2 | 1,79 | 0,26 | 0,08 | 0,2 | 0,54 |
Chlordimeform | 41 | 35,3 | 0,24 | 0,08 | 0,1 | 0,42 |
N-Methyldodecylamine | 29,1 | 2,02 | 0,18 | 0,08 | 0,1 | 0,36 |
Benzophenone-4 | 4,69 | 0,47 | 0,08 | 0,08 | 0,1 | 0,26 |
Oxfendazole | 1,78 | 0,123 | 0,08 | 0,08 | 0,1 | 0,26 |
Methoprene | 4,93 | 0,005 | 0,08 | 0,08 | 0,5 | 0,66 |
Saccharine | 3,59 | 1,66 | 0,08 | 0,08 | 0,1 | 0,26 |
2-OH-benzothiazole | 11,7 | 2,22 | 0,08 | 0,08 | 0,1 | 0,26 |
Benzo(k)fluoranthene | 20,9 | 0,065*** | 0,08 | 0,08 | 0,5 | 0,66 |
Naphthalene | 13,9 | 0,145 | 0,08 | 0,08 | 0,2 | 0,36 |
Perfluorooctanoic acid (PFOA) | 0,575* | 0,01 | 0,08 | 0,08 | 0,2 | 0,36 |
4-Acetamido-antipyrine | 20,3 | 7,05 | 0,53 | 0,05 | 0,1 | 0,68 |
Didecyldimethylammonium (DADMAC (C10:C10)) | 21,7 | 2,75 | 0,13 | 0,05 | 0,1 | 0,28 |
Lopinavir | 12,3 | 0,004 | 0,05 | 0,05 | 1 | 1,11 |
Reproterol | 16,1 | 0,005 | 0,05 | 0,05 | 1 | 1,11 |
Sotalol | 63,8 | 0,388 | 0,05 | 0,05 | 0,5 | 0,61 |
Carteolol | 4,75 | 0,42 | 0,05 | 0,05 | 0 | 0,11 |
Aspartame | 22,95* | 2,34 | 0,05 | 0,05 | 0,1 | 0,21 |
Pendimethalin | 1,2 | 0,03 | 0,05 | 0,05 | 0,1 | 0,21 |
Fluorene | 3,02 | 2,93 | 0,21 | 0,03 | 0 | 0,24 |
Phenazone | 13 | 6,33 | 0,13 | 0,03 | 0,1 | 0,26 |
Ritalinic acid | 4,11 | 1,34 | 0,08 | 0,03 | 0,1 | 0,21 |
Methiocarb-sulfone | 2,12 | 1,82 | 0,08 | 0,03 | 0 | 0,11 |
Analyte | Max Detected con, | Lowest PNEC | FoA | FoE | EoE | Final score |
Oxprenolol | 1,67 | 1,46 | 0,05 | 0,03 | 0 | 0,08 |
Benzotriazole (BTR) | 1,55 | 1,11 | 0,05 | 0,03 | 0 | 0,08 |
Octocrylene | 28,9 | 0,315 | 0,03 | 0,03 | 0,2 | 0,25 |
Albuterol / Salbutamol | 8,99 | 2,07 | 0,03 | 0,03 | 0,1 | 0,15 |
Budesonide | 5,95* | 2,29 | 0,03 | 0,03 | 0,1 | 0,15 |
Darunavir | 37,9 | 0,023 | 0,03 | 0,03 | 0,5 | 0,55 |
Procainamide | 15,8 | 0,338 | 0,03 | 0,03 | 0,2 | 0,25 |
Maprotiline | 9,95 | 2,78 | 0,03 | 0,03 | 0,1 | 0,15 |
Molindone | 8,23 | 1,67 | 0,03 | 0,03 | 0,1 | 0,15 |
Alachlor-OXA | 2,52 | 0,638 | 0,03 | 0,03 | 0 | 0,05 |
Triethylcitrate | 20,89* | 4,53 | 0,03 | 0,03 | 0,1 | 0,15 |
Hordenine | 53,4 | 11,85 | 0,03 | 0,03 | 0 | 0,05 |
PCB 180 | 1,89 | 0,02 | 0,03 | 0,03 | 0 | 0,05 |
Benzothiazole (BTH) | 30* | 5,7 | 0,03 | 0,03 | 0 | 0,05 |
Cotinine | 4,6 | 0,69 | 0,03 | 0,03 | 0 | 0,05 |
Benzo(a)pyrene | 8,18 | 5** | 0,03 | 0,03 | 0 | 0,05 |
*LOQ/2 was used, **EQS from Directive 2013/39/EU, ***Benzo(a)pyrene with EQS 5 μg/Kg w.w. can be considered as a marker (2013/39/EU).
Analyte | Max Detected con. | Lowest PNEC | FoA | FoE | EoE | Final score |
Methylparaben | 77,1 | 2,56 | 1 | 0,9 | 0,2 | 2,1 |
Ketoprofen | 24 | 1,51 | 0,5 | 0,5 | 0,2 | 1,2 |
Pyrene | 0,448 | 0,11 | 0,4 | 0,4 | 0,1 | 0,9 |
Darunavir | 5,38* | 0,09 | 0,3 | 0,3 | 0,2 | 0,8 |
Perfluorooctanoic acid (PFOA) | 0,575* | 0,041 | 0,3 | 0,3 | 0,2 | 0,8 |
Perfluorooctanesulfonic acid (PFOS) | 25,7 | 9,1** | 0,6 | 0,1 | 0,1 | 0,8 |
Octocrylene | 4,02 | 1,26 | 0,3 | 0,3 | 0,1 | 0,7 |
Lauryl diethanolamide | 13,3 | 3,43 | 0,3 | 0,3 | 0,1 | 0,7 |
Perfluorodecanoic acid (PFDA) | 1,27* | 0,82 | 0,2 | 0,2 | 0,1 | 0,5 |
Lopinavir | 0,855* | 0,014 | 0,1 | 0,1 | 0,2 | 0,4 |
Perfluorooctanesulfonamide (PFOSA) | 1,29 | 0,0098 | 0,1 | 0,1 | 0,2 | 0,4 |
Procainamide | 5,43 | 1,35 | 0,1 | 0,1 | 0,1 | 0,3 |
Venlafaxine*** | 1,71 | 0,32 | 0,1 | 0,1 | 0,1 | 0,3 |
Simazine | 0,242 | 0,05 | 0,1 | 0,1 | 0,1 | 0,3 |
Harman | 3,23* | 0,48 | 0,1 | 0,1 | 0,1 | 0,3 |
Aspartame | 14,9* | 9,36 | 0,1 | 0,1 | 0,1 | 0,3 |
Anthracene | 0,140* | 0,13 | 0,1 | 0,1 | 0,1 | 0,3 |
Naphthalene | 7,87 | 0,58 | 0,1 | 0,1 | 0,1 | 0,3 |
Bisphenol S | 23,5 | 7,44 | 0,1 | 0,1 | 0,1 | 0,3 |
Levetiracetam | 8,58 | 5,79 | 0,1 | 0,1 | 0 | 0,2 |
*LOQ/2 was used, **EQS from Directive 2013/39/EU, ***Compound included in Watch list of 2020 (EU 2020/1161)
Compounds | Classification | CONnECT 33 | CONnECT 34 | LOD | LOQ | PNEC |
Benzotriazole (BTR) | Industrial Chemicals | BQL | <LOD | 14,7 | 44,1 | 31,2 |
Tolytriazole | BQL | <LOD | 13 | 39 | 705 | |
(4- & 5-Me-Benzotriazole) | ||||||
Acenaphthene | 4,61 | 2,34 | 0,17 | 0,509 | 16 | |
Acenaphthylene | 6,85 | 2,92 | 0,157 | 0,471 | 44 | |
Fluorene | 9,55 | 3,58 | 0,0706 | 0,212 | 19 | |
Anthracene | 9,62 | 3,61 | 0,0743 | 0,223 | 0,048 | |
Phenanthrene | 22,3 | 29,5 | 0,0455 | 0,136 | 240 | |
Benzo(a)anthracene | 38,8 | 22,1 | 0,287 | 0,86 | 261 | |
Pyrene | 39,5 | 34,8 | 2,69 | 8,06 | 665 | |
Chrysene | 42,6 | 21 | 0,198 | 0,593 | 384 | |
Dimethyl-phthalate | BQL | BQL | 34,8 | 105 | 80,1 | |
Fluoranthene | 75,9 | 44,9 | 0,126 | 0,378 | 600 | |
Flecainide | PCPs & Pharms. | 14,4 | <LOD | 3,2 | 9,6 | 63,1 |
Tiapride | BQL | <LOD | 10,5 | 31,6 | 140 | |
Tramadol | 29,9 | <LOD | 6,13 | 18,4 | 256 | |
Metoprolol | 34,7 | <LOD | 8,55 | 25,6 | 557 | |
Amisulpride | 37,8 | <LOD | 8,4 | 25,2 | 93 | |
Lauryl diethanolamide | 30,9 | 62,6 | 10 | 30 | 65 | |
4,4-DDE | PPPs & TPs | 0,587 | <LOD | 0,0855 | 0,256 | 81,6 |
4,4'-Dichlorobenzophenone | 0,787 | <LOD | 0,243 | 0,728 | 76,6 | |
2-Octyl-4-isothiazolin-3-one | 4,93 | <LOD | 0,529 | 1,59 | 43,8 |
BQL: Below the Limit of Quantification, TPs: Transformation products, Pharms: Pharmaceuticals, PCPs: Personal Care Products, PPPs: Plant Protection Products, PNEC: Predicted No Effect Concentration.
| Compound | Level | CAS No. | StdInChIKey |
Industrial Chemicals | [2 (acryloyloxy)ethyl]trimethyl ammonium | 3 | 44992-01-0 | AIUAMYPYEUQVEM-UHFFFAOYSA-N |
Ethyl 2,4-dimethylbenzoate | 3 | 33499-42-2 | RJYPOWRKMKNFHH-UHFFFAOYSA-N | |
Hexahydrophthalic anhydride | 3 | 85-42-7 | MUTGBJKUEZFXGO-UHFFFAOYSA-N | |
Tris(2,4-di-tert-butylphenyl) phosphite | 3 | 31570-04-4 | JKIJEFPNVSHHEI-UHFFFAOYSA-N | |
Acetyl tributyl citrate | 3 | 77-90-7 | QZCLKYGREBVARF-UHFFFAOYSA-N | |
12-Oxooctadecanoic acid | 3 | 925-44-0 | OFOWUDSDZLONKT-UHFFFAOYSA-N | |
Octanedioic acid | 3 | 505-48-6 | TYFQFVWCELRYAO-UHFFFAOYSA-N | |
Dioctyl hexanedioate | 3 | 123-79-5 | NEHDRDVHPTWWFG-UHFFFAOYSA-N | |
Phenol, isopropylated | 3 | 90480-88-9 | VLJSLTNSFSOYQR-UHFFFAOYSA-N | |
Tridecanedioic acid | 3 | 505-52-2 | DXNCZXXFRKPEPY-UHFFFAOYSA-N | |
1-(2,3,8,8-Tetramethyl-1,2,3,4,6,7,8,8a-octahydronaphthalen-2-yl)ethanone | 3 | 68155-67-9 | YLWIXGWLTDBBHL-UHFFFAOYSA-N | |
Diacetone acrylamide | 3 | 2873-97-4 | OMNKZBIFPJNNIO-UHFFFAOYSA-N | |
Bis(2,2,6,6-tetramethyl-4-piperidyl) sebacate | 3 | 52829-07-9 | XITRBUPOXXBIJN-UHFFFAOYSA-N | |
2-Propen-1-yl 2-(cyclohexyloxy)acetate | 3 | 68901-15-5 | MBUYSYKXSMTIPP-UHFFFAOYSA-N | |
1,1'-(p-tolylimino)dipropan-2-ol | 3 | 38668-48-3 | JFZVSHAMRZPOPA-UHFFFAOYSA-N | |
Propanedioic acid, diethyl- | 3 | 510-20-3 | LTMRRSWNXVJMBA-UHFFFAOYSA-N | |
cis-3,7-Dimethyl-2,6-octadienyl Methanoate | 3 | 2142-94-1 | DIHFALQHYSMKMB-JXMROGBWSA-N | |
Octanamide, N,N-diethyl- | 3 | 996-97-4 | FHJRFIYKPIXQNQ-UHFFFAOYSA-N | |
9-Octadecen-1-ol, dihydrogen phosphate | 3 | 24613-61-4 | MEESPVWIOBCLJW-UHFFFAOYSA-N | |
2,5-Bis(2-methylbutan-2-yl)benzene-1,4-diol | 3 | 79-74-3 | CZNRFEXEPBITDS-UHFFFAOYSA-N | |
GLYCERYL LINOLENATE | 3 | 18465-99-1 | GGJRAQULURVTAJ-PDBXOOCHSA-N | |
GLYCERYL ADIPATE | 3 | 26699-71-8 | MBAGLYAOSZAUFG-UHFFFAOYSA-N | |
Hexanoic acid, 2-ethyl-, hexadecyl ester | 3 | 59130-69-7 | XJNUECKWDBNFJV-UHFFFAOYSA-N | |
9-Octadecenamide, N-[2-(2-hydroxyethoxy)ethyl]-, (9Z)- | 3 | 20429-33-8 | ULHGTPIJYDGNHZ-KTKRTIGZSA-N | |
2-Amino-4-hydroxyethylaminoanisole | 3 | 83763-47-7 | SBUMIGFDXJIPLE-UHFFFAOYSA-N | |
Isopropyl hydrogen adipate | 3 | 52221-06-4 | BRPCDOLEVHTTRE-UHFFFAOYSA-N | |
2,4,6-Tris(1-methylethyl)benzoic acid | 3 | 49623-71-4 | ULVHAZFBJJXIDO-UHFFFAOYSA-N | |
N,N-Dibutyloctanamide | 3 | 57303-23-8 | IRACWGPKDYUZEC-UHFFFAOYSA-N | |
N-(3-Methoxypropyl)-3,4,5-trimethoxybenzylamine | 3 | 34274-04-9 | HUQQTKINPXSDCQ-UHFFFAOYSA-N | |
Hexanamide, N,N-dimethyl- | 3 | 5830-30-8 | OAERLTPBKQBWHJ-UHFFFAOYSA-N | |
2-(4-Nitrophenoxy)ethanol | 3 | 16365-27-8 | YAPAEYFBLRVUMH-UHFFFAOYSA-N | |
Ethyl diethanolamine | 3 | 139-87-7 | AKNUHUCEWALCOI-UHFFFAOYSA-N | |
2-(Diethylamino)ethylstearate | 3 | 3179-81-5 | QZJDYFVPLXBWTK-UHFFFAOYSA-N | |
tris[2-(2-hydroxyethoxy)ethyl]azanium | 3 | - | JUDCDFBFKBQQMA-UHFFFAOYSA-O | |
2,6-Dimethylaniline | 2A | 87-62-7 | UFFBMTHBGFGIHF-UHFFFAOYSA-N | |
Benzamide | 2A | 55-21-0 | KXDAEFPNCMNJSK-UHFFFAOYSA-N | |
Valerophenone | 3 | 1009-14-9 | XKGLSKVNOSHTAD-UHFFFAOYSA-N | |
Phenol, 2-[1-(4-hydroxyphenyl)-1-methylethyl]- | 3 | 837-08-1 | MLCQXUZZAXKTSG-UHFFFAOYSA-N | |
[2-(benzylthio)ethyl]ammonium hydrogen malate | 3 | 22572-37-8 | PYVXEGXCZNNDNS-UHFFFAOYSA-M | |
Tetradecylamine | 3 | 2016-42-4 | PLZVEHJLHYMBBY-UHFFFAOYSA-N | |
1H-Imidazole-4,5-dimethanol, 2-phenyl- | 3 | 61698-32-6 | UUQQGGWZVKUCBD-UHFFFAOYSA-N | |
N,N-Bis(2-hydroxyethyl)-4-pyridinecarboxamide | 3 | 70892-82-9 | MTPZSDPCKPPQCT-UHFFFAOYSA-N | |
Ethyl (2-(1,1-dimethylethyl)phenoxy)acetate | 3 | 93893-53-9 | ZGSKZKUYGQAKDH-UHFFFAOYSA-N | |
Hexadecyl dihydrogen phosphate | 3 | 3539-43-3 | ZUVCYFMOHFTGDM-UHFFFAOYSA-N | |
Oxacyclododecan-2-one | 3 | 39282-36-5 | MVOSYKNQRRHGKX-UHFFFAOYSA-N | |
Nonanedioic acid | 3 | 123-99-9 | BDJRBEYXGGNYIS-UHFFFAOYSA-N | |
Hexanedioic acid | 3 | 124-04-9 | WNLRTRBMVRJNCN-UHFFFAOYSA-N | |
Erucamide | 2A | 112-84-5 | UAUDZVJPLUQNMU-KTKRTIGZSA-N | |
2-ethyloctanedioic acid | 3 | 3971-33-3 | WUDDSDIHJHPJRP-UHFFFAOYSA-N | |
Industrial Chemicals (Phthalate esters) | Diheptyl phthalate | 3 | 3648-21-3 | JQCXWCOOWVGKMT-UHFFFAOYSA-N |
Diisobutyl phthalate | 2A | 84-69-5 | MGWAVDBGNNKXQV-UHFFFAOYSA-N | |
CAPRYLOYL SALICYLIC ACID | 3 | 70424-62-3 | LKLYETYHDMXRAF-UHFFFAOYSA-N | |
Didecyl phthalate | 3 | 84-77-5 | PGIBJVOPLXHHGS-UHFFFAOYSA-N | |
Isodecyl undecyl phthalate | 3 | 96507-81-2 | YEENWFLPSQDAJU-UHFFFAOYSA-N | |
Diisopropyl phthalate | 3 | 605-45-8 | QWDBCIAVABMJPP-UHFFFAOYSA-N | |
Industrial Chemical (surfactants) | Lauramidopropylamine oxide | 3 | 61792-31-2 | JNGWKQJZIUZUPR-UHFFFAOYSA-N |
1-Dodecanamine, N-dodecyl- | 3 | 3007-31-6 | MJCJUDJQDGGKOX-UHFFFAOYSA-N | |
UNDECYLENAMIDE DEA | 3 | 25377-64-4 | LACWVMIHIJKPTF-MDZDMXLPSA-N | |
1-Tetradecanamine, N,N-dimethyl-, N-oxide | 3 | 3332-27-2 | ONHFWHCMZAJCFB-UHFFFAOYSA-N | |
Amines, C10-16-alkyldimethyl, N-oxides | 3 | 70592-80-2 | VHXSGTCOHZCUKB-UHFFFAOYSA-N | |
2-Naphthyl laurate | 3 | 6343-73-3 | CIGGUBXZFFSTTA-UHFFFAOYSA-N | |
29-(Isooctylphenoxy)-3,6,9,12,15,18,21,24,27-nonaoxanonacosanol | 3 | 58253-61-5 | BYQFTVWRCSHPFM-UHFFFAOYSA-N | |
20-(4-Nonylphenoxy)-3,6,9,12,15,18-hexaoxaeicosan-1-ol | 3 | 27942-27-4 | ATBQNLZREVOGBO-UHFFFAOYSA-N | |
2-[2-[2-[2-(4-Nonylphenoxy)ethoxy]ethoxy]ethoxy] ethanol | 3 | 7311-27-5 | UTXPMECBRCEYCI-UHFFFAOYSA-N | |
Pentaethylene glycol monododecyl ether | 3 | 3055-95-6 | LAPRIVJANDLWOK-UHFFFAOYSA-N | |
Hexaethylene glycol monododecyl ether | 3 | 3055-96-7 | OJCFEGKCRWEVSN-UHFFFAOYSA-N | |
2-[2-(Dodecyloxy)ethoxy]ethanol | 3 | 3055-93-4 | AZLWQVJVINEILY-UHFFFAOYSA-N | |
Heptaethylene glycol monododecyl ether | 3 | 3055-97-8 | DWHIUNMOTRUVPG-UHFFFAOYSA-N | |
3,6,9,12,15,18,21,24-Octaoxatetratriacontan-1-ol | 3 | 24233-81-6 | UJMHIOBAHVUDGS-UHFFFAOYSA-N | |
Tetraethylene glycol monoethyl ether | 3 | 5650-20-4 | GTAKOUPXIUWZIA-UHFFFAOYSA-N | |
Octaethylene glycol | 3 | 5117-19-1 | GLZWNFNQMJAZGY-UHFFFAOYSA-N | |
Pentaethylene glycol | 2A | 4792-15-8 | JLFNLZLINWHATN-UHFFFAOYSA-N | |
Nonaethylene glycol | 3 | 3386-18-3 | YZUUTMGDONTGTN-UHFFFAOYSA-N | |
Dodecyloctaethyleneglycol monoether | 3 | 3055-98-9 | YYELLDKEOUKVIQ-UHFFFAOYSA-N | |
3,6,9,12,15,18,21,24,27,30-decaoxadotetracontan-1-ol | 3 | 6540-99-4 | KOMQWDINDMFMPD-UHFFFAOYSA-N | |
3,6,9,12,15,18,21,24,27,30-Decaoxadotriacontane-1,32-diol | 3 | 6891-45-8 | PSVXZQVXSXSQRO-UHFFFAOYSA-N | |
1-Dodecanamine, N-dodecyl-N-methyl- | 3 | 2915-90-4 | UWHRNIXHZAWBMF-UHFFFAOYSA-N | |
1-Decanamine, N-methyl-N-octyl- | 3 | 22020-14-0 | CQFRPHDWUIZNOK-UHFFFAOYSA-N | |
N-Methyldidecylamine | 3 | 7396-58-9 | ATBNMWWDBWBAHM-UHFFFAOYSA-N | |
N-Methyldioctylamine | 3 | 4455-26-9 | YJLYANLCNIKXMG-UHFFFAOYSA-N | |
Distearylmethylamine | 3 | 4088-22-6 | VFLWKHBYVIUAMP-UHFFFAOYSA-N | |
N,N-Dimethyldecanamide | 3 | 14433-76-2 | HNXNKTMIVROLTK-UHFFFAOYSA-N | |
N,N-Dimethyldodecanamide | 3 | 3007-53-2 | BDYUSDIJIDGWCY-UHFFFAOYSA-N | |
Laurylethanolamide | 3 | 142-78-9 | QZXSMBBFBXPQHI-UHFFFAOYSA-N | |
PEG-3 LAURAMIDE | 3 | 26635-75-6 | SIFSGJHNINUHSG-UHFFFAOYSA-N | |
N-(2-Hydroxyethyl)octadecanamide | 3 | 111-57-9 | OTGQIQQTPXJQRG-UHFFFAOYSA-N | |
N,N-Bis(2-hydroxyethyl)dimethyloctanamide | 3 | 94031-03-5 | LHGRAIBWJITMAA-UHFFFAOYSA-N | |
PPPs | Benzeneacetic acid, 4-hydroxy-, methyl ester | 3 | 14199-15-6 | XGDZEDRBLVIUMX-UHFFFAOYSA-N |
3-Pyridinol | 3 | 109-00-2 | GRFNBEZIAWKNCO-UHFFFAOYSA-N | |
N-(2,6-Dimethylphenyl)-2-hydroxyacetamide | 3 | 29183-14-0 | LUIJJBHAVXGCTP-UHFFFAOYSA-N | |
2,6-Diethylaniline | 3 | 579-66-8 | FOYHNROGBXVLLX-UHFFFAOYSA-N | |
Jasmonic acid | 3 | 6894-38-8 | ZNJFBWYDHIGLCU-HWKXXFMVSA-N | |
Indole-3-acetic acid | 2A | 87-51-4 | SEOVTRFCIGRIMH-UHFFFAOYSA-N | |
Hydroprene | 3 | 41096-46-2 | FYQGBXGJFWXIPP-UEVLXMDPSA-N | |
Empenthrin | 3 | 54406-48-3 | YUGWDVYLFSETPE-JLHYYAGUSA-N | |
Kinoprene | 3 | 42588-37-4 | FZRBKIRIBLNOAM-UHFFFAOYSA-N | |
metabolite CGA 108906 of Metalaxyl-M | 3 | 104390-56-9 | WFTHOCDLKYPFJX-UHFFFAOYSA-N | |
Isoquinoline | 3 | 119-65-3 | AWJUIBRHMBBTKR-UHFFFAOYSA-N | |
Pharmaceuticals | N-Benzylformamide | 2A | 6343-54-0 | IIBOGKHTXBPGEI-UHFFFAOYSA-N |
Metoprolol-Derivative, (2RS)-1-Ethylamino-3-[4-(2-methoxyethyl)-phenoxy]propan-2-ol | 3 | 109632-08-8 | HYRRKPFGZHWUPQ-UHFFFAOYSA-N | |
Ibuprofen-methylester | 3 | 61566-34-5 | YNZYUHPFNYBBFF-UHFFFAOYSA-N | |
Threonate | 3 | 7306-96-9 | JPIJQSOTBSSVTP-STHAYSLISA-N | |
O-Demethylmetoprolol | 2A | 62572-94-5 | CUKXSBOAIJILRY-UHFFFAOYSA-N | |
Atenolol met 11 - 283 | 3 | 1019771-90-4 | RVSFHCVOJGTJCS-UHFFFAOYSA-N | |
4-Piperidone | 3 | 41661-47-6 | VRJHQPZVIGNGMX-UHFFFAOYSA-N | |
Tramadol met 1 -234 | 3 | 113997-50-5 | PSDVPXKQPXSJTP-UHFFFAOYSA-N | |
Alminoprofen | 2A | 39718-89-3 | FPHLBGOJWPEVME-UHFFFAOYSA-N | |
2-Quinolinecarboxylic acid, 4-hydroxy- | 2A | 492-27-3 | HCZHHEIFKROPDY-UHFFFAOYSA-N | |
Miglitol | 3 | 72432-03-2 | IBAQFPQHRJAVAV-ULAWRXDQSA-N | |
Butyrophenone | 3 | 495-40-9 | FFSAXUULYPJSKH-UHFFFAOYSA-N | |
Phenallymal | 3 | 115-43-5 | WOIGZSBYKGQJGL-UHFFFAOYSA-N | |
Atenolol met 14 - 324 | 3 | - | PAJQJCXNWZWYCO-UHFFFAOYSA-N | |
Acexamic acid | 3 | 57-08-9 | WDSCBUNMANHPFH-UHFFFAOYSA-N | |
5'-Methylthioadenosine | 3 | - | WUUGFSXJNOTRMR-IOSLPCCCSA-N | |
Dodecyl(ethylbenzyl)dimethylammonium | 3 | 27479-28-3 | KXLOQZDPPMUHLF-UHFFFAOYSA-N | |
Temozolomide | 3 | 85622-93-1 | BPEGJWRSRHCHSN-UHFFFAOYSA-N | |
Butamirate | 3 | 18109-80-3 | DDVUMDPCZWBYRA-UHFFFAOYSA-N | |
Telbivudine | 2A | 3424-98-4 | IQFYYKKMVGJFEH-CSMHCCOUSA-N | |
Pirbuterol | 3 | 38677-81-5 | VQDBNKDJNJQRDG-UHFFFAOYSA-N | |
Bemegride | 3 | 64-65-3 | ORRZGUBHBVWWOP-UHFFFAOYSA-N | |
4-Ethoxyaniline | 3 | 156-43-4 | IMPPGHMHELILKG-UHFFFAOYSA-N | |
4-Aminophenol | 3 | 123-30-8 | PLIKAWJENQZMHA-UHFFFAOYSA-N | |
PEMA (2-Phenyl-2-ethylmalonamid) | 3 | 80866-90-6 | JFZHPFOXAAIUMB-UHFFFAOYSA-N | |
2-Methylpyridine | 2A | 109-06-8 | BSKHPKMHTQYZBB-UHFFFAOYSA-N | |
9-Hydroxymethyl-10-carbamoylacridan | 3 | 68011-71-2 | UMRKOEWAECPINL-UHFFFAOYSA-N | |
Trimetazidine | 3 | 5011-34-7 | UHWVSEOVJBQKBE-UHFFFAOYSA-N | |
3-Amino-5-morpholinomethyl-2-oxazolidinone (AMOZ) | 3 | 43056-63-9 | TVHAMVOINIHMEX-UHFFFAOYSA-N | |
UV filters | Enzacamene | 3 | 36861-47-9 | HEOCBCNFKCOKBX-SDNWHVSQSA-N |
Phenoxyethyl caprylate | 3 | 23511-73-1 | FTLLYZOWBWEERE-UHFFFAOYSA-N | |
Stimulants & TPs | 4-Pyridineacetic acid | 3 | 28356-58-3 | PAEXAIBDCHBNDC-UHFFFAOYSA-N |
Nicotine met 12-326 | 3 | - | FRZDHDMLTYEGJM-UHFFFAOYSA-N | |
Nicotine met 8-194 | 3 | - | WZWYUPNFLQRBLS-UHFFFAOYSA-N | |
Nicotine met 3-166 | 3 | - | NMSRRWSRVABYEB-UHFFFAOYSA-N | |
Nicotine met 6-180 | 3 | - | ODUKHOFBOXMNAB-UHFFFAOYSA-N | |
Nicotine met 9-196 | 3 | - | ICTQGOUEOXHYCI-UHFFFAOYSA-N | |
Nornicotine, N-formyl | 3 | 3000-81-5 | GQLSEYOOXBRDFZ-UHFFFAOYSA-N |
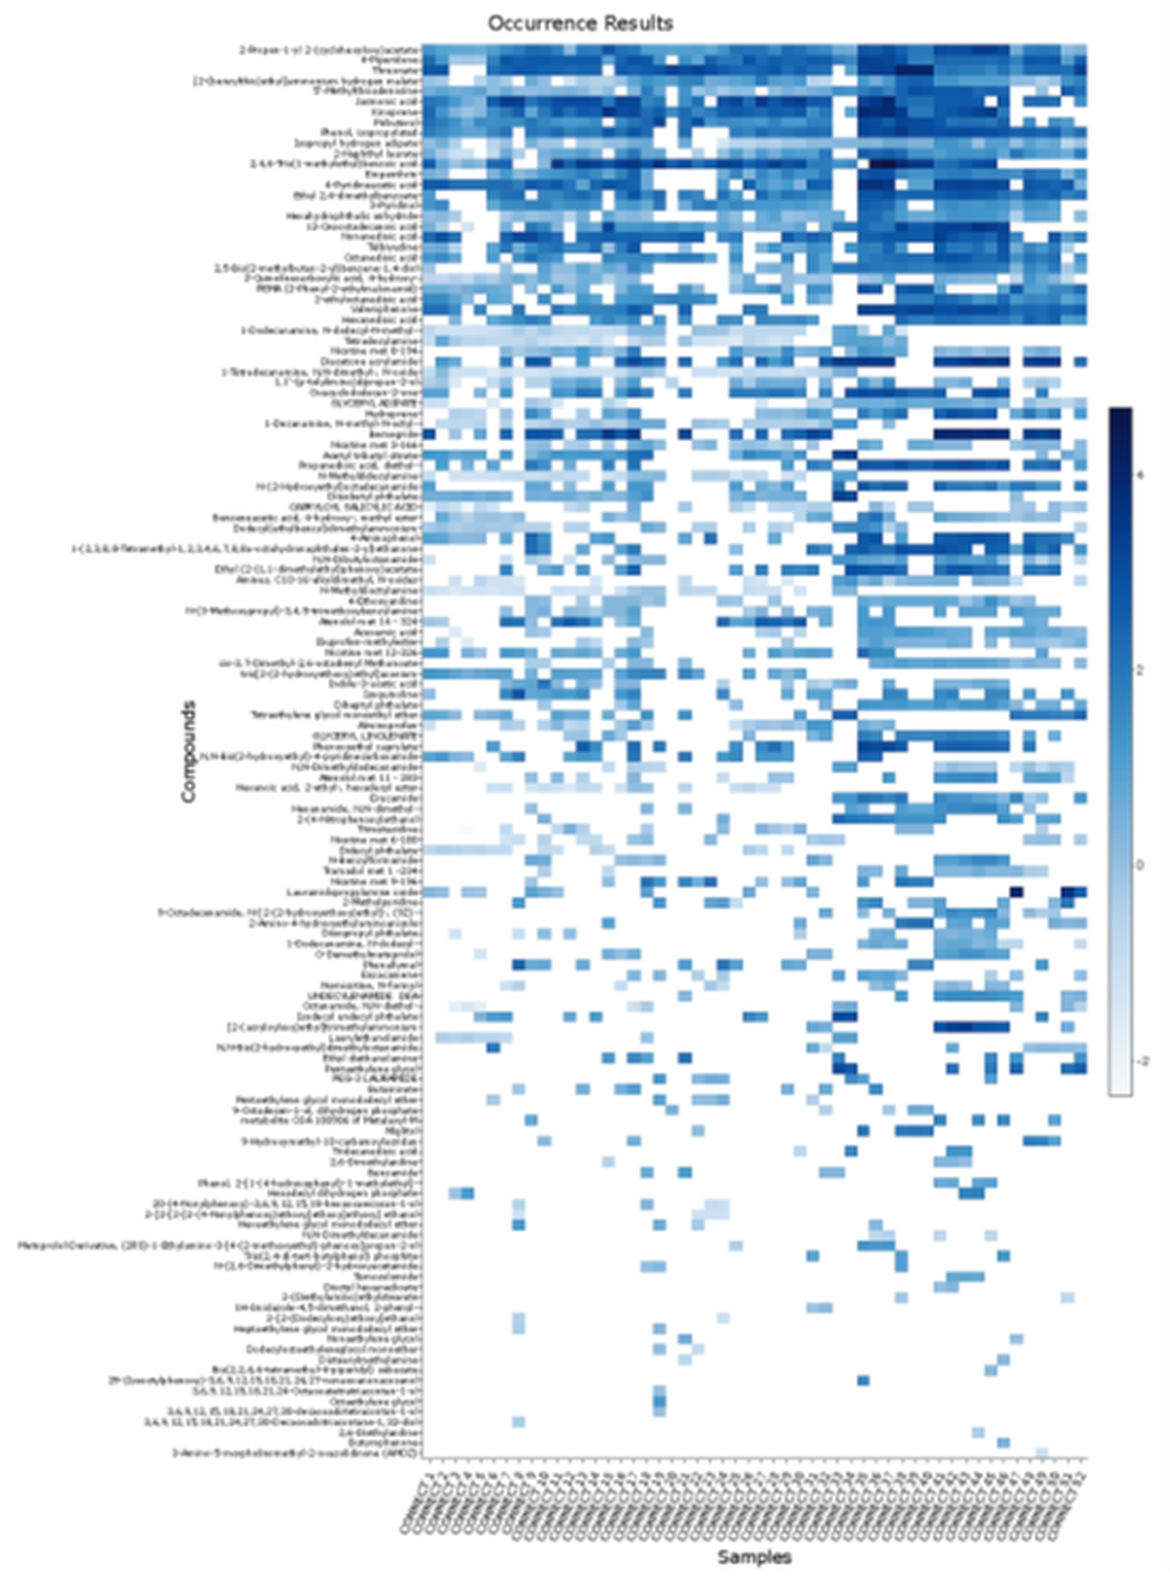
This study has identified a wide range of potential contaminant related threats to the marine environment and its resident species.
The potential to build on this pilot initiative via the completion of a follow-up study with a more extensive sampling strategy, completion of further focussed or more target led confirmatory studies, increased matrix coverage to include other marine matrices including additional sediments, passive samplers, fish and/or higher trophic level species across OSPAR countries is recommended to support more conclusive and robust risk assessments.
It is recognised that targeted monitoring programmes can offer lower limits of detection than can be obtained using the generic screening techniques employed in this study. Continued analytical and instrumental developments in addition to ongoing developments in proficiency exercises will potentially deliver cost-effective lower limits of detection and sensitivity of such catch-all methods as employed in this study.
A careful and ongoing evaluation of the ecotoxicological threshold values and further experimental toxicity evidence is merited to support the outcomes of this risk assessment.
The development of common sampling and sample handling approaches to minimise the potential for unintended contamination of samples would provide addition confidence in these assessments.
It is clear that such research initiatives provide invaluable information to support future marine monitoring programmes. Ongoing research and development of the methodologies, detection limits and focussed ecotoxicological threshold values is merited to further support the outcomes of risk assessment.
BQL: Below the Limit of Quantification,
TPs: Transformation products,
Pharms: Pharmaceuticals,
PCPs: Personal Care Products,
Antips.: Antipsychotics,
Antidepr.: Antidepressants,
PPPs: Plant Protection Products,
Ind. Chem.: Industrial Chemicals,
PCBs: Polychlorinated Biphenyls,
PAHs: Polycyclic Aromatic Hydrocarbons,
PFAS: Per- and polyfluoroalkyl substances,,
N.D.: Not detected,
N.A.: Not available,
FoA: Frequency of appearance,
FoE: Frequency of exceedance,
EoE: Extent of exceedance.
DSFP: Digital Sample Freezing Platform
Contributors
Lead Author: Brendan McHugh
Supported by: Working Group for Monitoring and on Trends and Effects of Substances in the Marine Environment (MIME), the Network of reference laboratories, research centres and related organisations for monitoring of emerging environmental substances (NORMAN) Network and the Hazardous Substances and Eutrophication Committee (HASEC).
Citation
McHugh, B. 2022. Wide-scope target and suspect screening of emerging contaminants and their transformation products in marine biota samples from the North-East Atlantic. In: OSPAR, 2023: The 2023 Quality Status Report for the Northeast Atlantic. OSPAR Commission, London. Available at: https://oap.ospar.org/en/ospar-assessments/quality-status-reports/qsr-2023/other-assessments/connect-study