

Condition of Benthic Habitat Communities: Margalef diversity in Region II (Greater North Sea)
Background
Benthic (seafloor) habitats are essential for marine life because marine species rely directly or indirectly on the seafloor to feed, hide, rest or reproduce. Benthic habitats are characterised by animal (and algal/plant) communities with no or limited mobility. A substantial part of the community is exposed when a bottom pressure occurs, as many species have limited opportunities to escape. Specific species and/or communities are however more or less sensitive towards different types of pressures. As a result, the condition (quality status) of benthic habitats reflects the combined effect of all the pressures put upon them. The number of species corrected for their abundance (Margalef diversity), can be used as an indicator for the impact of different pressures (e.g., physical disturbance and extraction of species by fisheries, nutrient and organic enrichment, sedimentation and contaminants) on the benthic habitat and community condition.
The Margalef diversity index (DM) is a more robust and relative straightforward indicator among current habitat quality assessment indicators (Van Loon et al., 2018). Compared to OSPAR’s Intermediate Assessment (IA2017), the application of the Margalef diversity index has been extended to the entire Greater North Sea in case sufficiently representative benthic community data were available. Adjustment of the methodology includes assessments being done at the level of Broad Habitat Types (BHTs) within Assessment Units, making use of related realistic references (Dref), estimated on the basis of observations in low (fishing) pressure areas. Assessments are based on grab/core (approximately 0,1 m2) and small core (0,0143 m2) benthic community monitoring data.
Condition of Benthic Habitat Communities: Margalef diversity in Region II (Greater North Sea) Assessment Units. Available at: ODIMS
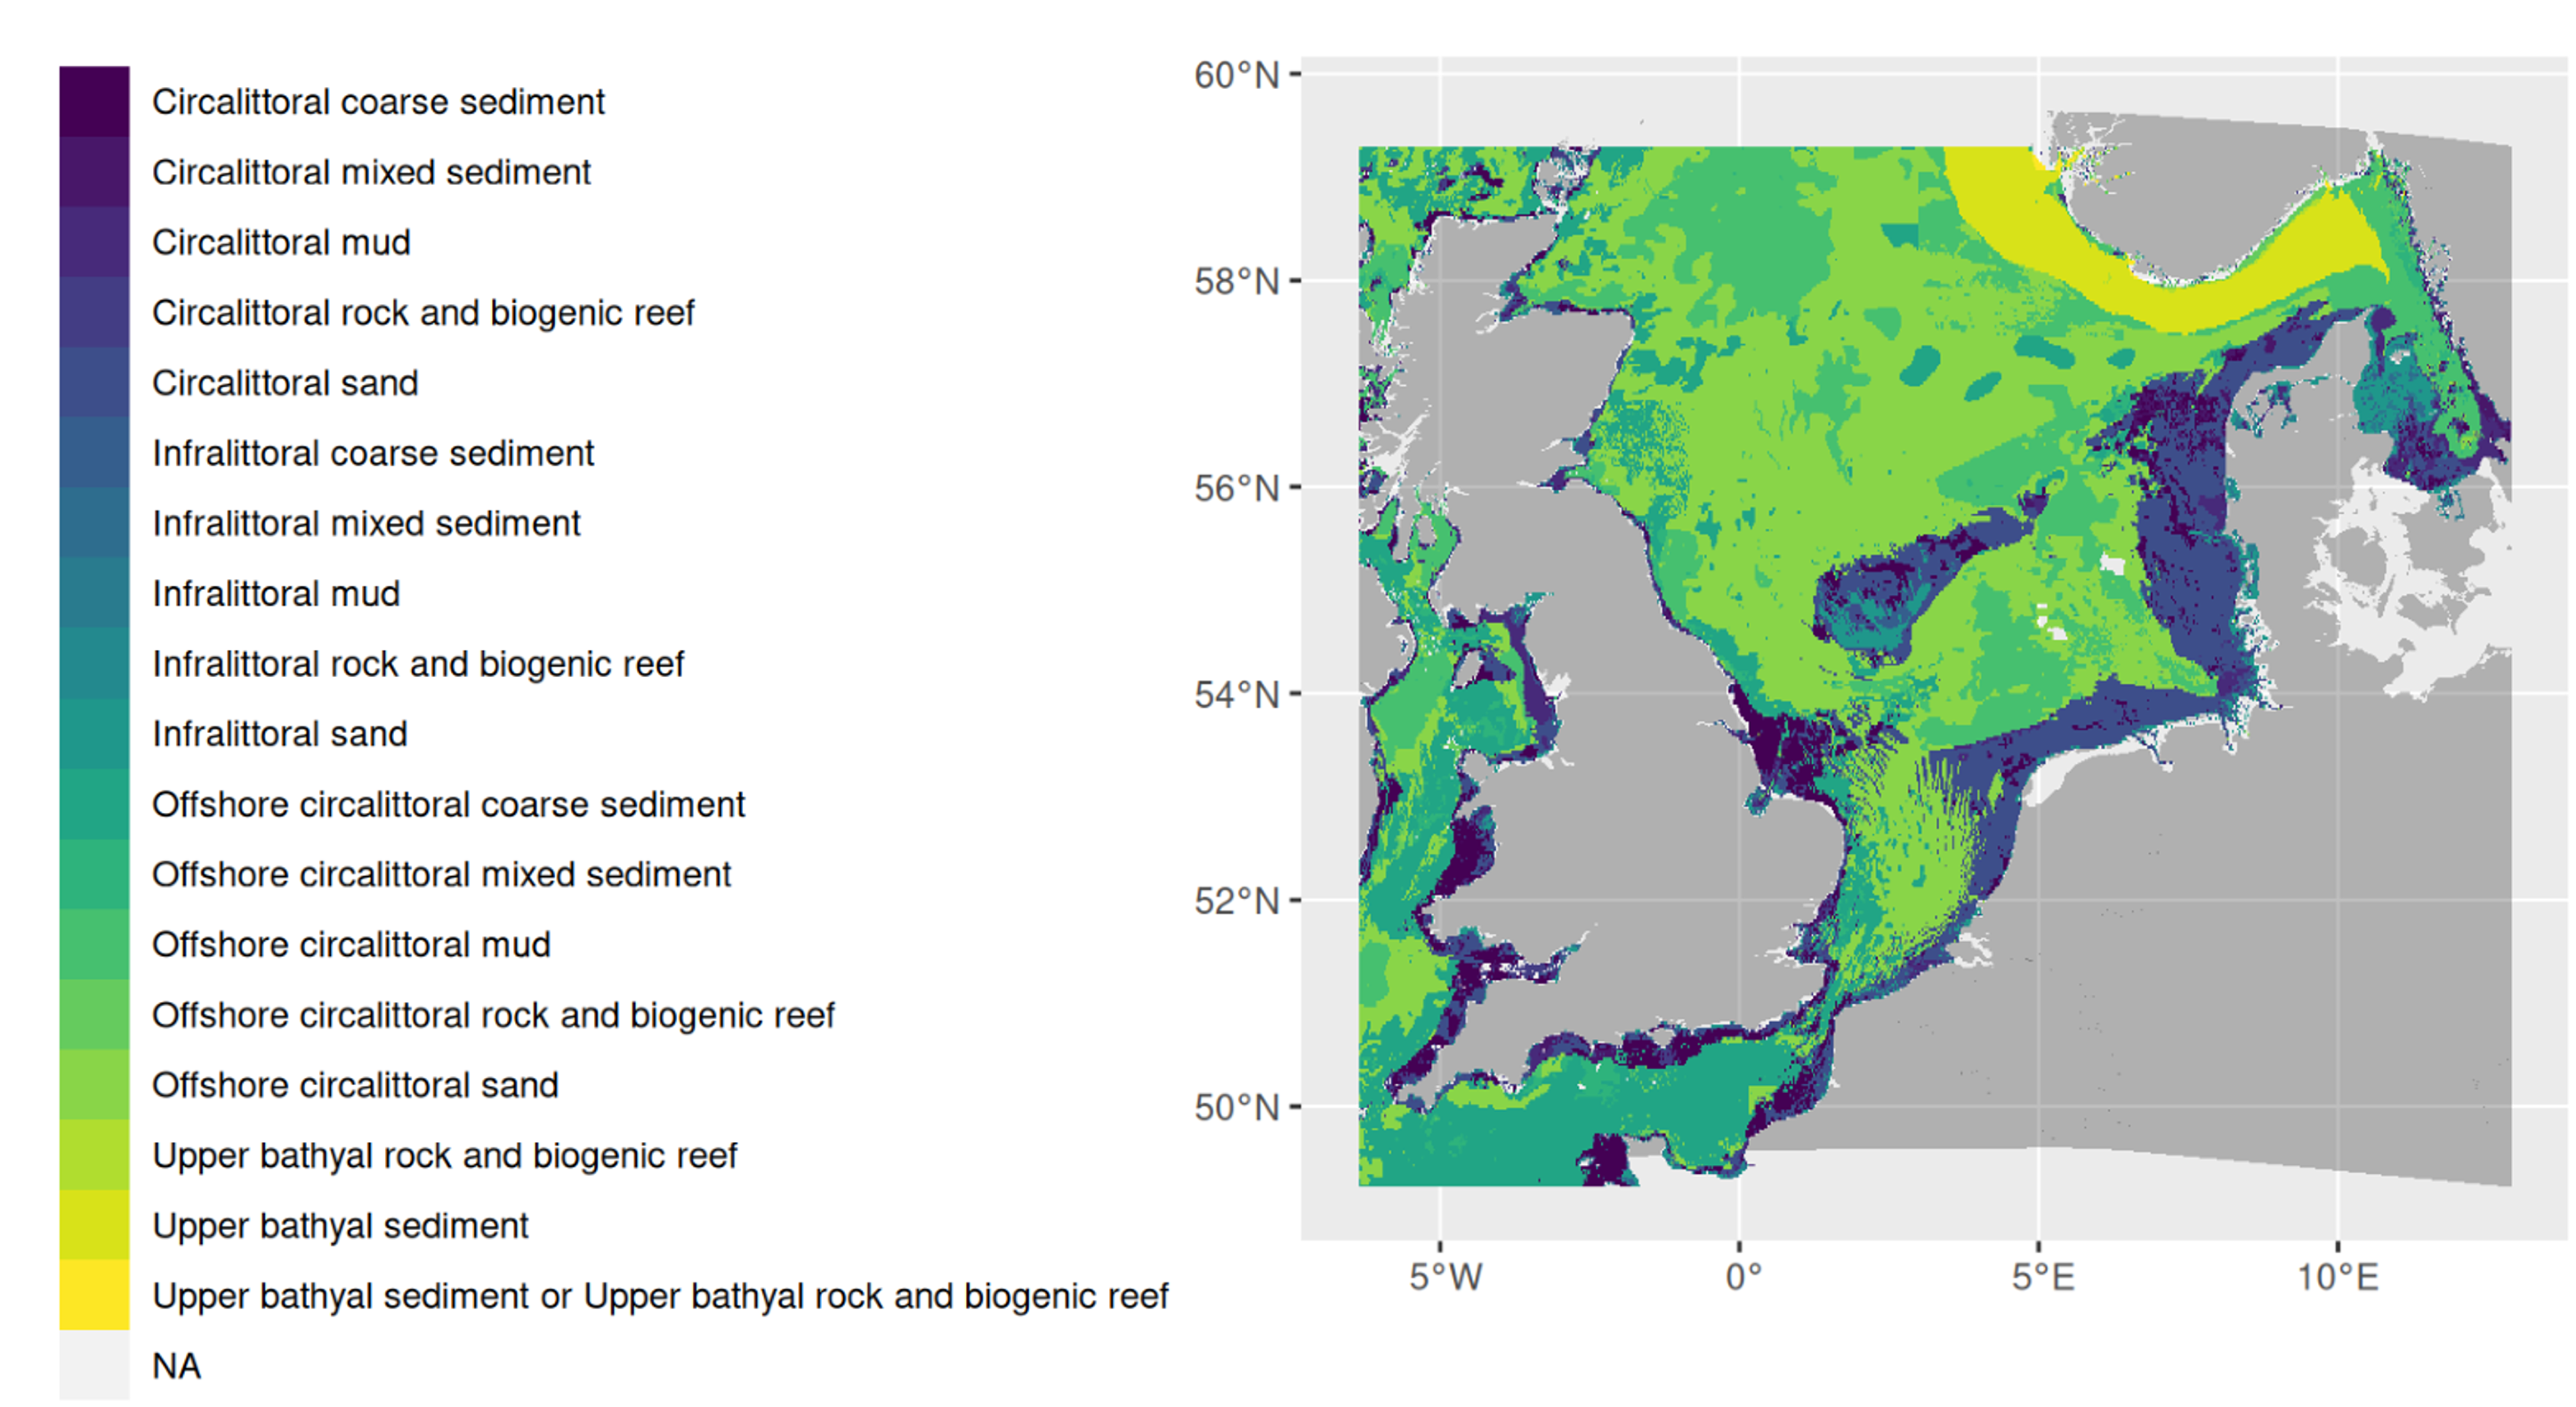
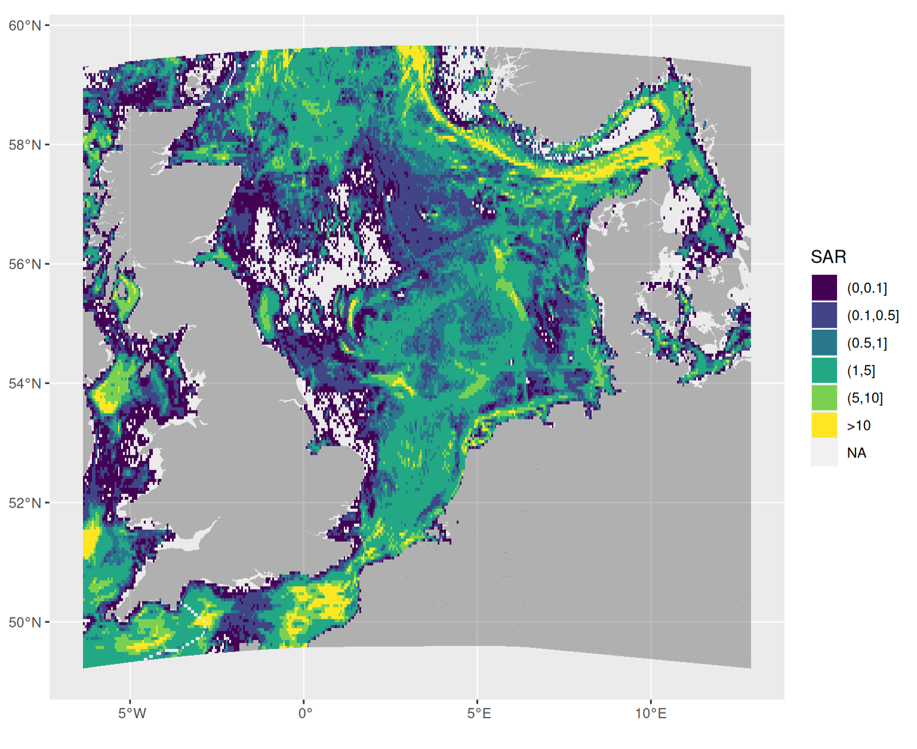
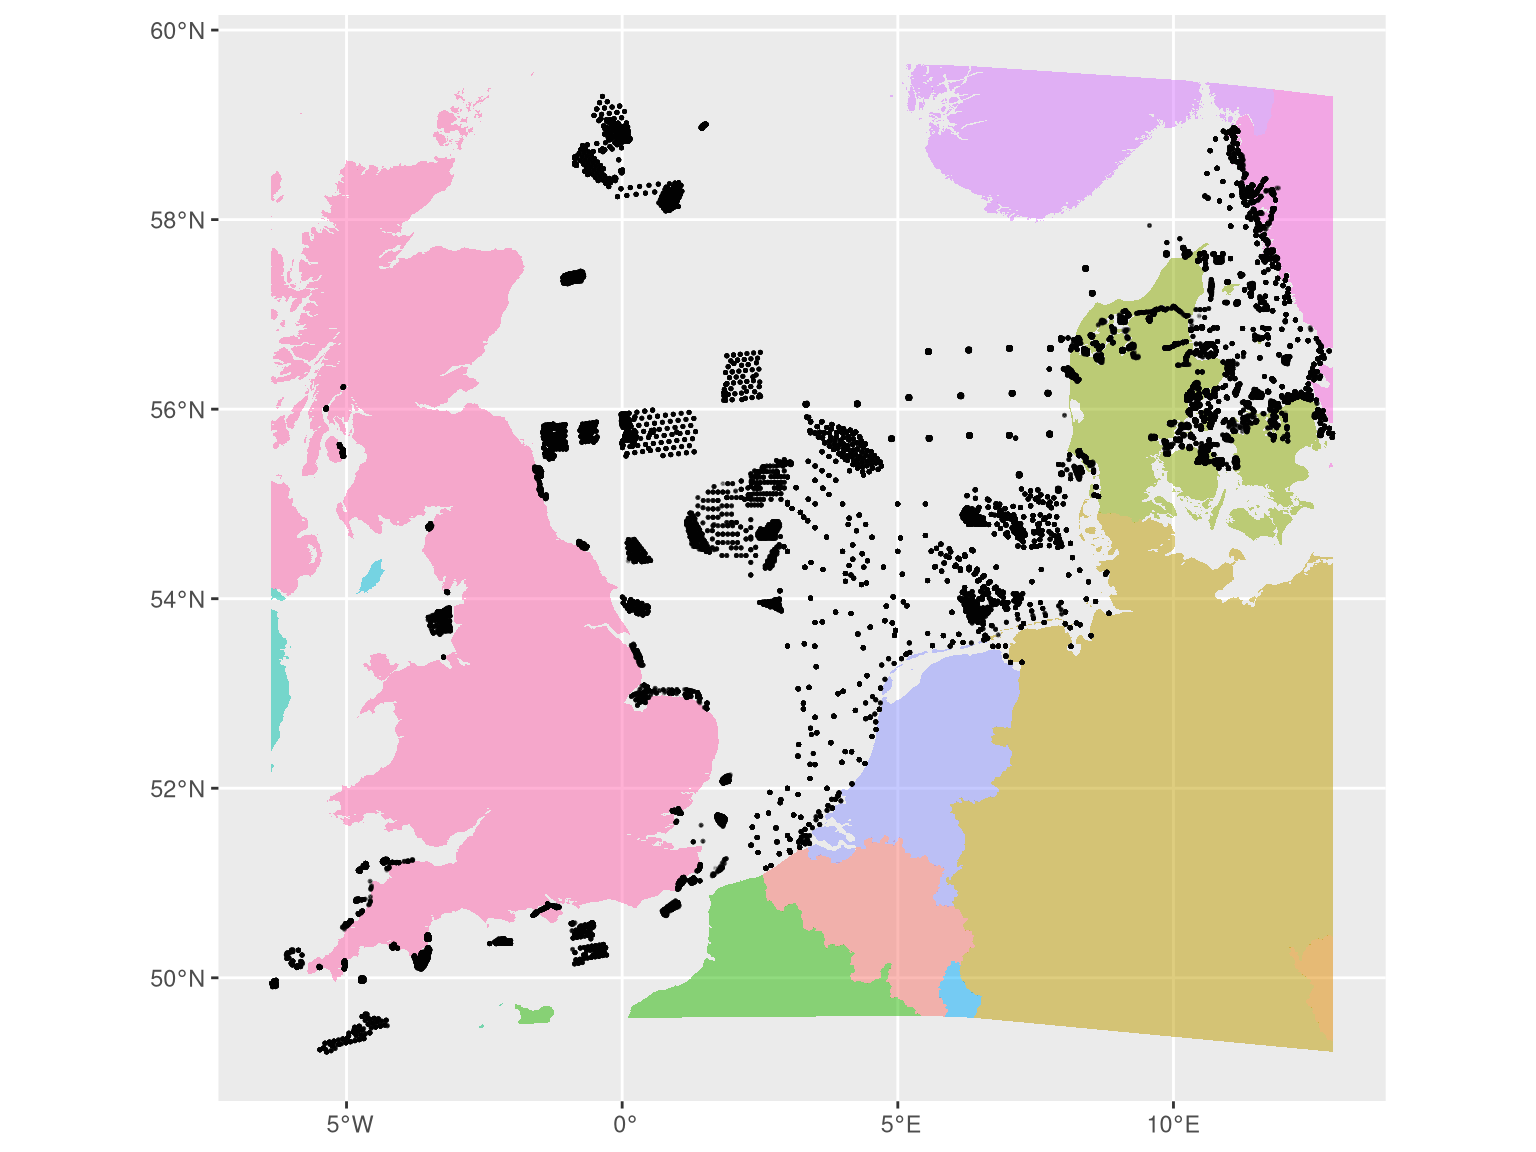
Figure 1: Region II (Greater North Sea). Positioning of benthic community sample sites for the 1998-2021 period (upper left). Assessments are done at the level of MSFD Broad Habitat Types (BHTs; according to EUSeaMap, 2021) (lower left) within OSPAR Assessment Units (AUs) (upper right), excluding inland waters. Level of physical disturbance due to seafloor contacting fisheries, indicated as average Swept Area Ratio (SAR) per year at the level of c-squares during the years 2013-2018 (ICES EUTRADE, 2021) (lower right), is used to select low-pressure samples to estimate Margalef reference values
Relative Margalef diversity (DM') is an indicator that can, in principle, be applied to each (sub)region and each type of habitat (besides BHTs also Other Habitat Types; OHTs). DM’ can be calculated for any type of community data where the sampling, laboratory procedures and specimen recordings including taxonomy are standardised as much as possible. If standardisation is incomplete this can lead to deviations in assessment results due to the methodology. Full standardisation is problematic at the moment as there is no standardised benthic monitoring protocol agreed and applied at subregional level (data according to national procedures are now combined as much as possible). Being too strict in standardisation might lead to a lot of different categories (with different procedures) which dilutes the data availability per case and might result in fewer reliable assessment results. In principle it is not that problematic to use some different categories for the assessments, as category specific reference values (Drefs) for Margalef diversity will be estimated. Dref is estimated by taking the 75, 95 or 99 percentile value for Margalef diversity index (DM), based on individual sample recordings, distinguishing the different monitoring technique (categories) and for each BHT within an Assessment Unit (AU) for each country and for different low-pressure categories. The indicated percentile values respectively relate to the average Swept Area Ratio (SAR) per year 0-0,1, 0,1-0,5 and 0,5-1 categories in case of expected good representativity of data. The relative representativity is indicated by a quality code for the respective subset based on number of samples and monitoring years covered (see Table b). If the quality code is not optimal (not ‘1’), the highest percentile value is used to estimate the reference, in case the 99 percentile was not reached. The specific data set should at least consist of 20 samples (quality code =3) to allow for direct Dref estimation. Percentile values in relation to Quality Coding of data sets is used to cover the chance that the samples are nevertheless impacted by fisheries, and/or account for natural variability, possible effects of other disturbances, and the fact that reference conditions are more likely to be missed if the sampling effort is low. According to this procedure a maximum of three values for Dref per case are obtained (three low-pressure categories) of which the highest value will be used in the calculation of the case-specific DM’. With regards to estimation of Dref it might be problematic to obtain sufficient data from low-pressure areas. A second-best solution is not to obtain Dref directly through data from low-pressure areas of a particular case (Assessment Unit x Country x BTH) specific for a sampling method category, but to estimate a most likely value taking into account the median values for AUs, countries, depth/photonic strata and sediment types. By using case-specific Dref values to calculate the relative Margalef diversity DM’ the results are to a large extent comparable among different cases, compared to an approach where assessed Margalef diversity is used. Comparability will be reduced if monitoring techniques with different characteristics (including different surface areas, mesh sizes or taxonomy levels) are combined in the same category. Such methodological differences can be reflected in a variation of the focus of the samples for different aspects of diversity (e.g., specific size classes, taxonomic classes, species traits) that might vary in sensitivity to impact from different pressures.
Crucial aspects that might lead to uncertainty with regards to the assessment results are:
- Whether reference setting using pressure mapping is realistic in terms of completeness and spatial accuracy, whether it is representative for all benthic community data included in the analyses, and whether it addresses all dominant pressures. In this regard, it should be noted that the current assessment is solely based on the distribution of physical disturbance by fisheries for the period 2013-2018 and that small vessels are not included. Also, the representativity of the pressure map is likely to be lower for benthic community data of before 2013. Although physical disturbance by fisheries might generally be the dominant disturbance with regards to benthic habitats, several other disturbances might also be important. This is especially the case for those areas that are considered as low-pressure areas (absence of fisheries impact might increase the importance of other disturbances). In specific cases the narrative that explains the assessment result attempts to take certain additional disturbances into account even if they have not been fully included in the quantitative assessment.
- Habitat mapping is not as accurate as suggested by detailed maps. Habitat mapping is largely based on modelling and does not include spatially detailed field validation. Misclassification of habitats might lead to deviating assessment results, as benthic community observations are then judged against incorrect references. In addition, it should be noted there are deviations between classifications used for EUNIS mapping at various (detail) levels and the EUSeaMap BHT map used in this assessment. Whereas EUNIS, at least in recent years, distinguishes between sandy sediments and muddy sediments at a mud content of 20% (Evans et al., 2016), for the EU Broad Habitat Types the mud content is 10% in the EUSeaMap BHT map (EUSeaMap, 2021). This BH2b common indicator assessment uses the 10% threshold values of mud content as standard to distinguish sandy and muddy sediments. Due to these issues, comparing the results with national assessments or with other OSPAR common indicator assessments that distinguish habitat types at a more detailed level of classification (and using EUNIS classifications at those levels), might result in deviating percentages and spatial patterns of habitat distribution.
- Although the current methodology may be seen to suggest the existence of a spatially representative monitoring programme, this is not necessarily the case and in several instances appears to not be the case. Where monitoring effort (in numbers of samples) is sufficient, it is reflected in the reliability of the assessment results. However, in several cases monitoring effort is designed to focus on specific areas (often MPAs) with specific activities and pressures or management, etcetera. This might result entire gradients of pressure not being covered within BHTs. Moreover, those areas with specific activities and pressures or management are likely to not be representative for entire BHTs within AUs. In addition, the current assessment might not be entirely representative for entire BHTs x AUs (which is however the level of assessment within OSPAR). There might also be variability in the representativity of monitoring between assessment periods (i.e., 1998-2008, 2009-2015 and 2016-2021) for which results are directly compared in this assessment, which may result in differences in quality status of BHTs over different assessment periods which might in fact be more related to changes in monitoring designs than a state change for the benthic habitat. The narrative indicates if the assessment result and patterns therein are likely to be the result of changing monitoring designs rather than an actual state change. This observation bias requires future efforts to adjust monitoring design so that the collected data become more representative for large-scale assessments. This might be realised more easily through (sub)regional joint monitoring efforts.
Relative Margalef diversity
Geographic Area and Period Assessed:
The Benthic Habitat Quality of the Greater North Sea, subdivided into OSPAR Assessment Units (AU; i.e., Central North Sea, Southern North Sea, Channel, Kattegat and Norwegian Trench) and Broad Habitat Types (BHTs, as defined in EU MSFD) (Figure 1), is assessed using Relative Margalef diversity. In principle an assessment is proposed for each AU x BHT combination, excluding the intertidal and hard substrate habitat type (which are not specifically targeted by the monitoring techniques and thus benthic community data suitable for this assessment approach were not available). Grab and core samples reported as sampling hard substrate habitat types (as BHT characterisation of samples is based on the coordinates related to EU MSFD Broad Habitat mapping; EUSeaMap, 2021) are considered samples of mixed sediment, since the used sampling technique indicates that the exact sampled location must have had soft substrate present. Due to the presence of hard substrate in the vicinity, the presence of a mixed sediment type is the most likely BHT, in many cases consisting of deposited sediment (mud or sand dependent on the energy conditions near the seafloor) on or near hard substrate structures. It should be noted that the EUSeaMap is largely based on modelled data and therefore the estimation of habitat type can deviate from local small-scale observations. Broader-scale patterns in BHT distribution will generally be sufficiently accurate to extract a set of samples that will in reality be predominantly linked to the BHT of concern. Occasional ‘miss-classification’ due to modelling can result in variability that can also be expected in reality (borders between BHTs are transitions in reality and furthermore likely to change over time), however in certain areas the mismatch of modelled and actually present habitat types (for instance indicated by the benthic community observation data) is quite large. Strengthened efforts to improve habitat mapping and consistency are needed in the future, since habitat mapping forms the basis for all benthic habitat assessments. Current classification used in the Broad Habitat Type map (EUSeaMap, 2021) does however not match the finer-scale classifications from EUNIS (Evans et al., 2016). This is somewhat problematic in the comparison with other Benthic Habitat indicator results (such as BH3 and BH4 assessments) where, in addition to BHTs, fine-scale habitat classification is used.
With the current methodology, assessments can be done, if sufficiently representative monitoring data are available, at the level of Broad Habitat Type within Assessment Unit per Country (AU x BHT x Country) for each of the monitoring technique categories (sampling techniques combined in a category with similar/comparable characteristics).
Data Gathering:
With an OSPAR data call, benthic community data were gathered for the years 1998-2021. For the QSR2023, the quality status of benthic habitats for most recent years (2016-2021) is assessed and compared with the period 2009-2015 (IA2017) and the period 1998-2008 (QSR2010). Where there is a lack of data for the years 2016-2021, the results of 2009-2015 are presented as an estimation of the most recent situation, however with an indication as having lower confidence in accordance with Table b.
Datasets:
Initially three monitoring categories with sufficient data availability are considered: i.e., grabs and cores with approximately 0,1 m2 sampled (‘grab-core’ being broadly applied in most Greater North Sea countries), small cores of 0,0143 m2 sampled (‘small cores’ being the common approach in Denmark), both sieved over 1 mm mesh, and dredge and trawl samples of at least 3 m2 aperture (but in practice up to several 1000s of m2 large) sieved over 0,5, 1 and 2,2 cm mesh size. It appeared that the last category showed too much internal variation reflected in the benthic community results (as for instance shown in the expected reference values for Margalef diversity). It was therefore decided not to consider the last category for the time being (further subdivision in different techniques might be an option for the future, but this would result in low data availability per monitoring technique and few or no countries with the same technique in the assessments, which in turn would impede comparison of assessment results). In principle the relative Margalef diversity (DM’) assessment methodology is suitable for any benthic community monitoring technique, at least when methods and data analyses are sufficiently standardised. Variability of assessment results are expected to be much smaller than variability related to different pressure levels.
Benthos data are supplied by Belgium, Germany, Denmark, Sweden, the Netherlands and the United Kingdom, and processed by the Netherlands. Table a indicates the BHTs per Assessment Unit (AU) for which benthic community data, categorised as being ‘grab-core’ (GC) or ‘small core’ (SC) data, are available to do benthic habitat quality status assessments at the level of AUs.
Table a: Overview of quality status assessments for Broad Habitat Types (BHTs) per Assessment Unit (AU) for which recent benthic community data are available. In case no (or limited) data are available for the 2016-2021 period, data from the 2009-2015 period are used to estimate the current quality status (although in that case no information on recent developments in the quality status are available). Benthic monitoring data are obtained with techniques either categorised as ‘Grab-Core’ sampling (GC) or as ‘Small Core’ sampling (SC); indicated between brackets in case less than 5 samples are available. Current assessments will lead to results for each of those categories, although representativity of data in terms of amount of data and spatial (and temporal) distribution should be considered as well.
| Broadscale habitat type | Central North Sea | Southern North Sea | Channel | Kattegat | Norwegian Trench |
|---|---|---|---|---|---|
| Infralittoral coarse sediment | GC | GC | SC | ||
| Infralittoral mixed sediment | GC | GC/SC | (GC) | GC/SC | GC |
| Infralittoral sand | GC | GC/SC | GC | GC/SC | |
| Infralittoral mud | GC/SC | GC | GC/SC | GC | |
| Circalittoral coarse sediment | GC | GC/SC | GC | GC/SC | |
| Circalittoral mixed sediment | GC | GC/SC | GC | GC/SC | GC |
| Circalittoral sand | GC | GC/SC | GC | GC/SC | (GC) |
| Circalittoral mud | GC | GC/SC | GC | GC/SC | GC |
| Offshore circalittoral coarse sediment | GC/SC | GC/SC | GC | GC/SC | (GC) |
| Offshore circalittoral mixed sediment | GC | GC | GC | GC/SC | GC |
| Offshore circalittoral sand | GC/SC | GC/SC | GC | (SC) | GC |
| Offshore circalittoral mud | GC/SC | GC/SC | GC/SC | GC/SC | |
| Upper bathyal sediment | GC |
Quality status assessments at the level of AUs often include data from different countries. Due to data availability, the relative Margalef diversity is also calculated at the level of individual countries (i.e., for AU x BHT x country). Reducing the size of areas for which the quality status is estimated might reduce (natural) variability. However, the number of available samples is also likely to be reduced.
Data standardisation:
It is of utmost importance that methodologies (sampling, laboratory) are standardised as much as possible as deviations will affect index outcomes. The first step in standardisation is the categorisation of sampling methodologies of the same kind (similar sample devices, sample surfaces, mesh sizes and preferably similar laboratory procedures) to allow suitable sample selection. In this case two categories were indicated with sufficiently comparable data for assessments. Those categories are ‘grab-core’ samples (sampled surface area around 0,1 m2 and mesh size of 0.1 cm) and ‘small core’ samples (sampled surface area around 0,0143 m2 and mesh size of 0,1 cm). The second step is taxonomic standardisation. At the moment there is no OSPAR standard for benthic community monitoring in use by all countries providing data. Therefore, the standards used for benthic community data are largely determined by the relative lowest standards in use with regards to the community data provided (or certain ‘lower standard’ samples should be excluded from the assessments. ‘Lower standard’ is no qualification of the sampling or sorting procedure as such, but refers to the level of taxonomic identification of specific species or groups. As benthic monitoring data are often used or collected for various applications (and in the first place not necessarily for broad-scale application within OSPAR) there are often good reasons to not identify all specimens to species level. Each of the participating countries indicated the level of taxonomic identification (e.g., to what taxonomic level specimens are identified) for taxa included in the samples provided (for the specific monitoring technique category) and whether specimens are counted, only presence is recorded or whether specimens are identified at an alternative level or not recorded at all. For comparability, the lowest level of taxonomy and recording can be adapted, or certain subsets can be excluded (in case the used standard is substantially lower than for the majority of the data). The resulting taxonomic standardisation - as accepted for the samples used for the QSR2023 assessments - is provided by ‘Taxonomic standardisation for BH2b application Region II v220222’ where taxa are included in the analyses/assessments according to ‘Species_List_Grab-Core’ for both ‘grab-core’ samples and ‘small core’ samples.
Parameter/metric: Margalef diversity:
As a measure of benthic habitat quality, the Relative Margalef diversity index is used. The indicator is described in detail in Annex 3 of the CEMP guideline of BH2 (OSPAR 2022). BH2b makes use of the traditional Margalef diversity index (DM) in principle defined as species richness divided by the number of specimens, specifically as:
with S = number of species (or defined taxa) and N = number of specimens, both per sample.
With some datasets replicate samples (same station, same year/period) were provided. Treating them as separate samples would put the emphasis on the locations with replicates (entering similar observations several times as being representative for huge areas without data and artificially decreasing variability). Only selecting one replicate would mean potential loss of information in the assessments. Therefore, Margalef diversity was calculated for each of the replicates, but only the median value of related replicates was included in the assessments as the Margalef diversity as observed at the specific site.
To achieve large-scale comparability, Margalef assessments are put in perspective by presenting Margalef diversity relative to the case specific reference value for Margalef diversity (Dref). As there are naturally occurring differences in diversity under good quality status related to habitat type (or spatial distribution of the variety of habitat types) and geographical positioning (relation with large-scale abiotic patterns in conditions), habitat and assessment unit specific reference values for Margalef are estimated. Estimated reference values are also monitoring category (in this case ‘grab-core’ or ‘small core’ category) specific. Taking reference values for DM into account results in increased comparability of the assessment results. After first applications it was clear that regardless of the efforts made to achieve maximum standardisation among datasets, this was not sufficient to overcome methodological differences among countries with effects on assessment results. Therefore, in current assessments specific Dref values at the level of countries (x AUs x BHTs) are defined.
Reference values estimation:
Relative Margalef diversity (DM’) equals the Margalef diversity compensated for the case-specific reference, i.e.,:
where Dass = Margalef diversity as calculated (assessed).
Dref is not necessarily a pristine reference for the Margalef diversity, but rather a realistic reference in the current situation taking current species pools into account and is estimated on the basis of low-pressure observations.
As physical disturbance due to fishing pressure is largely the dominant pressure (ICES, 2021a,b), Dref is estimated taking a certain percentile value from the set of observations (samples) from low-pressure areas as indicated by the recorded average Swept Area Ratio (SAR) per c-square per year for the years 2013-2018 (ICES EUTRADE, 2021); see Figure 1. The percentile value to be taken is determined by pressure class (which however always has to be low), and the expected representativity of the data, as indicated by the number of samples and the number of monitoring years involved (Table b). As (BHTs within) assessment units are generally large areas where variability within the area can be expected, the first concern is to have sufficient samples. As year-to-year variation can be expected, although natural variability in diversity is not expected to be very large when no changes in pressure level are at stake, compared to spatial variability, the inclusion of data from more years is a secondary concern. This is the first approach to set the reference Margalef diversity (Dref) value.
Table b: Quality codes for data sets; taking account of sampling efforts and potential effects of year-to-year variation reflected in the potential to use data sets to define the reference D and reflected in the confidence of assessment results. The use of older data (former periods) for current status assessments and using data with reduced spatial representativity (indicated by the percentage of area covered by the benthic community samples) are reflected in reduced confidence level as indicated. SAR= Swept Area Ratio
| Quality code | 5 | 4 | 3 | 2 | 1 |
|---|---|---|---|---|---|
| Samples (n) | <10 | ≥10 | ≥20 | ≥30 | ≥50 |
| Covering n years | ≥2 | ≥3 | |||
| Percentile value to derive Dref | |||||
SAR 0 - 0,1 | 99% | 95% | 75% | ||
SAR 0,1 - 0,5 | 99% | 95% | |||
SAR 0,5 - 1,0 | 99% | ||||
| Final Dref is the highest value as obtained from up to three estimations based on distinguished low SAR classes (here SAR 0-0,1, SAR 0,1-0,5 and SAR 0,5-1) | |||||
| Confidence of assessment of current status in case of representative spatial distribution of samples over area of concern: | |||||
| Based on 2016-2021 data | Poor | Low | Sufficient | Good | High |
| Based on 2009-2015 data | Poor | Poor | Low | Sufficient | Good |
| Based on 1998-2008 data | Poor | Poor | Poor | Low | Sufficient |
| Level of reduction of confidence in case of reduced representativity of spatial distribution. | |||||
| Sample sites cover (or are representative for) at least 75% of assessed area | No reduction | ||||
| Sample sites cover between 25 and 75% of assessed area | 1 level of reduction | ||||
| Sample sites cover less than 25% of assessed area | 2 levels of reduction | ||||
Using a percentile value (instead of a maximum value) takes into account (within BHT) natural variability in diversity at local scale. As physical pressure due to fishing activities is not evenly distributed but shows a pattern of impacted lines of a certain width in largely non-impacted areas, a high percentile value is likely to be a realistic value as a reference or diversity. The percentile value is however increased when expected pressure (although low) is slightly higher or data availability and/or representativity is lower (Table b) (in such cases the chance of missing the real reference with the monitoring programme is larger). In most of the cases this approach will achieve the aim, however it is recognised that in specific situations other pressures or even recurrent natural disturbances might be important in determining diversity as well. Although the focus here is on physical disturbance due to fisheries, in principle all disturbance levels should be low in the areas on which data references are based. Some occasional local disturbance of another kind is not problematic as it will not influence the estimated reference by the selection of a high percentile value. Diffuse or large-scale disturbance might however affect the assessment results (not necessarily with regards to within case (BHT x AU x country) temporal or spatial patterns in DM’, but in comparability of results with other cases and/or with quality threshold values).
On the other hand, there are also cases where countries are confident that presumed fishing activities based on VMS recordings reflected in calculated SAR values cannot be true (for instance in the case of fishing activity identified in harbour areas). In that case the SAR values that might have been misleading were corrected into the lowest fishing pressure category of SAR 0-0,1 which was done for a closed area for fisheries in Sweden. Herewith the data availability to extract a reliable reference was increased for certain BHTs in the Kattegat. It should be noted that this is not standard procedure in other parts of the Greater North Sea. This is because it is also known that in certain cases fishing in protected areas has indeed taken place implying that SAR patterns provided by ICES might be correct. This assessment method applies an approach of including only samples for which there is no doubt about SAR values might be due to misinterpretation of VMS data. As a consequence, data availability to extract reference values might be slightly lower than it could be. This is however preferred to artificially lowering the reference value by accidentally including samples from physically disturbed areas in the reference estimation.
One to three potential Dref values are obtained (Table b) depending on whether there are sufficient low-pressure samples related to the indicated classes, that are basically of about the same magnitude. The highest value is adopted as the reference value to calculate the case specific DM’.
The second approach, when there is low data availability for low-pressure situations for certain cases (i.e., only quality code 4 or 5 which can be the result of low monitoring efforts or lack of low-pressure situations), is to estimate Dref by taking the arithmetic average value from obtained Dref values for cases with sufficient data, taking 4 variable classes into account. The arithmetic average is taken over the Assessment Unit, country, depth/photonic zone and sediment type (e.g., averaging the Dref values average for the circalittoral zone, mud as sediment type, Southern North Sea (as AU) and Belgium, in case of the estimation of Dref for circalittoral mud in the Belgian part of the North Sea. If no Drefs are available for Belgium (lack of sufficient low-pressure data; i.e., at least 20 samples per case needed), the average Dref of all countries is used for Belgium in the calculation).
To make quality assessments based on Margalef diversity independent of sampling and laboratory methodology, or type of area (e.g., habitat type or geographic positioning), case-specific references (Drefs) are defined. By dividing assessed diversity by the case-specific (i.e. combinations of sampling methodology category, AU, BHT and country) reference value, a relative value (Margalef diversity) is obtained on a comparable scale. Ideally all aspects are completely standardised so that each deviation delivers its own reference. In practice this cannot be achieved as it would lead to a huge number for specific references, it would not be possible to calculate these since for good reliability a number of observations for low-pressure situations for each case is essential to cover natural variability in diversity. The middle ground is to define categories (in sampling methodology or sample treatment) that are to a certain extent standardised but that have (in several cases) a sufficient amount of data. With an increased number of samples, the variability within case/category is likely to increase. If variability in Margalef diversity is expected to be much smaller than quality or pressure related variability in Margalef diversity, it can be a good strategy to merge data. It was observed that merging data from different countries in assessments with common reference values at the level of (BHT within) Assessment Units did lead to increased variability. To clear patterns in DM’ assessment results dictated by national borders instead of expected pressure levels for benthic habitats it was decided to not merge samples from different countries in the calculation of reference Margalef values at the level of BHTs within AUs, but to do that for each country separately.
The use of percentile values to take account of natural variability and occasional minor pressures to extract reference values for Margalef diversity and to increase the percentile taken in case of (although low) slightly higher levels of the known dominant pressure seems to be a good way to come to realistic reference values. This is confirmed by the fact that reference values for the same case (a specific sampling category x BHT x country x AU combination), in cases where estimation is based on more than one of the low-pressure classes, were generally of the same magnitude, and not consistently higher for one of the pressure classes.
Depending on the fishing pressure for the potential reference data set (set of data related to average SAR between 0-0,1, 0,1-0,5 or 0,5-1) the 75, 95 or 99 percentile index value is selected in case the dataset is sufficiently large and consists of data from different years (defined as quality code 1 dataset; Table b) for the specific case (BHT x AU x country combination per sampling category), in line with Van Loon et al., (2015, 2018). The use of the 99 or 95 percentile value as a potential reference value accounts for a certain amount of index degradation as suggested by Hering et al., (2006). For example, in a pristine assessment area the 50 percentile Margalef diversity value would be the correct reference value (but pristine situations are not expected in Region II).
This estimation of lower assessment area degradation is defined based on fishing pressure estimation at the c-square level (ICES EUTRADE, 2021). (It should be noted that this is not consistent with the identification of quality classes in Van Loon et al., (2018), where two different definitions are presented). There is no need to go into further detail with regard to pressure distributions, as physical disturbance distribution is only used to select low to no pressure areas (pressure mapping is not part of the diversity calculation). So, in this case a rather conservative methodology is used to select suitable areas for reference estimation. Using more detailed information on pressure distributions would suggest that all information used (e.g., positioning of vessels causing impacts and whether there is contact with the seafloor, area with impact around fish tracks, habitat characterisation, specificity of sample for larger area surrounding exact sample site) is very accurate.
Table c: Case-specific Margalef diversity reference values (Dref) as used in the calculation of the Relative Margalef diversity (DM’= Dass/Dref. Dref values indicated in black are obtained based on sufficient monitoring data (i.e., datasets for the respective combination of Assessment Unit (AU) x Broad Habitat Type (BHT) x Country per monitoring category indicated with quality code 1-3 for at least one of the low fishing pressure classes ‘SAR 0-0,1’, ‘SAR 0,1-0,5’ and ‘SAR 0,5-1’; see methodology for identification of reference value for DM). Dref values indicated in red are obtained by calculating the arithmetic average of average Dref values for class characteristics of concern (i.e., based on average value for AU, country, sediment type and depth/light stratum of concern for the respective monitoring technique). All results are related to ‘grab-core’ sampling, except for the results for DK* (Denmark with asterisk) which are specific for ‘small core’ samples.
| Central North Sea | BE | DE | DK* | NL | SE | UK | DK |
| circalittoral coarse sediment | 8,3 | 8,8 | |||||
| circalittoral mixed sediment | 8 | ||||||
| circalittoral mud | 7,6 | 7,8 | |||||
| circalittoral sand | 9,3 | 7,8 | 4,9 | ||||
| infralittoral mixed sediment | 7,6 | ||||||
| infralittoral sand | 7,8 | ||||||
| offshore circalittoral coarse sediment | 4,3 | 11,9 | |||||
| offshore circalittoral mixed sediment | 8,3 | ||||||
| offshore circalittoral mud | 7,9 | 4,6 | 11,5 | ||||
| offshore circalittoral sand | 8,5 | 4,1 | 10 | ||||
| Southern North Sea | BE | DE | DK* | NL | SE | UK | DK |
| circalittoral coarse sediment | 7,6 | 6,7 | 2,7 | 7,7 | 8,7 | 7,1 | |
| circalittoral mixed sediment | 6,7 | 4,8 | 7,3 | 6,3 | |||
| circalittoral mud | 7,1 | 1,3a | 4,6 | 7,1 | 7,6 | 6,5 | |
| circalittoral sand | 7,1 | 8,7 | 4,2 | 7,5 | 7,6 | 6,5 | |
| infralittoral coarse sediment | 7,2 | 7,7 | |||||
| infralittoral mixed sediment | 4,7 | 6,9 | 5,9 | ||||
| infralittoral mud | 6,5 | 2,9 | 7,2 | 3,1 | |||
| infralittoral sand | 3,5 | 4,4 | 6,7 | 7,2 | 3,6 | ||
| offshore circalittoral coarse sediment | 8 | 7,8 | 4 | 8 | 10,3 | ||
| offshore circalittoral mixed sediment | 7 | 7,6 | |||||
| offshore circalittoral mud | 7,4 | 7 | 3,8 | 7,3 | 7,9 | ||
| offshore circalittoral sand | 7,4 | 8,6 | 4,6 | 7,9 | 7,9 | ||
| Channel | BE | DE | DK* | NL | SE | UK | DK |
| circalittoral coarse sediment | 8,8 | ||||||
| circalittoral mixed sediment | 8,1 | ||||||
| circalittoral mud | 8,3 | ||||||
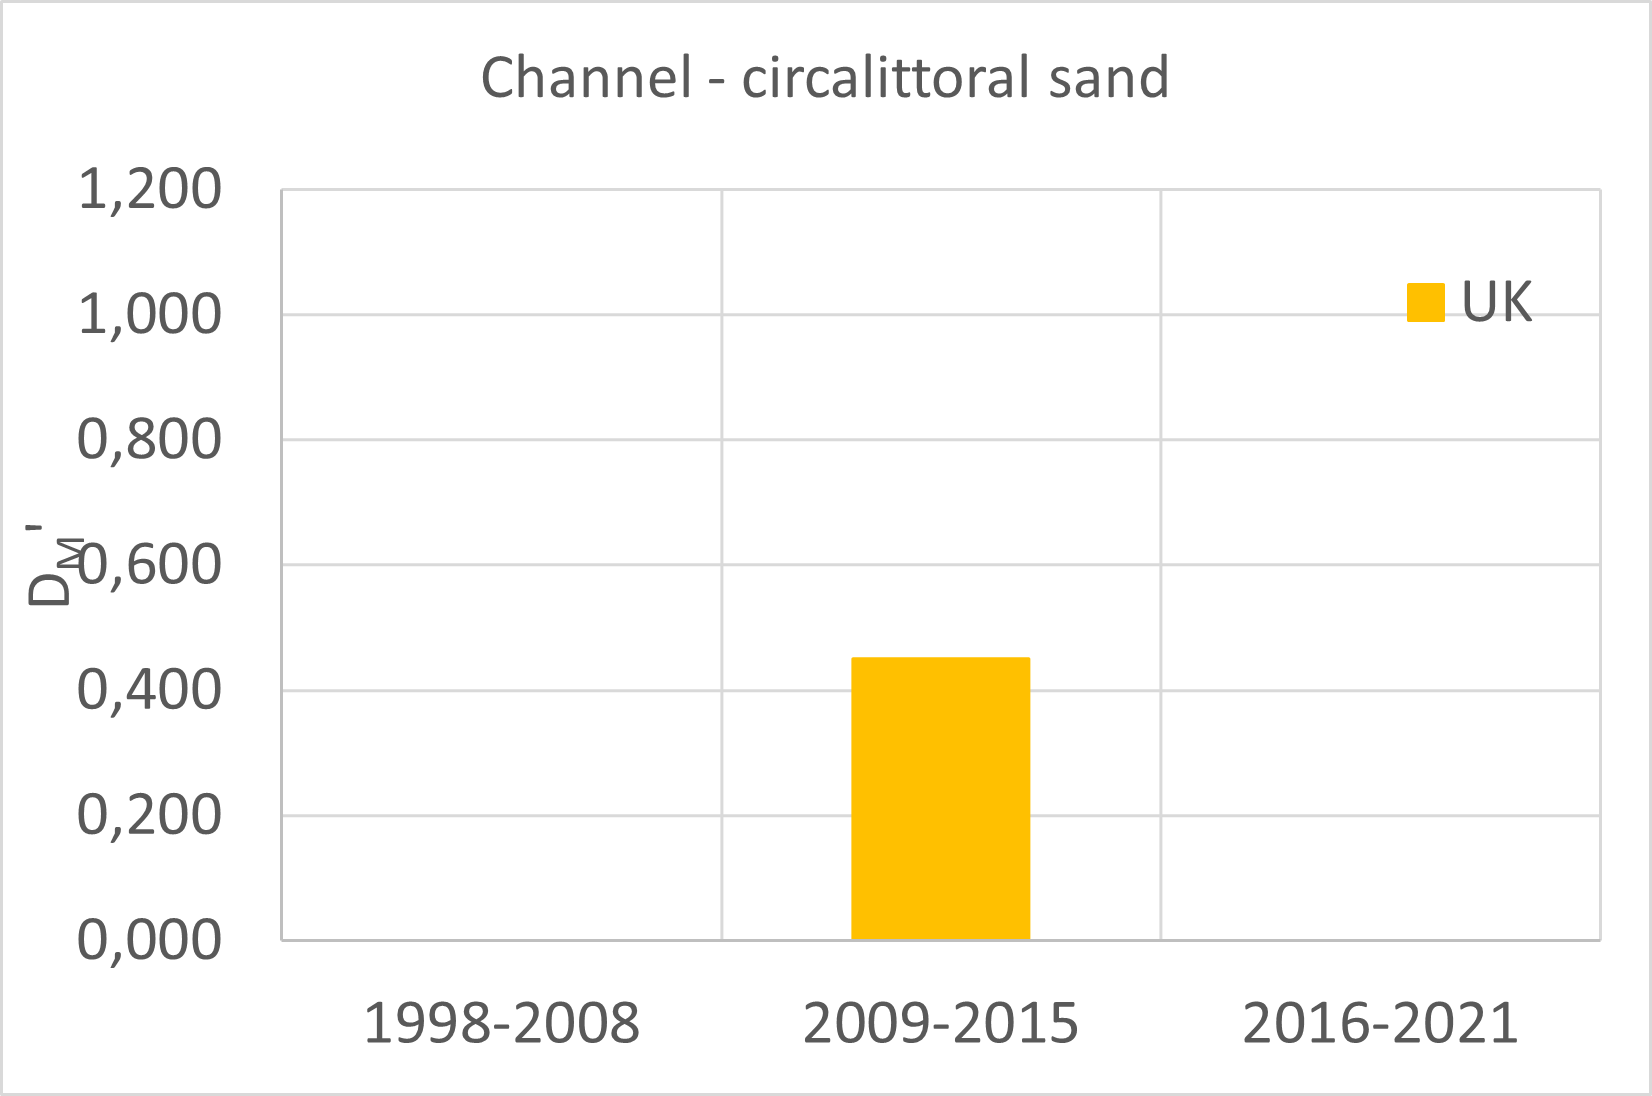
| circalittoral sand | 8,3 | ||||||
| infralittoral coarse sediment | 8,4 | ||||||
| infralittoral mixed sediment | 7,7 | ||||||
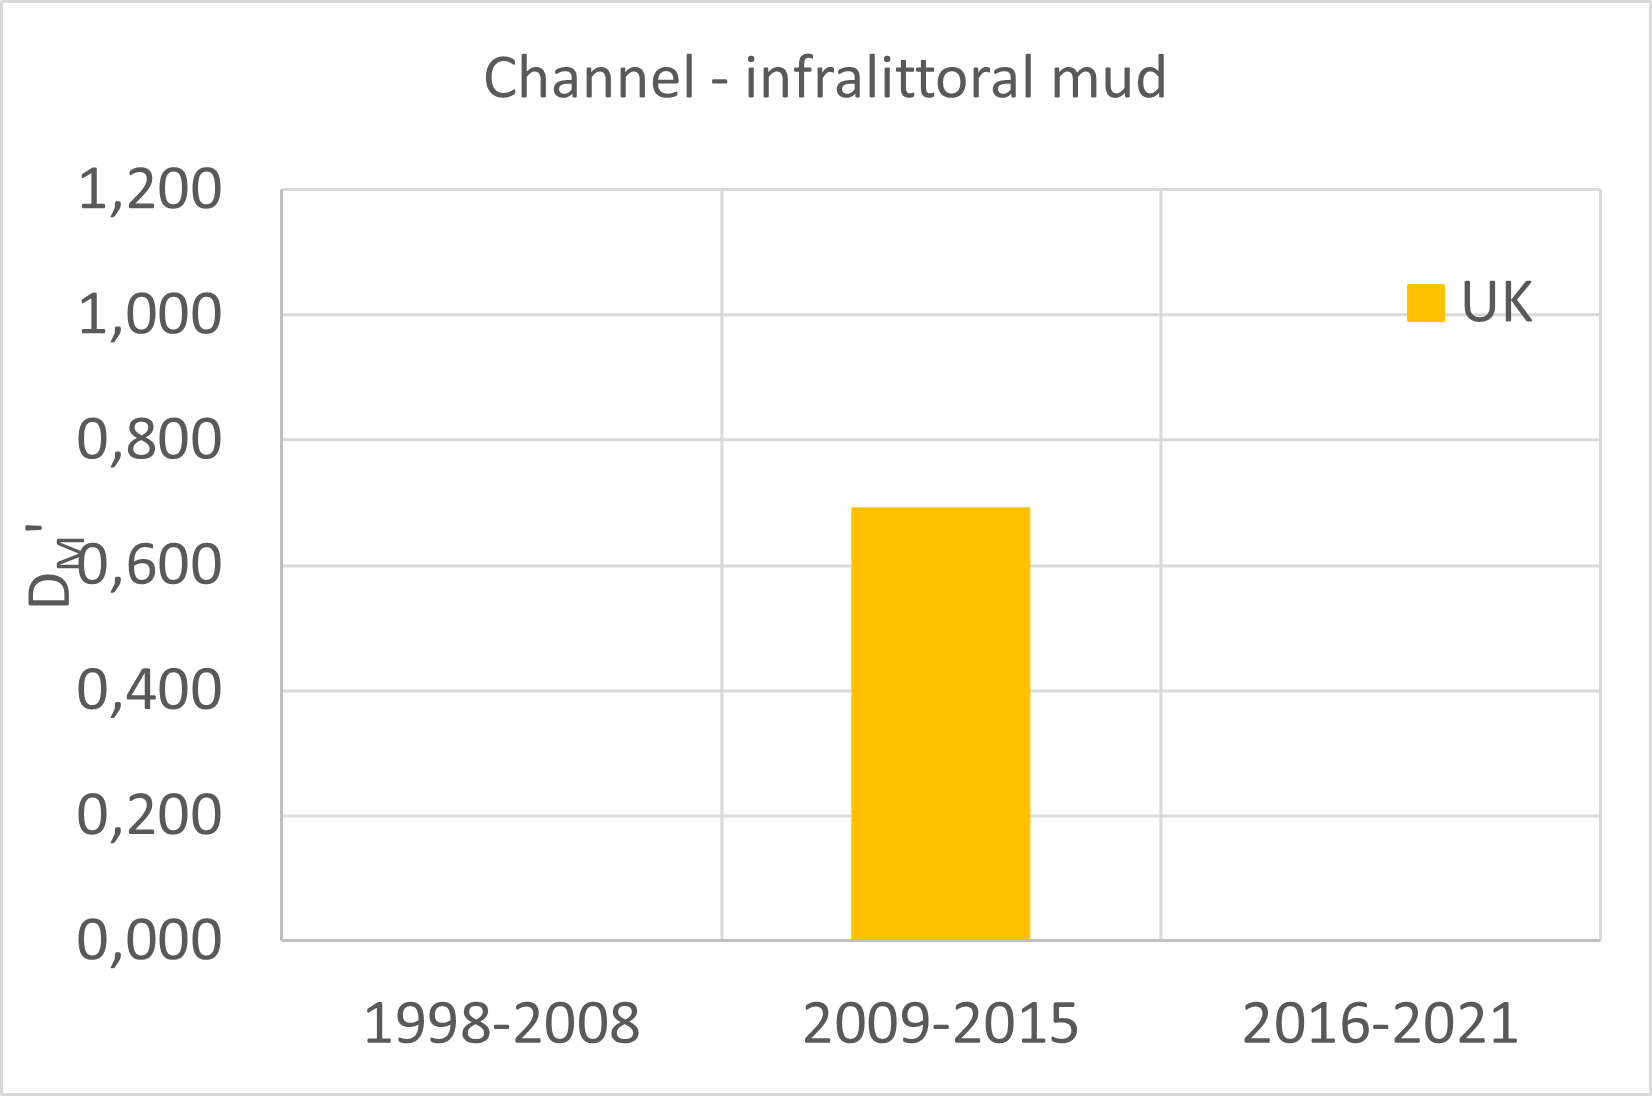
| infralittoral mud | 10,7 | ||||||
| infralittoral sand | 7,9 | ||||||
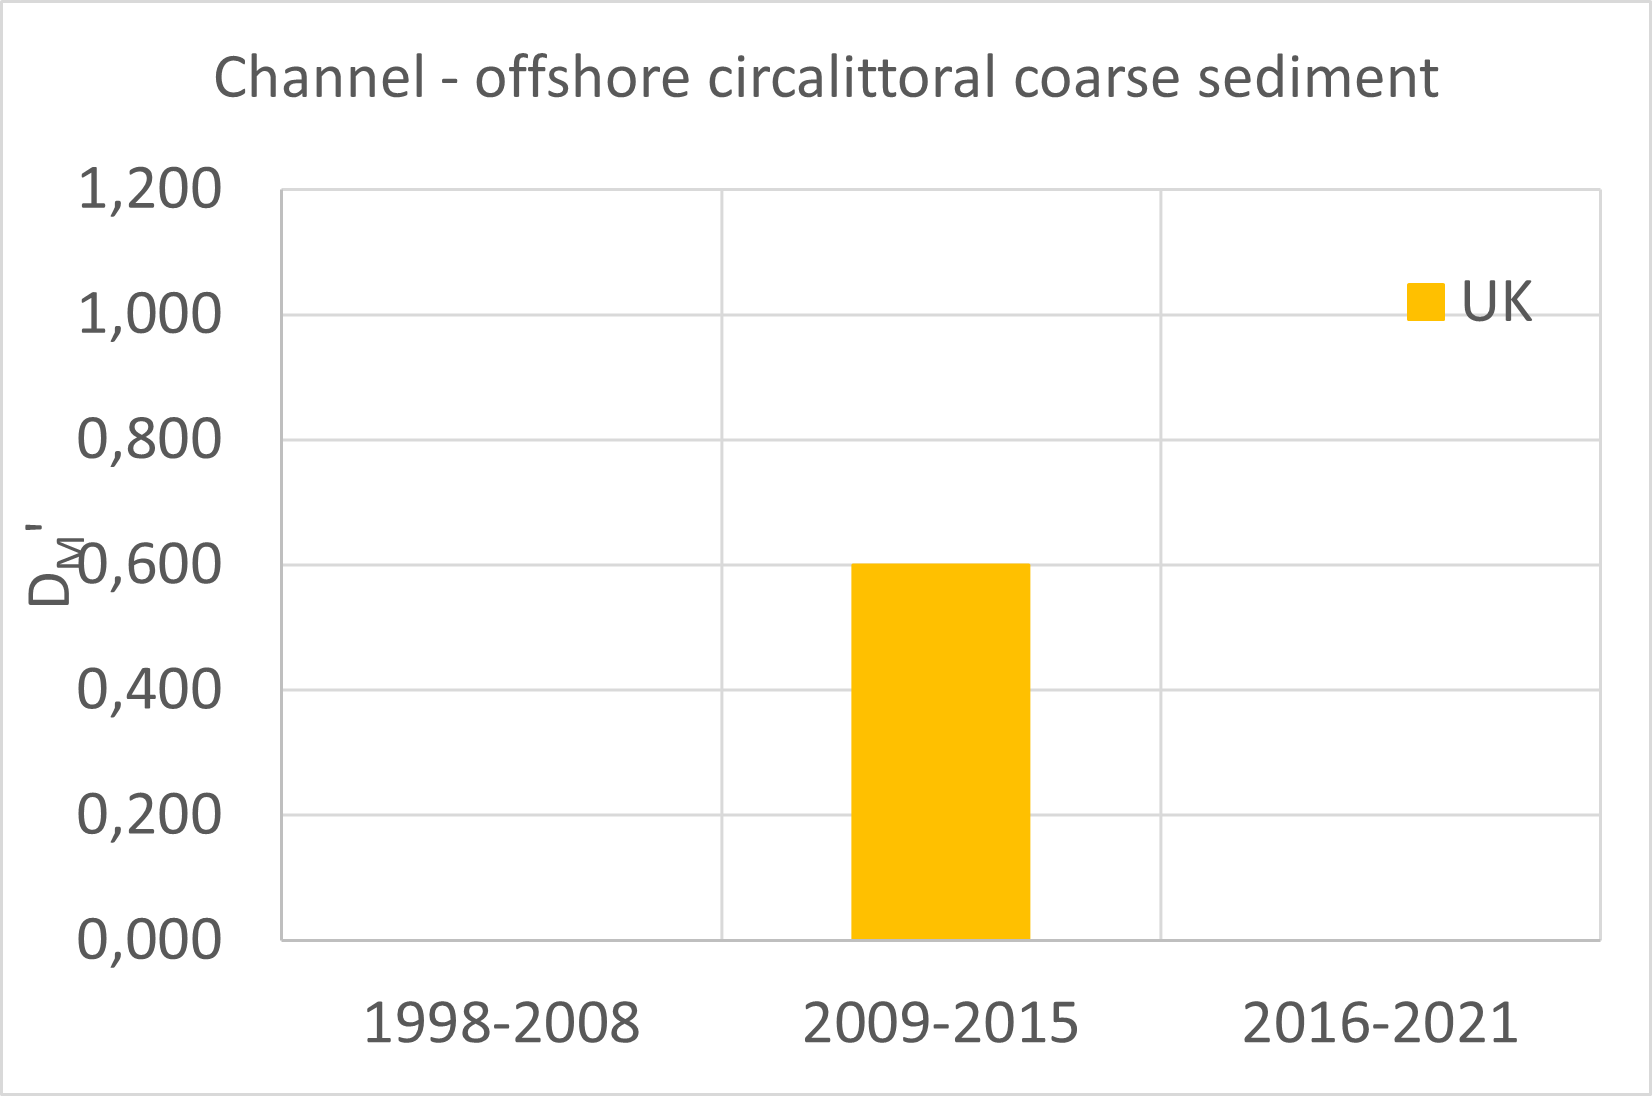
| offshore circalittoral coarse sediment | 9,2 | ||||||
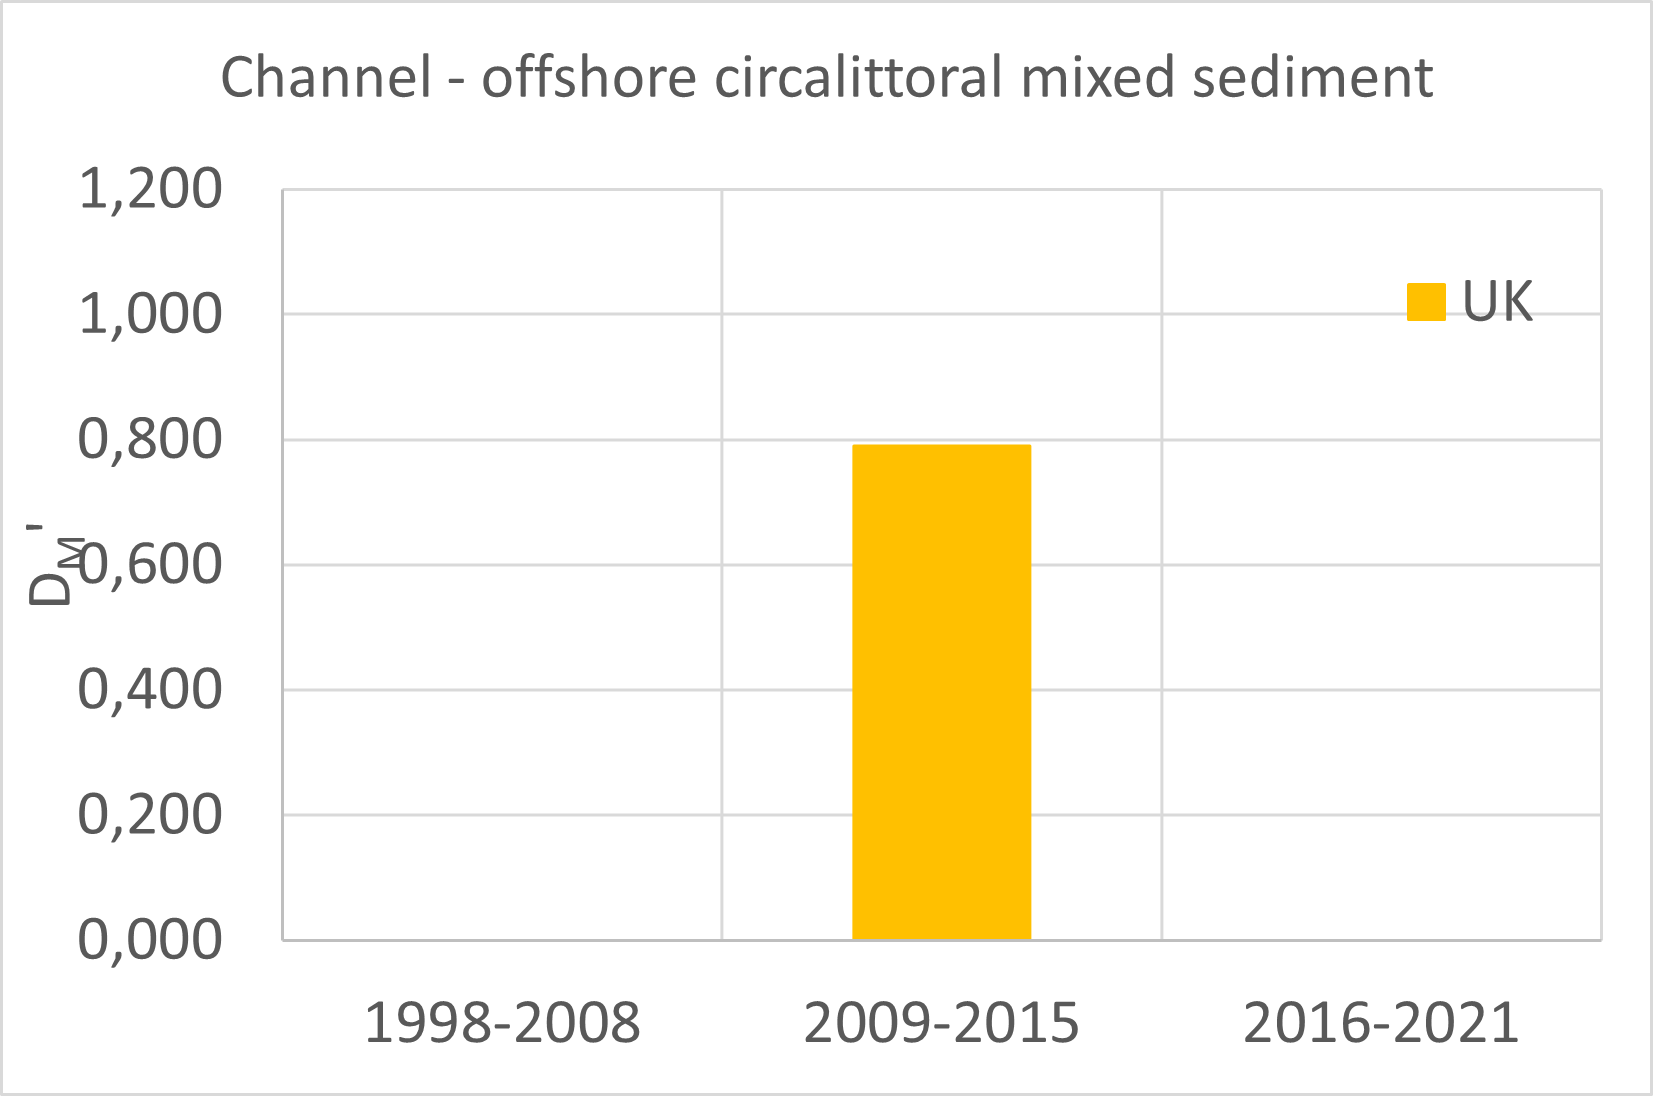
| offshore circalittoral mixed sediment | 8,4 | ||||||
| offshore circalittoral sand | 8,6 | ||||||
| Kattegat | BE | DE | DK* | NL | SE | UK | DK |
| circalittoral coarse sediment | 4,7 | 7,7 | 7,2 | ||||
| circalittoral mixed sediment | 6,1 | 7,1 | 6,4 | ||||
| circalittoral mud | 4,8 | 8,6 | 6,7 | ||||
| circalittoral sand | 6,9 | 7,2 | 7,4 | ||||
| infralittoral coarse sediment | 4,5 | 6,8 | |||||
| infralittoral mixed sediment | 5,4 | 6,5 | 6 | ||||
| infralittoral mud | 6,3 | 6,8 | 6,3 | ||||
| infralittoral sand | 4,2 | 6,8 | 6,7 | ||||
| offshore circalittoral coarse sediment | 4,7 | ||||||
| offshore circalittoral mixed sediment | 5,6 | 5,5 | |||||
| offshore circalittoral mud | 8,4 | 7,3 | 7 | ||||
| offshore circalittoral sand | 5,3 | 7 | |||||
| Norwegian Trench | BE | DE | DK* | NL | SE | UK | DK |
| circalittoral mixed sediment | 6,9 | ||||||
| circalittoral mud | 7,2 | ||||||
| circalittoral sand | 7,2 | ||||||
| infralittoral mixed sediment | 6,5 | ||||||
| infralittoral mud | 6,7 | ||||||
| offshore circalittoral coarse sediment | 8 | ||||||
| offshore circalittoral mixed sediment | 6,2 | ||||||
| offshore circalittoral mud | 5 | 8 | |||||
| offshore circalittoral sand | 7,5 | ||||||
| upper bathyal sediment | 7,3 |
aIt has been indicated by Germany that the monitoring and therefore the reference for circalittoral mud in the Southern North Sea is not considered representative for the entire German part. The result should be handled with care and it is recommended to recalculate the reference value at least for this BHT in case additional data become available in the future.
Table c provides an overview of the obtained (and used) reference values for Margalef diversity. Values estimated based on sufficient low-pressure data are indicated in black. Values derived from those estimated references by calculating arithmetic averages are indicated in red. Differences in reference values between cases (combinations of sampling category x BHT x country x AU) can be the result of patterns in natural diversity as a result of differences in species distributions and can have methodological reasons (sampling characteristics and slight differences in identification and recording not covered by standardisation) typically with regards to differences between countries. As methodology (especially sampled surface and therefore chance of observing species in samples is different for the two Danish categories (grab-core compared to small core samples), the reference values are also very different. This indicates that one has to be careful with combining data from different techniques and different sampled surfaces in particular in the same index. Therefore, sampling method category specific reference values for Margalef diversity are estimated. However, resulting DM’ values and/or patterns with regards to BHTs are expected to be more in line, although it has to be noticed that with different techniques the focus of monitoring is also on different types of benthos (e.g., larger or smaller or mobile or sessile specimens), for which diversity patterns can deviate (even in case of sampling at the same sites).
Index Calculation:
Where Margalef diversity used to be calculated (for the IA2017) using the BENMMI tool (benthos multi-metric data analysis software; Walvoort & Van Loon, 2016), the Relative Margalef diversity is an update of this methodology for which a specific script has been developed. The new script, presented in three parts (‘step-1-data-prep.html’, ‘step-2-eda.html’ and ‘step-3-assessment-nosar.html’, available at: ODIMS) includes data selection and standardisation procedures, exploratory data analyses to identify (and visualise) potential sources of variability (and therefore options for selections of subsets of data and/or additional testing opportunities) and presenting assessment and testing results including estimation of case-specific reference values used to calculate relative values of Margalef diversity for comparability among cases (AUs, BHTs , countries and sampling methodologies) and potentially comparison with threshold values for good benthic habitat quality (once defined). At the moment results are presented as Relative Margalef values on a scale from 0-1 with indicative indication in colour (red, orange, green) of what might be respectively a relatively low, moderate and high diversity with transitions between classes at DM’ equalling 0,6 and 0,8. What the threshold value for good quality condition could look like is part of a broader process within OSPAR and, amongst others, the EU (MSFD CIS TG-Seabed) and ICES (WKBENTH2 & 3) where multi-indicator comparison (including Relative Margalef diversity) and adjustment to a common quality scale is part of the process (SEABED_9-2022-03). Values for DM’ can in practice transgress a value of 1 at the level of individual samples or in case of low data availability as even under reference conditions there is a certain variability in diversity. The reference diversity does not reflect the maximum value once observed on the scale of an individual sample, but a median value under reference conditions. In case DM’ transgresses a value of 1, this is considered to be equal to DM’=1.
Assessment of the Greater North Sea (Region II)
Benthic habitat quality status assessments are calculated as median Relative Margalef diversity values per BHT x AU x country per assessment period. At this level, testing was also undertaken for possible significant differences in time (quality developments as identified by comparing assessment results of the indicated period using 2-sided independent t-tests (p<0,05) using average ± standard deviation (and sample size) results, where possible. Results at the level of countries (however distinguishing AUs and BHTs) might also be the preferred level for national EU MSFD reporting, although in the end (as is the case for OSPAR), ecologically relevant units should be the level of reporting for which the AUs have been defined. Therefore, median values at the level of BHTs within AUs of the median assessment results at the level of countries are presented as well to abstract the results and indicate quality status and developments at the ecologically relevant level (AUs regardless of country boundaries). Results for two sampling technique categories are presented as the combination provides a more complete overview of the status and developments therein for the Greater North Sea Region. Additionally, it shows that with the current indicator, in principle data from various techniques can be used for quality assessments although the focus of the assessments might be on specific aspects of the total benthic community diversity. In principle the median DM’ values based on grab-core samples are presented as the results for the current quality status. In case of a lack of data for the most recent years the results of former periods are taken into consideration, however with indication of lower confidence. In a few cases (because of a lack of grab-core data) the results on the basis of small cores are presented as the current quality status. In case a large part of a certain AU x BHT combination was situated in Danish waters, also significant differences on the basis of ‘small core’ data were accepted as being indicative for quality developments at AU level. Results are only presented at the level of countries (BHT x AU x Country) in case quality code of the representative data set for the specific period is indicated as ‘Sufficient’ (according to Table b).
Although the abstracted results at the level of AUs are presented as the main findings, these should always be interpreted taking into account confidence levels as indicated (reflecting data density, number of years and spatial representativity of the data). Spatial representativity of the data is considered by estimating the percentage of area covered by the benthic monitoring programme (a sample considered representative for approximately an area of the size of one c-square) compared to the total surface of a certain BHT x AU to be assessed. Findings with regard to Relative Margalef diversity and implications with regard to the benthic habitat quality status are discussed taking other benthic habitat indicator assessment results (mainly BH3, BH2a and BH4) for Region II into account.
Temporal trends:
Results for DM’ are compared in time (test for possible differences between periods) using t-testing (2-sided independent t-testing at p<0,05). The essential number of (representative) samples to allow detection of possible significant differences depends on the (natural) variability within cases/selections. Significant differences in DM’ between the 2009-2015 and 2016-2021 period are interpreted and indicated as either a significant increase or decrease in the quality status of the benthic habitats. The number of data available is (automatically) taken into account in testing (as in all statistical testing). For reliability of current status quality assessments based on DM’ the quality coding as presented in Table b is used, where confidence of results depends on the number of samples and number of years included (in this case for the specific period). Confidence of assessment results for former periods follow the same guidance; when based on data sets with respectively quality codes 1, 2, 3, 4 and 5, the confidence level is expected to be high, good, sufficient, low and poor. Assessment results at the level of countries (BHTs x AUs x Countries) will only be presented if quality of data according to coding is at least ‘sufficient’. When former period results are used to assess current quality status the confidence decreases one level in case of 2009-2015 data (i.e., respectively: good, sufficient, low, poor and poor related to the same quality codes) or two levels older data where older data are used. Similarly, the spatial representativity of the data is considered to lower the confidence by one level in cases where less than 75% of the specific BHT x AU to be assessed is covered by monitoring, or by two levels in cases where less than 25% is covered by monitoring (see Table b).
Results
Benthic community diversity is considered an important aspect of benthic habitat condition. Besides subregional differences, offshore areas appear to maintain higher relative diversity than coastal areas (Table 1). Benthic habitat quality based on Relative Margalef diversity (DM’) in Region II is especially low in infralittoral and circalittoral sandy and muddy habitats. In general, especially infralittoral habitats and several of the circalittoral habitats are in poorer state in the Kattegat than in the Central – and Southern North Sea, but quality status of those habitats appears to be better in the Norwegian Trench and the Channel. The offshore habitats are generally in a moderate to good quality state with exceptions for offshore circalittoral sand in the Southern North Sea and offshore circalittoral sand in the Channel. Although it was expected to find a clear relation between DM’ and fishing pressure, this is not exactly the case if the results of BH3 (Extent of Physical Disturbance to Benthic Habitats) are considered. It might be that relative diversity is not the most sensitive indicator responding to increased pressure (although a response is definitely expected in the case of lasting physical disturbance) or that small scale variability in pressure level can mask to a certain extent the effect on diversity at larger scale. Underestimation of fishing pressure in coastal areas, by not considering small vessels, could also be the case at least along the coasts of France and the UK. Additionally, the lasting effect of former fisheries activities might be underestimated, as fishery has gradually moved further offshore. Other impacts like eutrophication and diffuse pollution might play a role in determining benthic relative diversity as well. Even if fisheries pressure is decreasing (as has been observed in certain coastal areas), other pressures can still prevent habitats from recovering. It should be noted that in certain parts of Region II (e.g., Central North Sea, Channel) the spatial representativity of the available benthic community samples for large-scale assessments is far from optimal, and might reflect local quality status in specific management areas.
Table 1: Overview BH2b assessment results. Median values of Relative Margalef diversity (DM’) per Broad Habitat Type (BHT) per Assessment unit (AU) (median values of median DM’ per country) reflecting the current quality status. When sufficient data available, assessments are based on 2016-2021 data; otherwise, results reflect the 2009-2015 situation and confidence of assessment (as presented in Table 2) is reduced one level. Colouring indicates relative level of diversity (as indicator of benthic habitat quality status) based on ‘grab-core’ samples (an exception those cases where only recent ‘small core’ sample data were available as indicated in Table a). Recent developments indicated if significant differences (t-testing at p<0,05) between the 2016-2021 and 2009-2015 periods detected in either ‘grab-core’ samples or ‘small core’ samples (testing of average DM’ ± standard deviation combining all -transnational- samples per BHT x AU)
| Broadscale habitat type | Central North Sea | Southern North Sea | Channel | Kattegat | Norwegian Trench |
|---|---|---|---|---|---|
| Infralittoral coarse sediment | NO | 0,62 ? | 0,75 ? | 0,31 ↘ | NO |
| Infralittoral mixed sediment | 0,46 ? | 0,93 ? | 0,67 ? | 0,28 ↔ | 0,70 ? |
| Infralittoral sand | 0,33 ? | 0,45 ↔ | 0,53 ? | 0,48 ↗ | NO |
| Infralittoral mud | NO | 0,24 ↔ | 0,69 ? | 0,18 ↔ | 0,45 ? |
| Circalittoral coarse sediment | 0,71 ? | 0,52 ↔ | 0,63 ? | 0,77 ? | NO |
| Circalittoral mixed sediment | 0,38 ? | 0,84 ↔ | 0,98 ? | 0,55 ↔ | 0,77 ? |
| Circalittoral sand | 0,74 ↔ | 0,47 ↔ | 0,45 ? | 0,30 ↔ | 0,95 ? |
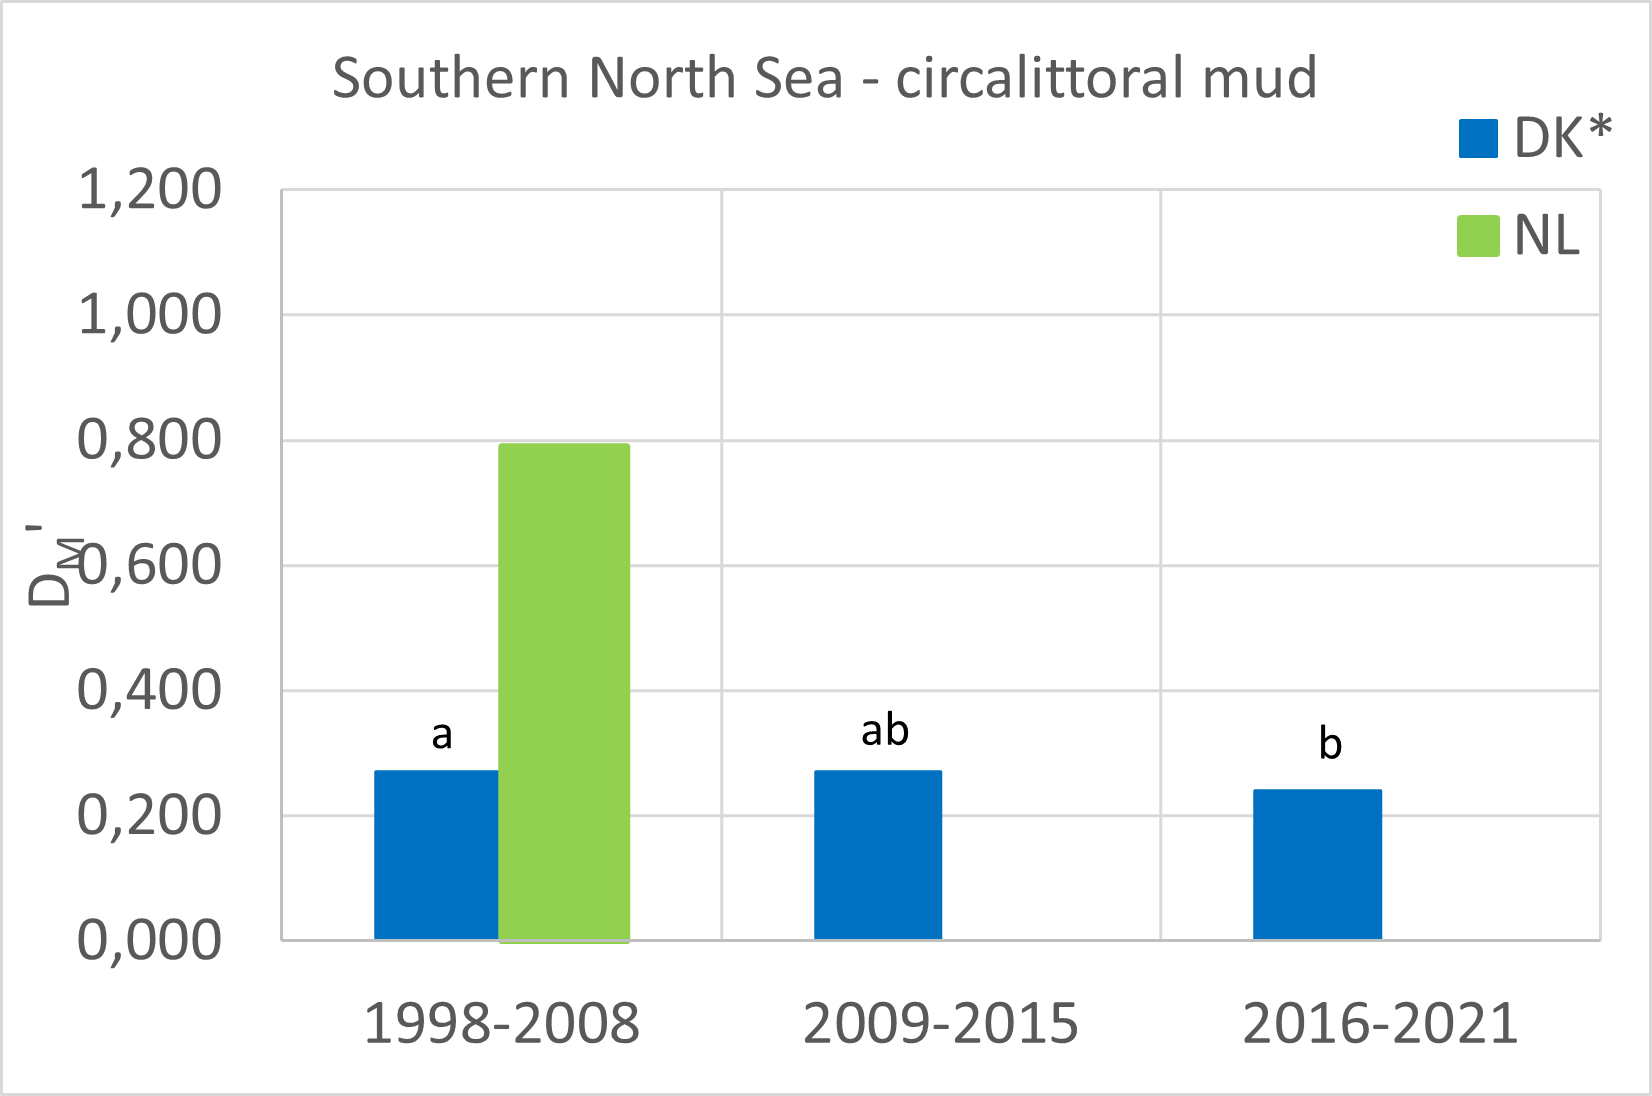
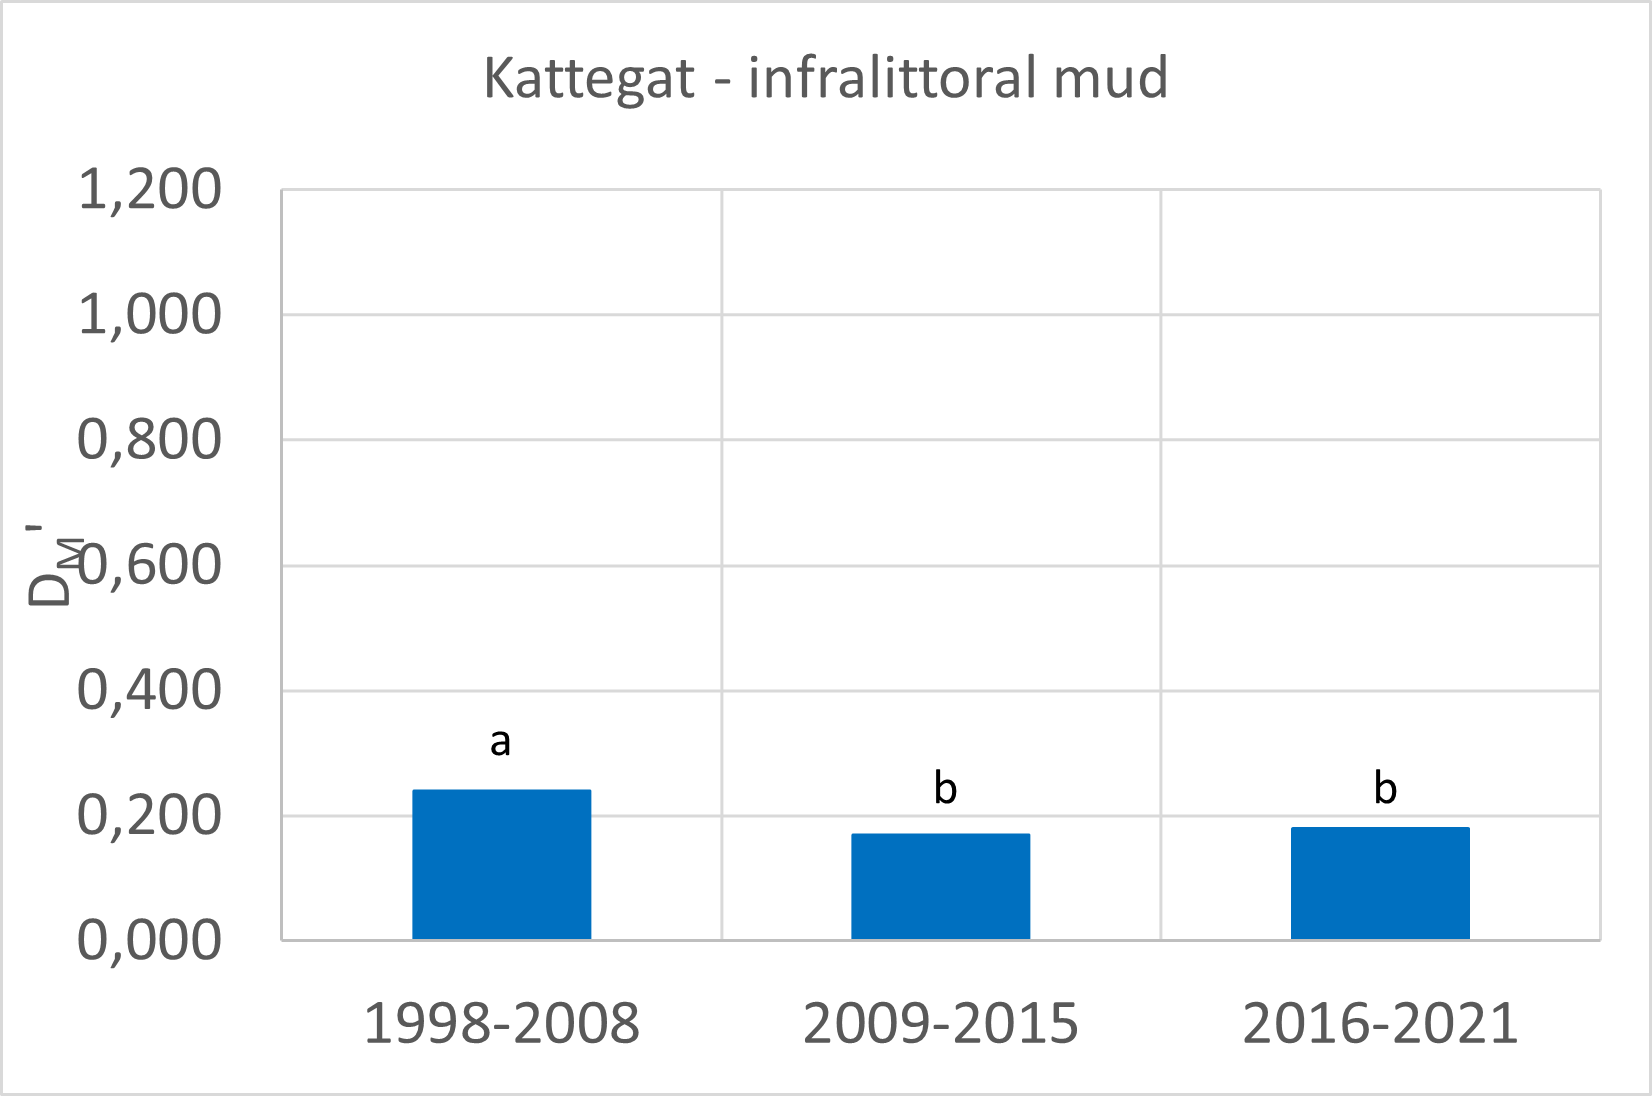
| Circalittoral mud | 0,86 ? | 0,87 ↔ | 0,84 ? | 0,54 ↘ | 0,55 ↘ |
| Offshore circalittoral coarse sediment | 0,64 ↔ | 0,58 ? | 0,60 ? | NO | 0,94 ? |
| Offshore circalittoral mixed sediment | 0,90 ? | 0,91 ? | 0,79 ? | 0,66 ↔ | 0,84 ↔ |
| Offshore circalittoral sand | 0,71 ↔ | 0,61 ↗ | 0,42 ? | 1,41 ? | 1,00 ↔ |
| Offshore circalittoral mud | 0,65 ↔ | 0,85 ↔ | NO | 0,78 ↔ | 0,60 ↔ |
| Upper bathyal sediment | NO | NO | NO | NO | 0,70 ↔ |
*Median Relative Margalef diversity on a scale from 0 to 1 (from no diversity to realistic reference diversity). Values can in practice transgress a value of 1 at the level of individual samples or in case of low data availability (which is than equal to DM’=1).
Relatively high benthic diversity (DM’ from 0,8 to 1) indicated in green, moderate diversity (DM’ from 0,6 to 0,8) indicated in orange, relative low diversity (DM’ from 0 to 0,6) indicated in red. Values in grey are highly uncertain (based on less than 4 samples). ‘NO’ indicates that no data are available. Significant differences (developments) indicated with ↗ (increasing diversity), ↘ (decreasing diversity); ↔ no significant difference; ? diversity status based on data from (former) 2009-2015 period or no data of before 2016 available so that statistical testing of recent developments is not possible.
Table 2: Overview of estimated confidence of assessment of current status at the level of Broad Habitat Types (BHTs) within Assessment units (AUs). Confidence based on data density (number of available samples), temporal coverage (number of years included) and spatial representativity (percentage of area covered by monitoring) resulting in a quality code for the recent data set (period 2016-2021) and reflected in a relative confidence level distinguishing 5 classes (high, good, sufficient, low, poor). In case the current quality status is assessed based on older data (only results 2009-2015 period considered) the observed quality code results in a confidence level that is lowered one level (i.e., respectively good, sufficient, low, poor, poor for the original classes as indicated above). Spatial representativity is considered as such that the confidence is reduced one level in case less than 75% of the BHT x AU to be assessed is covered by the monitoring, and two levels in case less than 35% is covered by the monitoring
| Broadscale habitat type | Central North Sea | Southern North Sea | Channel | Kattegat | Norwegian Trench |
|---|---|---|---|---|---|
| Infralittoral coarse sediment | NO | Good | Poor | High | NO |
| Infralittoral mixed sediment | Poor | Poor | Poor | Good | Poor |
| Infralittoral sand | Poor | High | Poor | High | NO |
| Infralittoral mud | NO | Good | Poor | High | Poor |
| Circalittoral coarse sediment | Poor | Good | Poor | Poor | NO |
| Circalittoral mixed sediment | Poor | Low | Poor | High | Poor |
| Circalittoral sand | Sufficient | Sufficient | Poor | High | Poor |
| Circalittoral mud | Poor | Good | Poor | High | Good |
| Offshore circalittoral coarse sediment | Low | Low | Low | NO | Poor |
| Offshore circalittoral mixed sediment | Low | Low | Poor | Sufficient | Poor |
| Offshore circalittoral sand | Low | Good | Poor | Poor | Poor |
| Offshore circalittoral mud | Low | Good | NO | High | Sufficient |
| Upper bathyal sediment | NO | NO | NO | NO | Poor |
*Colours reflect relative levels of Relative Margalef diversity (i.e., the assessment results, where it is indicated with 5 classes how reliable these results are as presented in Table 1).
Region II in general
Table 1 provides an overview of the abstracted quality status assessment results based on Relative Margalef diversity, providing the current diversity as a value between 0-1 (occasional transgression should be considered equal to 1). Although there is no threshold value for good quality status of benthic habitats yet (and therefore also no specific threshold value for Relative Margalef diversity; DM’) it can be stated that a value of below 0,6 means rather low diversity, whereas a value above 0,8 means relatively high diversity and values in between could be indicated as moderate diversity.
It can be concluded that in general there is room for improvement with regard to benthic diversity, as for most Broad Habitat Types (BHTs) current benthic diversity is not found to be relatively high, although there are subregional differences and some BHTs in general seem to be in a better quality state (Table 1).
Offshore circalittoral habitats:
An important observation is that, in general, offshore circalittoral habitat types seem to harbour higher levels of relative diversity suggesting that the current quality status might be better than for infralittoral and circalittoral habitat types. This does not mean that also the risk of arriving at poorer quality status in the near future is lower in the offshore areas. Moreover, as trends of increasing relative diversity are lacking and for large surface areas there are no data available for 2016-2021 (instead results based on 2009-2015 data are presented or specific territorial waters are not included in the most recent results), it is highly possible that the higher risks of benthic habitat quality reduction suggested by BH3 results can be reflected in future quality status assessments. Independent of the subregion, all offshore circalittoral habitat types for which data are available seem to harbour moderate to relatively high benthic diversity, with the exception of offshore circalittoral coarse sediment habitat of the Southern North Sea and offshore circalittoral sand in the Channel. At least where there are sufficient data for both periods 2016-2021 and 2009-2015 there is generally no evidence for large changes in Relative Margalef diversity, except for a significant increase in diversity for offshore circalittoral sand in the Southern North Sea. It should be noted that all Channel assessments are based on data from 2009-2015, so that if recent changes have occurred, these could not be detected.
Table 2 shows that with regard to data availability including information from several years, there is only sufficient to high confidence for the patterns with regard to the offshore circalittoral sandy habitat in the Southern North Sea, the muddy variant in the Southern North Sea, Kattegat and Norwegian Trench and the mixed sediment habitat of the Kattegat. As shown, benthic monitoring in many cases is not exactly representative for (BHTs within) entire Assessment Units (AU), as at least in certain cases spatial distribution of sample sites is aggregated in certain areas (e.g., Figure a), typically MPAs and (planned) wind parks. This uncertainty, which is due to spatial distribution, is especially notable in the assessments done in the Channel, Norwegian Trench and the Central North Sea subregions. Additionally, no (comparable) monitoring data were available for the respectively large French and Norwegian parts of these subregions. With regards to the Norwegian Trench only Relative Margalef diversity of the Swedish part (which is a relatively small part of the entire subregion) could be assessed, where spatial coverage for at least the common BHTs seemed to be sufficient to high.
The fact that offshore circalittoral habitats generally seem to harbour higher relative diversity communities suggesting that they might be in a better quality status than circalittoral and infralittoral habitats cannot directly be explained by patterns in physical disturbance due to fisheries as indicated by the results for BH3. The results of BH3 indicate that several of the offshore circalittoral habitats are among the habitats with highest physical disturbance pressure and have the highest risk to arrive at decreased benthic habitat quality status. Partly an underestimation of fishing pressure in coastal areas might play a role (as small vessel impacts are not considered). Except for the Swedish waters, offshore circalittoral habitats are generally situated at a reasonable distance from the coast. By distinguishing offshore circalittoral habitats from circalittoral and infralittoral habitats, basically offshore areas are compared with coastal areas. The only real difference in pressure level between offshore and coastal areas might be the level of eutrophication and the role of diffuse pollutants. The relatively poor quality observed for benthic communities in coastal areas might be the result of impact from increased nutrient and diffuse pollution level, preventing benthic habitats from recovering, now that physical pressure levels in coastal areas are lower than offshore. It is however not the case that physical disturbance levels in coastal areas are particularly low at the moment. It might be that a further decrease in pressure is necessary for communities to recover (it might be more difficult for deteriorated communities to recover than for relatively highly diverse communities to withstand a certain level of pressure). Additionally, it should be noted that a large share of the areas assessed lack benthic community monitoring data from the most recent years. Based on the high risk of impact resulting from physical disturbance from fishing activities, it is very possible that a reduction in the quality of offshore circalittoral habitats (and muddy and sandy habitats in particular) can be expected in the near future, despite the relatively high diversity found from recent observations (from either 2016-2021 or 2009-2015).
Infralittoral habitats:
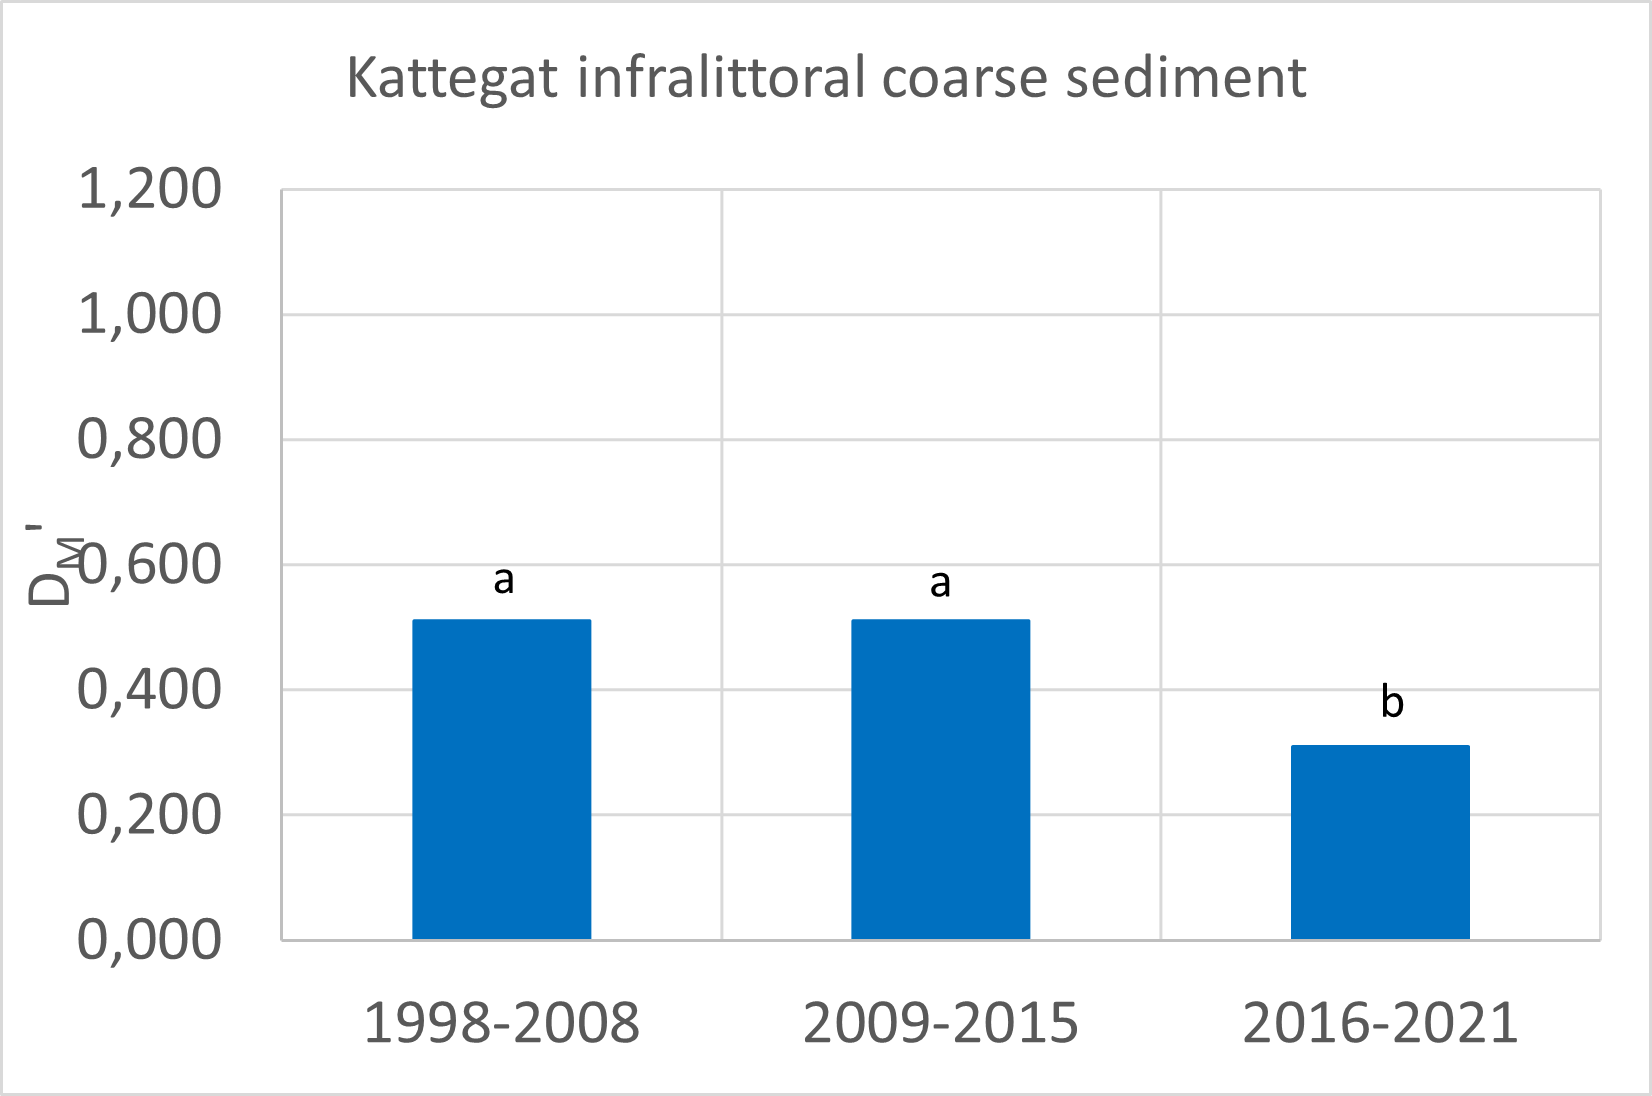
Indications for BHTs with benthic diversity levels that can be considered relatively high or even moderate are scarce for the infralittoral zone (Table 1). Those cases that might indicate moderate to high median DM’ values generally have poor data availability and therefore quality estimations come with poor confidence level. Other observations are that where significant trends were detected, these indicated decreasing Relative Margalef diversity as found for infralittoral coarse sediment in the Kattegat and infralittoral mud in the Southern North Sea subregion. In both cases it has been indicated by countries providing data (Sweden with regards to Kattegat and Germany with regards to the Southern North Sea) that monitoring designs are not comparable between the periods 2016-2021 and 2009-2015 especially for those shallow habitats, and in the case of the Kattegat also ‘natural’ disturbance by variation in low salinity water inflow from the Baltic might play a role. In general, infralittoral sand and mud might be in the poorest state. It should be noted that especially in the Southern North Sea and the Kattegat data availability (and therefore the confidence level of the assessments) is generally good or high (Table 2). Although physical disturbance due to fisheries must have played a role at least in the past by determining current relative low diversity in this zone and in these BHTs in particular, nowadays it might be eutrophication effects (increased nutrient levels, increased turbidity) and impacts from diffuse pollution, preventing benthic habitats in this zone from recovering. Additionally, it should be noted that even if physical disturbance pressure is low, recurrent disturbance at a low rate can be enough to prevent recovery. The difference in impact between zero and occasional disturbance is probably larger than the difference in impact between occasional and more frequent disturbance for certain habitat types, as most sensitive species might be lost already at low frequency disturbance.
Circalittoral habitats:
General benthic diversity patterns in the circalittoral zone might indeed be somewhere in between the situation for the infralittoral and the offshore circalittoral zones. Here especially sandy sediment habitats are characterised by decreased (relatively low) diversity (Table 1), whereas for other BHTs (sub)regional differences are large. In general, no recent significant changes were observed, although data availability is considered high in many cases especially in the Southern North Sea and the Kattegat (Table 2). Only decreasing trends in relative diversity for circalittoral muddy habitat are observed in the Kattegat and Norwegian Trench (for which the variability in low salinity water inflow and poor comparability of monitoring designs for recent periods, at least for Swedish waters, might play a role. Figure b indeed shows that the decreasing trend is only observed in Swedish data and not in the Danish (small core) samples. As indicated by Sweden, changes in the monitoring design might have led to observed differences in relative diversity. Particularly in the Kattegat in infralittoral and circalittoral habitats, natural variability in low salinity water outflow from the Baltic Sea might result in natural disturbed communities and larger year-to-year variability also in local benthic diversity. In areas where salinity variability is a common process, communities are likely to be adapted to this phenomenon so that Relative Margalef diversity based on a community specific reference would give reliable results. At present the methodology works with specific references for BHTs at the level of the entire subregion, whereas further subdivision or working with gradients might be preferable. Additionally, naturally occurring anoxic circumstances will result in absence of benthic species and will lower Relative Margalef diversity when impacted samples are included in the analyses. This of course does not account for anoxia as a result of eutrophication. The possible extension of such an anoxic area is also a relevant development that needs to be monitored. In contrast with the observations in Kattegat and Norwegian Trench, the quality status of circalittoral muddy habitat in the Southern North Sea (and probably Central North Sea and Channel as well) is relatively good (as indicated by high Relative Margalef diversity levels). It is expected that this broad habitat type is relatively sensitive towards physical disturbance. The results of BH3 indicate that physical disturbance due to fisheries is not particularly low. However, muddy habitats of particularly the circalittoral zone, might be less susceptible to eutrophication effects and/or increased sedimentation. Again, these results might indicate that in coastal waters at present it is not solely current fishing pressure determining benthic habitat quality status, but that eutrophication and diffuse pollution levels can prevent recovery of formerly disturbed habitats, with differences in sensitivity of BHTs to eutrophication and diffuse pollution as well. However, we should be aware that in this case lower risks of disturbance due to fishing activities might in the long-term lead to recovery of the circalittoral habitats, whereas offshore circalittoral habitats seem to be at risk (according to BH3) of facing quality reduction in the near future. Moreover, as benthic community data for most recent years are lacking for certain (often quite extensive) areas, suggested high risk of impact of physical disturbance in offshore circalittoral muddy and sandy areas might already lead to quality reduction (however not detected yet, but potentially visible when more recent community data from ongoing monitoring become available).
Explaining observations is less complicated in case of a representative monitoring design (e.g., random, random fixed, random stratified or according to a grid). With such design at least the representativity of observed diversity patterns is clear. As shown by this example, we should be aware that relative diversity (like several other indicators) is not solely the result of the dominant pressure of physical disturbance but can be influenced by various other pressures and ‘natural’ changes or variability. Therefore, quality status assessments on the basis, for instance, of Relative Margalef diversity should preferably be combined with pressure mapping for various pressures (e.g., BH3 and indicators related to other themes), quality assessment using alternative indicators (e.g., BH1) and indicators that can identify most probable disturbances at stake (e.g., proposed indicator BH6/BISI).
Interestingly, Relative Margalef diversity seems to be relatively high in circalittoral mixed sediment habitat of at least the Southern North Sea (and possibly in some of the other subregions as well). It might be that circalittoral mixed sediment habitats are less susceptible, but it is more likely that the fishing pressure is lower. This can be partly explained by hard substrate in the vicinity of several sample sites for this BHT with the result that fishery is difficult or even impossible at the sites. When the MSFD Broad Habitat Type map according to EUSeaMap (2021) indicated the presence of hard substrate at a sample site, it was known that in fact that could not be the case at the exact sample site as samples were all taken with grabs or cores. In that case the presence of mixed sediment habitat (but probably in the vicinity of hard substrate) was considered. In this case the results of BH3 confirm that fishing pressure is probably lower on circalittoral mixed sediment (and circalittoral rock and biogenic reef) compared to other circalittoral BHTs.
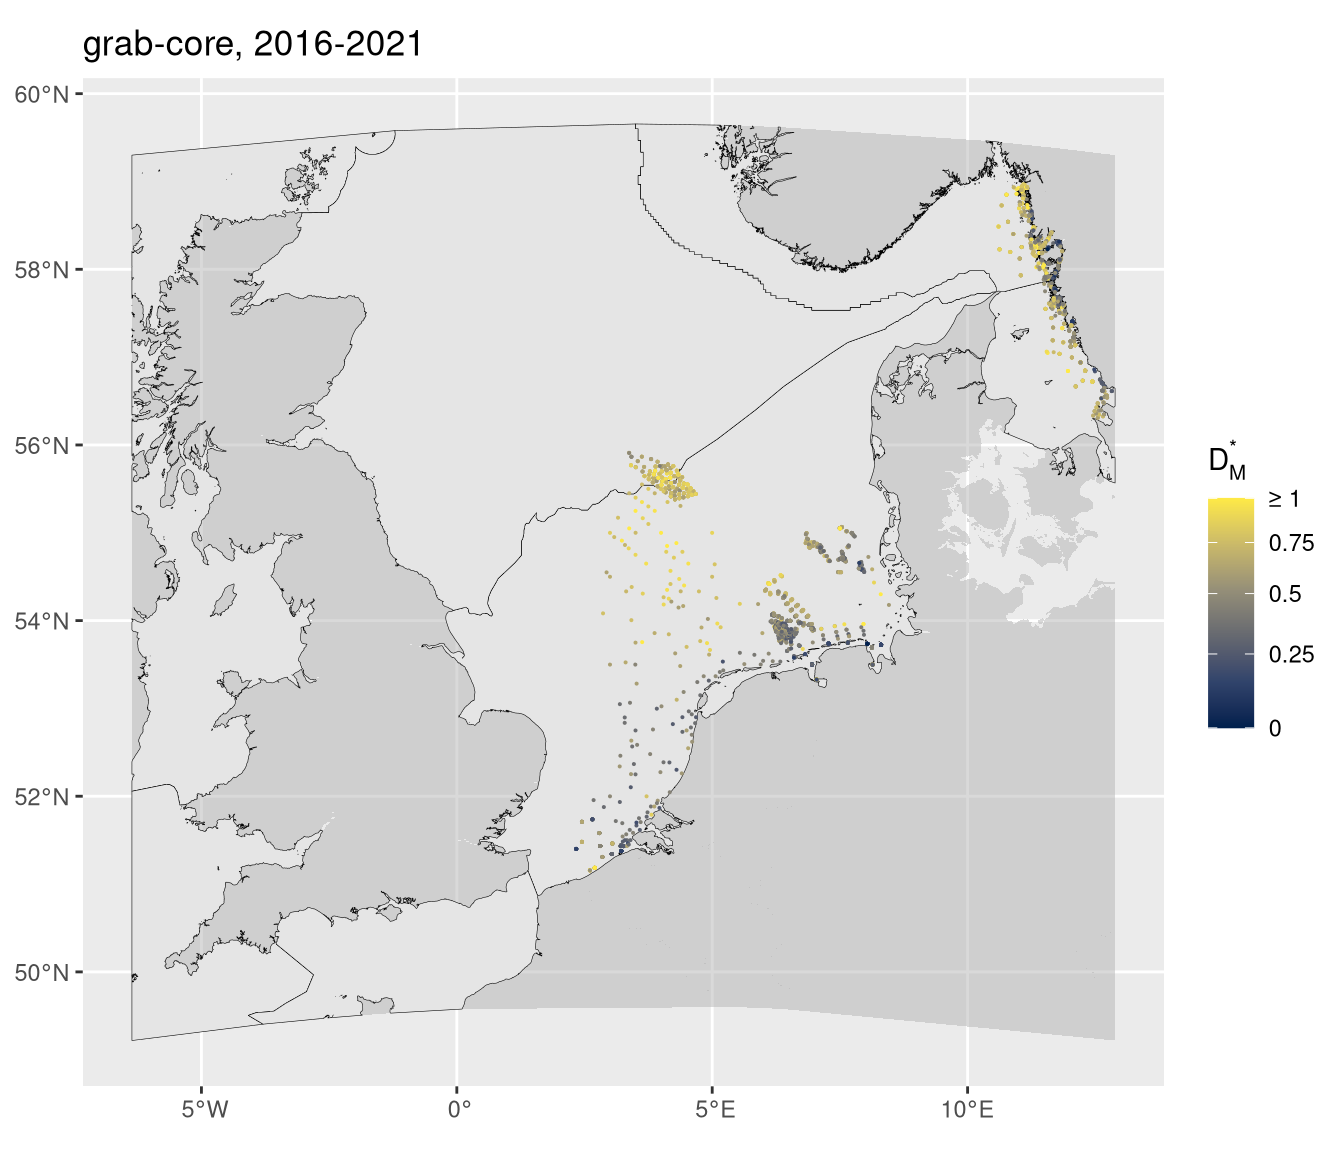
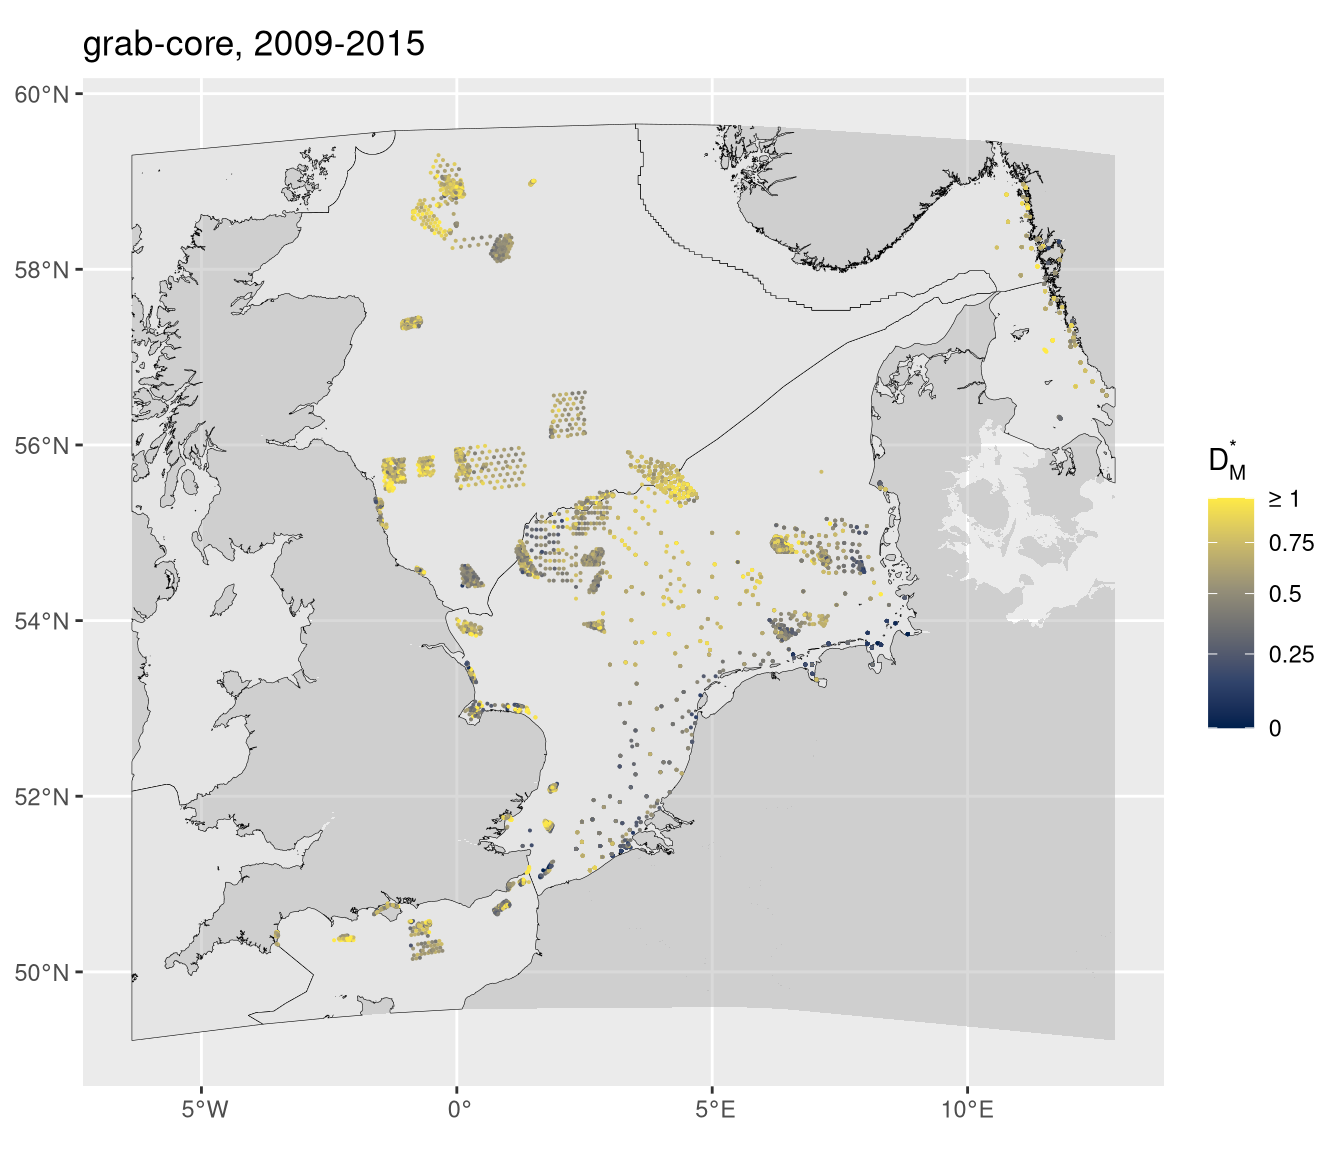
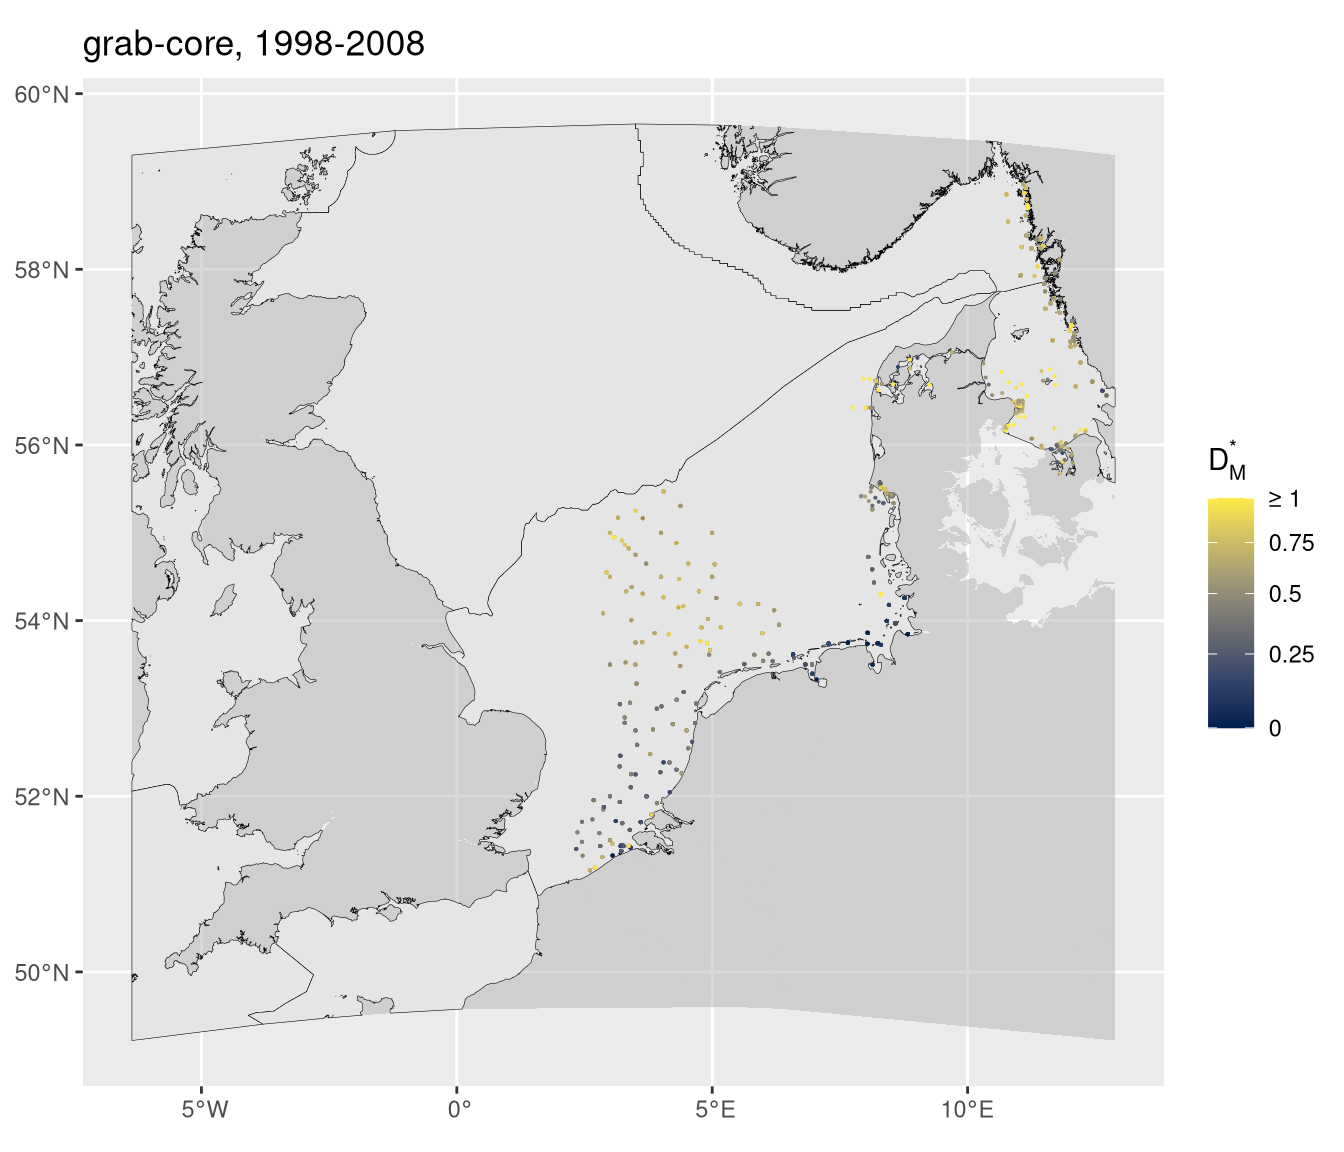

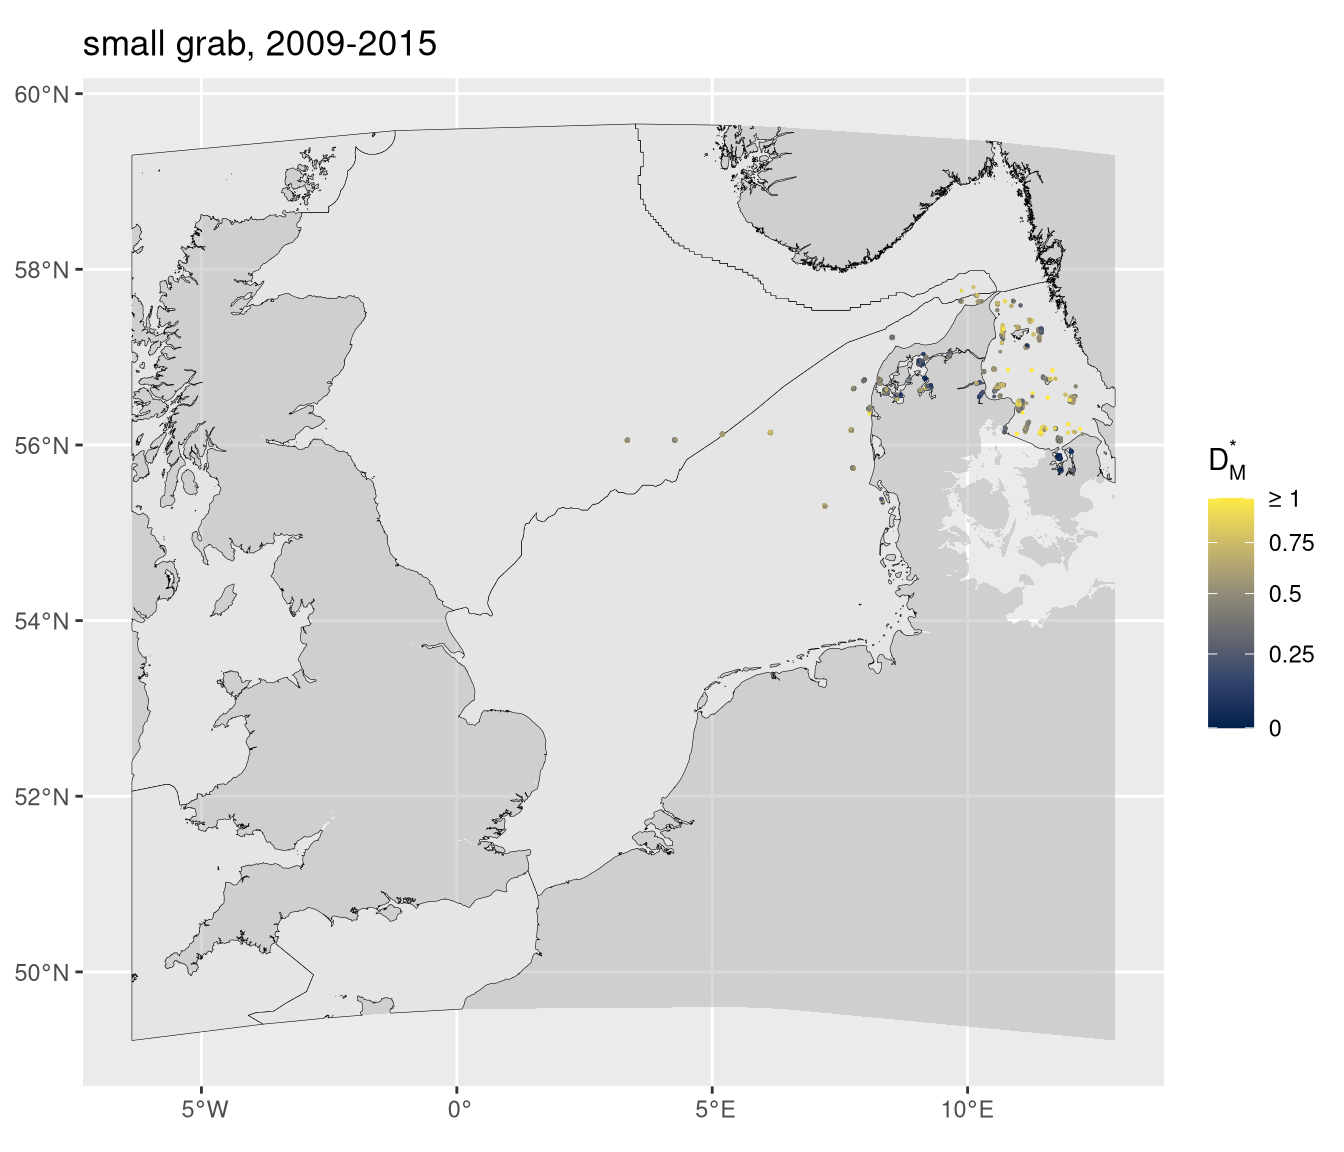

Figure a: Relative Margalef diversity (DM’) at the level of sample sites as indicated for the periods 2016-2021 (upper maps), 2009-2015 (maps in the middle) and 1998-2008 (lower maps) as based on ‘grab-core’ samples (left) and ‘small core’ samples (right)
Results in more detail:
As monitoring efforts and specific designs are not equal between countries, further analysis at the level BHTs x AUs x countries might be valuable to extract specific patterns. Additionally it provides information that can be of interest for national MSFD reporting. Only cases (BHTs x AUs x countries) for which data availability is considered sufficient are taken into account.
Central North Sea
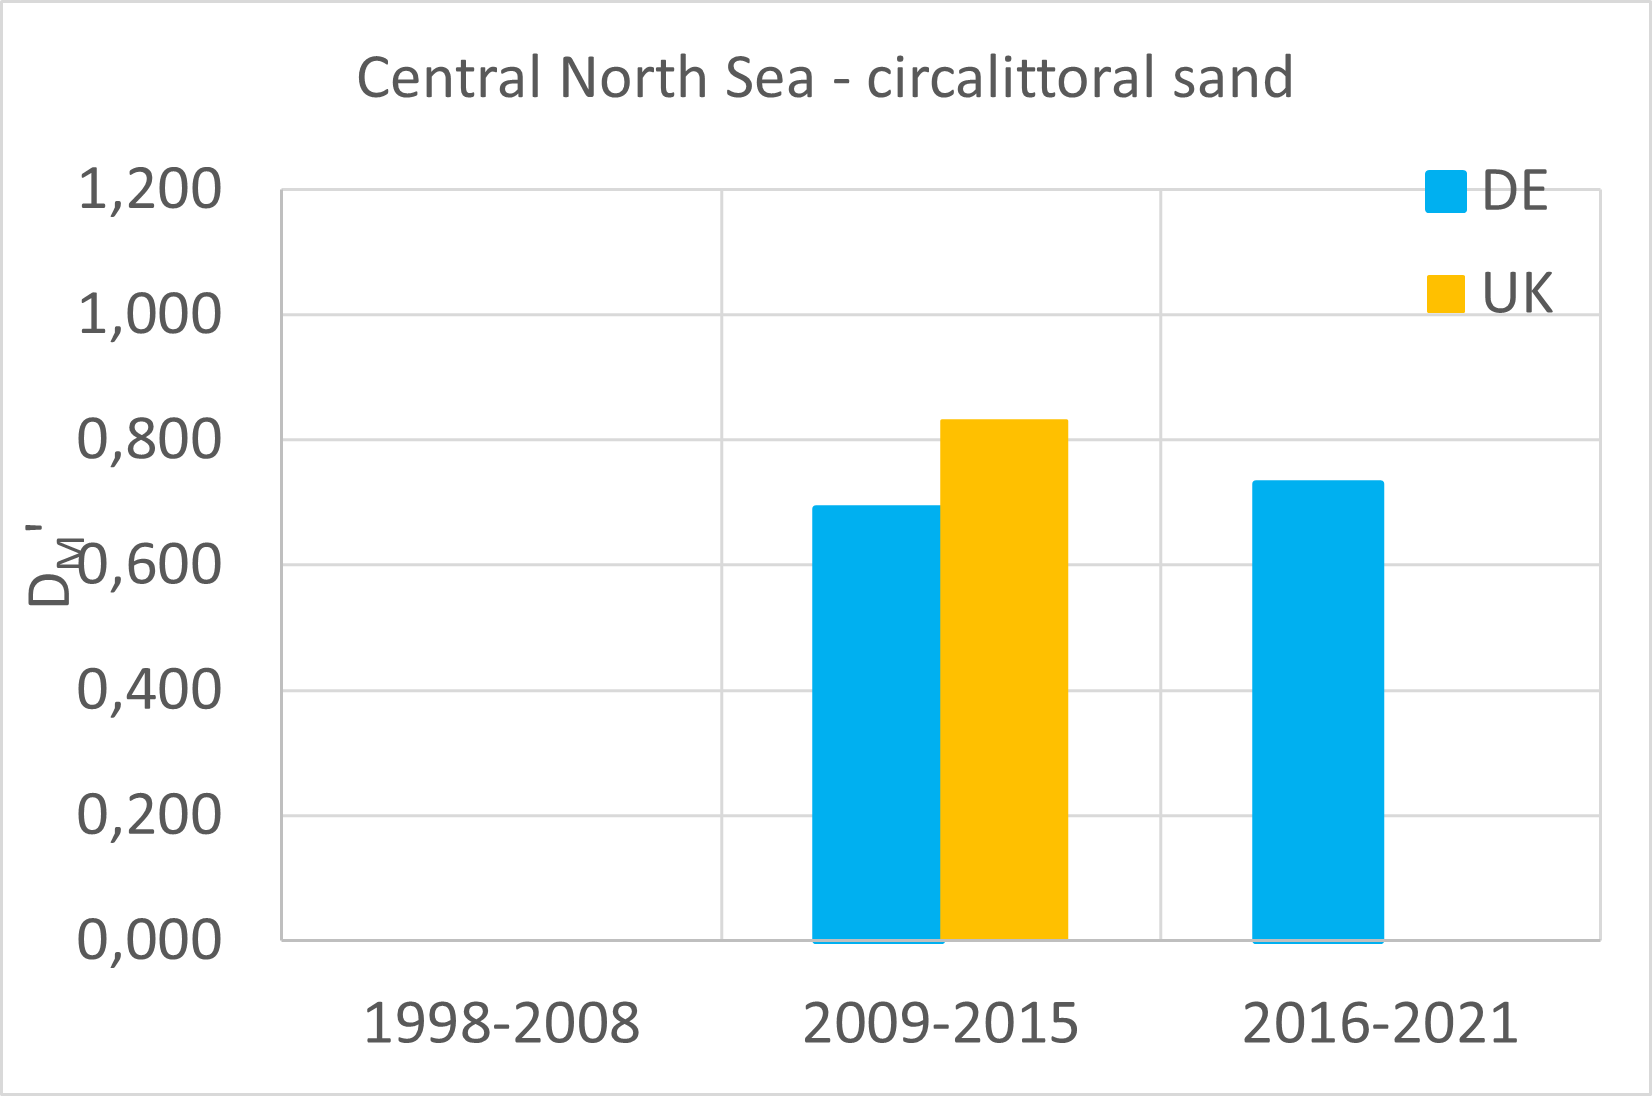
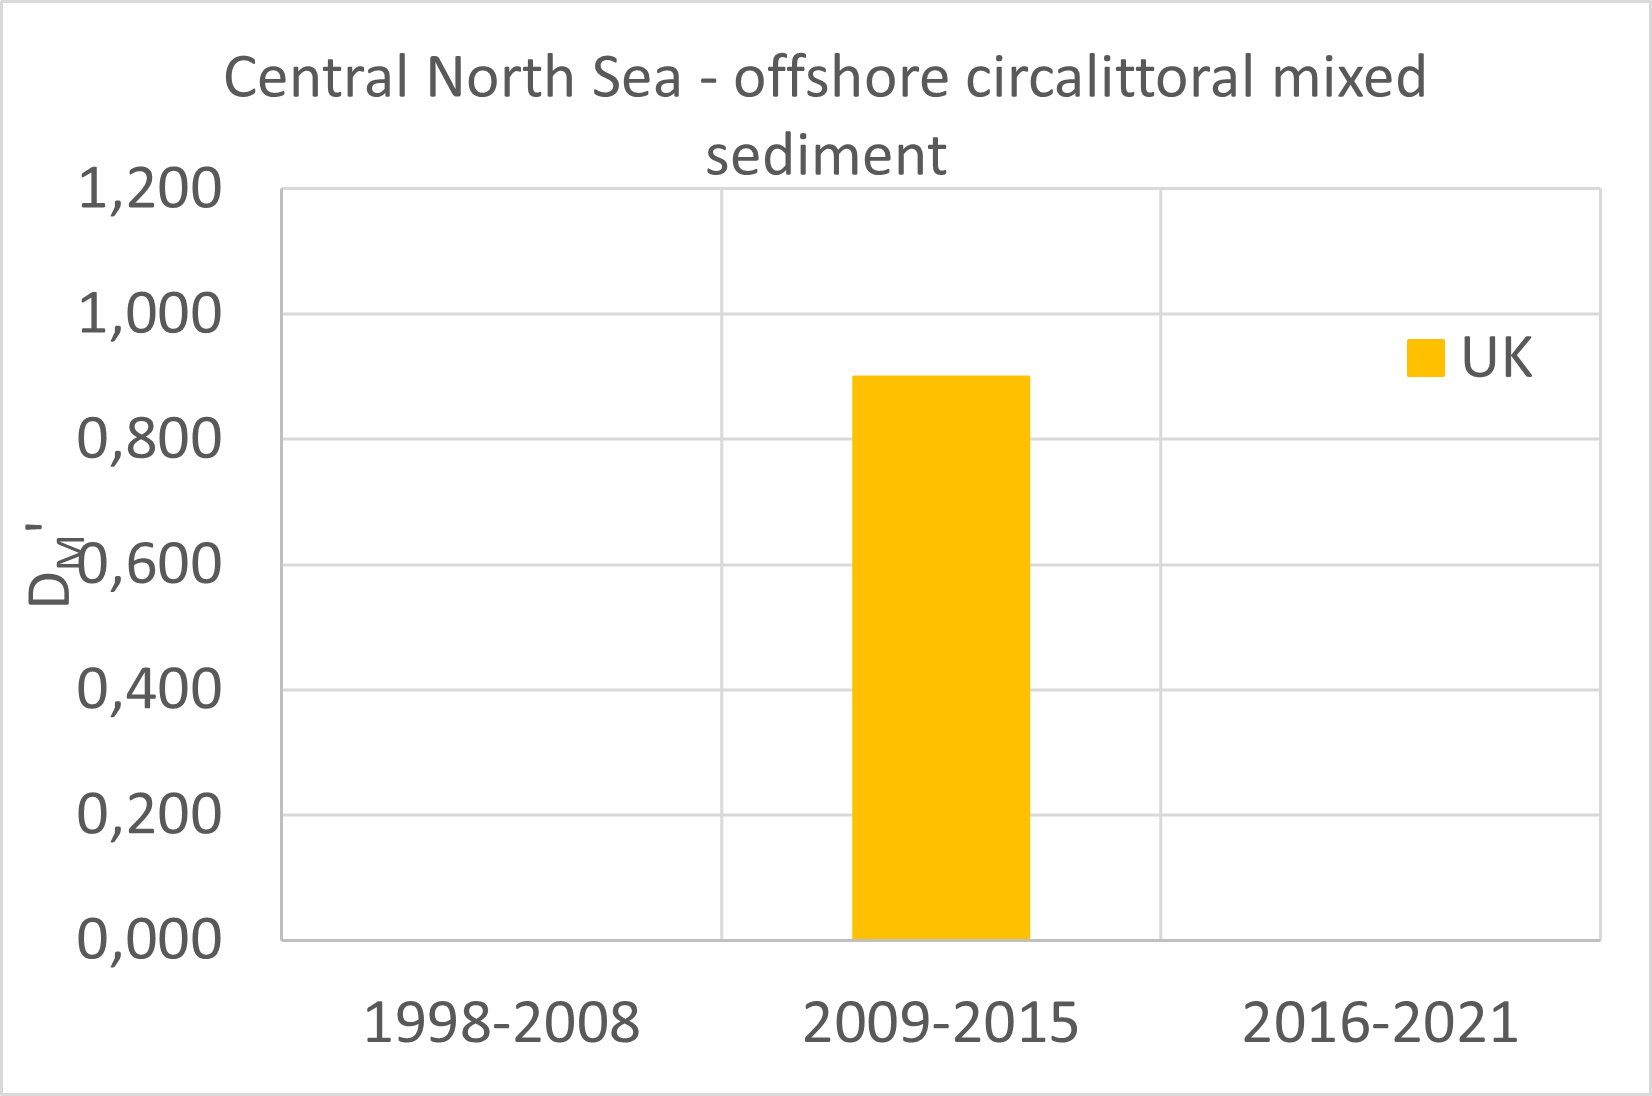
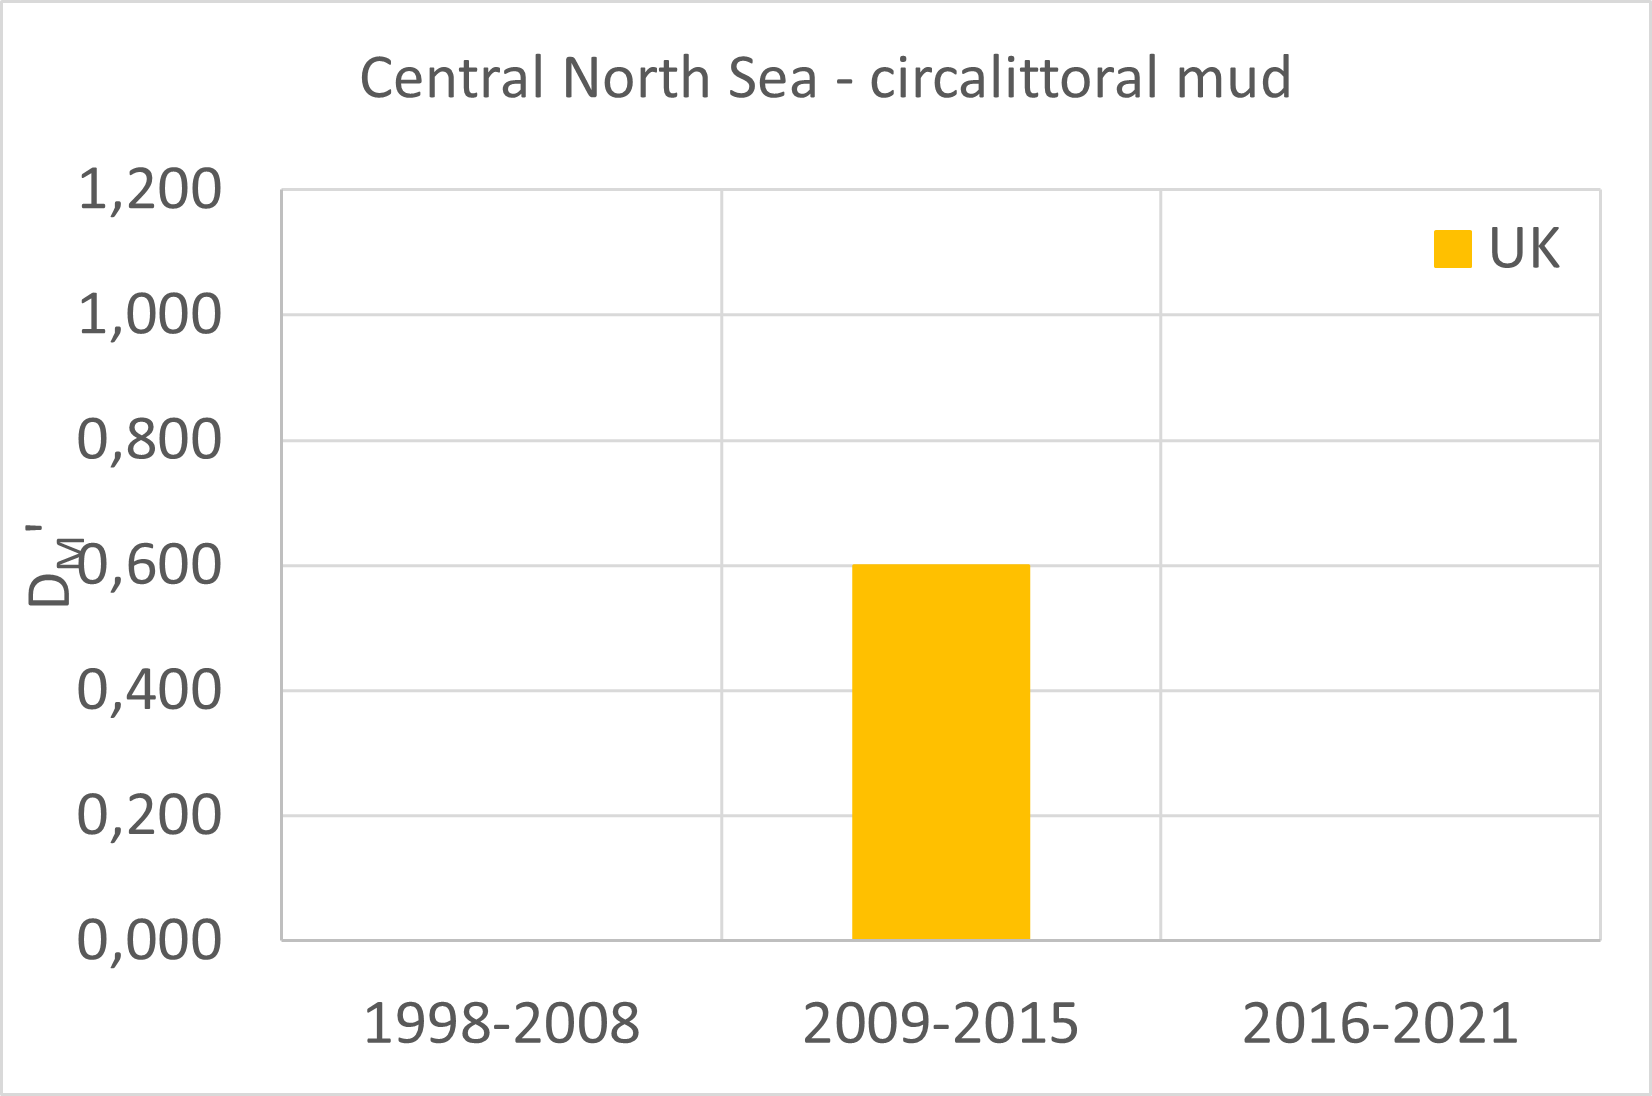
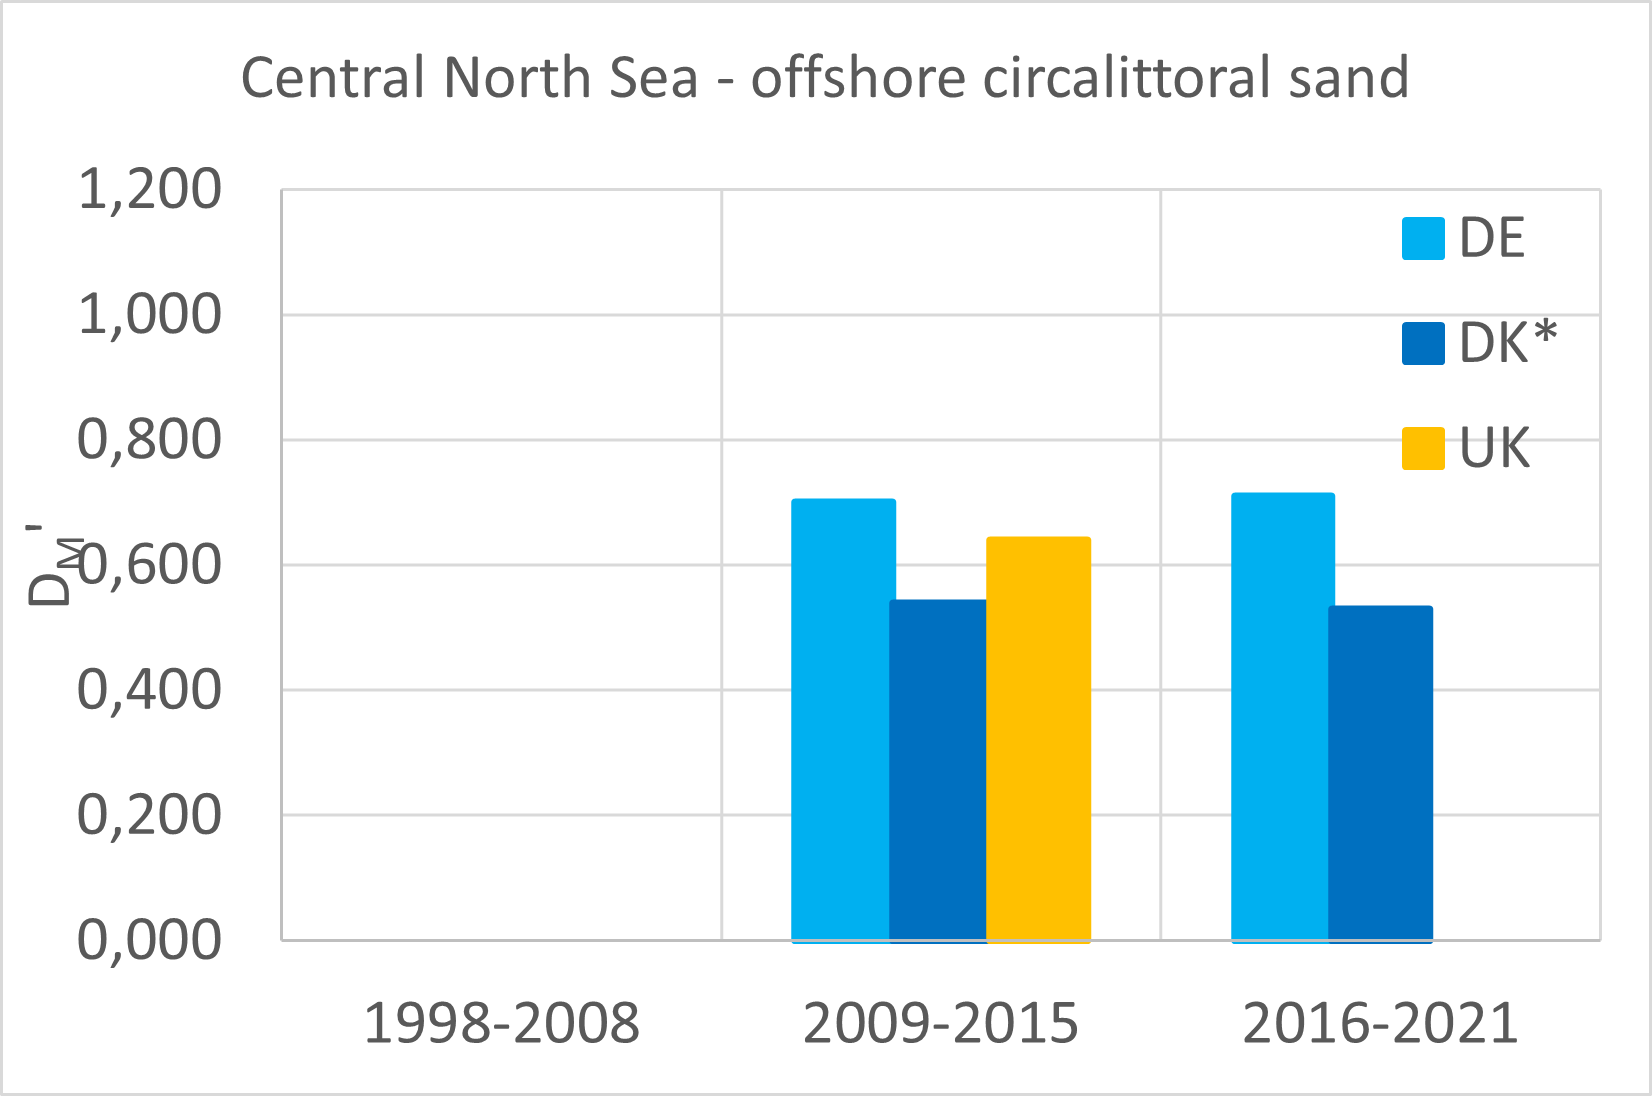
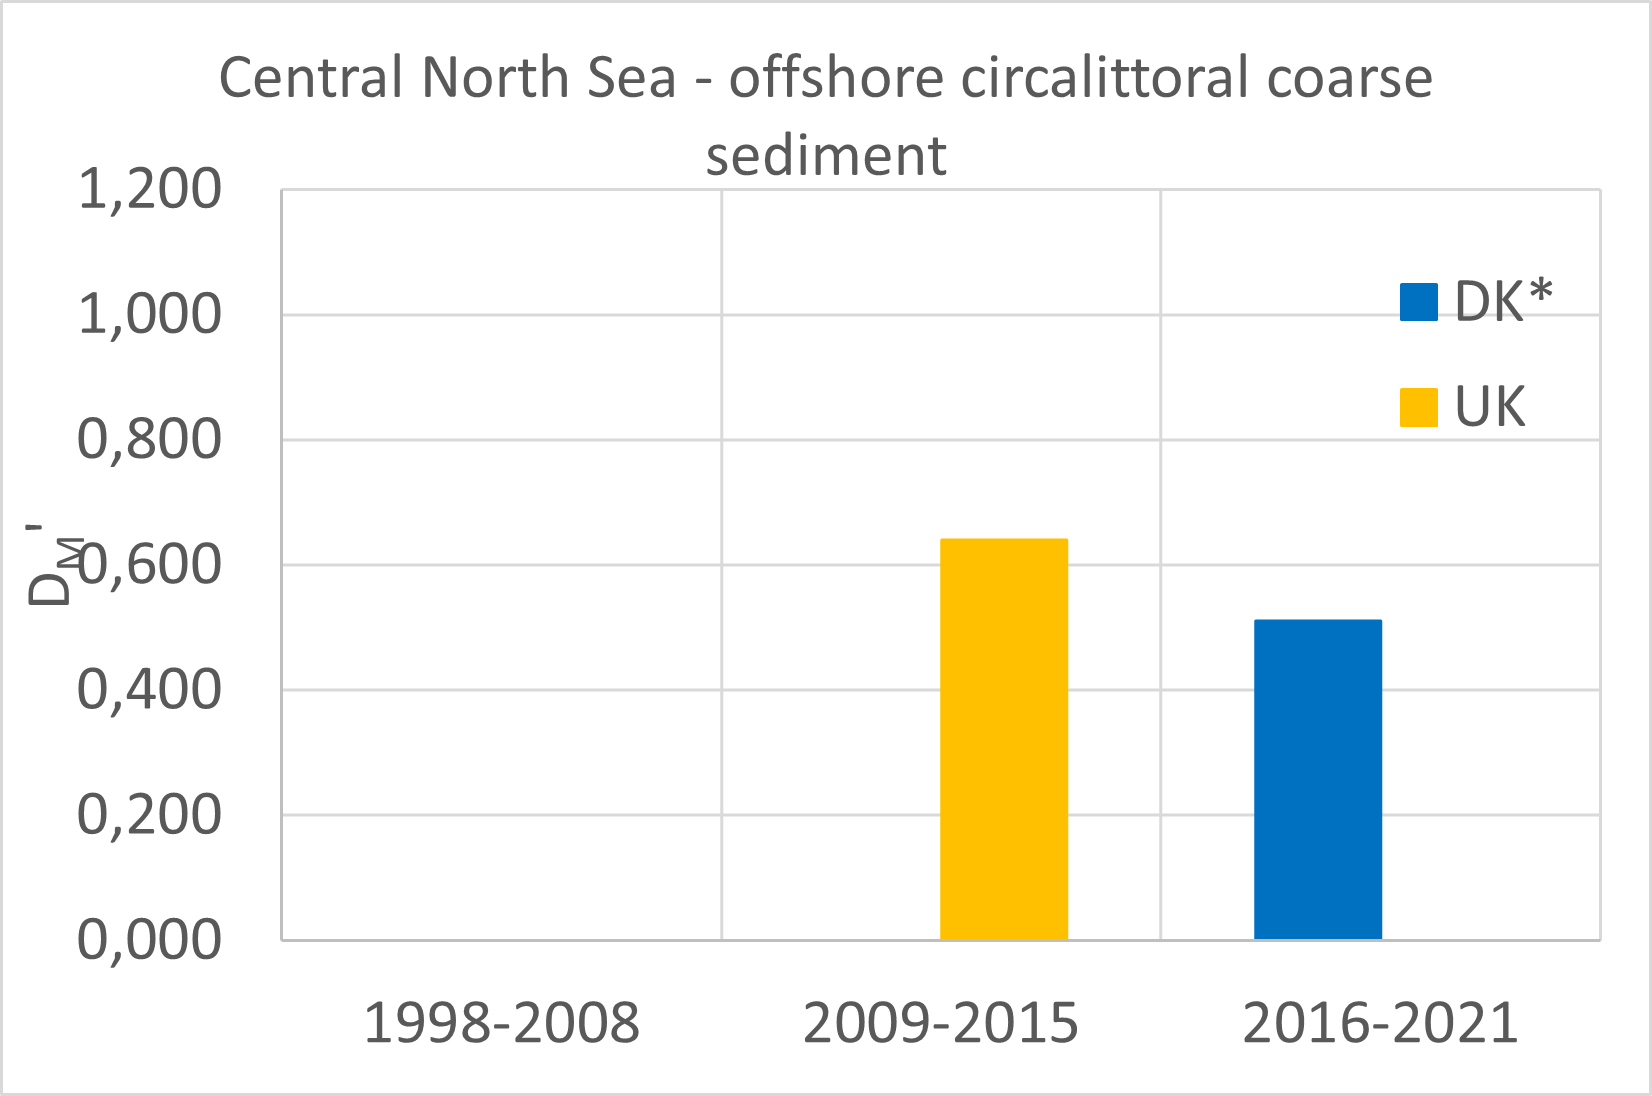
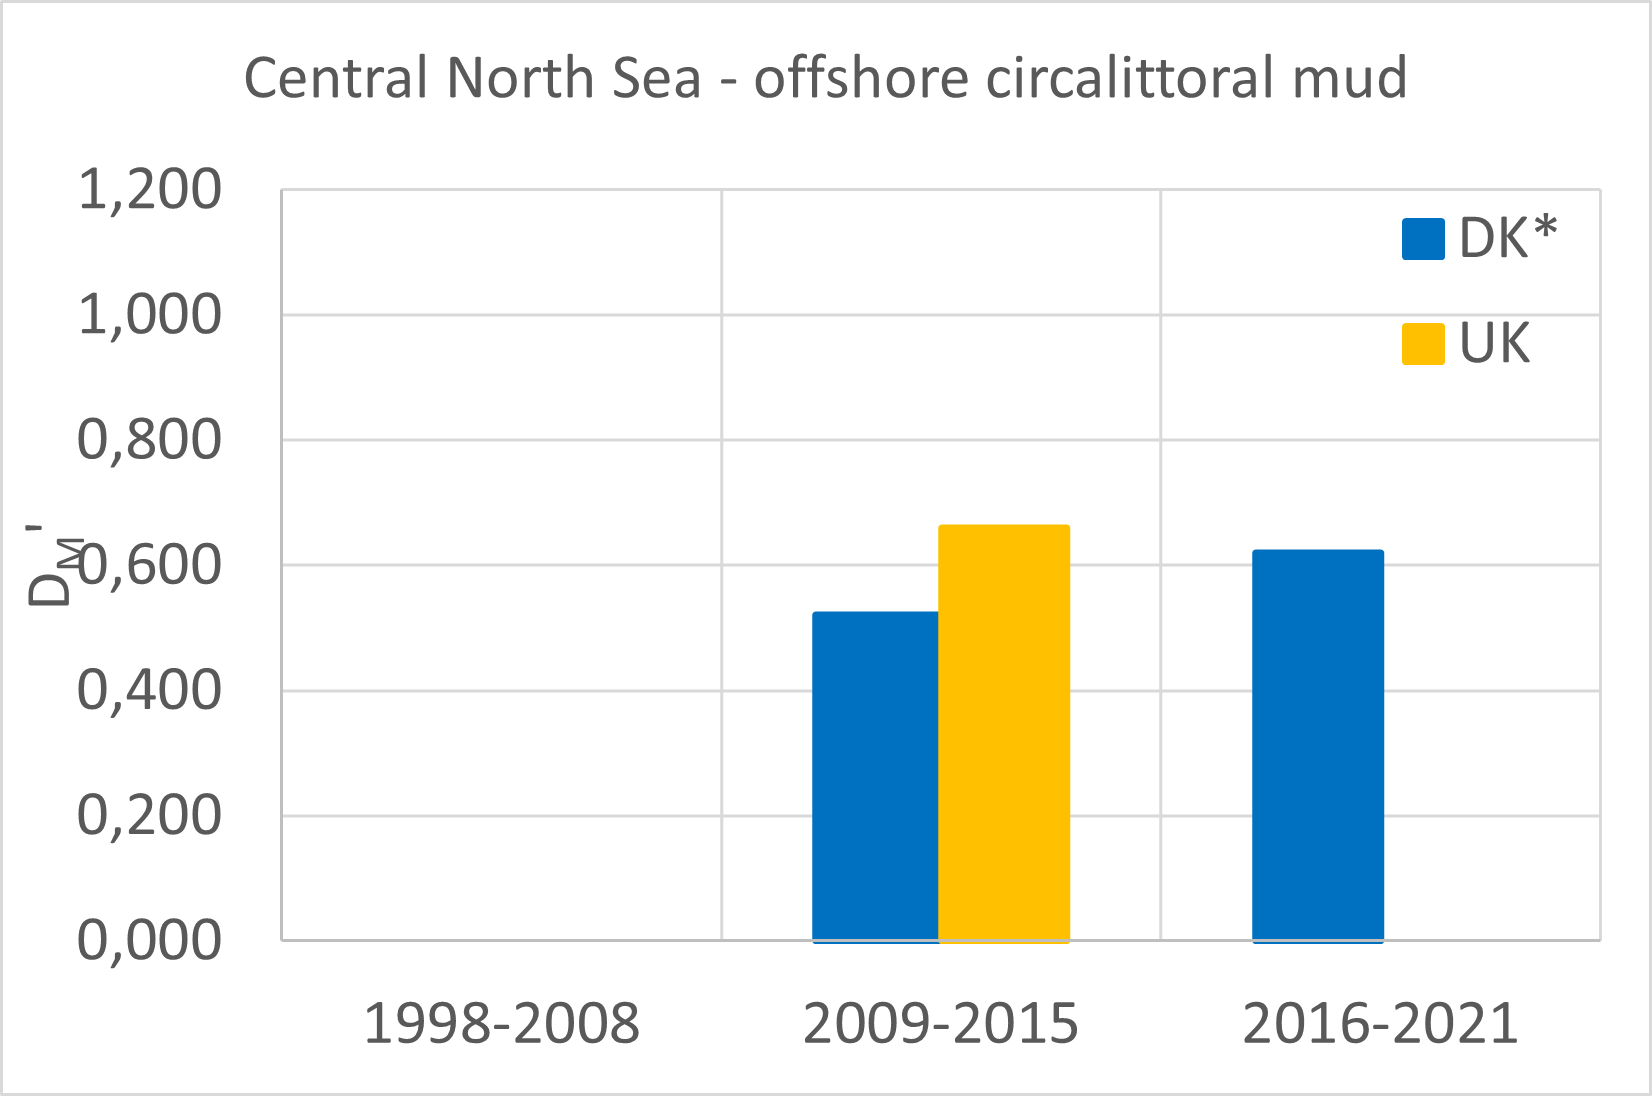
The assessment of the Relative Margalef diversity for the Central North Sea for some BHTs is almost solely based on UK data (by far the largest share of the subregion is part of UK waters). For some BHTs, like circalittoral – and offshore circalittoral sand and offshore circalittoral mud and coarse sediment habitat a reasonable number of samples were available for other countries (like Germany and Denmark) as well. There the results are largely comparable with those from the UK. Relative diversity in the UK and German samples indicates a moderate to high relative diversity of the circalittoral sandy habitat. The offshore circalittoral mixed sediment habitat (only UK data) has even relative high diversity. Moderate diversity is also found for offshore circalittoral coarse sediment and – sandy habitat based on UK and German (offshore circalittoral sand only) samples, but diversity is lower in the Danish part (Figure b). Differences between UK and other country samples can be explained by the spatial distribution, as all other country territories are restricted to the most south-eastern part of the Central North Sea, where fishing pressure (at least compared to part of the remainder of the Central North Sea) is generally higher. The relative diversity is poor to moderate for the circalittoral muddy habitat (based on UK data) slightly lower than the offshore circalittoral muddy habitat (based on UK data).
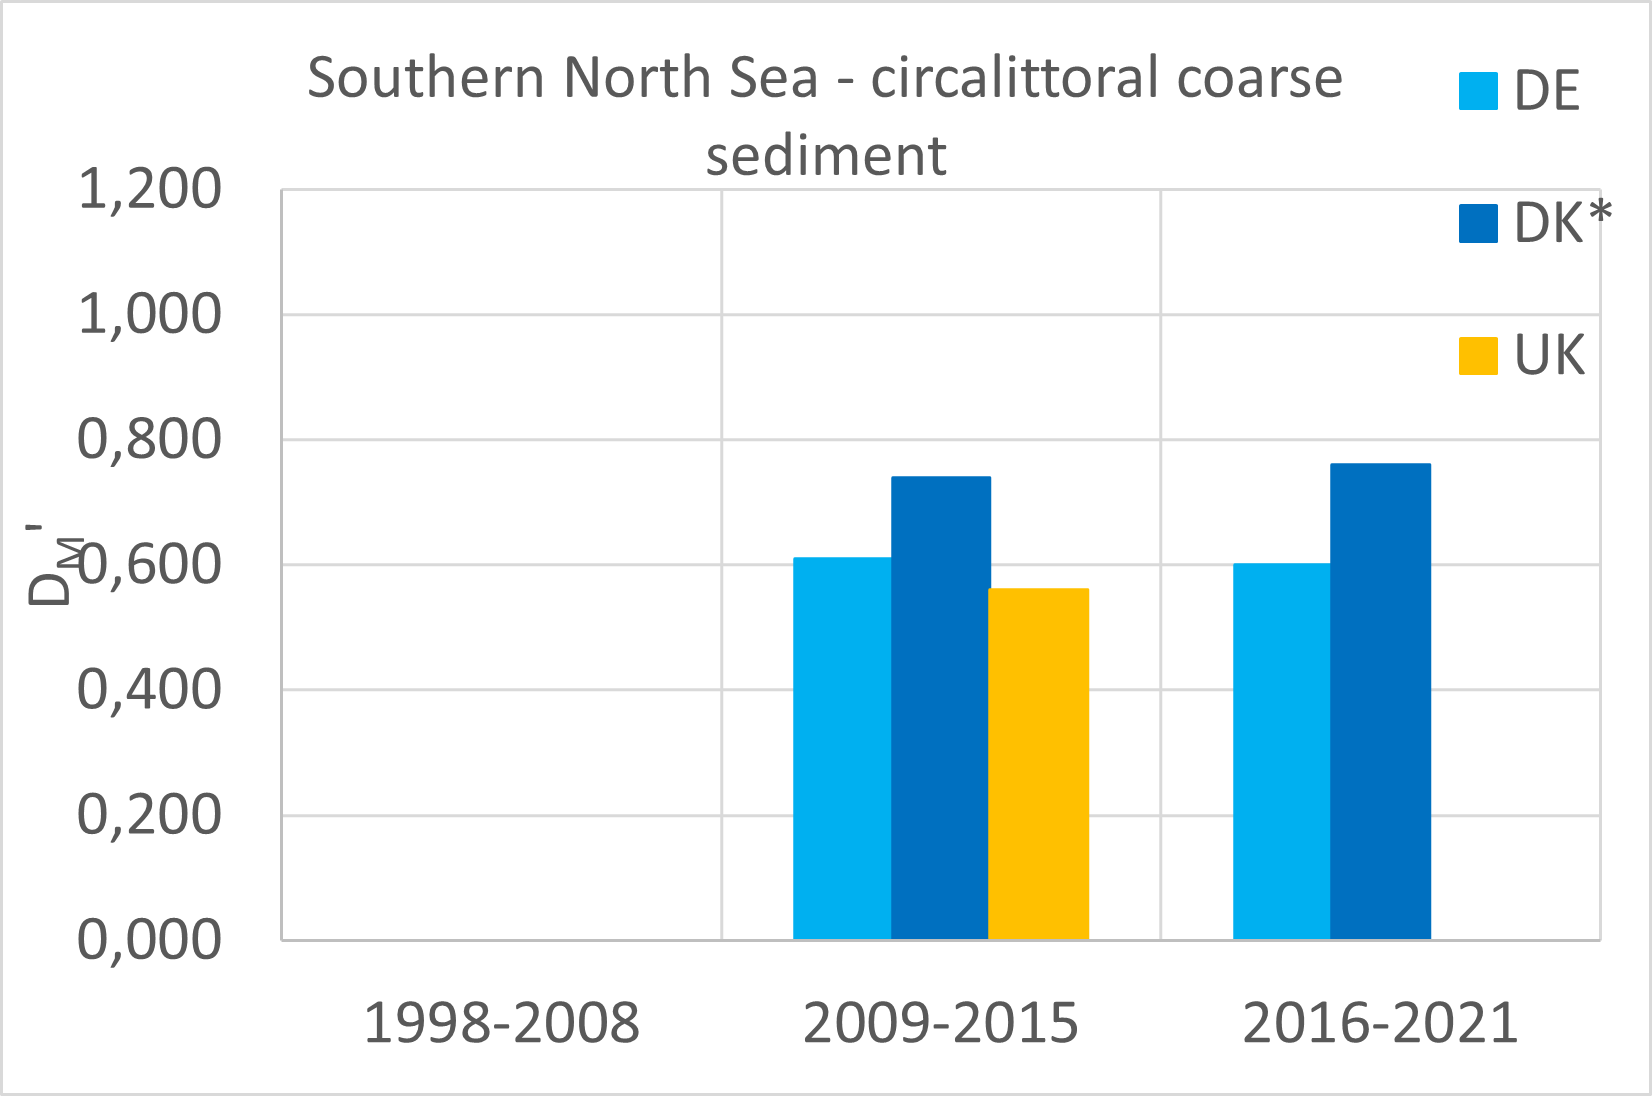
Southern North Sea
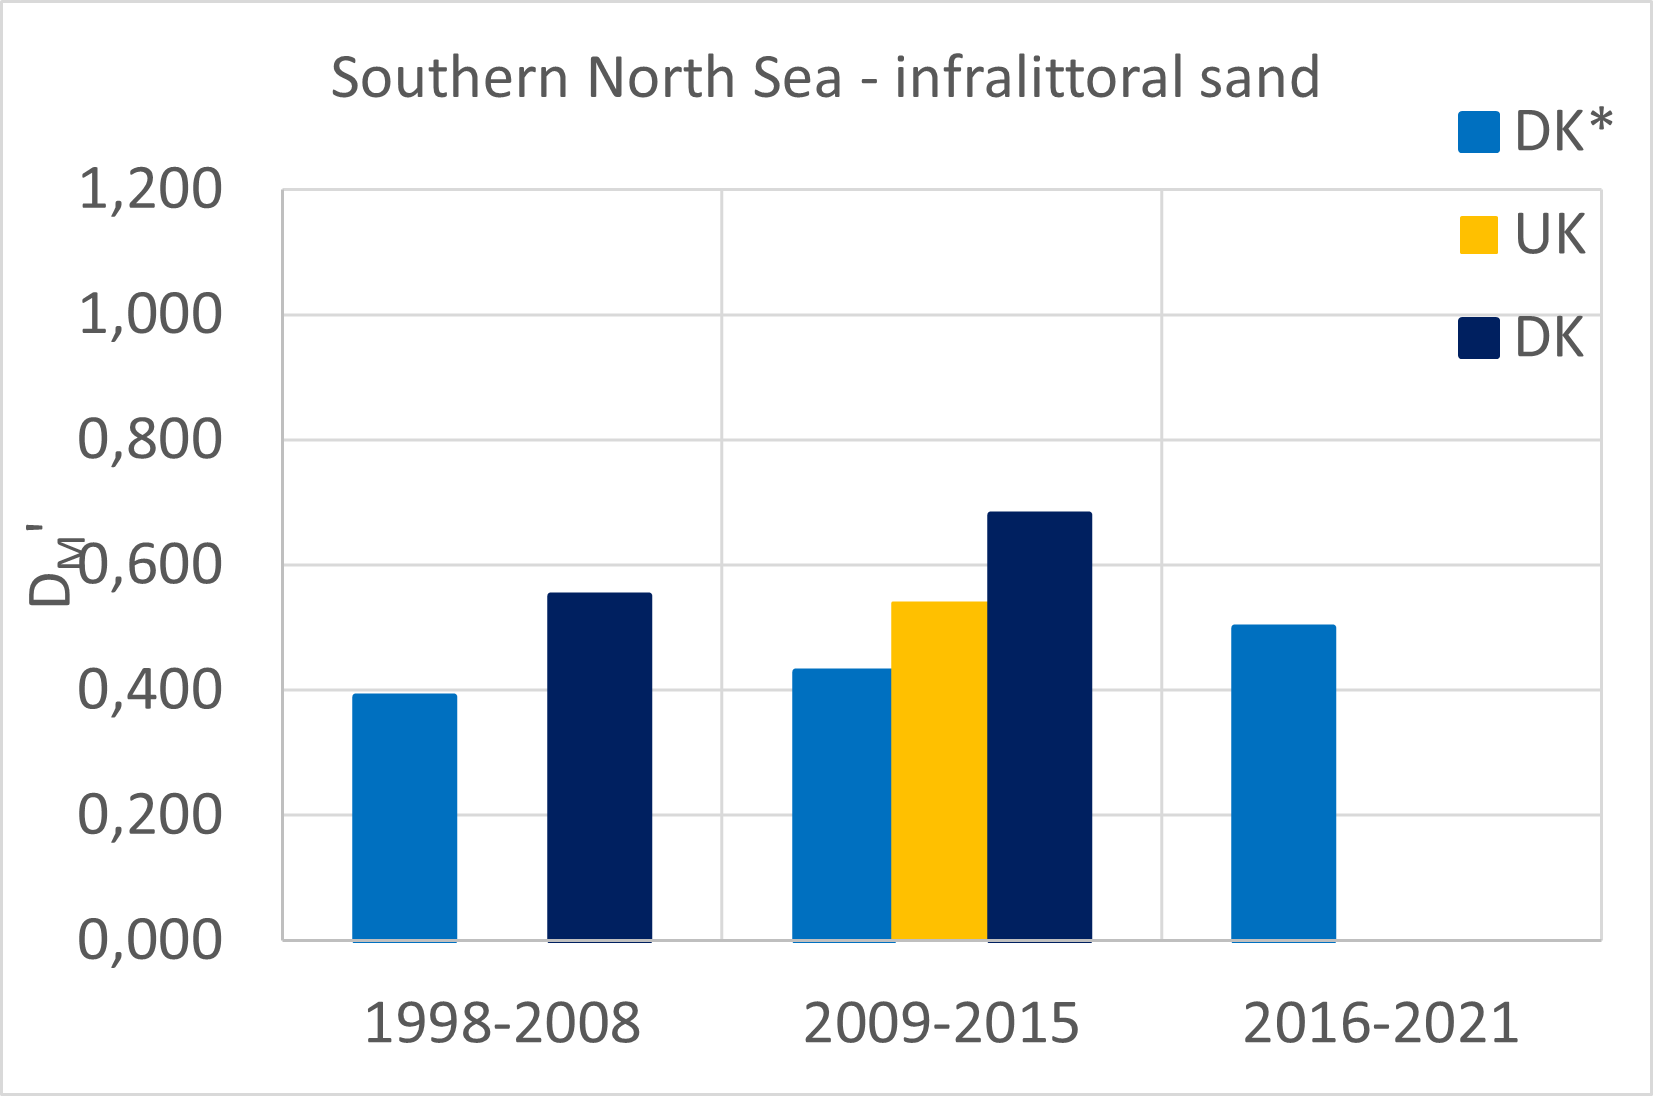
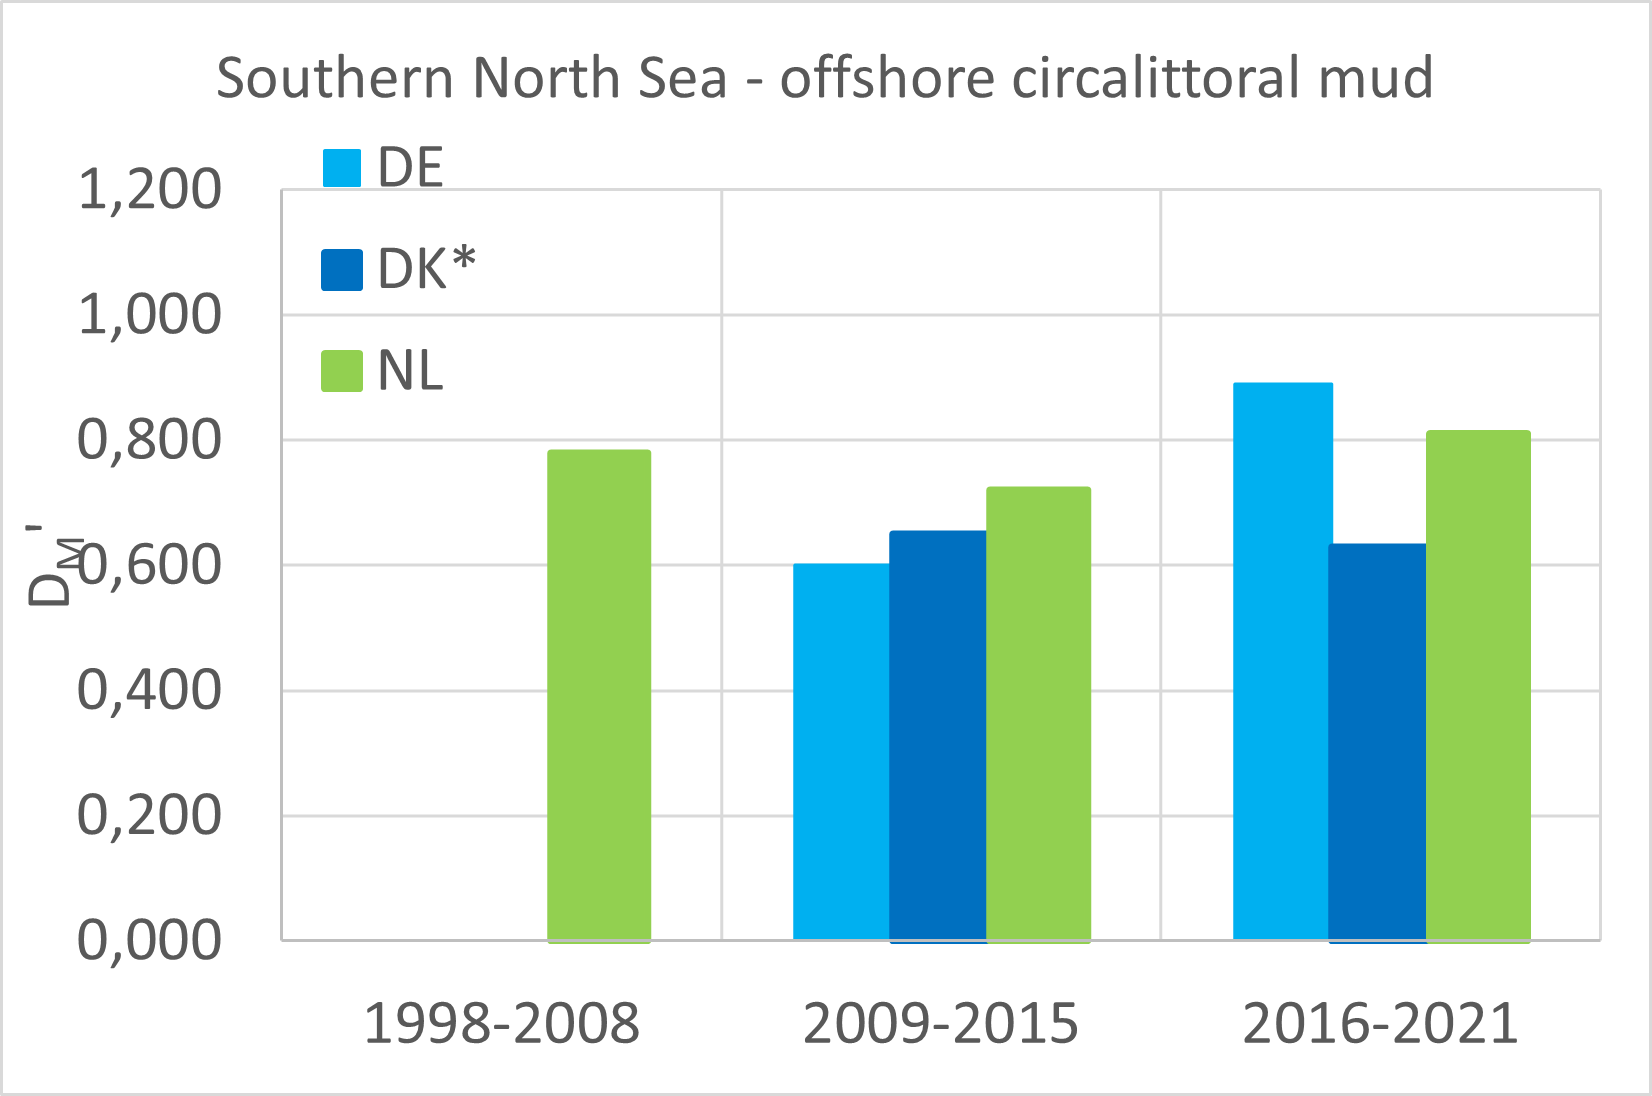
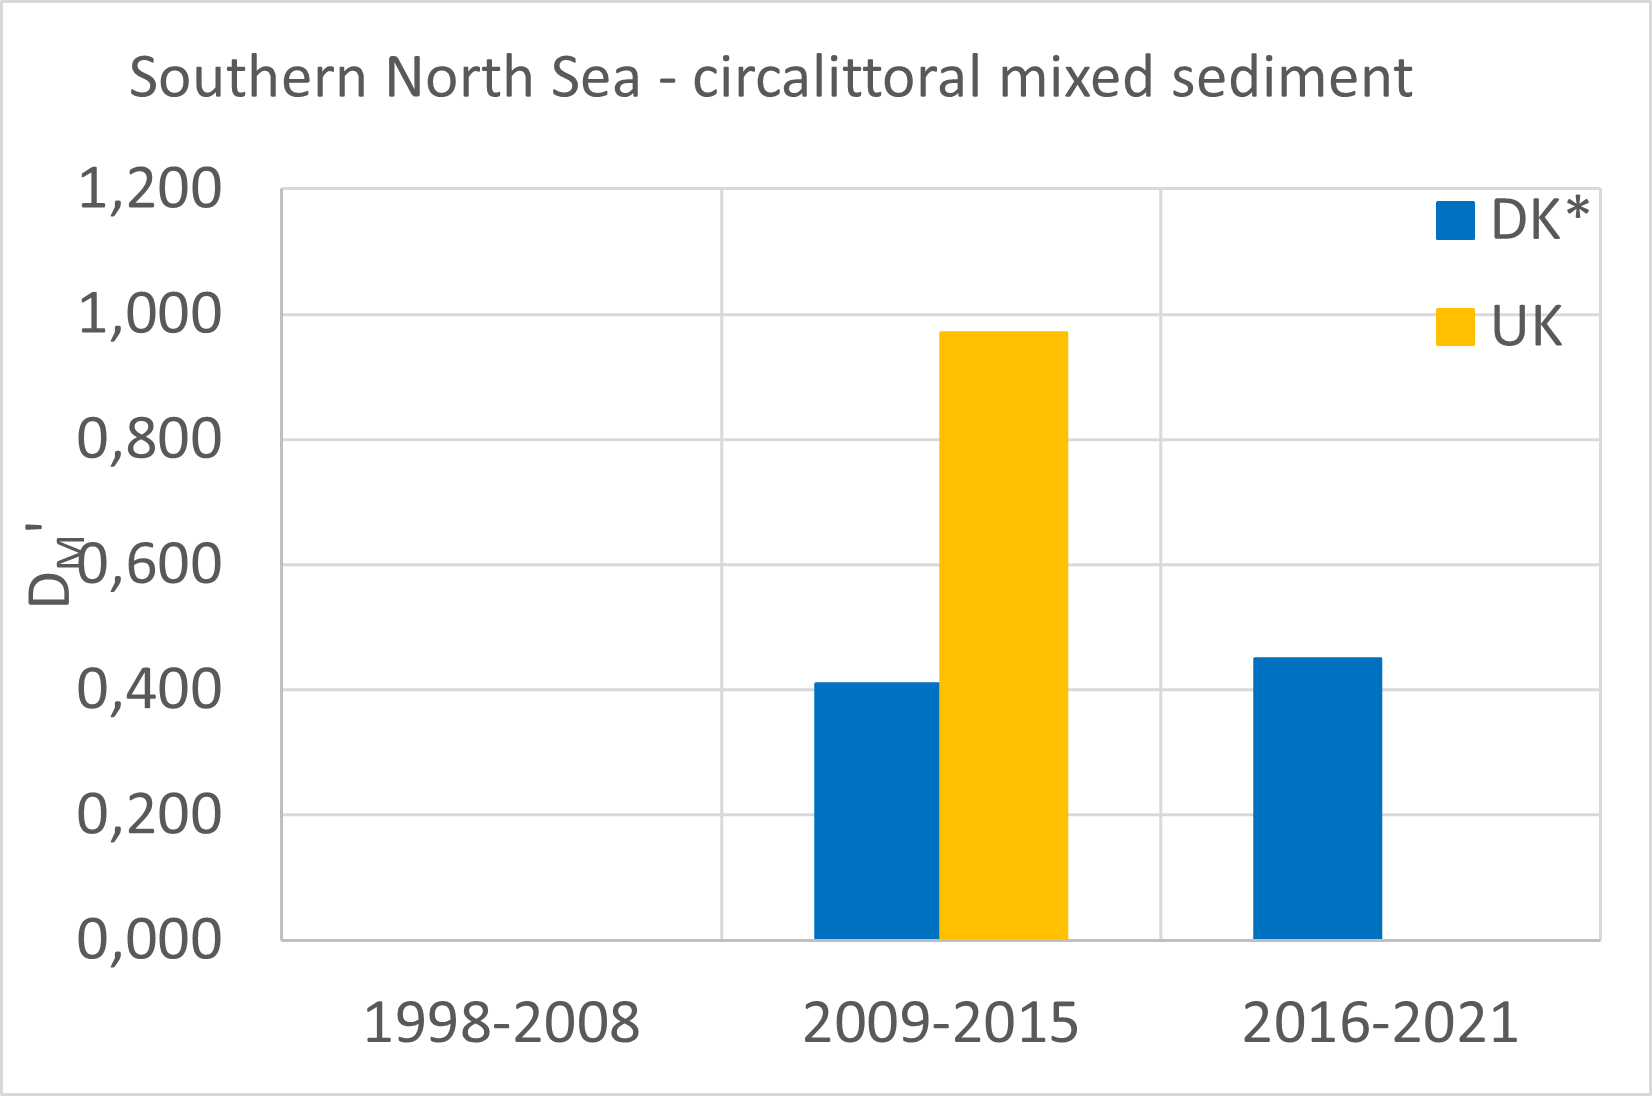
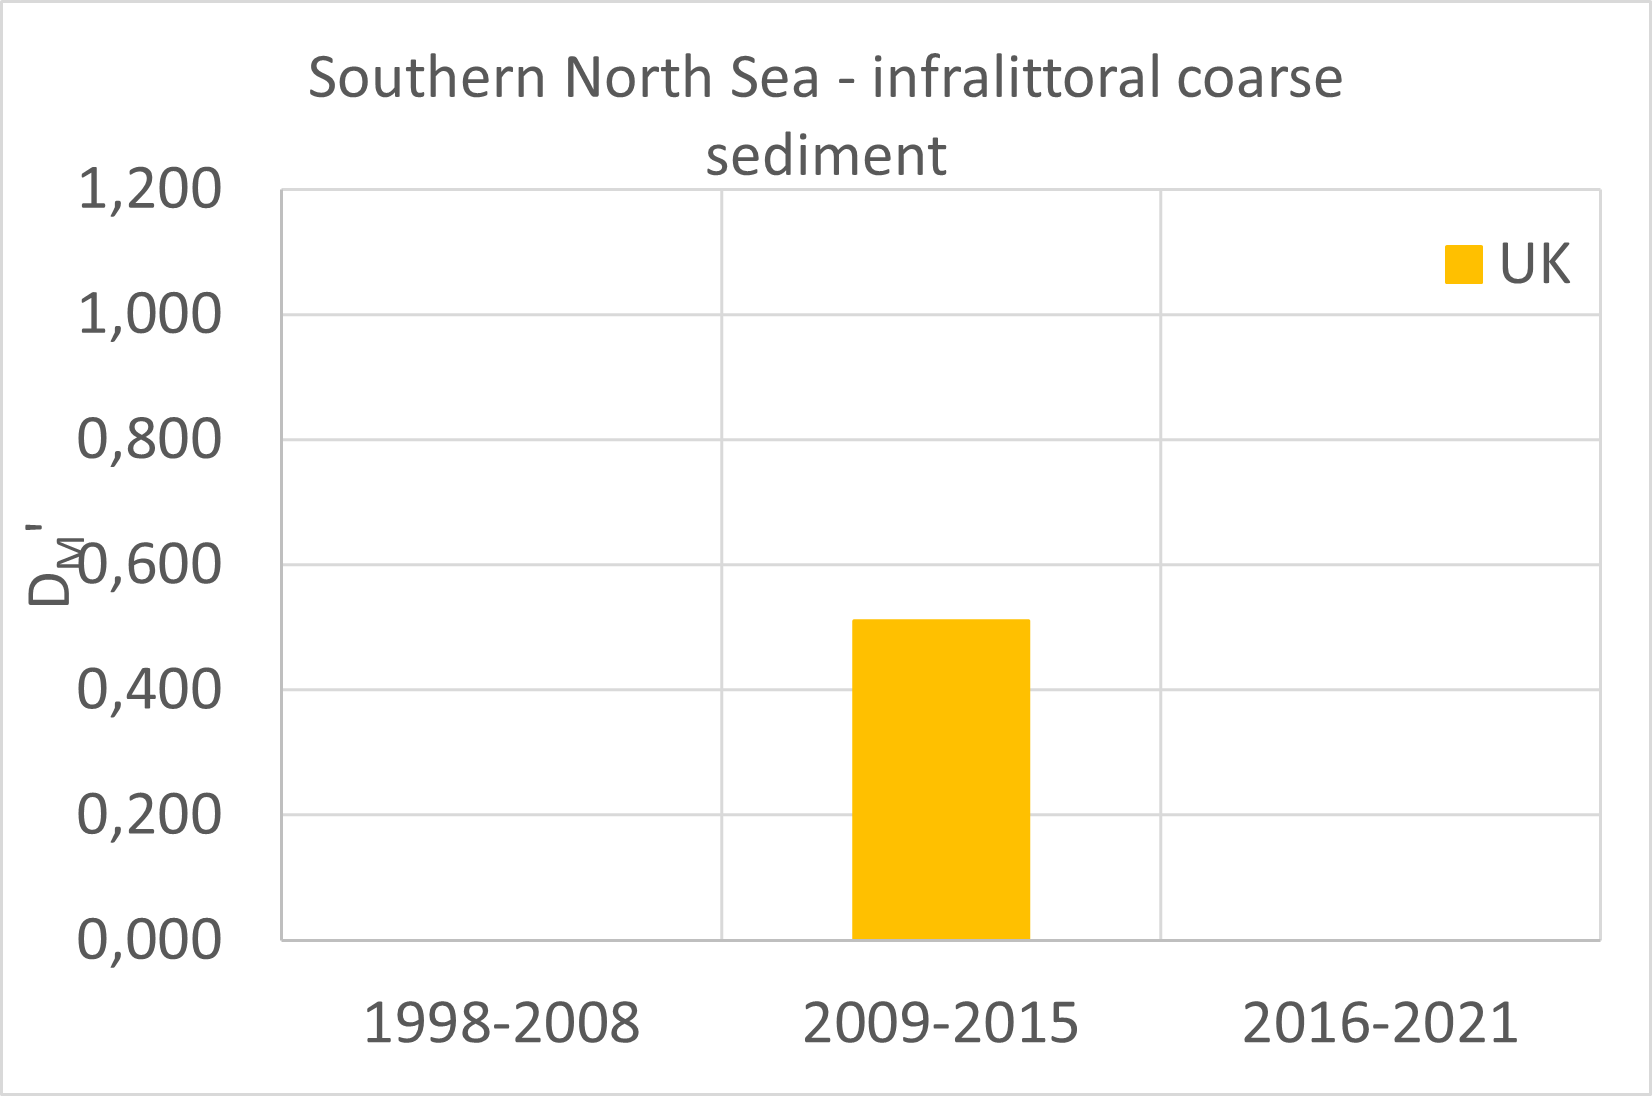
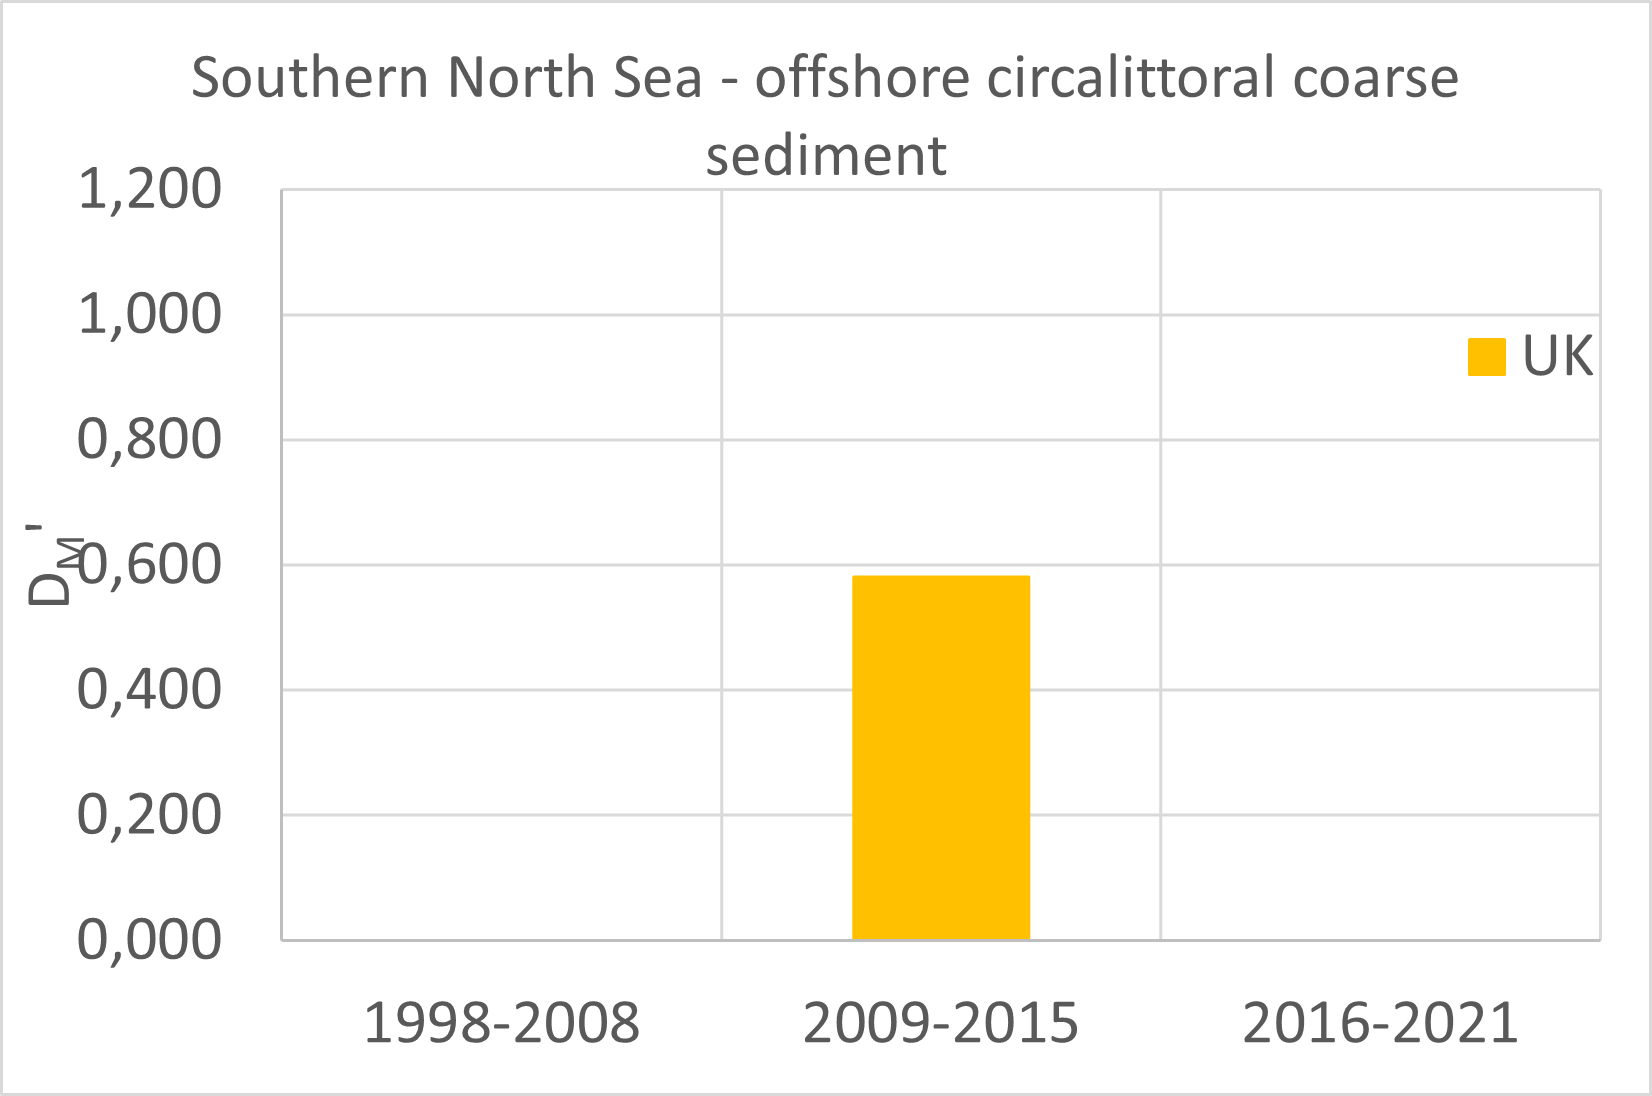
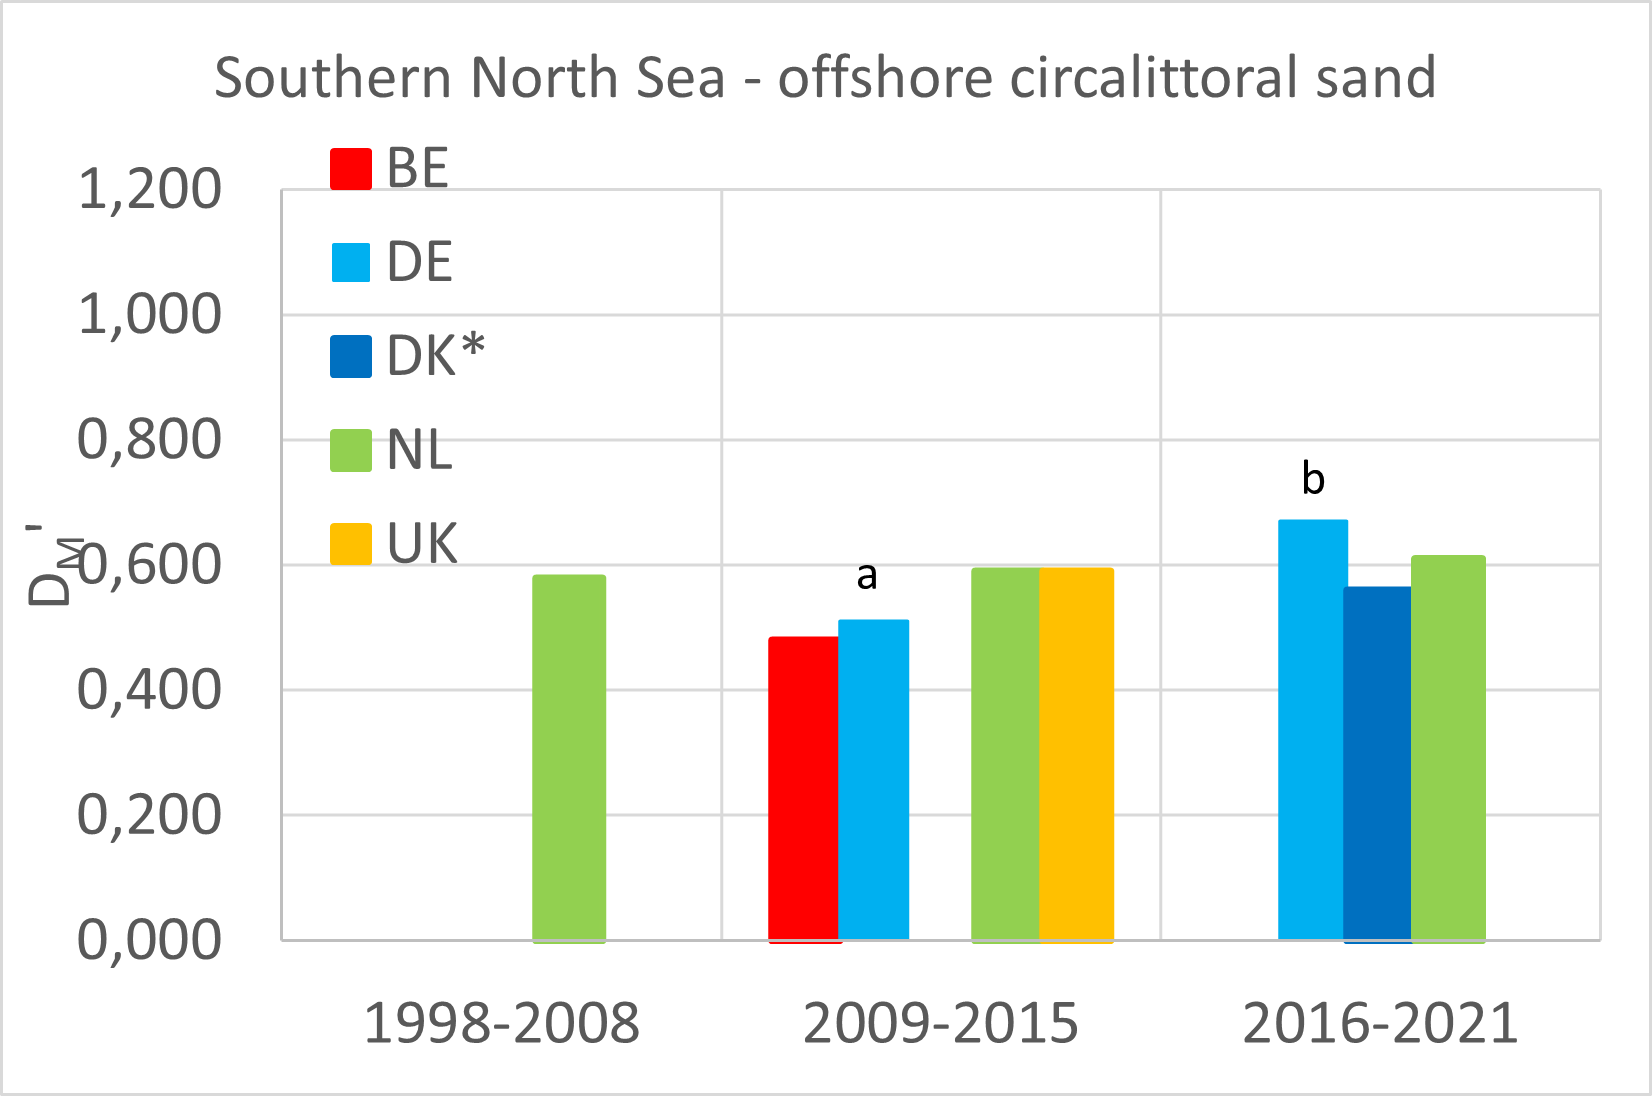
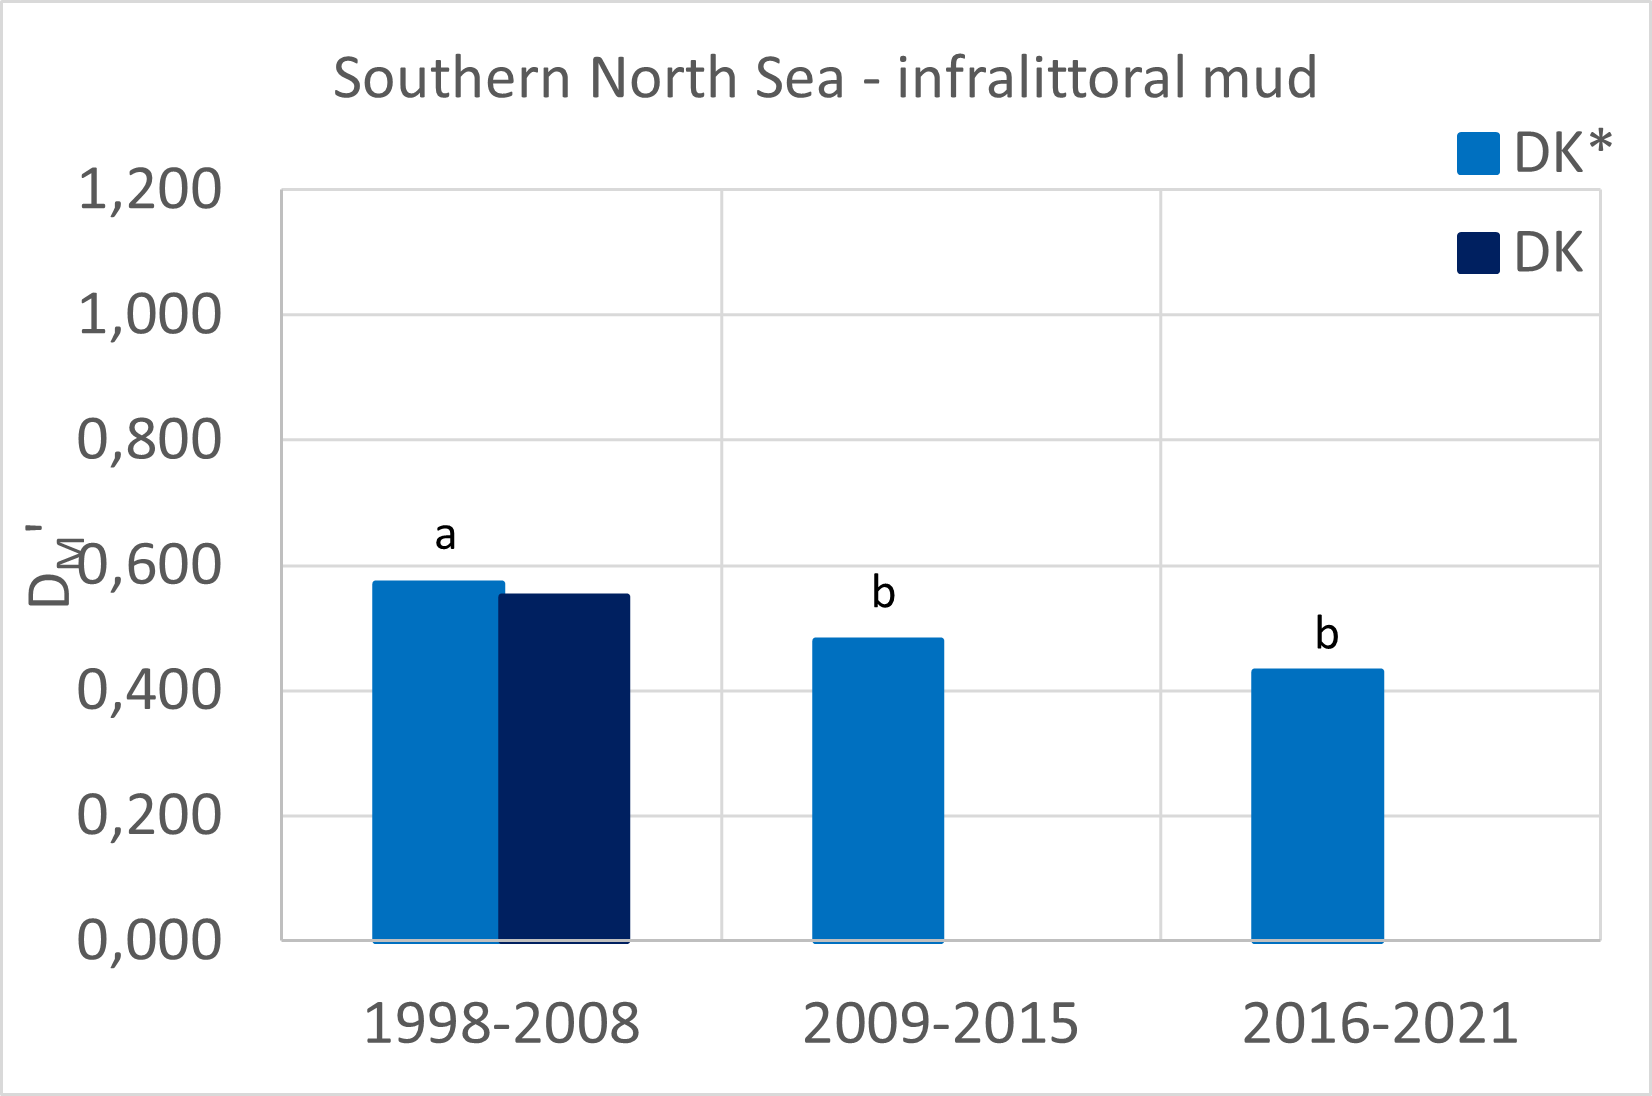
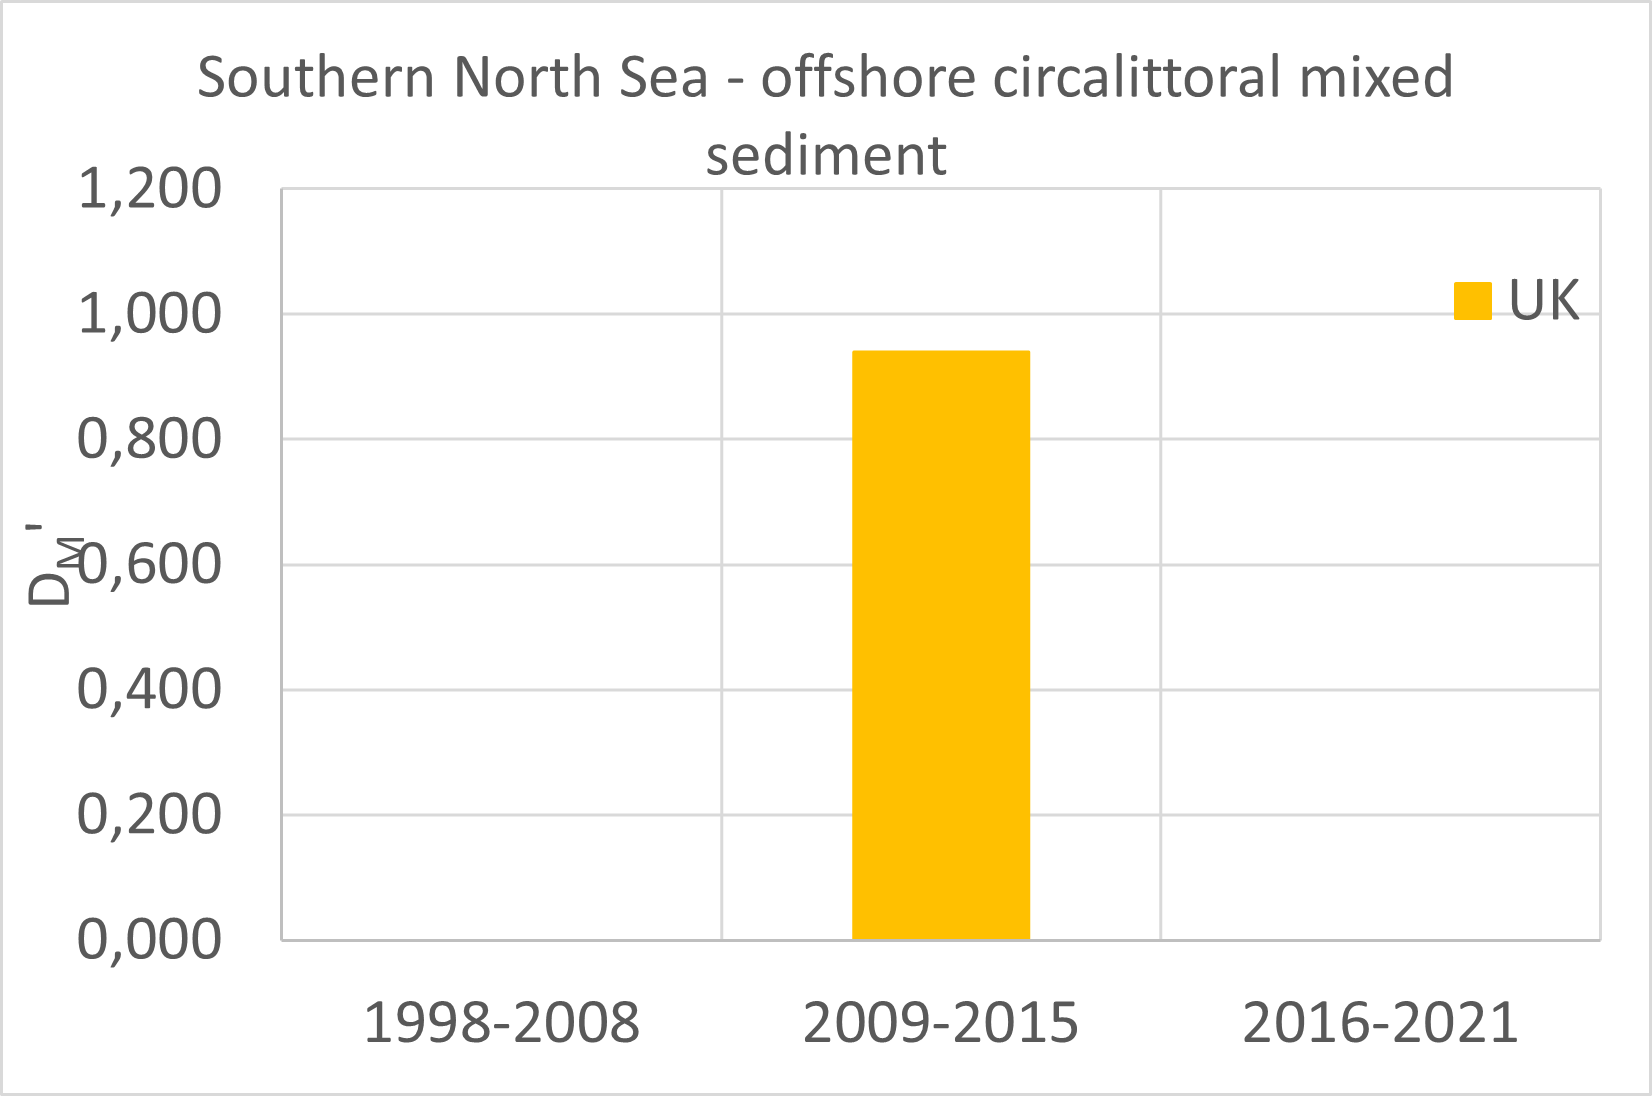
In the Southern North Sea the relative diversity seems to be relatively high in the offshore circalittoral mixed sediment (UK data) and in the offshore circalittoral muddy habitat (based on Dutch data; moderate diversity based on Danish data). Germany indicated that the data for 2016-2021 are not representative for the national part of the BHT, results are however in line with findings based on Dutch samples. Strikingly, the offshore circalittoral muddy habitat is considered the most heavily fished and in combination with expected highest sensitivity the BHT most at risk of being impacted, based on BH3 (Extent of physical disturbance to benthic habitats) results. It has already been indicated for the results at assessment unit scale, that for a large part of the area (e.g., UK waters) benthic community observation data were lacking for the most recent (2016-2021) years. Therefore, it is very well possible that current high risks of impact are not yet reflected in benthic relative diversity observations. In the circalittoral zone, relative diversity based on Dutch data was high in the 1998-2008 period. This is however contrary to the very poor relative diversity observed for circalittoral muddy habitat in Danish waters. Where mixed sediments in the circalittoral zone in the UK maintain relative high diversity (comparable to the offshore variant), the relative diversity based on Danish data appears to be rather low for the same habitat type. It seems that conditions are very different at the Danish sample sites, which might indicate a central/west to east differentiation in the relative diversity and therefore quality of these benthic habitats. Relative diversity of sandy habitats seems to be slightly higher in the offshore circalittoral than in the circalittoral zone; especially based on Dutch and German observations. (The very low relative diversity during 1998-2008 for Germany is most likely determined by the fact that observations are exclusively from territorial waters, not comparable to subsequent time periods, as indicated by Germany). Rather low relative diversity is observed in the infralittoral zone of the Southern North Sea, where Danish data even indicate a significant decrease in diversity for infralittoral mud. Relative diversity for coarse sediment habitat in the infralittoral zone (UK data) is slightly lower than in circalittoral and offshore circalittoral zone.
Kattegat
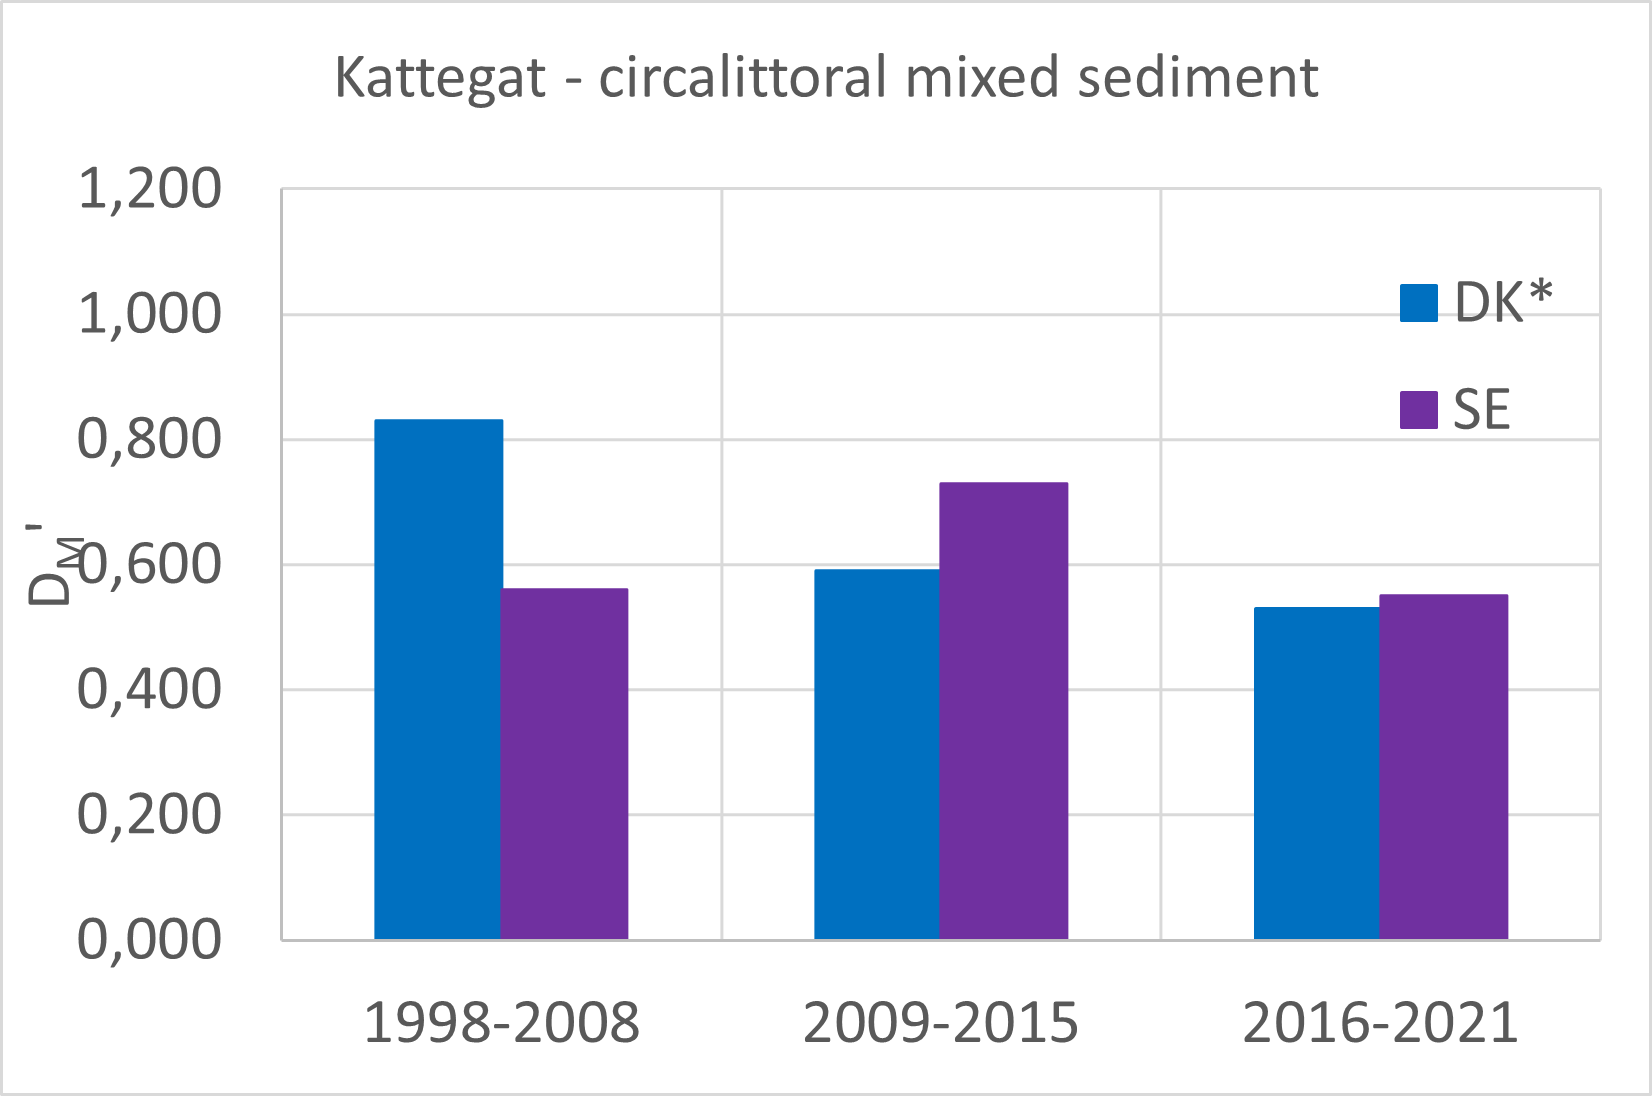
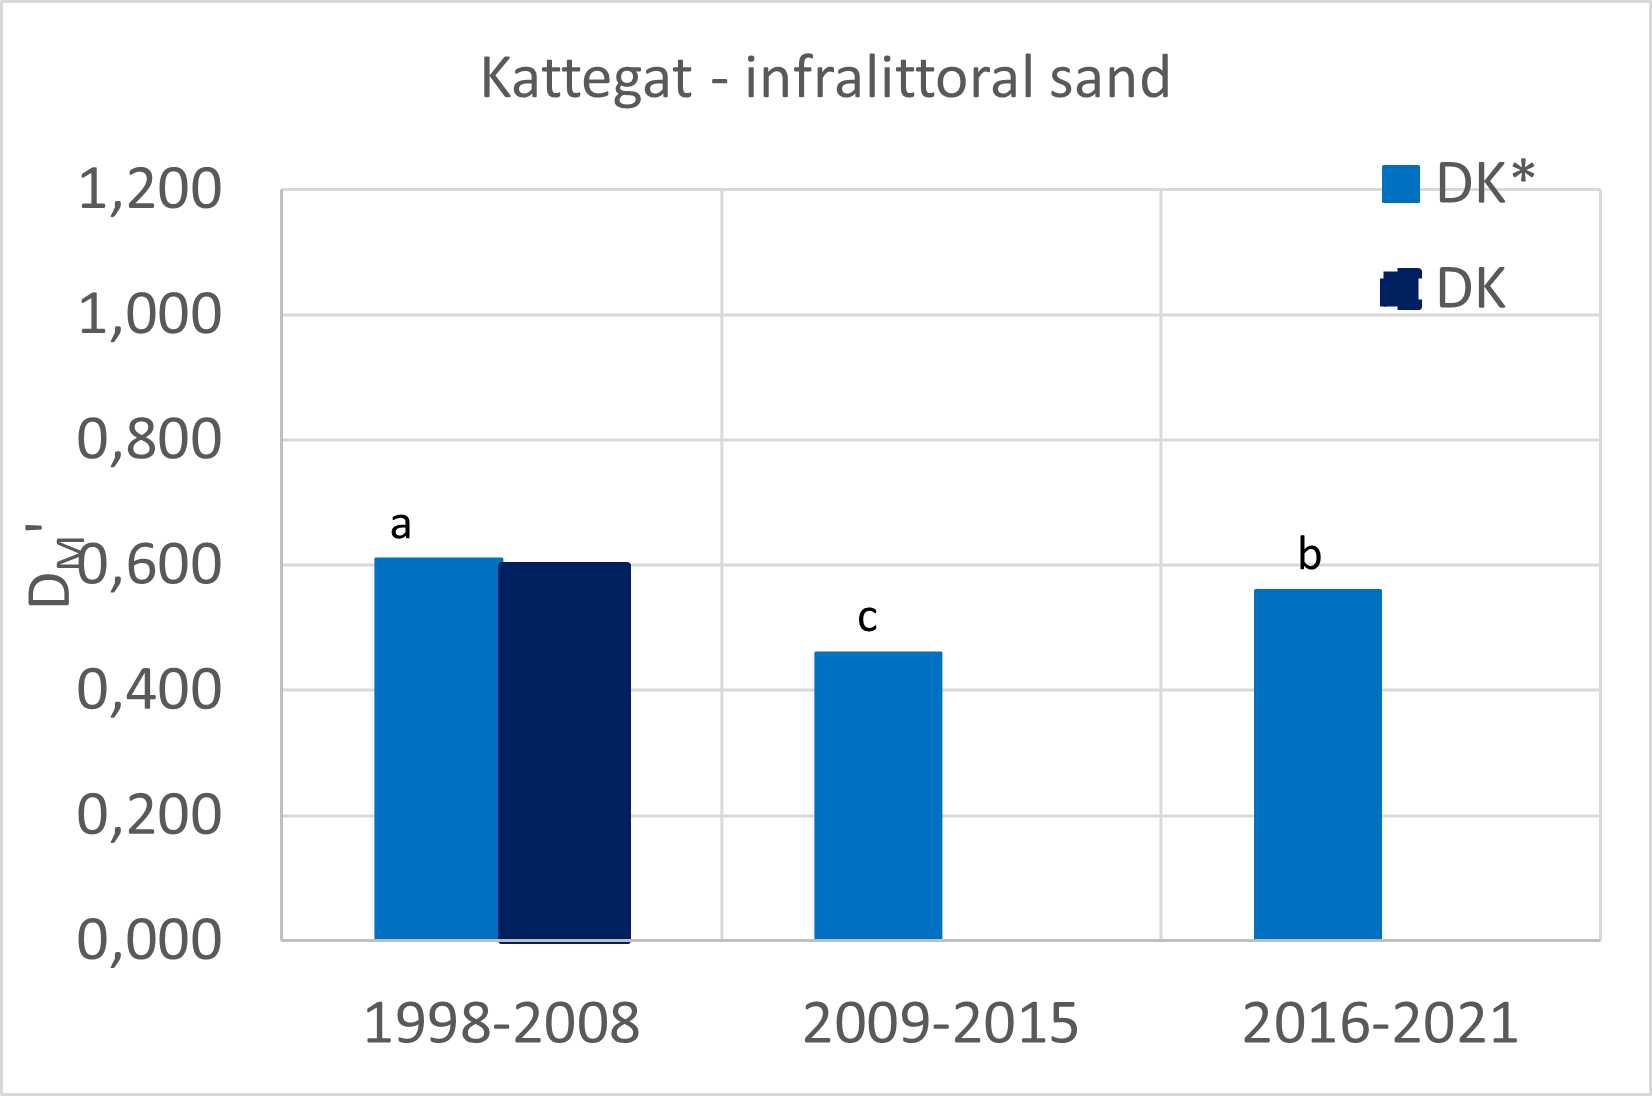
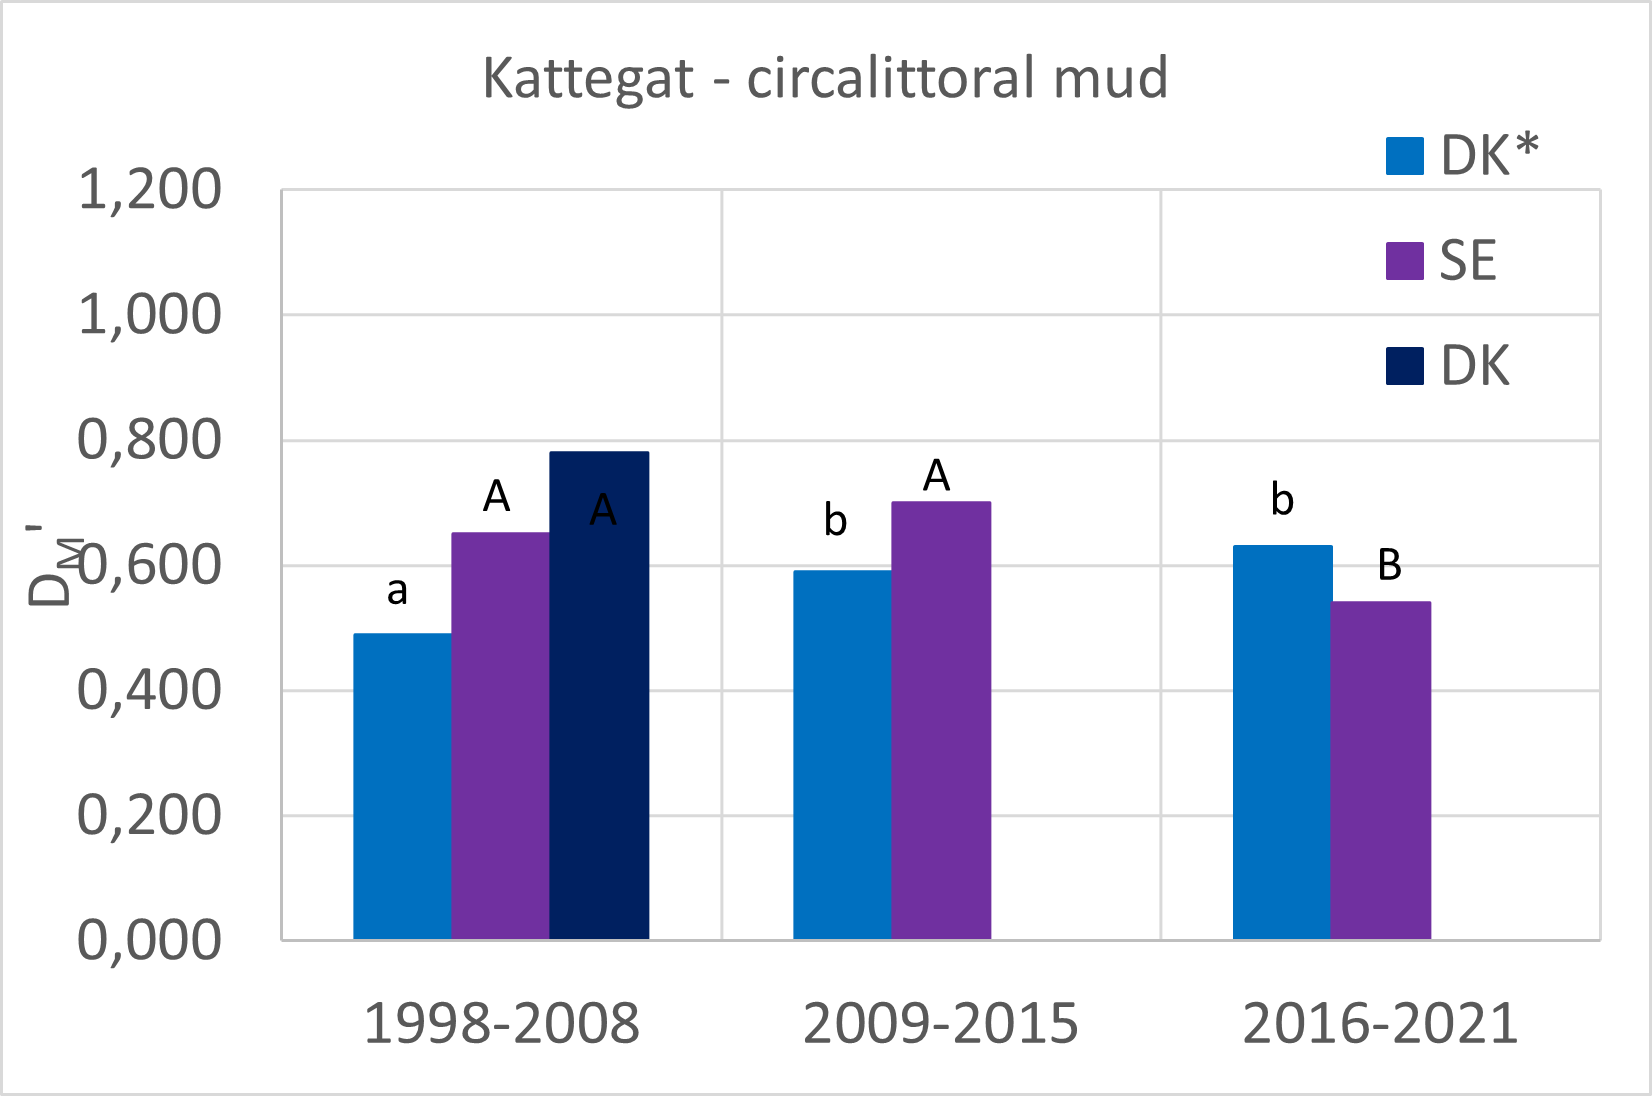
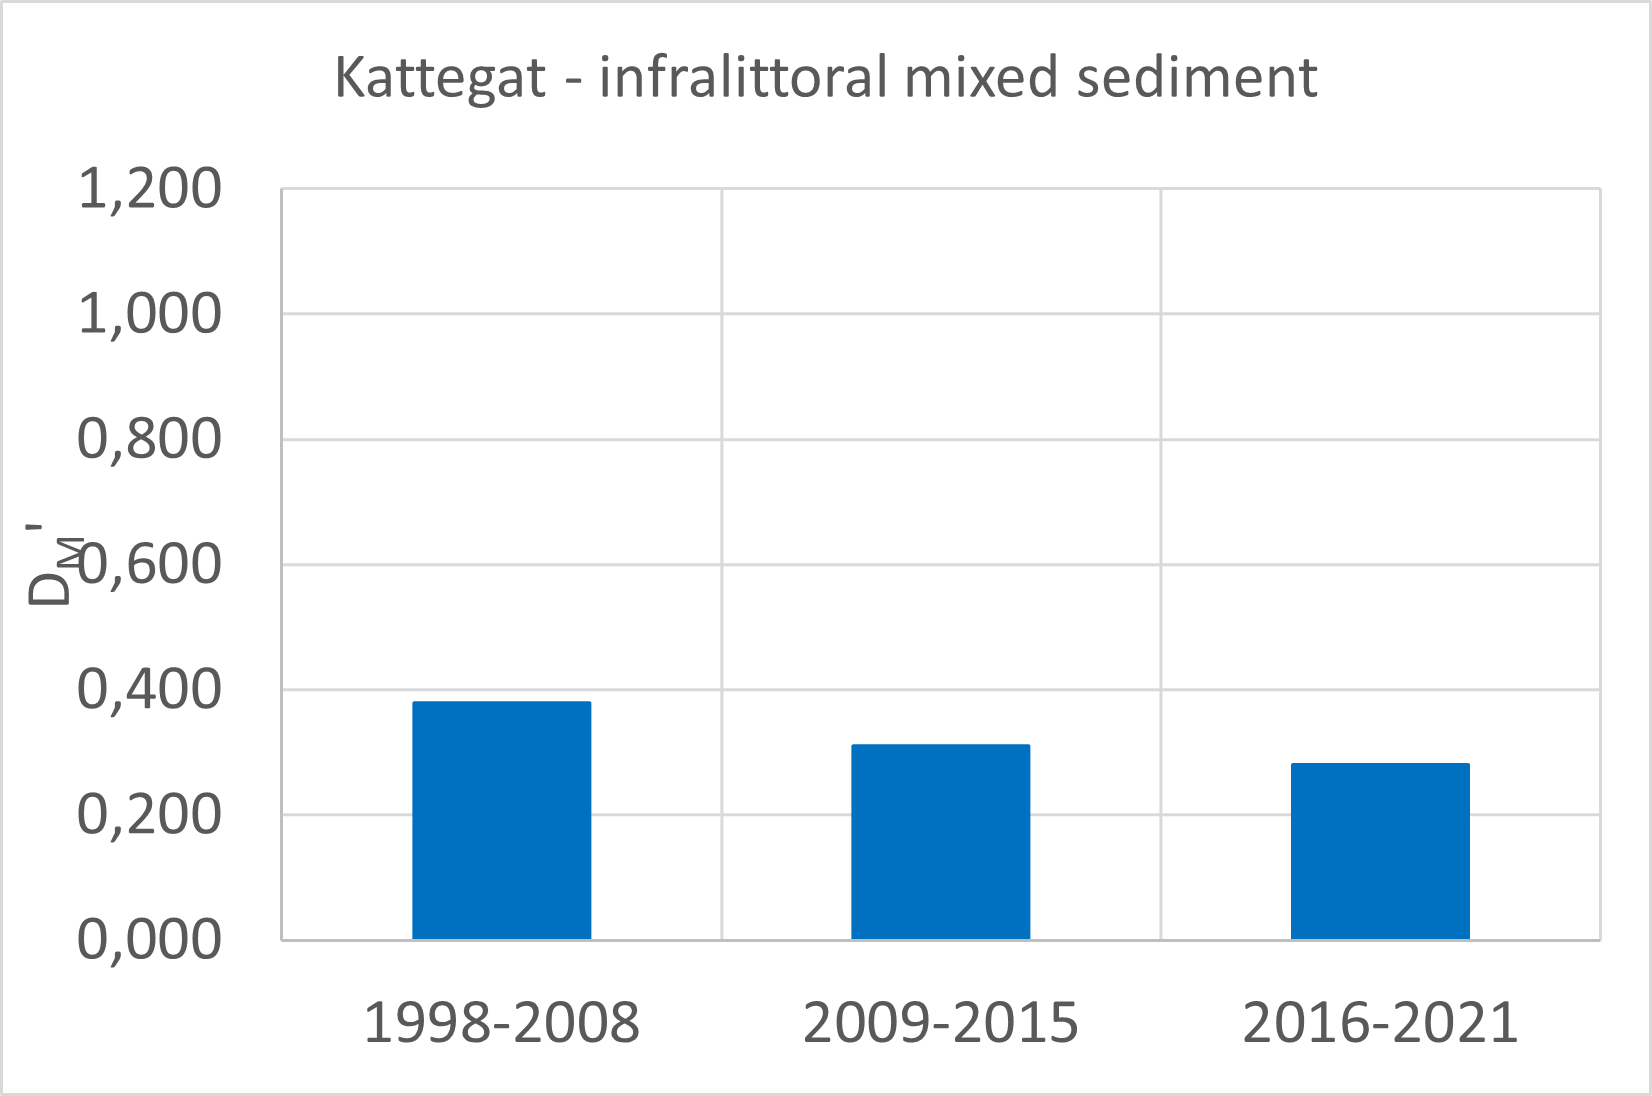
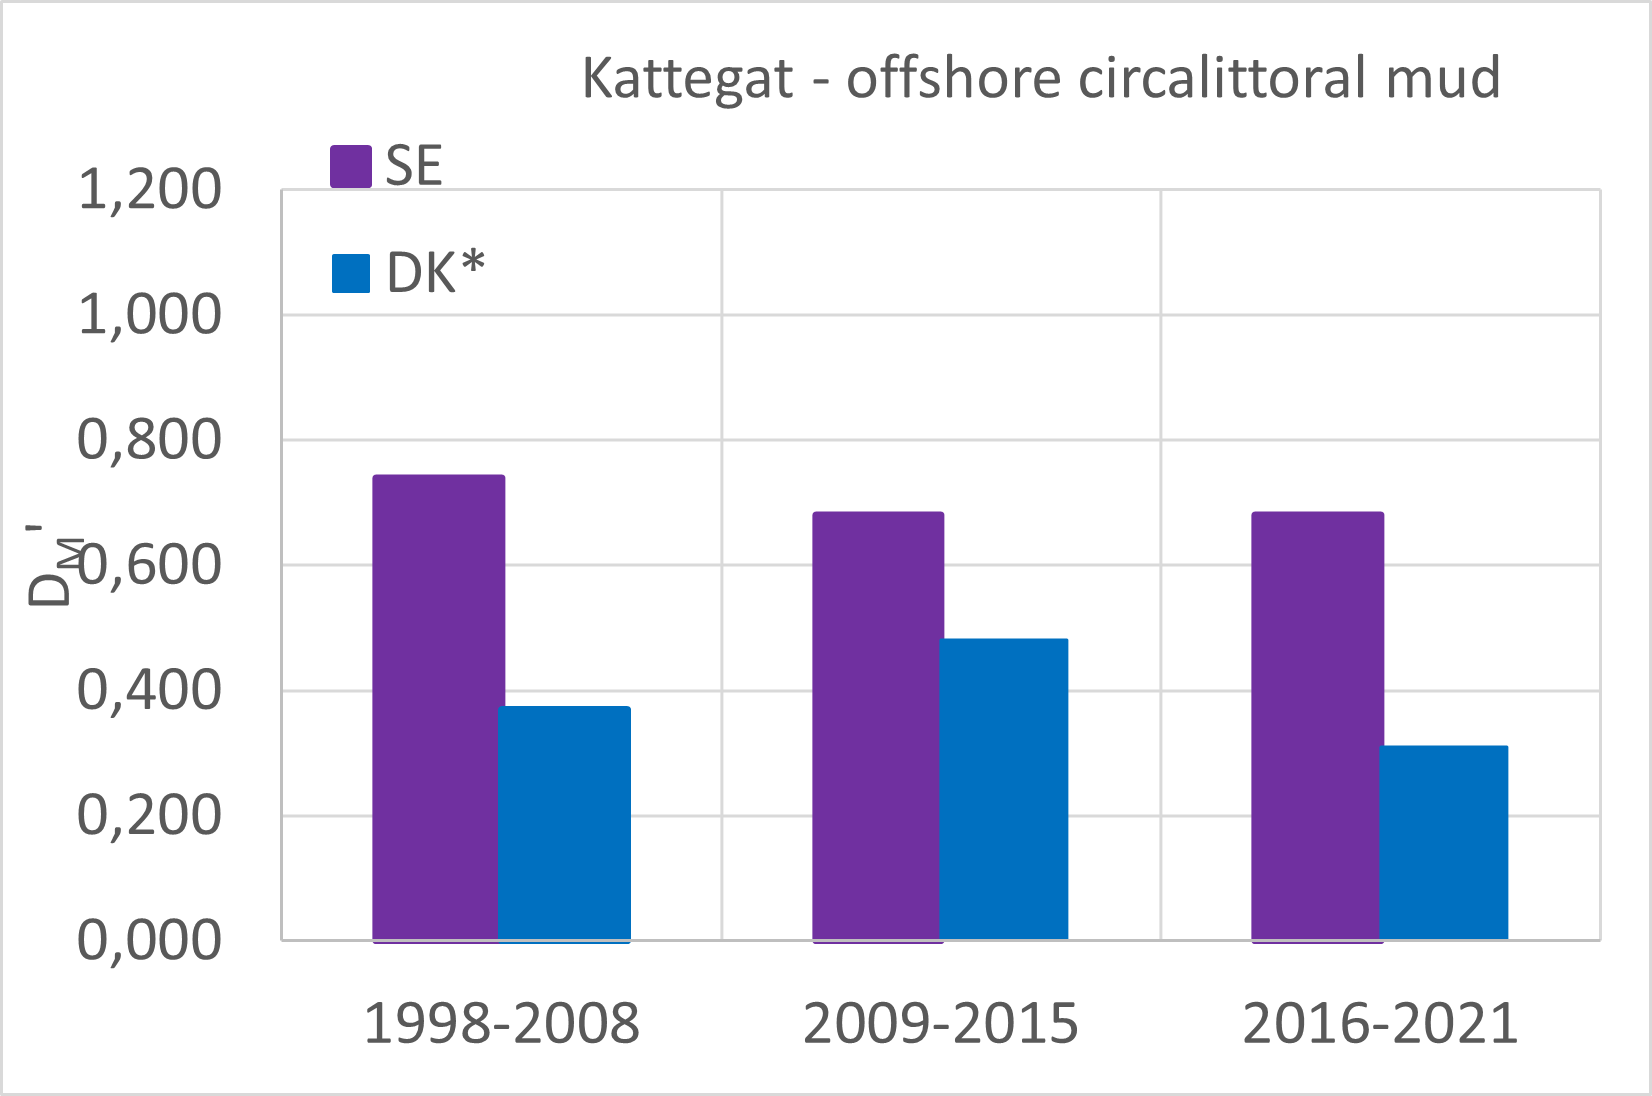
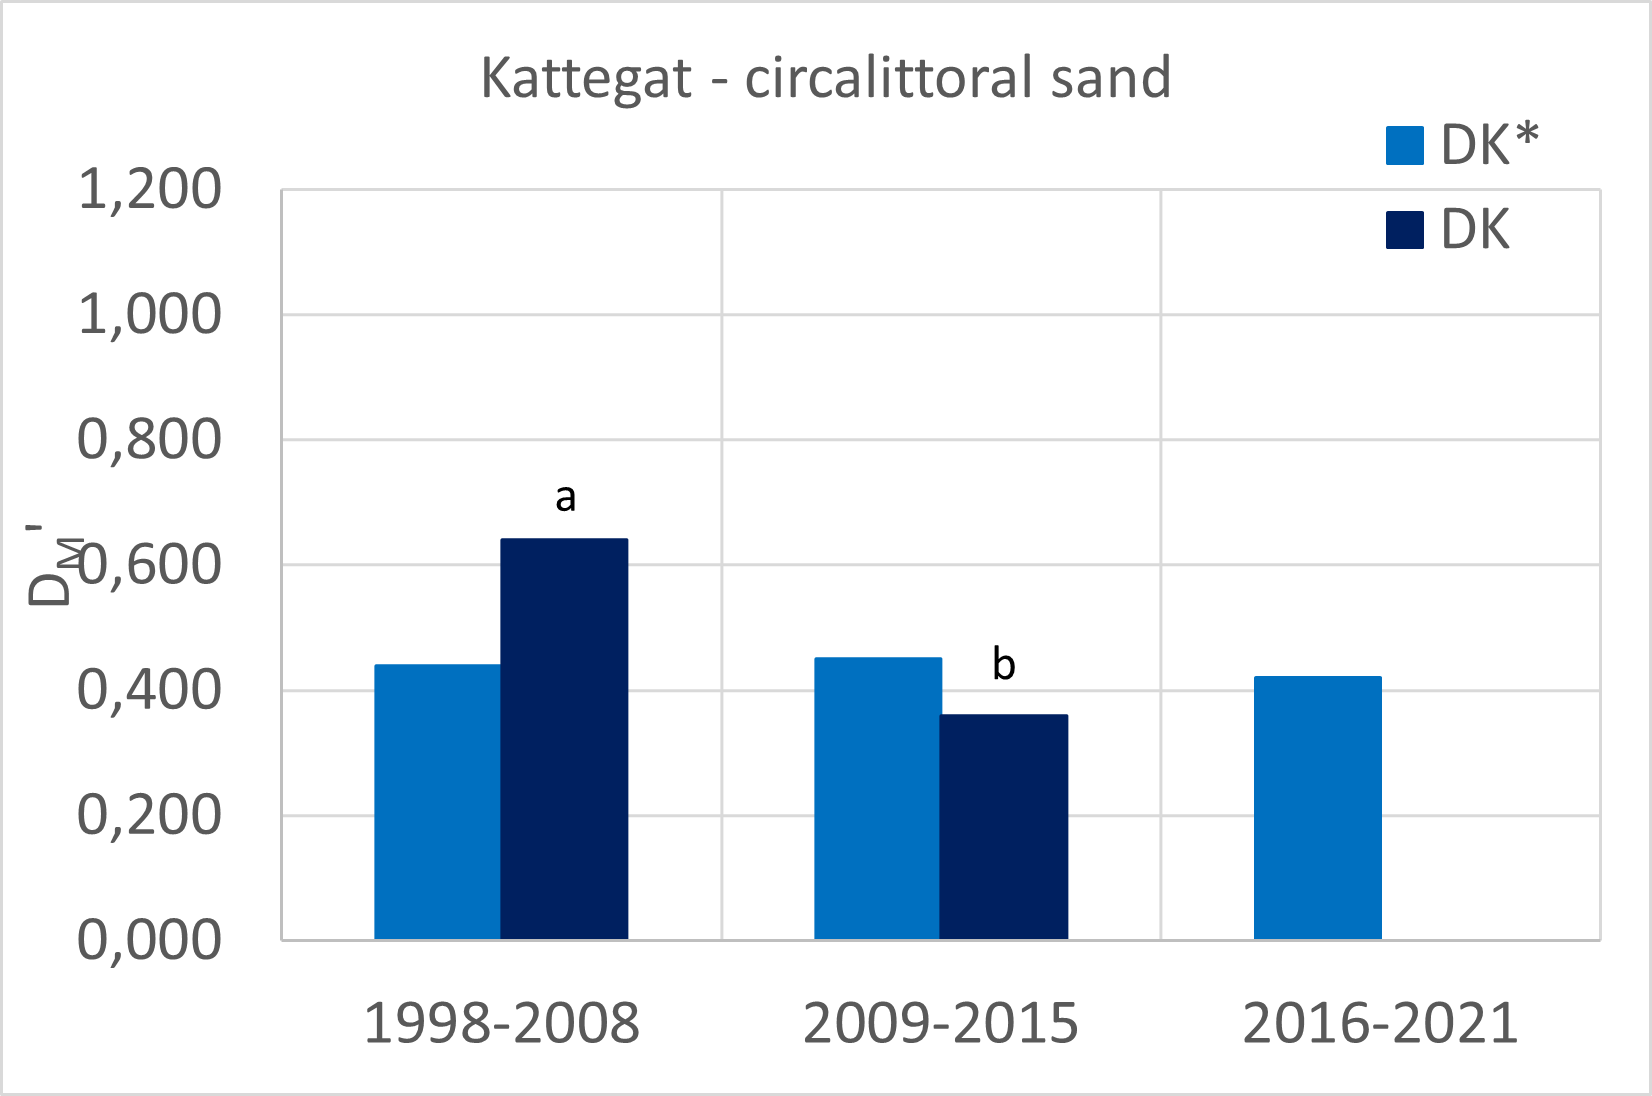
In the Kattegat a significant decrease in relative diversity is observed for most (not significant for mixed sediment) of the infralittoral BHTs at least based on the Danish small core data only deviating in the timing of the decline. It should be noted that it is unlikely that small cores are frequently used on coarse - and mixed sediment types so there might be some uncertainty about whether broad scale habitat mapping (EUSeaMap, 2021) in these areas reflects the habitat constitution sufficiently in detail (as indicated before). On infralittoral sand the Danish grab-core samples show the same relative level of diversity as the small core samples. A decline in the relative diversity in sandy habitats in the circalittoral zone was observed based on Danish data. For muddy habitats in the circalittoral zone, a decline in relative diversity was observed based Swedish data while the Danish data showed a significant improvement between 1998-2008 and 2009-2015. A decrease of relative diversity in various infralittoral and circalittoral habitats in the Kattegat based on Danish data might suggest that patterns based on Swedish data as indicated before are not solely the effect of changes in the monitoring design. Besides increased fisheries pressures, changes in inflow from the Baltic could play a role. The question is whether such patterns are recurrent, and recovery of communities can be expected the coming years or whether salinity variability is increasing and extending over larger areas and might be related to climate change. In the offshore circalittoral zone of the Kattegat a significant decrease in relative diversity is observed in the Swedish part for mixed sediment habitat and for muddy habitat in the Danish part. Although the relative diversity based on small cores is generally somewhat smaller than based on grabs and cores, the difference in the case of offshore circalittoral mud is very large, suggesting that especially certain types of benthic fauna are in poor state.
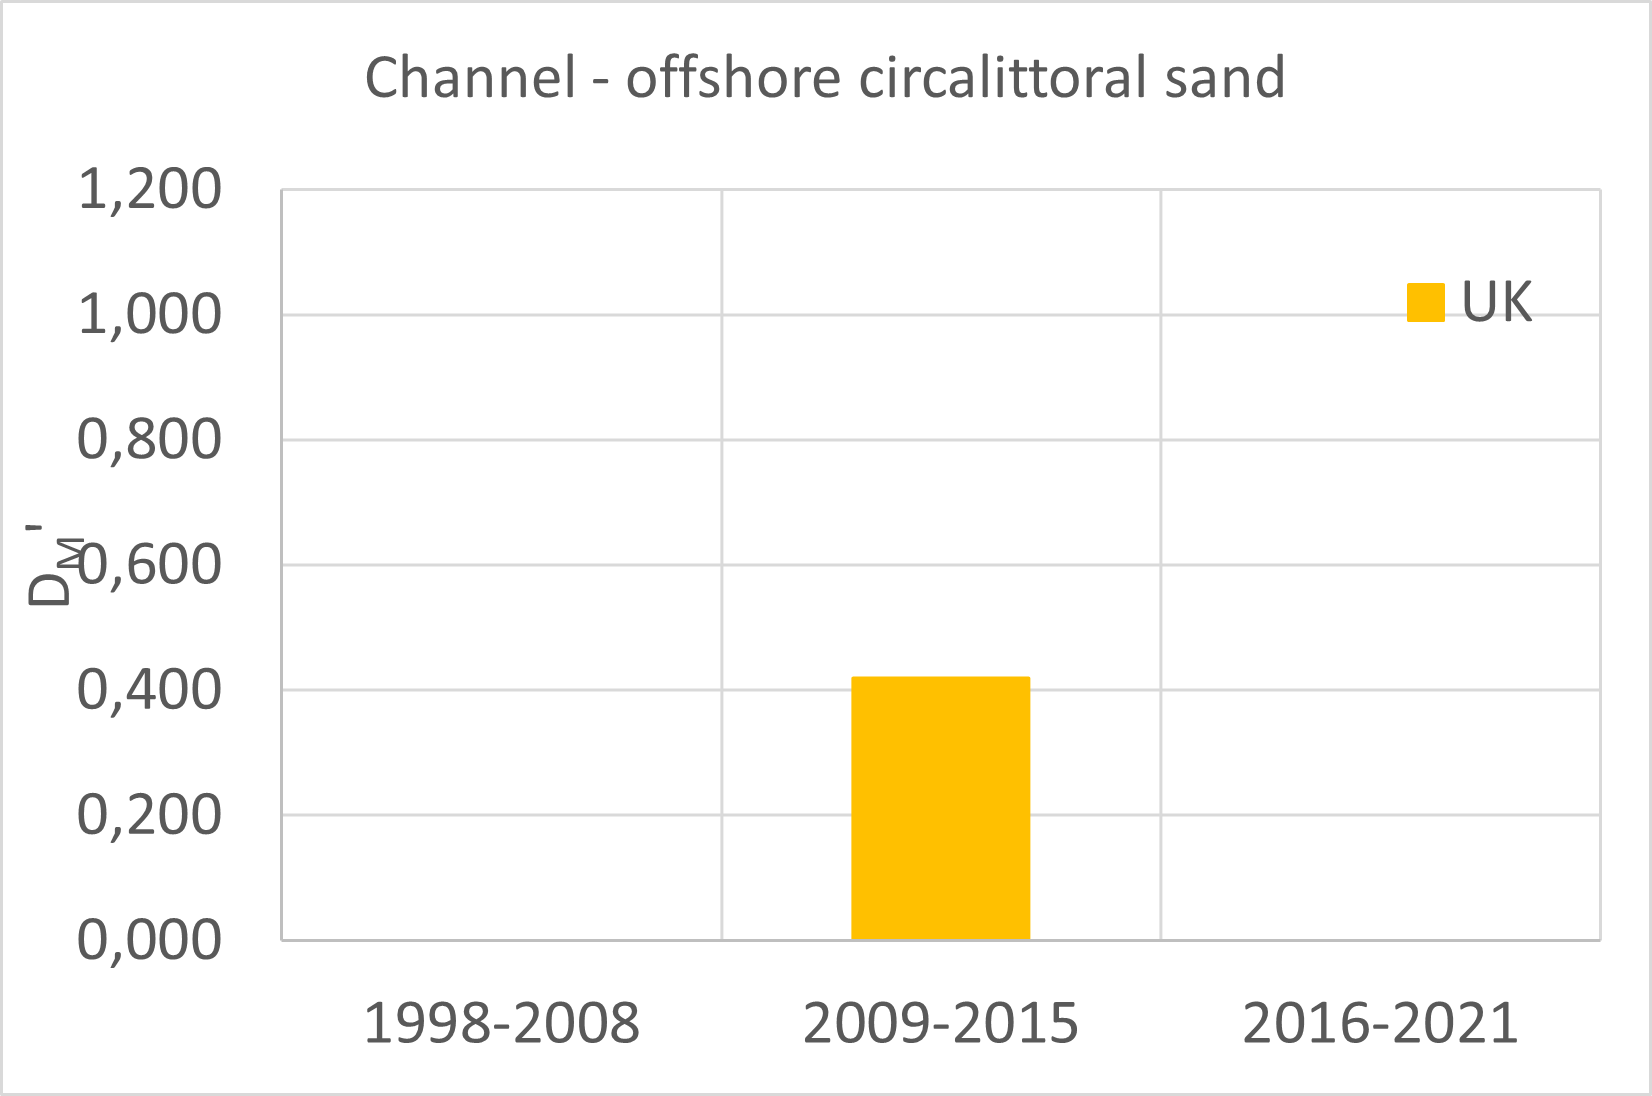
Channel and Norwegian Trench
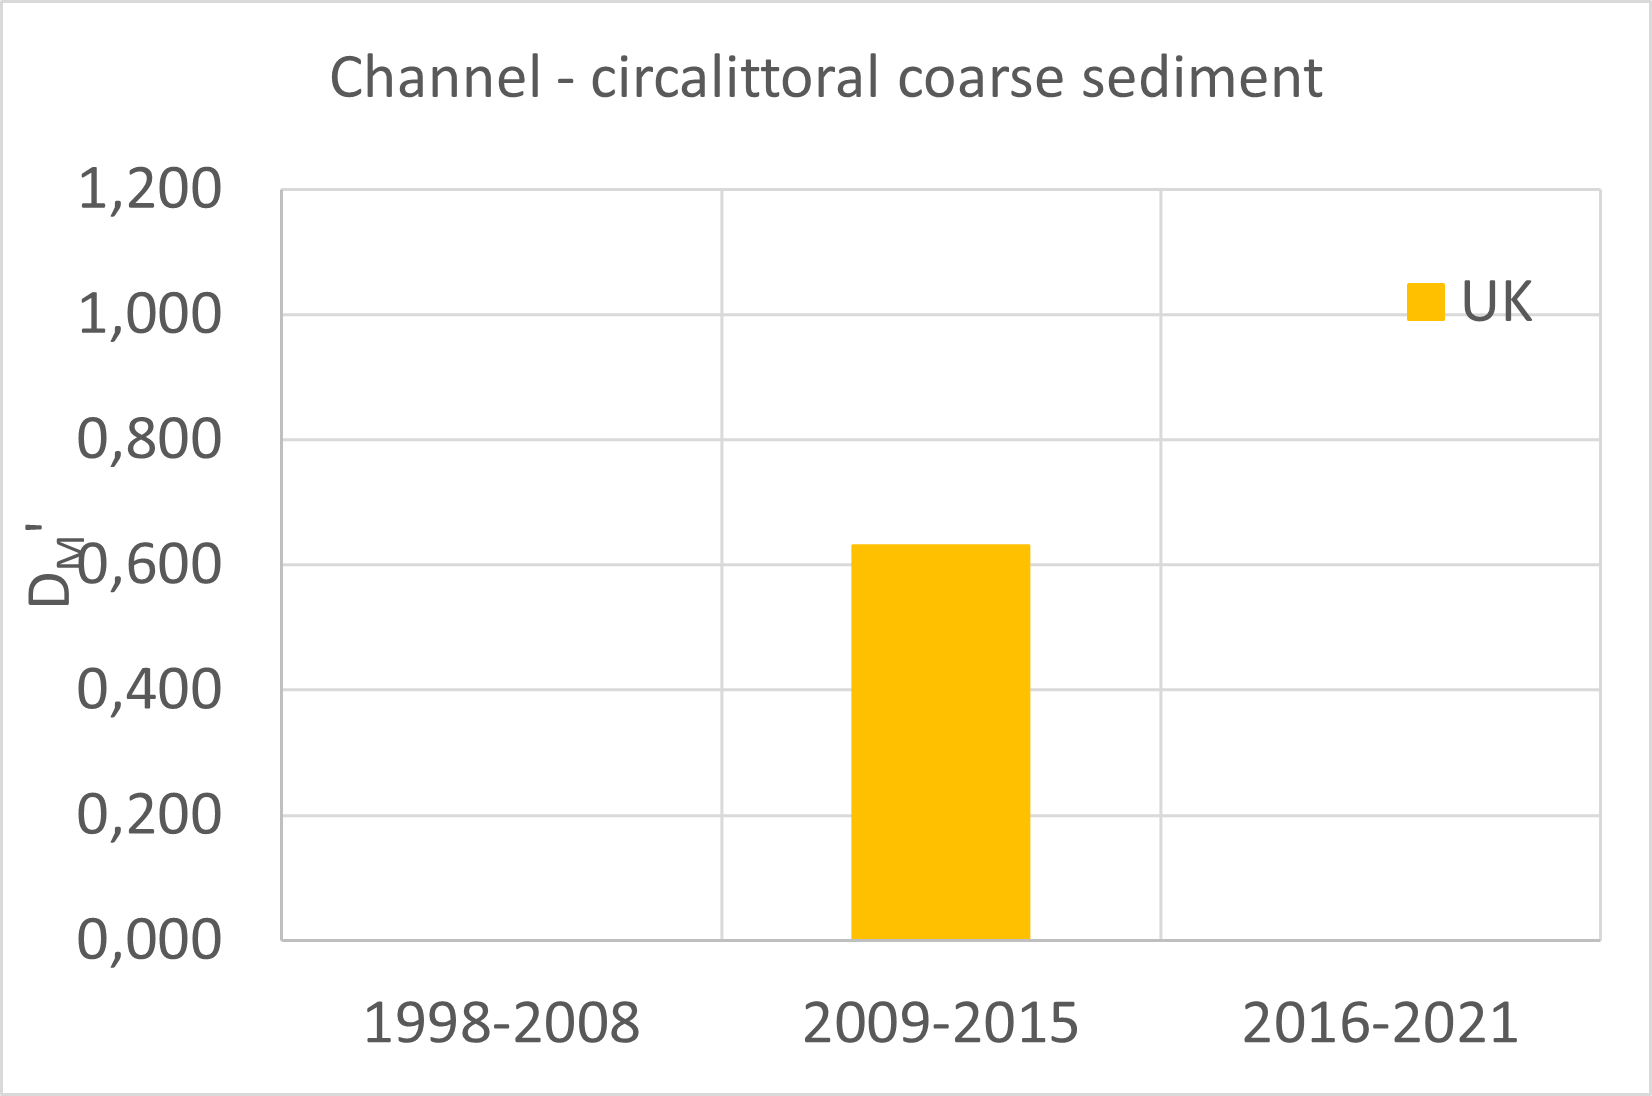
Results for the Channel are solely based on UK data and results for the Norwegian Trench are solely based on Swedish data, so patterns in and level of relative diversity for those countries in these subregions are the same as presented for the subregions.
Central North Sea - Quality status and development based on DM' per BHT per country
Southern North Sea - Quality status and development based on DM' per BHT per country
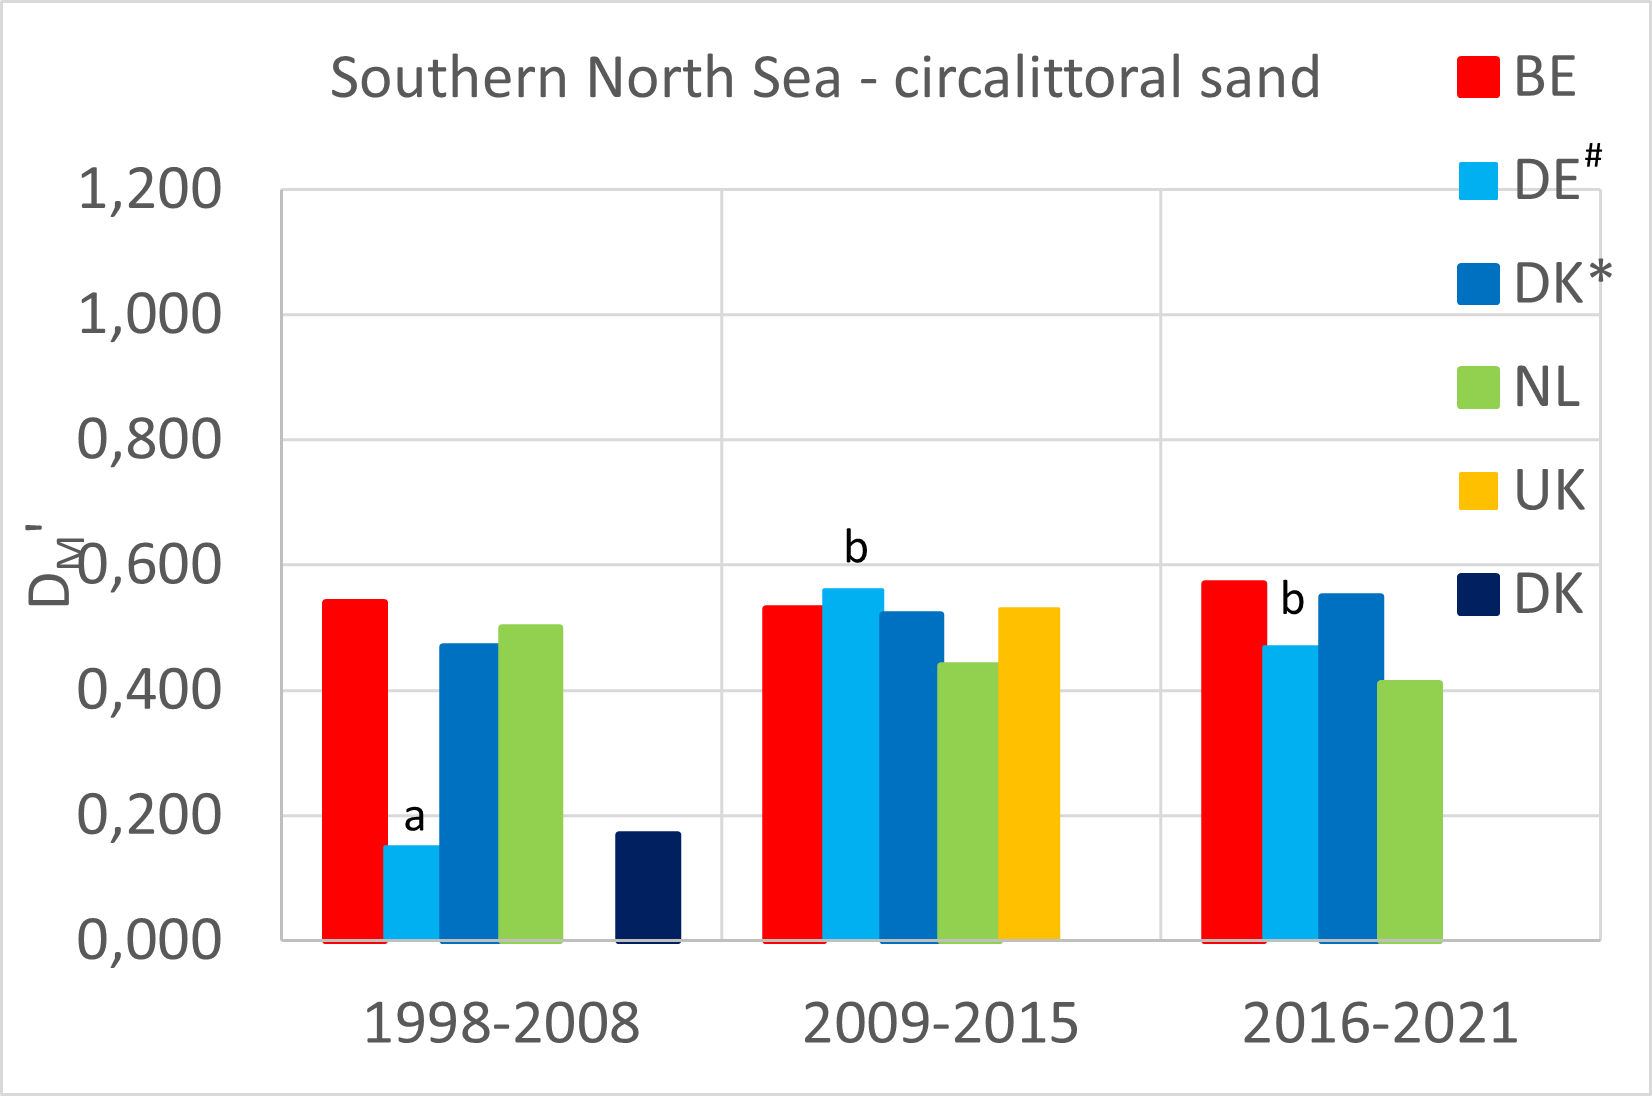
*it has been indicated by Germany that the monitoring for circalittoral sand in the Southern North Sea for the period 1998-2008 is not considered representative for the entire German part. Results should be handled with care.
Channel - Quality status and development based on DM' per BHT per country
Kattegat - Quality status and development based on DM' per BHT per country
Norwegian Trench - Quality status and development based on DM' per BHT per country
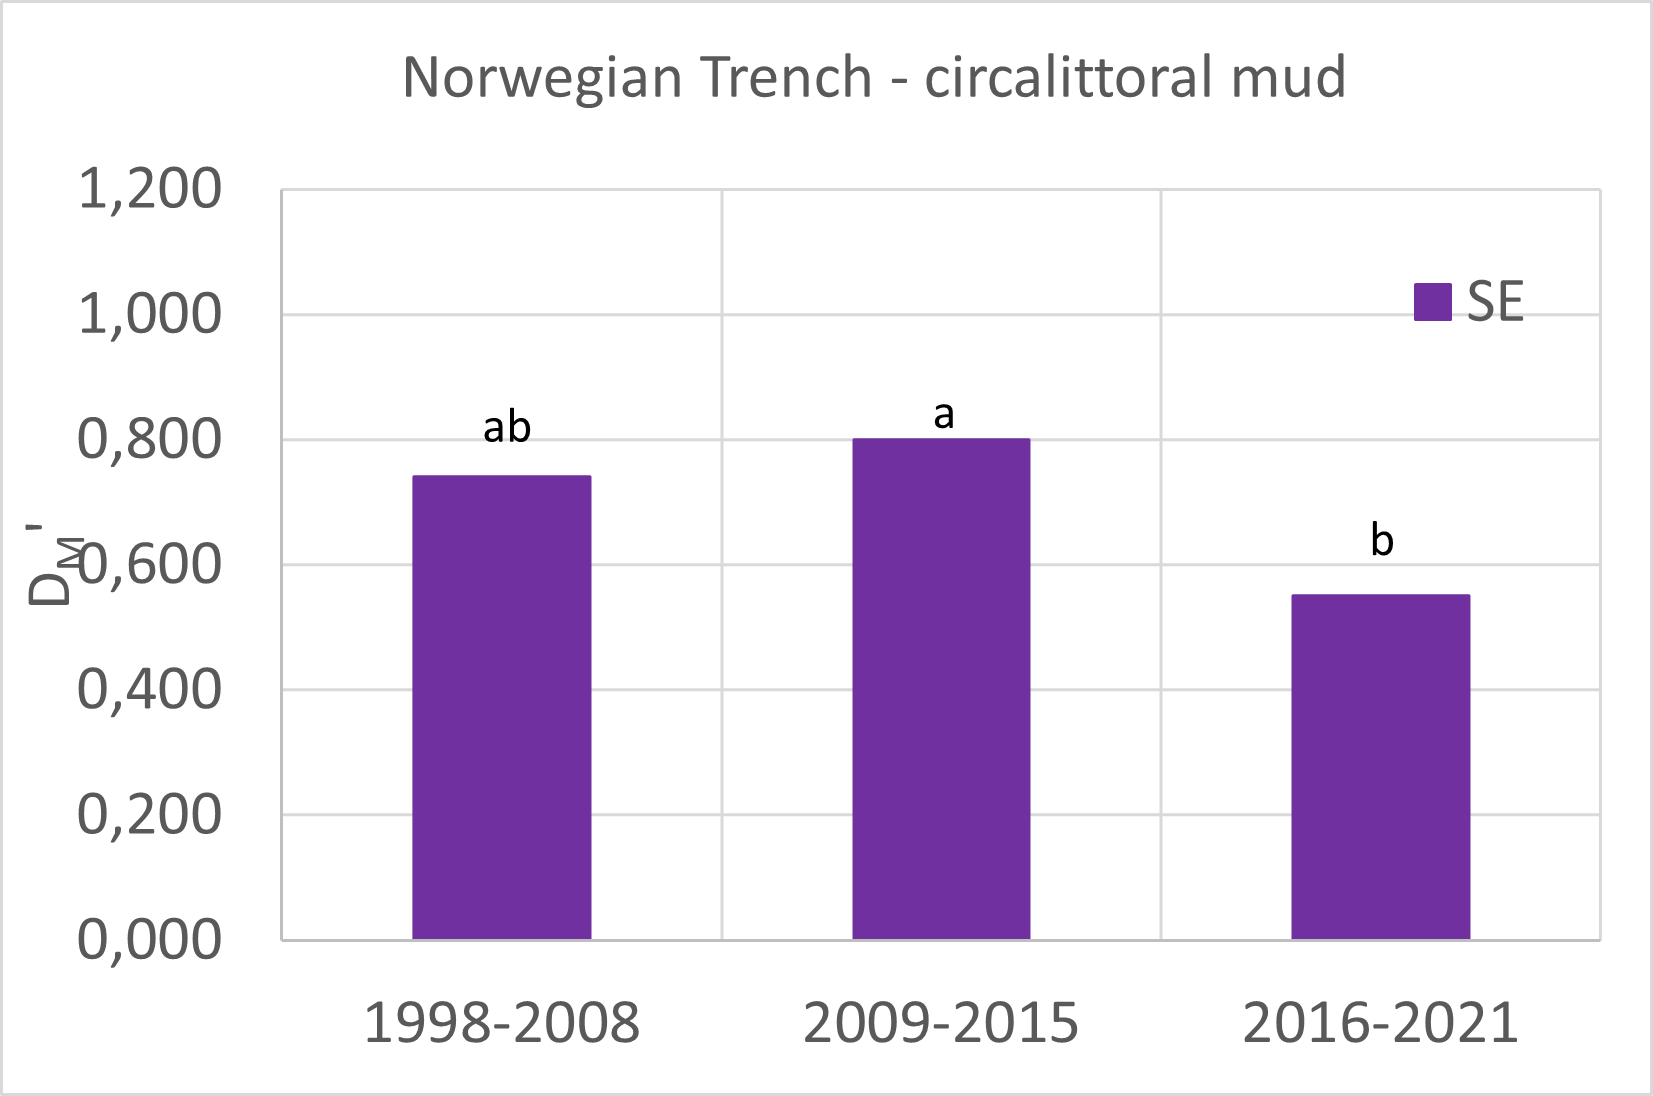
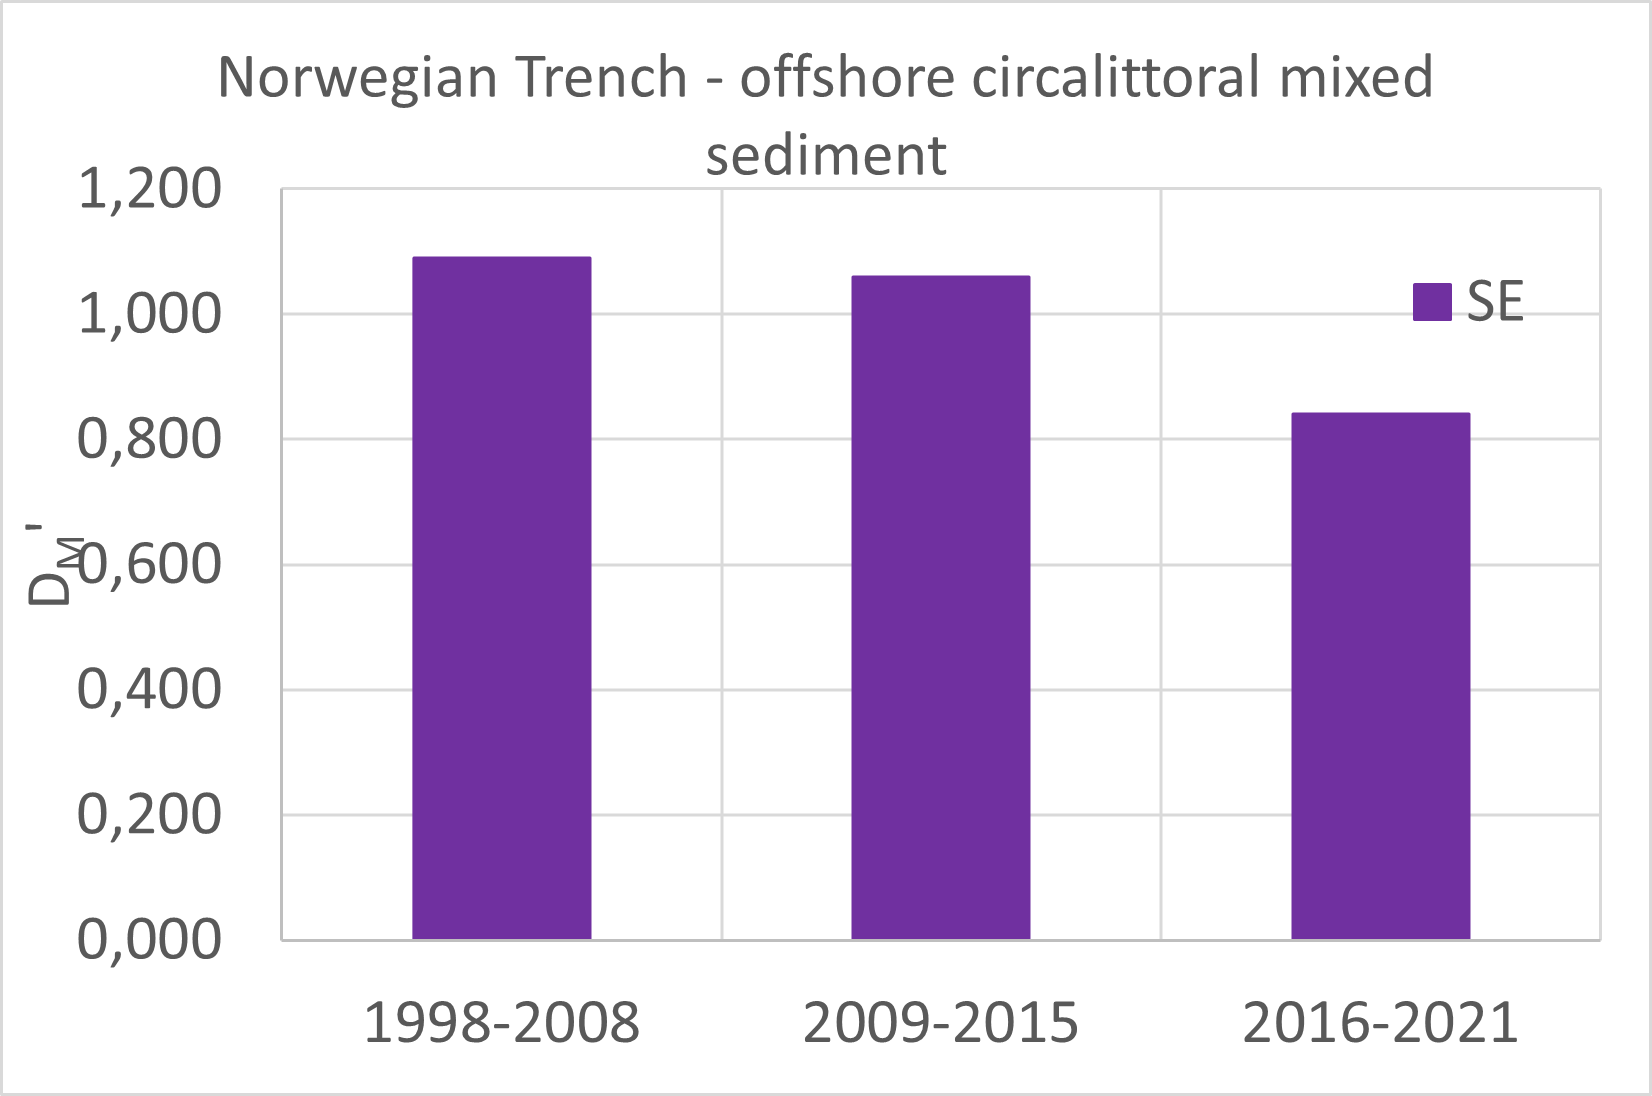
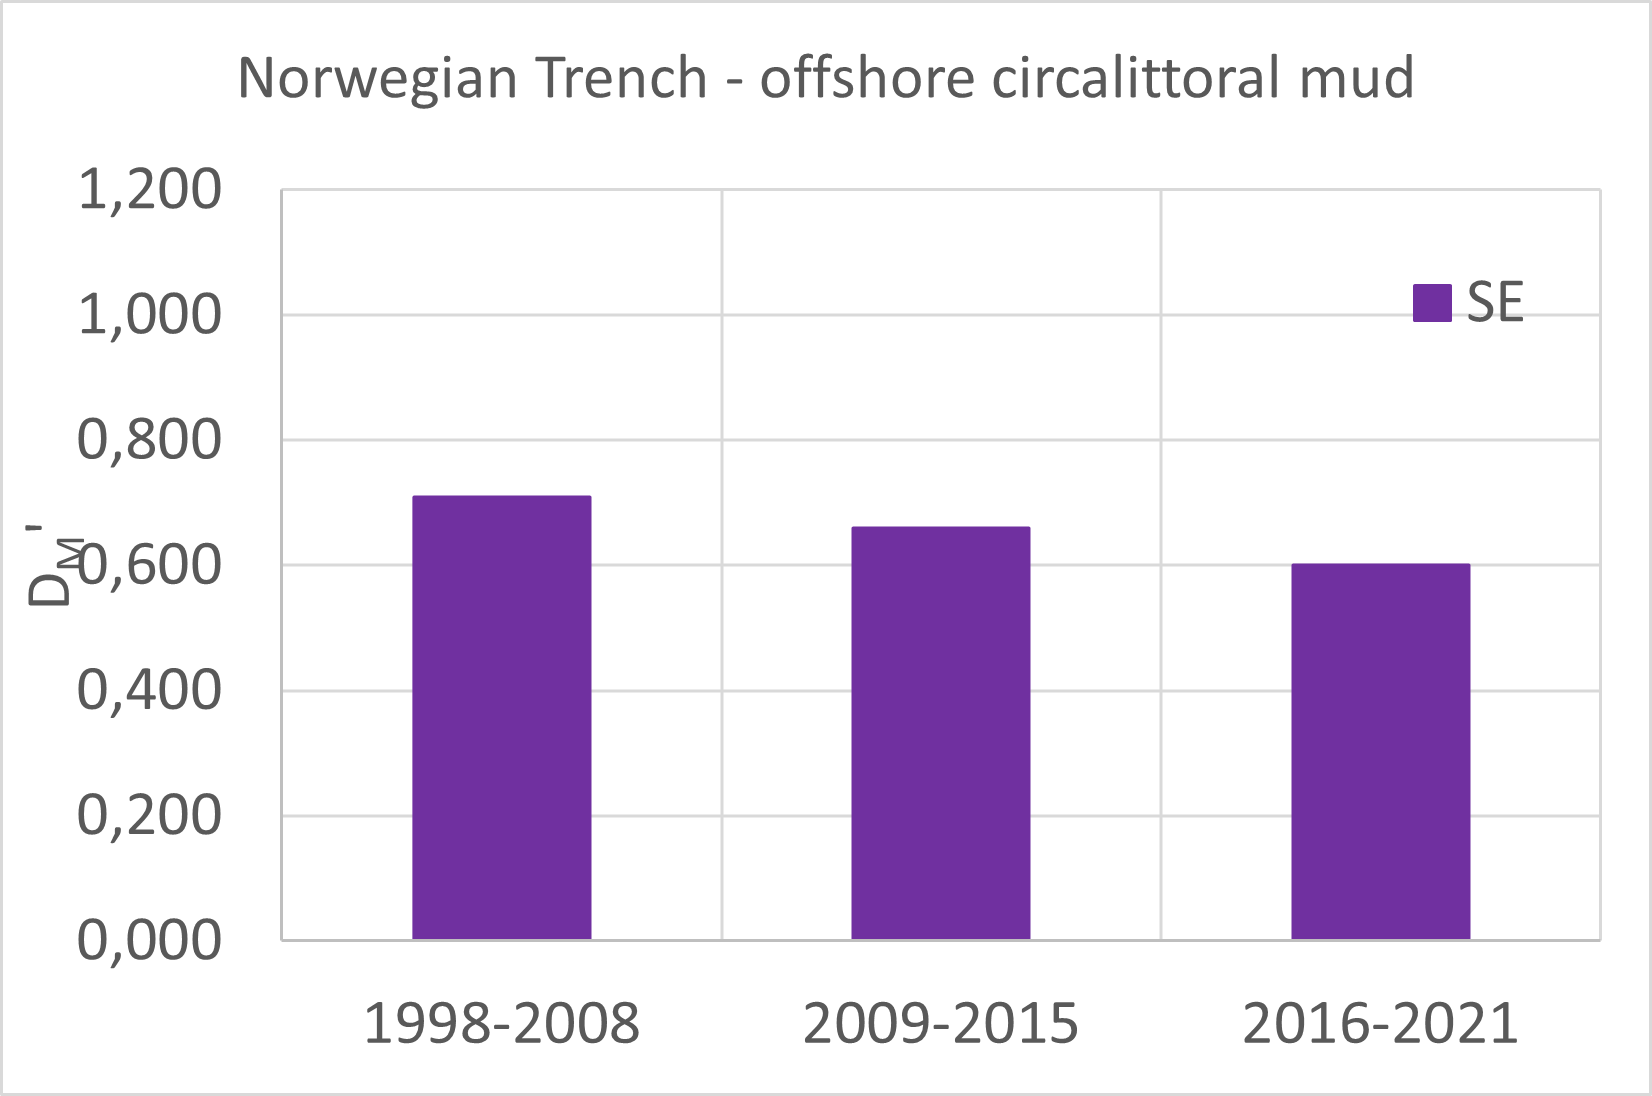
Figure b: Overview of median Relative Margalef diversity (DM’) per Broad Habitat Type (BHT) per Assessment Unit (AU) distinguishing individual countries comparing developments in time. Possible differences within countries between assessment periods (2016-2021, 2009-2015 and 1998-2008) are tested (at p<0,05) using t-tests, where significant differences are indicated with different characters (in case of one of the characters equal there is no significant difference). All results are based on ‘grab-core’ sampling, except for the results for DK* (Denmark with asterisk) which are based on ‘small core’ samples. Results are shown where available for Belgium (red), Germany (light blue), Denmark (small cores*; blue), Netherlands (light green), Sweden (purple), United Kingdom (orange), Denmark (grab-cores; dark blue). Only results for which the confidence of the assessment is considered at least sufficient (according to quality code Table b) are presented (except a few cases where data availability was low, however differences with the former period appeared to be significant; indicated as dashed bar without fill). It should be noted that these results suggest a (spatially) representative monitoring for the respective BHT x AU x country combination, which in fact is not necessarily the case
Reliability of reference values:
Absolute values of Relative Margalef diversity are to a certain extent determined by how accurately the reference value could be estimated. In case of presence of other pressures or ‘natural’ disturbances where low-pressure (solely based on physical disturbance by fisheries) situations were expected, the reference value can be underestimated (leading to overestimation of the Relative Margalef diversity). There might be some risk in cases where low-pressure situations are scarce and data availability for low-pressure situations is low. Where there is sufficient data, the use of percentiles will most likely filter out the potential effect of incorrectly including samples of disturbed communities to estimate the reference. In the case of low data availability (quality code 4 and 5 as indicated in Table b) the multivariate derivation of reference values is likely to result in increased uncertainty (but it seems to be the best approach).
Most reliable are comparisons of cases of the same kind, i.e., comparing assessment results for different periods, for which results are independent of used reference values. However, in that case differences in representativity of monitoring data might lead to uncertainty.
Conclusion
Relative diversity of benthic communities is higher in offshore circalittoral habitats compared to circalittoral and infralittoral habitats. The relative diversity still seems to be in a moderate or rather good state in offshore circalittoral habitats regardless of the expected relatively high fishing pressure. It should be noted that data from 2016-2021 are lacking for extensive areas, so that based on the impact assessments from BH3 a decrease in quality might be expected in the near future. It seems that recovery of benthic habitats in shallow coastal waters where fishing pressure is currently lower, is hampered by other pressures like eutrophication and diffuse pollution. The pattern is especially observed in the Southern - and possibly the Central North Sea. Besides 'diversity’ there are more aspects defining quality of benthic habitats. The shallow benthic habitats of the Kattegat appear to be in poor state; besides fisheries it is expected that increased variability of low salinity water inflow from the Baltic plays a role. In general, benthic habitat quality status might be better in the Channel (regardless of the high fishing pressure) and the Norwegian Trench. There and in Central North Sea, efforts to improve representativity of benthic community sampling programmes could improve reliability of assessments.
It can be concluded that in general there is room for improvement with regard to benthic diversity, as for most Broad Habitat Types (BHTs) current benthic diversity is not found to be relatively high, although there are subregional differences and some BHTs in general seem to be in a better-quality state.
An important observation is that in general offshore circalittoral habitat types seem to be in better condition as indicated by the Relative Margalef diversity than circalittoral and especially infralittoral habitat types. Overall infralittoral sand appears to be in the poorest quality state, but also infralittoral muddy and circalittoral sandy habitats are in poor quality state in most of the subregions. Independent of the subregion all offshore circalittoral habitat types for which data are available seem to harbour moderate to relatively high benthic diversity, except for the coarse sediment habitat in the Southern North Sea and the sandy habitat in the Channel.
The finding that offshore circalittoral habitats generally seem to be in better condition than circalittoral and infralittoral habitats as indicated by the Relative Margalef diversity levels is contrary to the expected impact of physical pressure due to fisheries as indicated by the results of BH3. It seems that regardless of the relative high fishing pressure, several BHTs at least still maintain relative high diversity, for the time being. It should, however, be noted that recent community observation data from the years 2016-2021 are lacking for extensive areas, so that benthic habitat quality reduction as a result of high fisheries impacts might indeed be expected in the near future. Although diversity can give an indication of the quality status and developments it should be noted that there are more aspects defining quality of benthic habitats. In particular, infralittoral but also circalittoral habitats might be impacted by the presence of nutrients and diffuse pollutants in the coastal zone. Although fisheries pressure is currently expected to be lower (see results BH3), nutrients and pollutants and indirect effects of turbidity, light conditions, and oxygen conditions, might hamper recovery of the benthic habitats. Additionally, at least in terms of diversity it seems that relatively high diverse communities can withstand a certain level of pressure before diversity collapses, whereas low diversity communities might need some time and substantially lower pressure levels to recover.
With regard to the Kattegat, where decreasing trends in relative diversity are observed that are not solely related to monitoring regimes, besides fisheries, increased variability in inflow of low salinity water from the Baltic might play a role particularly in shallow waters (infralittoral and circalittoral zone). This might be related to climate change.
For certain regions, like part of the Kattegat, the current assessments might be too strict in the sense that there are more gradients and pressures having impact on community diversity that should be integrated in reference estimation. In other subregions (e.g., parts of Central North Sea, Channel and Norwegian Trench) the fact that large parts are not covered by current monitoring raises the question as to what extent Relative Margalef diversity assessment results can be representative for Broad Habitat Types within entire subregions. More efforts should be put into large-scale representative monitoring. With further application and improvement of the assessment methodology it is foreseen that also other monitoring methodology results (e.g., from dredges, trawls or video recording) can be used in the future while maintaining comparability of assessment results.
Relative diversity (like several other indicators) is not solely the result of the dominant pressure of physical disturbance but can be influenced by various other pressures and ‘natural’ changes or variability. Therefore, quality status assessments on the basis of (for instance) Relative Margalef diversity should preferably be combined with pressure mapping for various pressures (e.g., BH3 and indicators related to other themes), quality assessment using alternative indicators (e.g., BH1) and indicators that can identify most probable disturbances at stake (e.g., proposed indicator BH6/BISI).
Knowledge Gaps
- Although the scale of relative diversity is defined, it is unclear where the threshold value for good quality status should be.
- It is difficult to estimate representativity of monitoring data for quality assessments at large Assessment Unit scale.
- There is a need to better identify the role of pressure impacts (other than physical disturbances by fisheries) and ‘natural’ disturbances as their impact on benthic habitat quality can also be substantial and should be considered in quality assessments like Relative Margalef diversity.
- Current broad-scale habitat mapping should be improved as classification should be scalable over the maps with different levels of detail.
Optimisation of standardisation to achieve comparability:
Community diversity is a proven and commonly used indicator for benthic habitat quality status. Relative Margalef diversity equals diversity compared to the case specific reference diversity to put assessments in perspective. Basically, the indicator allows comparison of any case (specific methodology, habitat, area) as long as there is sufficient standardisation and limited variability in the case due to classification, i.e., the use of broad classes. However, with large-scale application, combining data from different origins (various sampling laboratory and identification procedures) for broad habitats and extended subregions, internal variability is large. As long as there is no large-scale joint monitoring the challenge is how much variability can be allowed to still achieve largely comparable assessment results for cases. Splitting up methodologies, habitats, areas in many categories so that within category standardisation is large, will result in many assessments with poor data availability. It should be analysed what variability is still reasonable and results in limited deviations in the assessment results. Examples are sampled surface areas that can be combined and/or ecological relevant assessment units (are current assessment units with different types of abiotic gradients not too large for comparable assessments).
Related to this knowledge gap would be how to integrate known important environmental gradients with impact on diversity in the estimation of reference values; what does the use of reference value gradients determined on the basis of environmental gradients mean with regards to comparability of assessment results between different areas (BHTs and/or AUs).
Threshold values:
It is known that benthic community diversity to a certain extent is indicative for the benthic quality status. Moreover, as Relative Margalef diversity compared to reference diversity is used, a quality score on a relative common scale from 0-1 is achieved (occasional values above reference level are considered diversity equal to the reference). What exact value can be considered a threshold value for good quality status? How do Relative Margalef diversity results compare to other indicator assessment results in pressure gradients where, in certain cases, they can be considered as indicating good quality status and other cases not, knowing that each indicator has its own specificities and can be more indicative of this status under certain conditions than under others?
Role of other pressure impacts and natural disturbance:
The current assessment is almost entirely focused on physical disturbance by fisheries as the dominant pressure. Estimating the reference is entirely based on physical pressure mapping from fisheries, largely neglecting any other type of pressure and/or ‘natural’ variability that might occur. Although we do not disagree with the fact that, in many cases, physical disturbance is the dominant pressure, it is expected that many other variables and pressures can have a substantial impact on benthic diversity. Part of the variability is covered by using percentile values for references. However, there are clear examples of pressures like anoxic region, impacts from nutrients and pollutants, increased turbidity, changes in salinity conditions and/or hydrodynamic conditions. The question is what type of pressures and variability should be considered. It is clear that for BH2b, but also for other BH indicators, there should be more efforts in pressure mapping or integrating potential impacts of other pressures in assessment results.
Taking the variety of pressures into account, it should be investigated to what extent the Relative Margalef diversity responds to each of the pressures and whether one pressure impact might overrule the other. Some first indications of the response and sensitivity of the Relative Margalef diversity to different pressures is given by the ICES WKBENTH3 report (ICES, 2022) testing several indicators (amongst others the DM’) in pressure gradient. Although DM’ appeared to be sufficiently sensitive to fishing pressure gradients, it was not the most sensitive indicator. Indicator sensitivity might however also differ in different parts of the gradient. A large response could be expected in cases where there is some disturbance compared to cases where there is no disturbance. This is because indicators for typical species generally respond strongly in this part of the gradient or because they provide a better response in moderate to high disturbance settings, which is especially relevant in this current situation for a large part of the Greater North Sea Region. When analysing the pollution and eutrophication gradients, the Relative Margalef diversity index shows a consistent decline across all three gradients. This might indicate that the response to such gradients might be more consistent and/or overrule to a certain extent physical disturbance gradients in case of combi-pressure situations. It is a specific wish to include spatial distribution patterns with regards to other pressures in the future. Also including information about specific management of certain areas that might influence the representativity of benthic community samples for larger scale assessments is important as long as representative monitoring programmes covering the BHTs at the (country within) assessment unit scale are not present.
In general, future work should focus on an indicator framework covering the entire range of potential pressures and pressure combinations and levels, with general quality indicators, specific pressure indicators, indicators distinguishing most important pressures, combined pressure mapping and risk-based assessments taking pressure distributions and (specific pressure) sensitivity into account in impact assessment and upscaling of quality assessment results.
Broad Habitat Map:
At the moment different cut-off levels in mud content are used to distinguish the sandy from muddy habitat within EUNIS and the EUSeaMap. The EUSeaMap presenting EU MSFD broad habitat types distribution uses a cut-off level at 10% mud. This map has been used for current BH2b assessments (as recommended in OSPAR) as that enables the exchange of assessment results between OSPAR and EU MSFD reporting and is the suggested level of reporting within OSPAR. It appears however that the EUNIS classification uses a cut-off level at 20% mud at the various levels of habitat classification for the Greater North Sea Region. This leads to large areas with different classifications comparing the two map-types, and impact quality status assessment as well as uncertainty as to what extent communities match with the indicated sandy – or muddy habitat. Additionally, there is a large need for ground-truthing of modelled habitat classifications in certain areas.
EUSeaMap 2021. A European broad-scale seabed habitat map. EUSeaMap version 2021- Technical report https://archimer.ifremer.fr/doc/00723/83528/
Evans, D., Aish, A., Boon, A., Condé, S., Connor, D., Gelabert, E. Michez, N., Parry, M., Richard, D., Salvati, E. & Tunesi, L., 2016. Revising the marine section of the EUNIS Habitat classification - Report of a workshop held at the European Topic Centre on Biological Diversity, 12 & 13 May 2016. ETC/BD report to the EEA.
Hering, D., Feld, C.K., Moog, O., Ofenbock, T. (2006). Cook book for the development of a Multimetric Index for biological condition of aquatic ecosystems: experiences from the European AQEM and STAR. Hydrobiologia 566, 311–324.
ICES EUTRADE (2021). ICES data outputs of EU request on how management scenarios to reduce mobile bottom fishing disturbance on seafloor habitats affect fisheries landing and value. (https://doi.org/10.17895/ices.data.8192)
ICES WKBENT3 (2022). Report from workshop to evaluate proposed assessment methods and how to set thresholds for assessing adverse effects on seabed habitats (WKBENTH3). (In prep.).
OSPAR (2022). Common Biodiversity Indicators. Condition of benthic habitat communities (BH2). Generic guidelines for Coordinated Environmental Monitoring Programme (CEMP), Annex 3 Margalef diversity in region II (Greater North Sea).
SEABED_9-2022-03 (2022). Request to ICES on methods for assessing adverse effects on seabed habitats. Marine Strategy Framework Directive (MSFD) Common Implementation Strategy (CIS) Technical Group on seabed habitats and sea-floor integrity (TG Seabed) document SEABED_9-2022-03 (https://circabc.europa.eu/ui/group/326ae5ac-0419-4167-83ca-e3c210534a69/library/fd00dff6-f17e-47f5-88d3-e149403a7251/details).
Van Loon, W.M.G.M., Boon, A.R., Gittenberger, A., Walvoort, D.J.J., Lavaleye, M., Duineveld, G.C.A., Verschoor, A.J. (2015). Application of the Benthic Ecosystem Quality Index 2 to benthos in Dutch transitional and coastal waters. Journal of Sea Research, 103, 1-13, ISSN 1385-1101, (http://dx.doi.org/10.1016/j.seares.2015.05.002)
Van Loon, W.M.G.M., Walvoort, D.J.J, Van Hoey, G., Vina-Herbon, C., Blandon, A., Pesch, R., Schmidt, P., Scholle, J., Heyer, K., Lavaleye, M., Philips, G., Duineveld, G.C.A., Blomqvist, M. (2018). A regional benthic fauna assessment method for the Southern North Sea using Margalef diversity and reference value modelling. Ecological Indicators 89, 667-679.
Walvoort, D.W.W. & Van Loon, W.M.G.M. (2016). BENMMI user manual. http://publicaties.minienm.nl/documenten/user-manual-benmmi-3-0
Contributors
Lead authors: Sander Wijnhoven, Dennis Walvoort and Jos Schilder
Supported by: OSPAR Benthic Habitats Expert Group (OBHEG)
Citation
Wijnhoven, S., Walvoort, D. and Schilder, J. 2023. Condition of Benthic Habitat Communities: Margalef diversity in region II (Greater North Sea) In: OSPAR, 2023: The 2023 Quality Status Report for the North-East Atlantic. OSPAR Commission, London. Available at: https://oap.ospar.org/en/ospar-assessments/quality-status-reports/qsr-2023/indicator-assessments/condition-benthic-hab-margalef/
| Assessment type | Indicator Assessment |
|---|---|
| Summary Results | https://odims.ospar.org/en/submissions/ospar_cond_ben_habs_margrii_msf_2023_06_001/ |
| SDG Indicator | 14.2 By 2020, sustainably manage and protect marine and coastal ecosystems to avoid significant adverse impacts, including by strengthening their resilience, and take action for their restoration in order to achieve healthy and productive oceans |
| Thematic Activity | Biological Diversity and Ecosystems |
| Relevant OSPAR Documentation | Agreement 2018-06 CEMP Guideline: Common Biodiversity Indicators: Condition of benthic habitat communities (BH2) – common approach. |
| Date of publication | 2023-06-30 |
| Conditions applying to access and use | https://oap.ospar.org/en/data-policy/ |
| Data Snapshot | . |
| Data Results | https://odims.ospar.org/en/submissions/ospar_cond_ben_habs_margrii_dres_2023_06_001/ |