

Levels and trends in marine contaminants and their biological effects – CEMP Assessment report 2025
This report summarises the 2025 annual CEMP assessment of levels and trends of contaminants and their biological effects. The full assessment is available online in the OSPAR Hazardous Substances Assessment Tool (OHAT): https://dome.ices.dk/ohat/?assessmentperiod=2025.
There were 15897 time series (of three years or more) in biota, of which 10877 were assessed for trends, 10194 for environmental status and 3037 for human health status; 8335 time series in sediment, of which 3913 were assessed for trends and 6256 for status; and 1802 time series in water, of which 1329 were assessed for trends and 660 for status.
The 2025 annual CEMP assessment can be viewed on the OSPAR Hazardous Substances Assessment Tool (OHAT). It assessed 15897 time series (of three years or more) in biota, of which 10877 were assessed for trends, 10194 for environmental status and 3037 for human health status; 8335 time series in sediment, of which 3913 were assessed for trends and 6256 for status; and 1802 time series in water, of which 1329 were assessed for trends and 660 for status. Compared to the 2022 assessment (used for the QSR), the number of time series has increased by 6% for biota, 27% for sediment and 29% for water. A breakdown of trends and status by region and determinand is given in Appendix 1 Tables 1-7.
The assessment methodology is described in the help files on the OHAT and is essentially the same as that used for the 2024 assessment. The reference tables used in the 2025 assessment can be downloaded from ODIMS.
A first attempt was made to assess an integrated measure of per- and poly- fluorinated alkyl substances (PFAS) in biota and water. Specifically, the summed (PFOA equivalent) concentrations of 24 PFAS for which a Quality Standard has been proposed. Difficulties included the lack of and inconsistency in reporting codes and inconsistency in what is measured and reported by contracting parties. To illustrate, seven contracting parties have submitted a suite of PFAS measurements in biota, with the number of compounds ranging from 7 to 16. A compromise, based on availability and concentration profiles, was to assess PFAS using the summed (PFOA equivalent) concentrations of PFOS, PFNA, PFOA, PFDA, PFUnda and PFTrDA for biota and of PFOS, PFNA, PFOA, PFDA, PFHXS and PFHPA for water. For biota, this resulted in 14 time series, all of which had mean concentrations more than ten times greater than the proposed QS of 0.077 µg/kg (despite only representing six of the PFAS 24). For water, there were 18 stations with data (never sufficient to form a three-year time series), but although most measurements were below the limits of detection, the limits of detection were all higher than the proposed QS of 0.0044 µg/l.
Regional trends and environmental status were assessed for metals, polycyclic aromatic hydrocarbons, polychlorinated biphenyls, and polybrominated diphenyl ethers in biota and sediment, polycyclic aromatic hydrocarbon metabolites (PYR1OH) in fish, organotins in sediment, and imposex (VDS) in whelks. For biota, time series from mammals and birds were included in the regional trend assessments, but not in the regional status assessments as the comparability of thresholds for mammals and birds against those for fish and shellfish needs further investigation. Regional health status was assessed for metals, polycyclic aromatic hydrocarbons, polychlorinated biphenyls and polybrominated diphenyl ethers in biota. The results of the regional assessments are summarised in Appendix 1 Tables 8-12, with full details available on the OHAT.
The changes in regional environmental status since 2024 (Table 1) show a mixture of improvement and decline. The status of contaminants in sediment in the Iberian Coast has improved, but otherwise there is no obvious pattern to the changes. Regional status assessments were possible for the first time for imposex in the Greenland-Scotland Ridge, PBDEs in the Iberian Coast and mercury in the Gulf of Cadiz.
The biota and sediment CHASE scores are shown in Figures 1 and Figure 2 respectively. The scores for 2022-2024 are shown for comparison. There is little change for biota. For sediment, the CHASE scores for both the Northern North Sea and the Gulf of Cadiz have increased. In the Gulf of Cadiz, this is because the contaminant ratio for mercury was estimated from the available time series for the first time (see Table 1) and was higher than the imputed value used previously. The increase in the Northern North Sea reflects a similar increase in the Irish and Scottish West Coast in 2024 and is due to a change in analytical laboratory (see 2024 CEMP Assessment Report for more details).
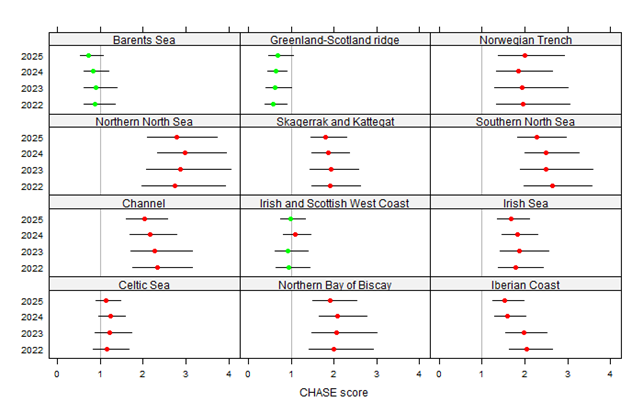
Figure 1: Biota CHASE scores with 95% confidence intervals for 2022–2025
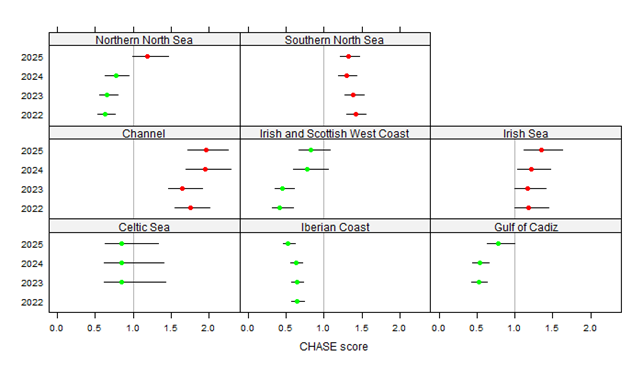
Figure 2: Sediment CHASE scores with 95% confidence intervals for 2022–2025
| Region | Subregion | Determinand (group) | 2024 | 2025 | |
|---|---|---|---|---|---|
| Biota | 2 | Barents Sea | Lead | orange | blue |
| Greenland-Scotland Ridge | Imposex | green | |||
| Norwegian Trench | CB118 | green | red | ||
| Skagerrak and Kattegat | Lead | blue | orange | ||
| Channel | Imposex | green | blue | ||
| Sediment | 2 | Northern North Sea | Cadmium | green | green |
| Northern North Sea | Mercury | green | red | ||
| Northern North Sea | Zinc | blue | green | ||
| Northern North Sea | Copper | blue | green | ||
| 4 | Iberian Coast | Mercury | green | blue | |
| Iberian Coast | PAHs | green | blue | ||
| Iberian Coast | PBDEs | blue | |||
| Gulf of Cadiz | Cadmium | blue | green | ||
| Gulf of Cadiz | Mercury | red |