

Marine Bird Abundance
D1 - Biological Diversity
D1.2 - Population size
Abundance of marine bird species assessed across the OSPAR Maritime Area has not been considered healthy since the mid-2000s. Species that use intertidal and inshore areas of the Greater North Sea during migration or over wintering are the exception, and have been present in healthy numbers since the early 1990s.
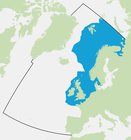
Area Assessed
Printable Summary
Background
Marine birds rely on a range of food sources in the marine environment. They are sensitive to a variety of pressures, including fishing, predation by non-indigenous mammals (e.g. rats and American mink), loss of habitat and changes in water quality.
Abundance (numbers of adult birds or pairs at breeding colonies) is used as an indicator because it is practical to measure, good for assessing long-term changes in community structure and because it changes slowly under natural conditions. Rapid changes in number can indicate human-induced impacts and, supported by species-specific assessment values for the extent of decline, can serve as a prompt for management action. Historic changes include many species having benefitted from food provided by the fishing industry through discards.
For seabirds, this assessment is constructed mainly from data on ‘breeding abundance’. For waterbirds (wildfowl and waders) this assessment is constructed mainly from data on ‘non-breeding abundance’ (numbers of birds using intertidal and inshore areas during migration or over winter). Annual estimates of breeding or non-breeding abundance of each are compared against assessment values that are designed to reflect the resilience of different species to population decline. It is desirable for the annual ‘relative abundance’ of a species to be above 0.8 (80% of the baseline) for species that lay one egg or 0.7 (70% of the baseline) for species that lay more than one egg. If 75% or more of species assessed exceed their individual assessment values, an assemblage of bird species is considered to be healthy.
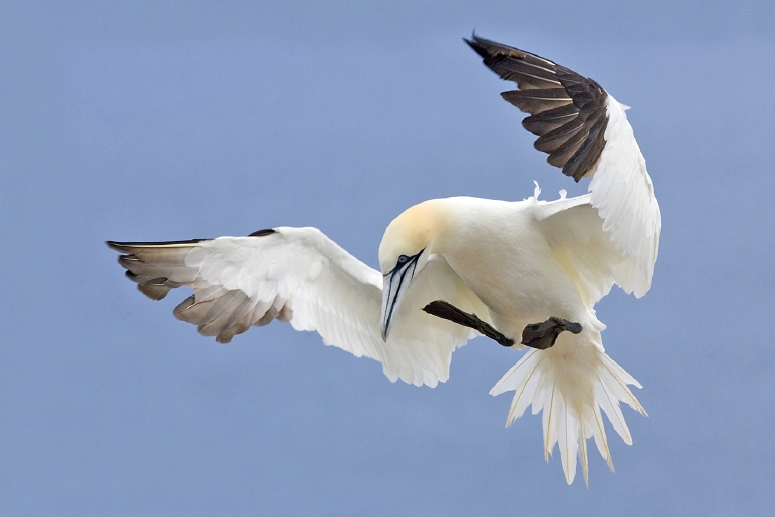
Northern Gannet (Morus bassanus) (courtesy of Alan D Wilson)
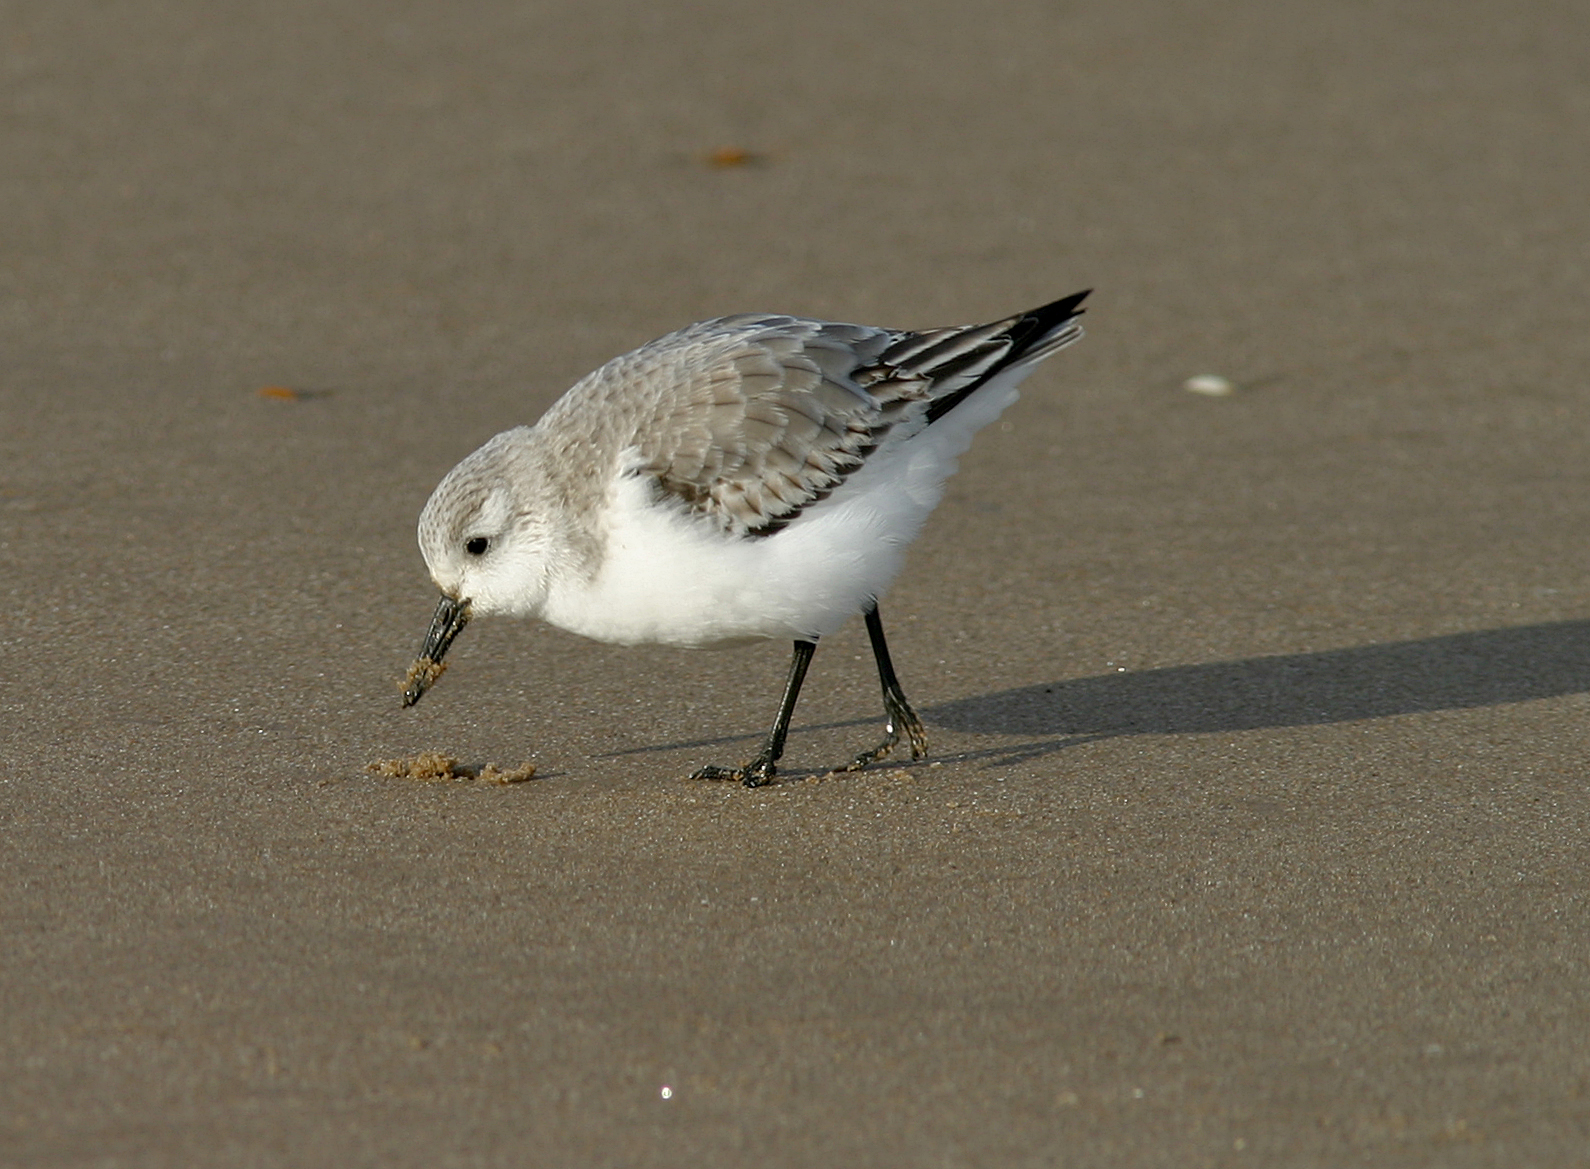
Sanderling (courtesy of A. Downie)
This indicator includes information on marine bird species that, at some point in their annual life cycle, are reliant on coastal and / or offshore marine areas. The indicator is constructed from species-specific trends in annual abundance and includes:
- Breeding abundance: estimated from counts of adult birds or pairs on land at breeding colonies or sites, nesting close to the coast, and using the marine environment (e.g. for food); and
- Non-breeding abundance: estimated from counts of adult birds in intertidal areas or close to the shore and counted from land or from the air during migration or over the winter.
Abundance indicators could also be constructed from time series data collected at sea, but few data were available to be able to do so on this occasion.
In this context, marine birds include the following taxonomic groups that are commonly aggregated as waterbirds and seabirds:
- Waterbirds: shorebirds (Charadriiformes); ducks, geese and swans (Anseriformes); divers (Gaviiformes); and grebes (Podicipediformes); and
- Seabirds: petrels and shearwaters (Procellariiformes); gannets and cormorants (Suliformes); skuas, gulls, terns and auks (Charadriiformes).
Shorebirds, some duck species and some gulls feed on benthic invertebrates in soft intertidal sediments and on rocky shores. Geese graze on exposed eelgrass beds (Zostera spp.) as well as coastal marshes. Diving duck species feed on invertebrate benthos in shallow inshore waters. All other marine birds, including some gulls, spend the majority of their lives at sea, feeding on prey living within the water column (i.e. plankton, fish and squid) or picking detritus from the sea surface. Divers, piscivorous ducks, grebes, cormorants, gulls and terns tend to be confined to inshore waters, whereas petrels, shearwaters, gannets, skuas and auks venture further offshore and beyond the shelf break.
Most seabirds are assessed using breeding abundance, because they are easier to count when they aggregate on land to breed than when they are dispersed at sea over large areas. Most waterbirds are assessed using non-breeding abundance, because they are much easier to count when they are migrating or during the winter when they aggregate in intertidal and inshore areas. Waterbirds tend to be more difficult to count during the breeding season, because most species do not tend to breed colonially and nesting pairs are distributed over large areas. Many waterbird species in this assessment breed inland and in areas outside the OSPAR Maritime Area.
The assessment values used in this indicator assessment were developed for breeding seabirds’ abundance data in order to assess the OSPAR Ecological Quality Objective (EcoQO) on seabird population trends as an index of seabird community health (ICES, 2008, 2010, 2011, 2012). This indictor supersedes the EcoQO as it incorporates data on more species, including waterbirds and also uses data on non-breeding abundance. This indicator has gone through extensive testing and development (see ICES, 2013a,b,c,d, 2015). OSPAR IA2017 indicator assessment values are not to be considered as equivalent to proposed European Union Marine Strategy Framework Directive (MSFD) criteria threshold values, however they can be used for the purposes of their MSFD obligations by those Contracting Parties that wish to do so.
This indicator has relevance for two seabird species included in the OSPAR List of threatened and/or declining species and habitats (OSPAR Agreement 2008-6): black-legged kittiwake (Rissa tridactyla) and roseate tern (Sterna dougallii). It may also include the fuscus sub-species of lesser black-backed gull Larus fuscus fuscus, in the assessment of the Norwegian Sea and the Barents Sea. The OSPAR List was developed on the basis of the Texel-Faial criteria for identifying species and habitats in need of protection (OSPAR Agreement 2003-13). Assessments of abundance distribution and condition of the seabird species on the OSPAR List were prepared for the Quality Status Report 2010 and are included in its supporting documentation, but no comparable quantitative assessment was prepared.
Overview
This indicator assessment begins by constructing a time series of annual estimates of ‘relative breeding abundance’ or ‘relative non-breeding abundance’ of each species in each OSPAR Region or sub-division thereof (see section on Spatial Aggregation and Figure a). For the majority of species, data are available for breeding abundance or non-breeding abundance; both are available for only five species in the Arctic Waters, 14 species in the Greater North Sea and just one species in the Celtic Seas. Relative abundance is the number of adult birds or breeding pairs estimated each year as a proportion of a baseline (see section below on parameter/metric). Each species-specific estimate of annual relative abundance is compared against an assessment value. This indicator assessment is based on the proportion of species in a region or sub-division of that region that have exceeded assessment values for relative abundance in the most recent year of the time series. Separate assessments were carried out for relative breeding abundance and relative non-breeding abundance.
This indicator assessment is confined to three OSPAR Regions: Arctic Waters, the Greater North Sea and the Celtic Seas. The assessment of Arctic Waters is based on data from Norway only, but includes both breeding and non-breeding abundance data from both the Norwegian Sea and Barents Sea (excluding Jan Mayen and Svalbard). The assessment of the Greater North Sea includes both breeding and non-breeding abundance data from all Contracting Parties, except France. The assessment of the Celtic Seas is based on breeding abundance data from Ireland and the United Kingdom and on non-breeding abundance data from the United Kingdom only. No assessments were possible for the Bay of Biscay and Iberian Coast and for the Wider Atlantic because no data were provided to this assessment by France, Spain and Portugal.
Species-Specific Indicators of Relative Abundance
Data acquisition
In 2016, the following data were requested from Contracting Parties on counts of breeding and non-breeding adult birds collected during the period 1980–2015:
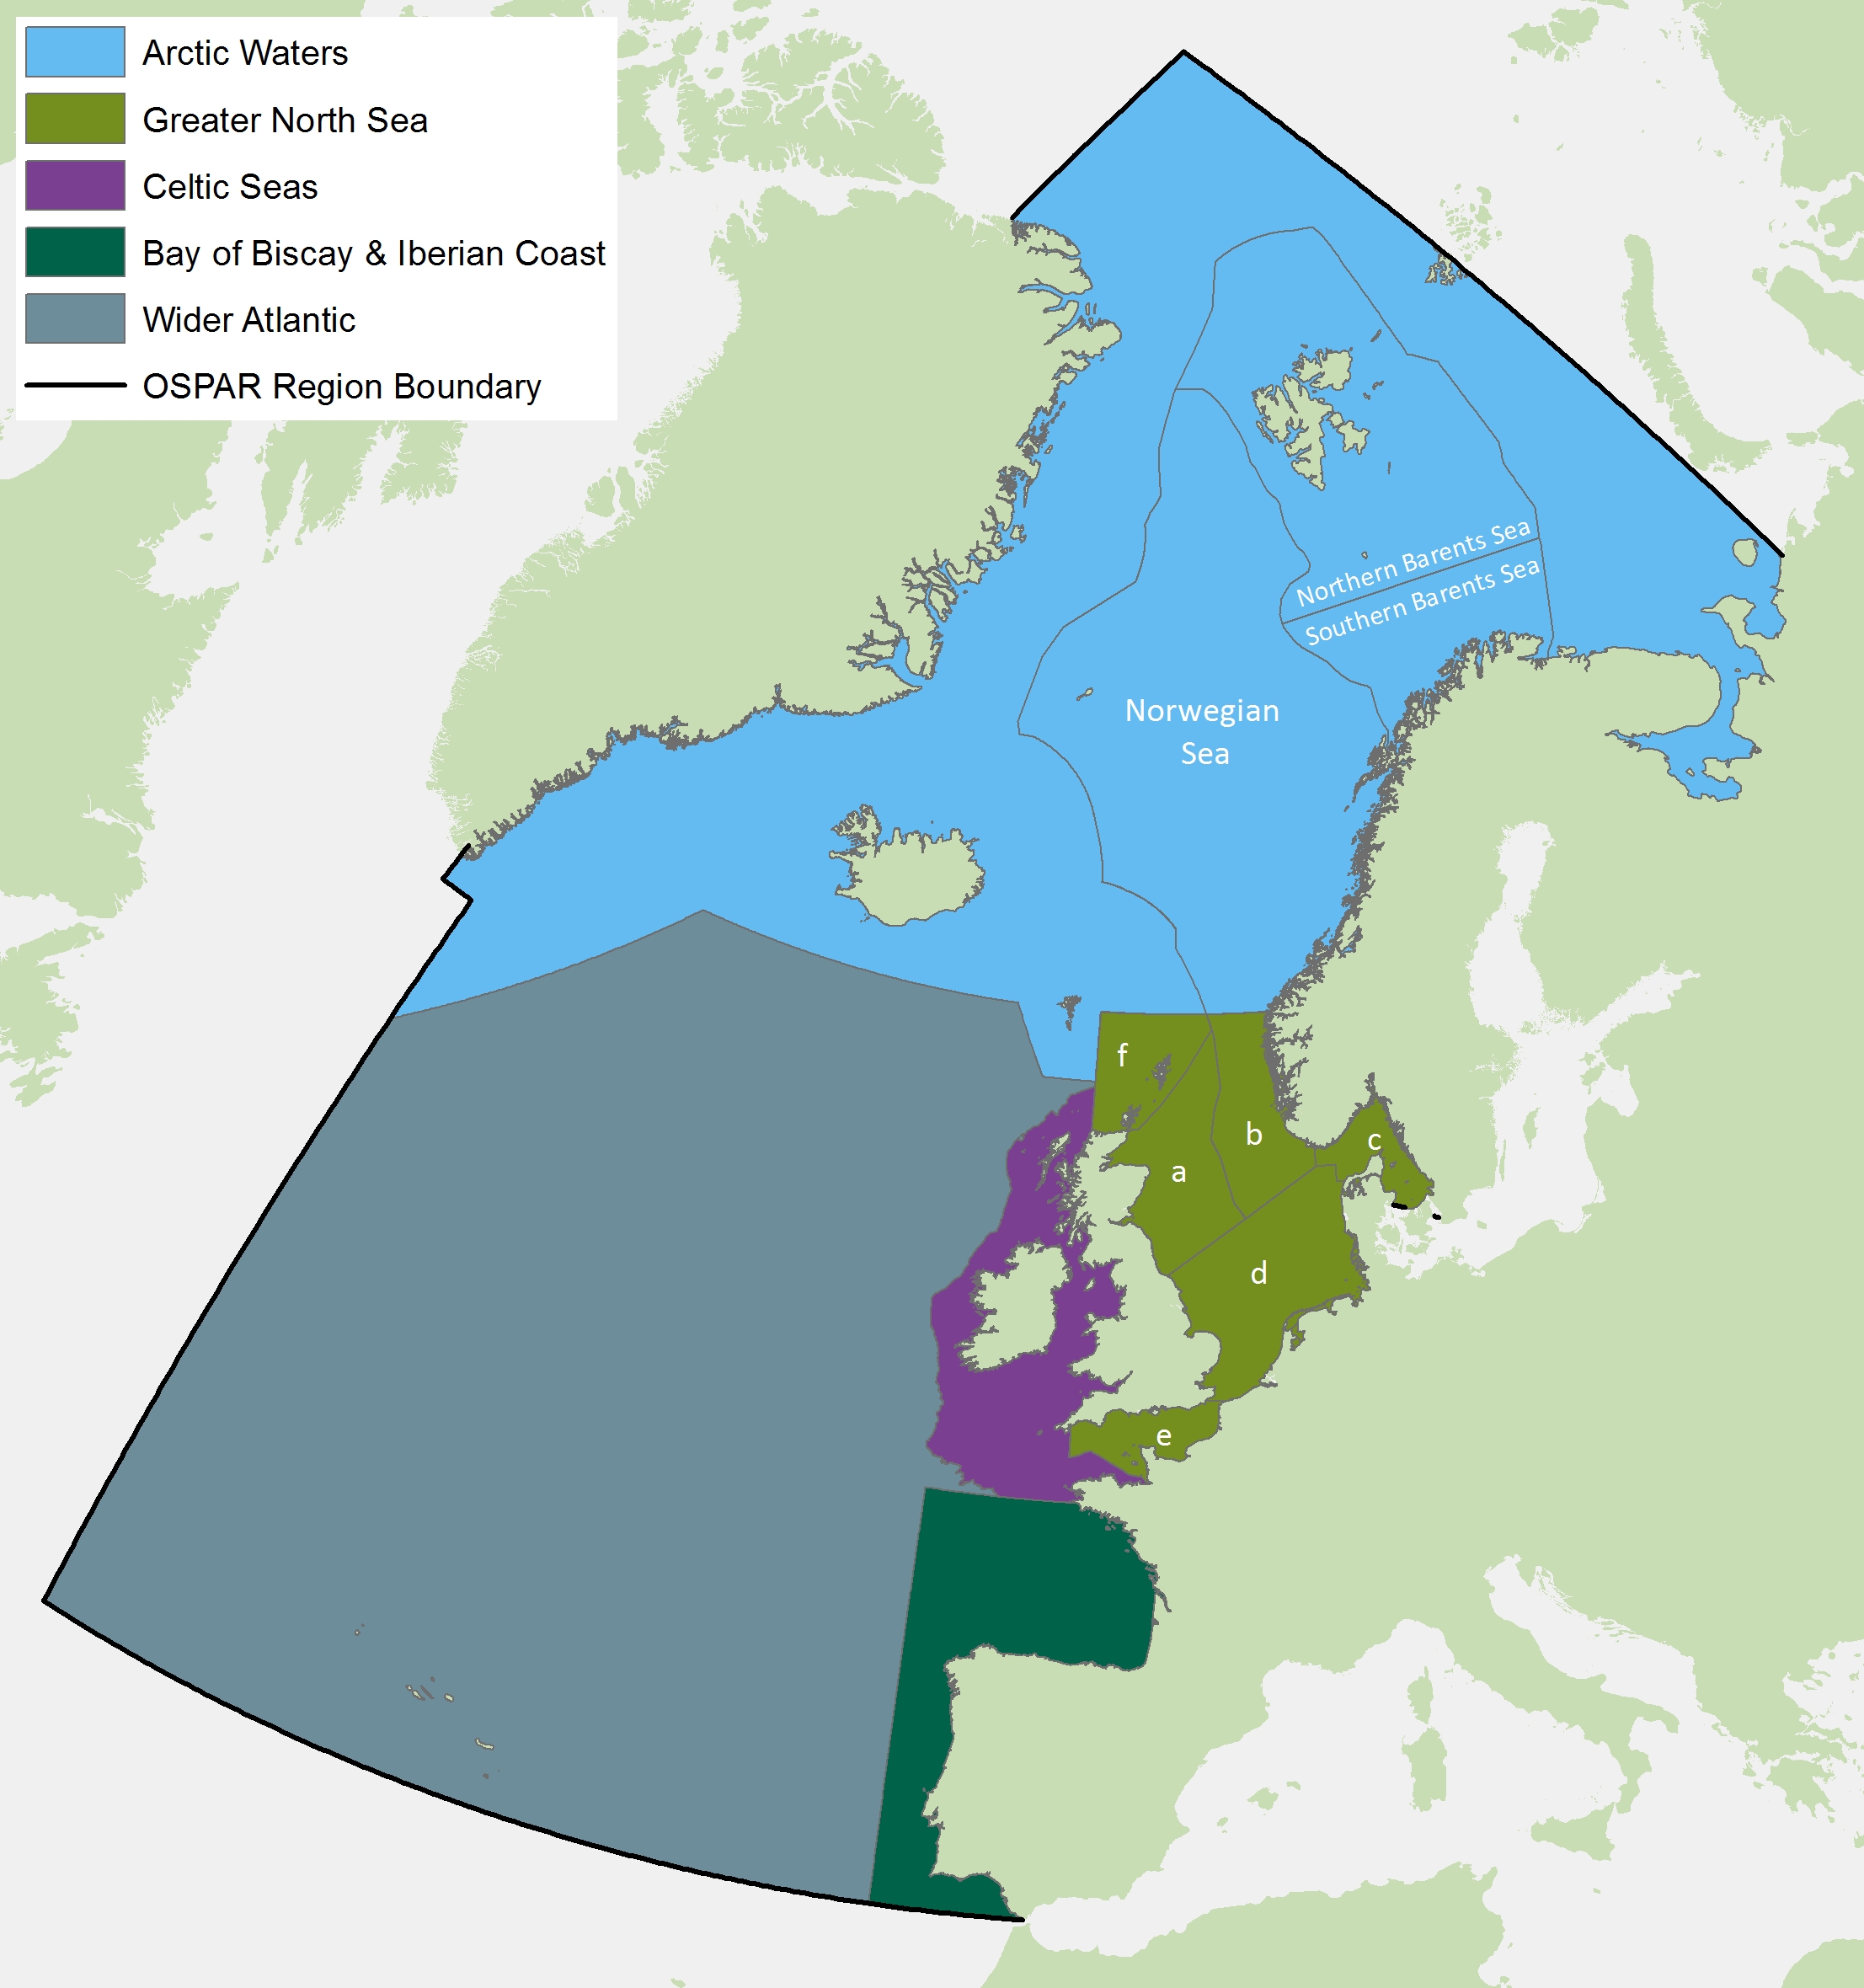
Figure a. Marine bird assessment units. Greater North Sea sub-divisions: a) Northeast coast of Britain, b) West coast of Norway, c) Skagerrak and Kattegat, d) Southern North Sea, e) English Channel, f) North coast of Scotland and the Northern Isles
- Breeding seabird colonies and breeding waterbirds nesting close to the coast and using the marine environment (e.g. for food): counts of breeding pairs (preferably, or failing that adult birds) per species per colony per year.
- Wintering and migrating waterbirds: numbers of birds per species per site per year that are counted from land or from the air. These data mostly comprise maximum or single counts conducted in January (N.B. within the Arctic Circle counts are conducted in March when there is sufficient daylight to do so). Data from the Wadden Sea Trilateral (Germany, Netherlands and Denmark) Monitoring and Assessment Programme and from the United Kingdom Wetland Bird Survey also comprised a mean of counts conducted throughout a one-year period (from July in one year to June in the next).
Most data refer to individual colonies or sites rather than large stretches of coastline. Exceptions are the Wadden Sea, the Dutch Delta and for non-breeding data in the United Kingdom, where colonies have been aggregated to regions and sub-divisions.
Spatial aggregation
Separate indicator assessments were conducted for each species in each OSPAR Region. An assessment was also conducted for each sub-division of the Greater North Sea, and the mainland part of the Norwegian Arctic Waters (Figure a). These smaller sub-divisions may help to interpret the assessment results. The sub-divisional boundaries are based on a coarse assessment of the main oceanographic features such as currents and depth, and some relatively clear-cut differences in seabird / waterbird community structure and population trends (ICES, 2013c,d).
Data used in this Assessment
When all data from participating Contracting Parties had been collated, it became clear that prior to 1992, the number of annual counts per site was much lower in some areas, with many sites not being surveyed at all. Prior to 1992, a large amount of data would need to be interpolated and confidence in the accuracy of trends in abundance during this period would be very low. For this reason, the data used in this indicator assessment were restricted to 1992 onwards. The Arctic Waters and Celtic Seas regional scale assessments used data collected during the period 1992–2015. In the Greater North Sea, regional assessments were only possible for the period 1992–2014, because more recent data were not available for the Wadden Sea.
In the Wadden Sea (Denmark, Germany, Netherlands), the status of non-breeding waterbirds is best indicated by year-to-year change in the mean of counts conducted throughout the year (i.e. from July in one year to June in the next) (Blew et al., 2016). These year-round counts are also conducted in the United Kingdom and in the Netherlands (outside of the Wadden Sea), but are not carried out elsewhere in the Greater North Sea. All Contracting Parties supplied maximum or single counts conducted in January (N.B. within the Arctic Circle, counts are conducted in March when there is sufficient daylight to do so). The January counts were used for the indicator assessment in the Greater North Sea region as a whole and separately, in each Greater North Sea sub-division, apart from the southern North Sea (sub-division d in Figure a), where mean year-round counts from the United Kingdom, Netherlands, Germany and Denmark were used (year-round counts were not available for Belgium). Year-round counts for the Wadden Sea (Denmark, Germany, Netherlands) were only available up to July 2013- June 2014 (i.e. 2013/14). Hence, the indicator assessments for each of the Greater North Sea sub-divisions were restricted to the period 1992/93 – 2013/14.
Trend Analysis
This indicator assessment requires for each species an annual estimate of either breeding or non-breeding abundance (depending on species) per site or colony. Not all the colonies and sites in the data provided had been observed every year. Missing annual observations were interpolated from the observed data using statistical models. The minimum number of years of counts for a particular species required for a colony or site to be included in the analysis was set at two for all species except northern fulmar (Fulmarus glacialis), which was set at a minimum of five years (ICES, 2010, 2011).
Some Contracting Parties provided data that had no missing values because these had already been interpolated prior to submission, using tried and tested methods:
1. United Kingdom non-breeding abundance, all species (for methodology see Underhill et al., 1994).
2. Denmark, Germany and the Netherlands in the Wadden Sea (Greater North Sea sub-division d) non-breeding abundance, all species (for methodology see Blew and Südbeck, 2005; Blew et al., 2016; see also www.waddensea-infogate.org/Migratory%20Birds/Migratory_birds.html).
3. Denmark, Germany and the Netherlands in the Wadden Sea (Greater North Sea sub-division d) breeding abundance, all species (for methodology see Koffijberg et al., 2015; see also www.waddensea-infogate.org/Breeding%20Birds/Breeding_birds.html).
For all other data submitted by Contracting Parties, missing annual observations were interpolated using a modified chain method, first developed by Thomas (1993). This method estimates values of missing observations based on information in other years and sites. The advantage of this method is that it allows for site-specific variation, thereby avoiding the conventional assumption that changes in abundance at different sites occur synchronously. A further advantage of this approach is that it can easily incorporate counts of whole colonies and counts from smaller plots within the same colonies that are monitored more frequently than the whole colony. The Thomas estimation method has been used to construct trends in abundance for earlier iterations of this indicator and its OSPAR Ecological Quality Objective (EcoQO) predecessor. Details of the method are as reported by ICES (2008: Annex 3).
Applying Regional Weightings to Abundance Trends
Not all the colonies or sites in an assessment unit will be monitored and present in the dataset. The proportion of a population that is monitored varies between species and between countries. There is a resultant bias, in that those countries where few sites are monitored are under-represented in the trends for a given assessment unit, compared to those countries where a larger proportion of sites are monitored.
To remove such bias, the annual estimates of breeding and non-breeding abundance in each country were weighted according to the size of the population in that country. Each Contracting Party provided recent estimates of total abundance for each species along their coastline within each of the assessment units in Figure a. To apply a regional weighting, each annual estimate of abundance in each assessment unit was divided by a proportion p, where p is the proportion of the total population that is present within the sites or colonies that are included in the data provided. The total number of adult birds or pairs in an assessment unit were, in most instances, taken from national censuses.
As an example, the weighted annual breeding abundance of a species in the Celtic Seas region, yIII in year j, was calculated from annual estimates of abundance in each constituent country, i.e. the United Kingdom Celtic Seas coast (yUK) and Ireland (yIRE) as follows:
yIIIj = (yUKj / pUK) + (yIREj / pIRE)
where pUK and pIRE are the proportions of the respective populations in the United Kingdom (UK) and Ireland (IRE) that are contained in the sample of colonies that were monitored in each constituent country in the Celtic Seas region.
Regional weightings were not necessary where data contained all the colonies or sites in that area. In Belgium, all the breeding and non-breeding sites in the country are monitored, so no weightings were required for these data. Regional weighting was also not necessary for estimates of annual abundance that had been interpolated before submission. These included trends in breeding and non-breeding abundance in the Dutch, German and Danish Wadden Sea, and trends in non-breeding abundance in the United Kingdom.
Parameter/Metric
To compare the state of species that have very different population sizes, estimates of abundance (measured in numbers of adult birds or breeding pairs) were converted to an indicator metric that uses a single scale (i.e. a proportion) for all species. The indicator metric is relative abundance, which is annual abundance expressed as a percentage of the baseline:
relative abundance = annual abundance / baseline abundance
Baselines
It is preferable to set baselines objectively, using one of the methods recommended by ICES (2015). But most Contracting Parties did not provide baselines in 2016. As an alternative, relative abundance was calculated using a baseline equal to the abundance at the start of the time series (i.e. 1992).
Species Selection and Aggregation (Functional Groups)
There were sufficient data to construct species-specific indicators of relative breeding abundance for the following 32 species: Arctic skua, Arctic tern, Atlantic puffin, black guillemot, black-headed gull, black-legged kittiwake, common eider, common guillemot, common gull, common tern, Eurasian spoonbill, European shag, great black-backed gull, great cormorant, great skua, herring gull, Kentish plover, lesser black-backed gull, little tern, mallard, Mediterranean gull, mute swan, northern fulmar, northern gannet, oystercatcher, pied avocet, razorbill, red-breasted merganser, ringed plover, roseate tern, Sandwich tern, and shelduck.
There were sufficient data to construct species-specific indicators of relative non-breeding abundance for the following 57 species: barnacle goose, bar-tailed godwit, Bewick’s swan, black guillemot, black-headed gull, black-tailed godwit, Brent goose, Canada goose, common eider, common gull, common merganser, common scoter, coot, dunlin, Eurasian curlew, Eurasian spoonbill, European shag, goldeneye, golden plover, great black-backed gull, great cormorant, great crested grebe, greater scaup, Greenland white-fronted goose, greenshank, grey plover, herring gull, king eider, lapwing, long-tailed duck, mallard, mute swan, oystercatcher, pied avocet, pintail, pochard, purple sandpiper, red-breasted merganser, red knot, red-necked grebe, redshank, red-throated diver, ringed plover, ruff, sanderling, shelduck, shoveler, Slavonian grebe, smew, spotted redshank, teal, tufted duck, turnstone, velvet scoter, whimbrel,whooper swan and wigeon.
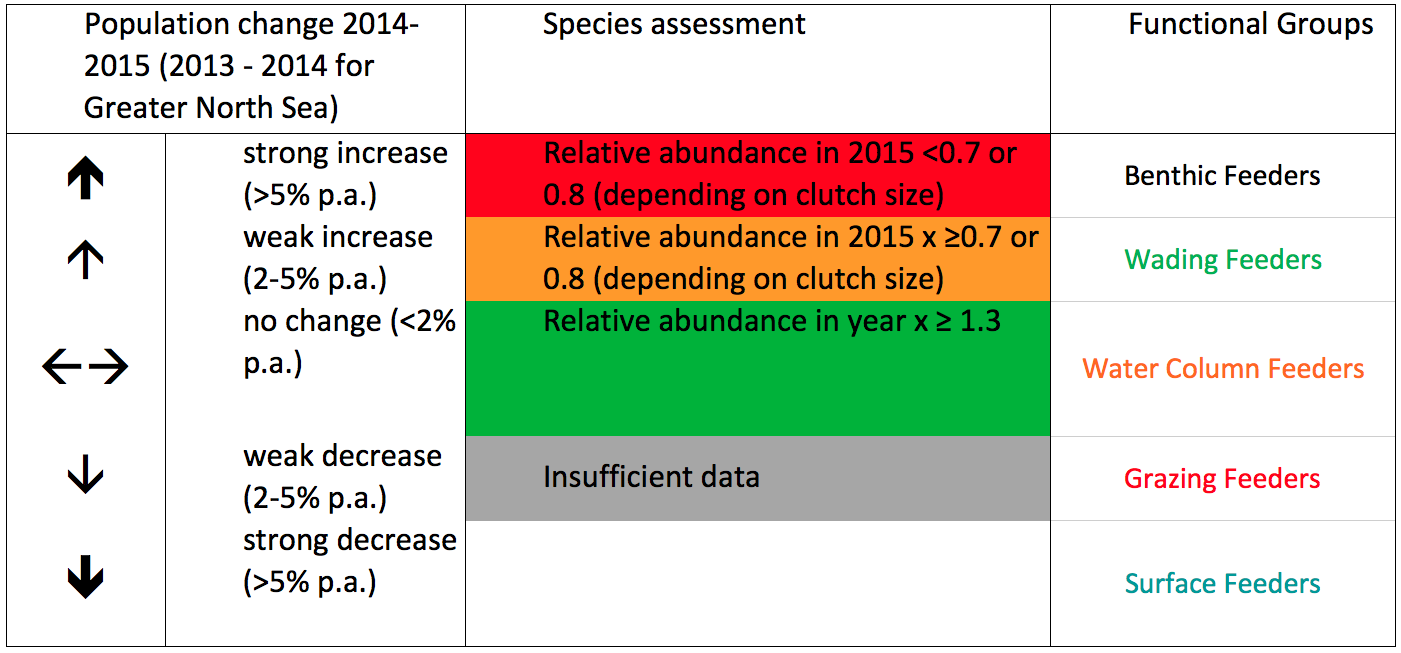
Species were assigned to the functional groups given in Table a. The species assessed and the functional groups to which they were assigned, are given in Table b.
| Functional group | Typical feeding behaviour | Typical food types | Additional guidance |
|---|---|---|---|
| Wading feeders | Walk/wade in shallow waters | Invertebrates (molluscs, polychaetes, etc.) | None |
| Surface feeders | Feed within the surface layer (within 1 to 2 m of the surface) | Small fish, zooplankton and other invertebrates | “Surface layer” defined in relation to normal diving depth of plunge-divers (except gannets) |
| Water column feeders | Feed at a broad depth range in the water column | Pelagic and demersal fish and invertebrates (e.g. squid, zooplankton) | Include only species that usually dive by actively swimming underwater; but including gannets. Includes species feeding on benthic fish (e.g. flatfish). |
| Benthic feeders | Feed on the seafloor | Invertebrates (e.g. molluscs, echinoderms) | None |
| Grazing feeders | Grazing in intertidal areas and in shallow waters | Plants (e.g. eelgrass, saltmarsh plants), algae | Geese, swans and dabbling ducks, coot |
Species-specific assessment values
This assessment uses two different assessment values that are designed to reflect the resilience of different species to declines in their population (see ICES, 2008, 2010, 2011). It is desirable for the annual relative abundance of a species to be above, either:
- 0.8 (i.e. 80% of the baseline) – for species that lay one egg; or
- 0.7 (i.e. 70% of the baseline) – for species that lay more than one egg.
The reason for having two assessment values is because species that lay only one egg are expected to recover more slowly from declines in population size than species that can potentially produce more than one chick per year. If relative abundance is below the appropriate assessment value, it is considered to be in ‘poor’ status and further research and / or management is recommended, depending on what is appropriate.
An upper assessment value of 1.3 (i.e. 130% of the baseline) was applied to the annual relative abundance of all species. This upper assessment value is used to identify potentially disruptive increases in some species that might impact on other species (ICES, 2008). For instance, large predatory seabird species have benefited from the provision of food from fishery discards. The increase in numbers of species such as great black-backed gull and great skua have, in some areas, led to declines in species such as kittiwake that they prey on. However, this has the potential to wrongly identify a species as having a detrimental impact on other species when in fact it is in recovery to levels in excess of the baseline (ICES, 2010, 2011, 2013b). As a result, this upper assessment value is not used as an indicator of status and is only used to provide a trigger for further research and / or management, if increases in one species are likely to result in decreases in others.
Integration of species-specific assessments
The status of marine bird communities was assessed by calculating the proportion of species exceeding the lower assessment values, as previously used for breeding seabirds in the EcoQO on seabird population trends as an index of community health (ICES, 2008), according to the following integration rule:
Changes in abundance of marine birds should exceed species-specific assessment values in 75% or more of species that are assessed.
Humphreys et al. (2012) also recommended a value of 75% for non-breeding shorebirds and coastal breeding waterbirds in the United Kingdom because it is comparable to the assessment values used for shorebirds by the WeBS Alerts system.
In this indicator assessment, relative breeding abundance and relative non-breeding abundance were assessed separately. This is because most species in the breeding assessment are seabirds that use the wider marine environment and most species in the non-breeding assessment use intertidal and inshore areas. The breeding and non-breeding assessments therefore indicate impacts from different suites of pressures, operating in different parts of the marine environment.
To provide greater insight into the likely impacts operating on relative breeding abundance and on relative non-breeding abundance, species-specific assessments were integrated at different spatial scales: for each OSPAR Region and for each sub-division of the Greater North Sea and Arctic Waters. Within each Region, species-specific assessments were also integrated for each functional group (Table a).
Results
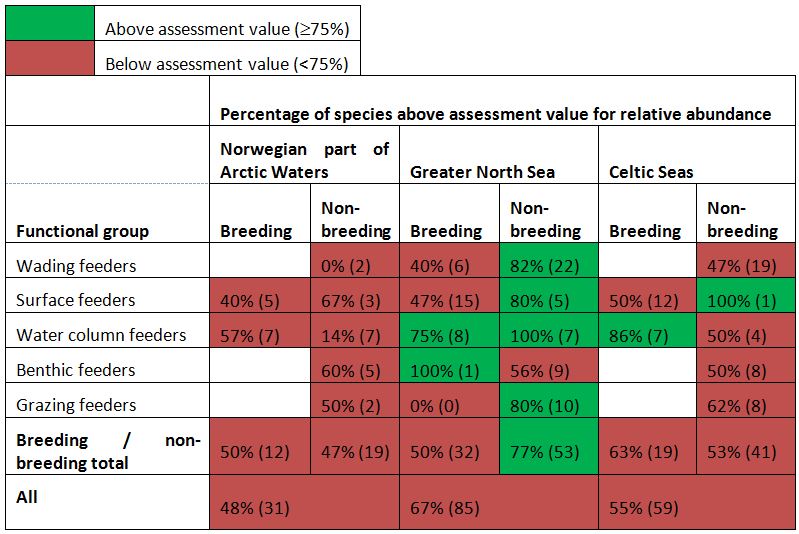
The percentage of all species within each functional group exceeding assessment values for relative breeding abundance and for relative non-breeding abundance in 2014 in the Greater North Seas and in 2015 in the other OSPAR Regions are shown in Table 1.
In all three OSPAR Regions assessed, less than 75% of all species assessed across the functional groups have met assessment values for relative breeding abundance (Table 1), indicating that the bird communities are not healthy. This was also the case for relative non-breeding abundance in the Norwegian part of the Arctic Waters and the Celtic Seas. In contrast, assessment values were met for non-breeding abundance in more than 75% of species in the Greater North Sea in 2014 (Table 1), which has occurred in every year since 1993, except in 2010 (Figure 2).
Changes in the annual percentage of species meeting assessment values since the early nineties are shown in Figure 1 (relative breeding abundance) and Figure 2 (relative non-breeding abundance). There has been a decline in the proportion of species meeting assessment values since the mid-2000s or earlier in all OSPAR Regions assessed.
There was moderate confidence in both the methodology and the data used in this assessment.
Table 1: Percentage of species assessed that had a relative abundance above the assessment values in each functional group in the Norwegian part of the Arctic Waters and Celtic Seas regions in 2015 and in the Greater North Sea in 2014
 and Celtic Seas (19 species) regions during the period 1992–2015, and in the Greater North Sea region (32 species) during the period 1992–2014.")
Figure 1: Change in the annual proportion of species exceeding assessment values for the relative breeding abundance of marine birds in the Norwegian part of the Arctic Waters (12 species) and Celtic Seas (19 species) regions during the period 1992–2015, and in the Greater North Sea region (32 species) during the period 1992–2014.
The black line denotes the multi-species assessment value of 75%
 and Celtic Seas (41 species) regions during the period 1993–2015, and in the Greater North Sea region (53 species) during the period 1993–2014")
Figure 2: Change in the annual proportion of species exceeding assessment values for relative non-breeding abundance of marine birds in the Norwegian part of the Arctic Waters (19 species) and Celtic Seas (41 species) regions during the period 1993–2015, and in the Greater North Sea region (53 species) during the period 1993–2014
The black line denotes the multi-species assessment value of 75%
The individual species that have failed to meet assessment values are shown in red in Figure b (breeding abundance) and Figure c (non-breeding abundance). There were few species for which breeding and non-breeding abundance could both be assessed: five in the Arctic Waters, 14 in the Greater North Sea and only one in the Celtic Seas. (see Figures b and Figure c).
Key for extended figures
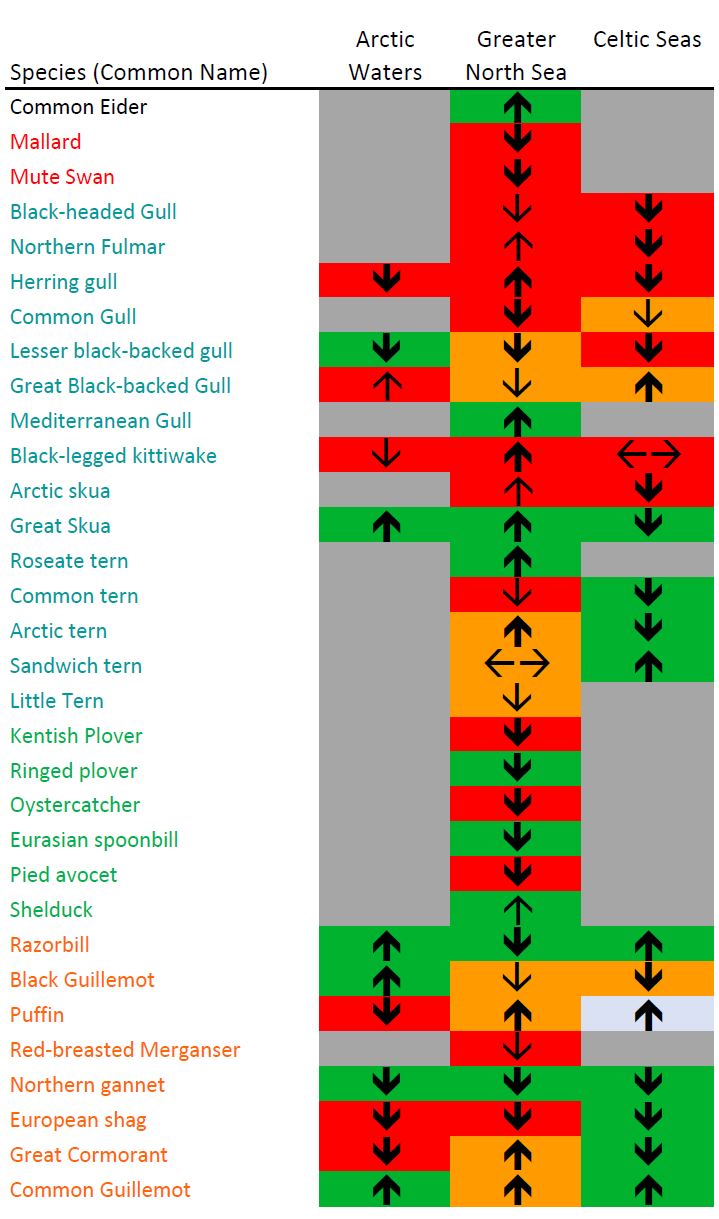
Figure b: Species-specific assessment of relative breeding abundance for marine birds for the Norwegian part of the Arctic Waters and for the Celtic Seas in 2015, and for the Greater North Sea in 2014.
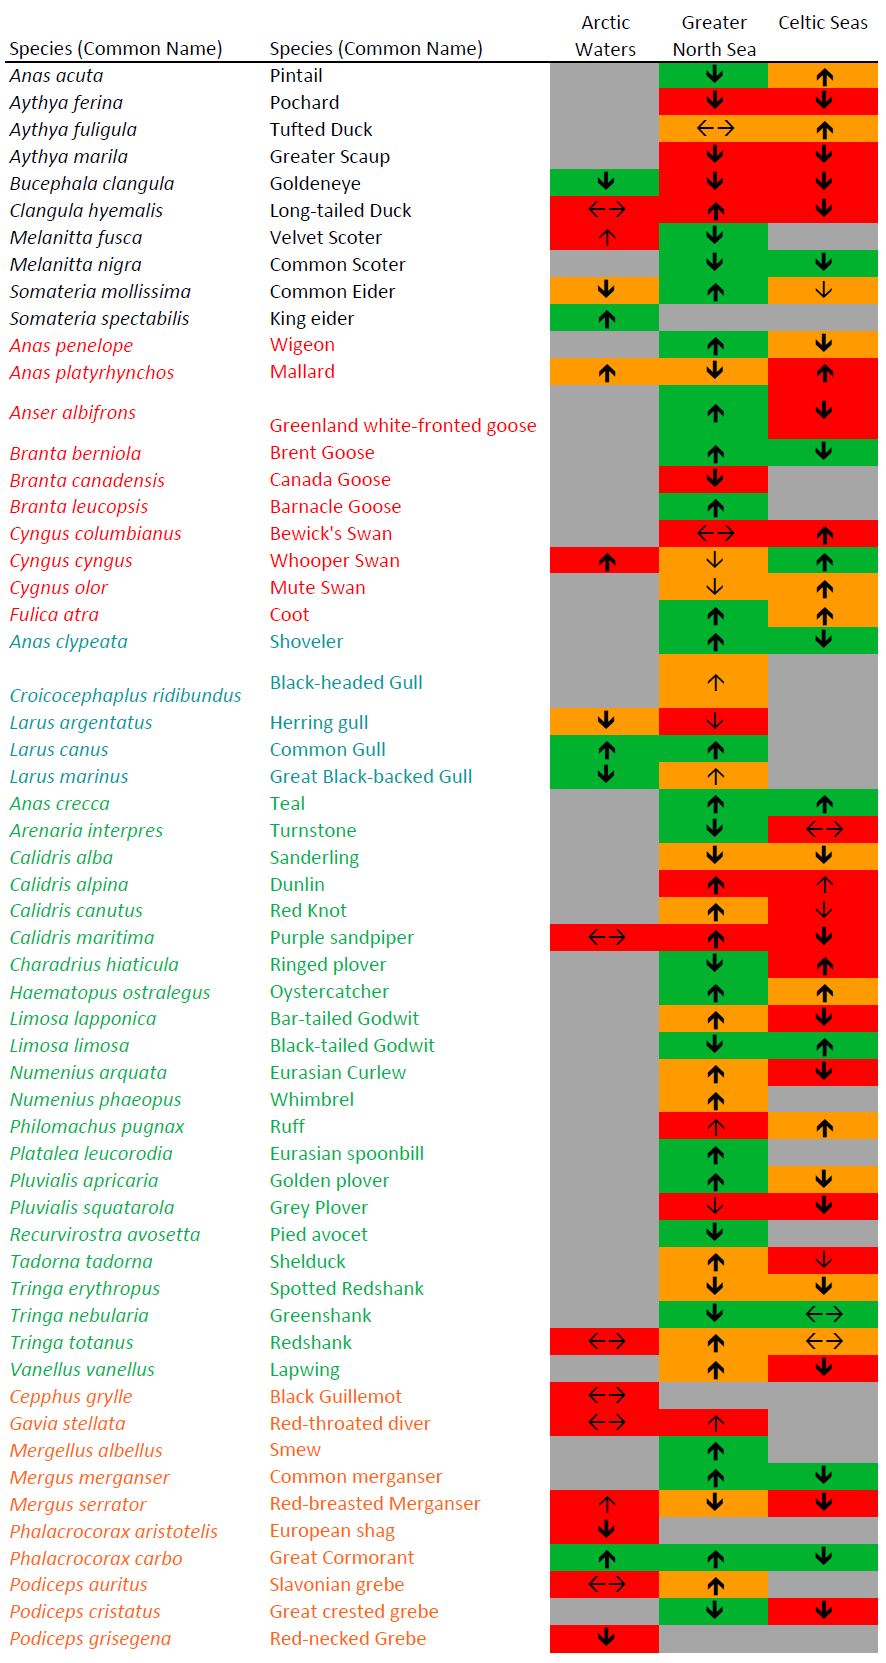
Figure c: Species-specific assessment of relative non-breeding abundance for marine birds for the Norwegian part of the Arctic Waters and for the Celtic Seas in 2015, and for the Greater North Sea in 2014
Note: The assessments for all regions are derived from counts in January of each year.
The species-specific trends in breeding abundance and non-breeding abundance on which this indicator assessment are based, are shown in Figure d and Figure e. Trends were estimated at various spatial scales (i.e. OSPAR Regions and for sub-divisions thereof), depending on there being sufficient data available, for which the trends were estimated for each species.
The assessments of each species in 2014 or 2015 that were presented in Figure c are broken down into the sub-divisions of the Greater North Sea in Figure f and Figure g and in the sub-divisions of the Arctic Waters in Figure h and Figure i. The number of species included in the sub-divisional assessments are fewer than those in the regional assessments, because there are fewer colonies and sites at the smaller scale that have data from a sufficient number of years
The species-specific trends in relative breeding abundance in each OSPAR Region and sub-division (as shown in Figure a) during the period 1992–2015 can be downloaded here (Figures d1 to d29). The baseline is where relative abundance = 1.0. The black dotted line indicates the lower assessment value of 0.7 (for species that lay >1 egg) or 0.8 for species that lay 1 egg only); the black dashed line indicates the upper assessment value of 1.3. A list of the species by figure number is as follows: Figure d1 Arctic skua, Figure d2 Arctic tern, Figure d3 Black Guillemot, Figure d4 Black-headed Gull, Figure d5 Black-legged kittiwake, Figure d6 Brünnich’s guillemot, Figure d7 Common Eider, Figure d8 Common Guillemot, Figure d9 Common Gull, Figure d10 Common tern, Figure d11 Eurasian spoonbill, Figure d12 European shag, Figure d13 Glaucous gull, Figure d14 Great Black-backed Gull, Figure d15 Great Cormorant, Figure d16 Great Skua, Figure d17 Herring gull, Figure d18 Kentish plover, Figure d19 Lesser black-backed gull, Figure d20 Little Auk, Figure d21 Little Tern, Figure d22 Mallard, Figure d23 Manx Shearwater, Figure d24 Mute swan, Figure d25 Northern Fulmar, Figure d26 Northern gannet, Figure d27 Oystercatcher, Figure d28 Pied avocet, Figure d29 Puffin, Figure d30 Razorbill, Figure d31 Red-breasted merganser, Figure d32 Ringed plover, Figure d33 Roseate tern, Figure d34 Sandwich tern, Figure d35 Shelduck.
The species-specific trends in relative non-breeding abundance in each OSPAR Region and sub-division (as shown in Figure a) can be downloaded here (Figures e1 to e29). Trends for Norwegian parts of the Artic Waters and the Celtic Seas are are derived from counts in January of each year during 1992-2015. Data for all parts of the Greater North Sea are only available for the period 1992–2013. Trends for Greater North Sea sub-division d are derived from the annual mean of counts conducted throughout the year (July–June) from 1992/93 to 2013/14. The trends for the other Greater North Sea sub-divisions (i.e. a-c, e, f -see Figure a) are derived from counts in January of each year during 1992-2013. The baseline is where relative abundance = 1.0. The black dotted line indicates the lower assessment value of 0.7 (for species that lay >1 egg) or 0.8 (for species that lay 1 egg only); the black dashed line indicates the upper assessment value of 1.3.
A list of the species by figure number is as follows: Figure e1 Barnacle Goose, Figure e2 Bar-tailed Godwit, Figure e3 Bewicks Swan, Figure e4 Black Guillemot, Figure e5 Black-Headed Gull, Figure e6 Black-tailed Godwit, Figure e7 Brent Goose, Figure e8 Common Eider, Figure e9 Common Gull, Figure e10 Common merganser, Figure e11 Common Scoter, Figure e12 Coot, Figure e13 Curlew, Figure e14 Curlew Sandpiper, Figure e15 Dunlin, Figure e16 Eurasian spoonbill, Figure e17 Golden plover, Figure e18 Goldeneye, Figure e19 Great Black-Backed Gull, Figure e20 Great Cormorant, Figure e21 Great crested grebe, Figure e22 Greater Scaup, Figure e23 Greenshank, Figure e24 Grey Plover, Figure e25 Herring Gull, Figure e26 Kentish Plover, Figure e27 King eider, Figure e28 Lapwing, Figure e29 Little Egret, Figure e30 Long-tailed Duck, Figure e31 Mallard, Figure e32 Mute Swan, Figure e33 Oystercatcher, Figure e34 Pied avocet, Figure e35 Pintail, Figure e36 Pochard, Figure e37 Purple sandpiper, Figure e38 Red Knot, Figure e39 Red-breasted Merganser, Figure e40 Red-necked Grebe, Figure e41 Redshank, Figure e42 Red-throated diver, Figure e43 Ringed plover, Figure e44 Ruff, Figure e45 Sanderling, Figure e46 Shag, Figure e47 Shelduck, Figure e48 Shoveler, Figure e49 Slavonian grebe, Figure e50 Smew, Figure e51 Spotted Redshank, Figure e52 Teal, Figure e53 Tufted Duck, Figure e54 Turnstone, Figure e55 Velvet Scoter, Figure e56 Whimbrel, Figure e57 White-fronted goose, Figure e58 Whooper Swan, Figure e59 Wigeon.
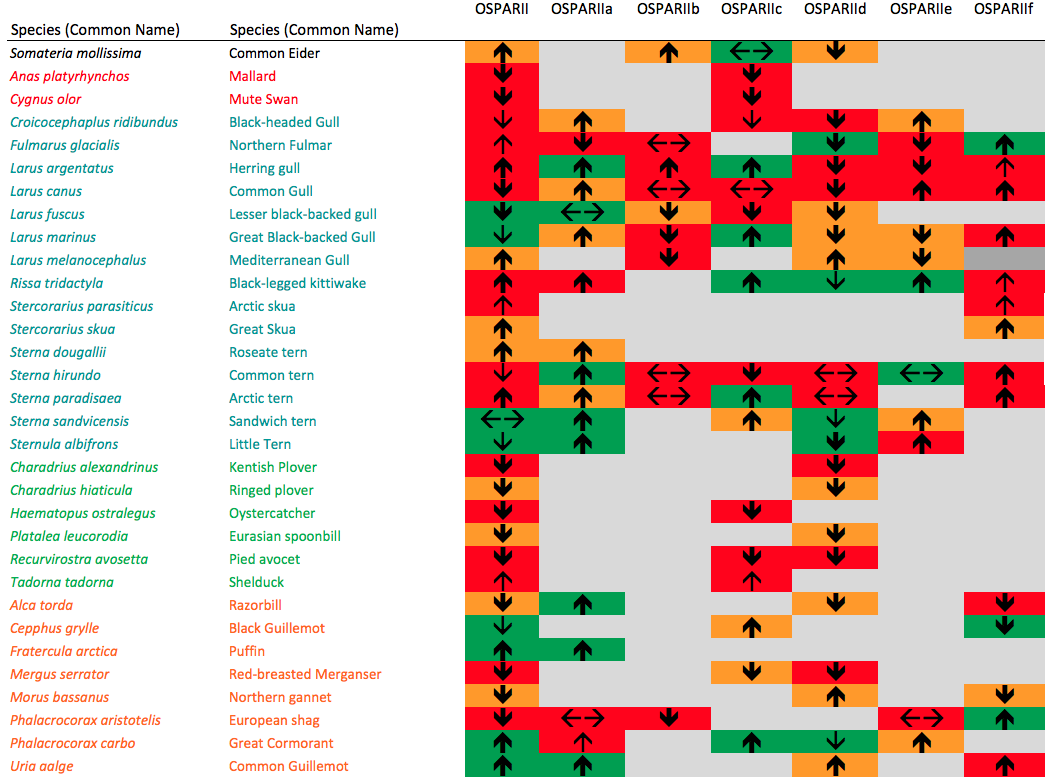
Figure f: Species-specific assessment of relative breeding abundance in 2014 in the sub-divisions of the Greater North Sea
(see Figure a).
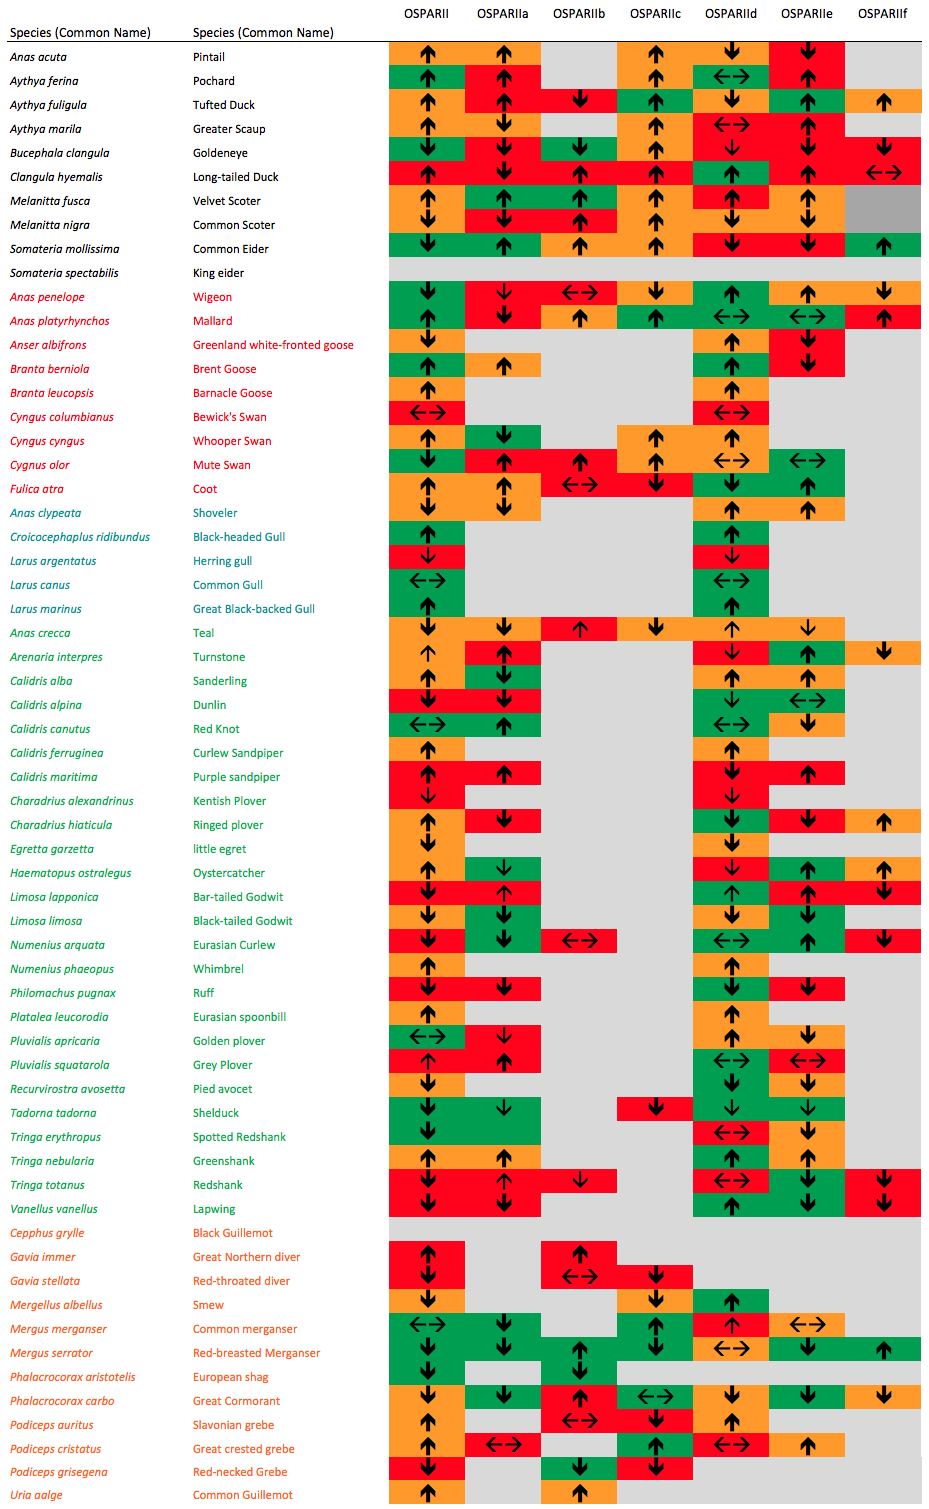
Figure g Species-specific assessment of relative non-breeding abundance in 2013 in the sub-divisions of the Greater North Sea (see Figure a)
Note: Assessments in Greater North Sea sub-division d are derived from the annual mean of counts conducted throughout the year (July–June) from 1992/93 to 2013/14. The assessments for the other Greater North Sea sub-divisions (i.e. a-c, e, f ) are derived from counts in January of each year.
")
Figure h: Species-specific assessment of relative breeding abundance in 2015 in the sub-divisions of Norwegian part of Arctic Waters (see Figure a)
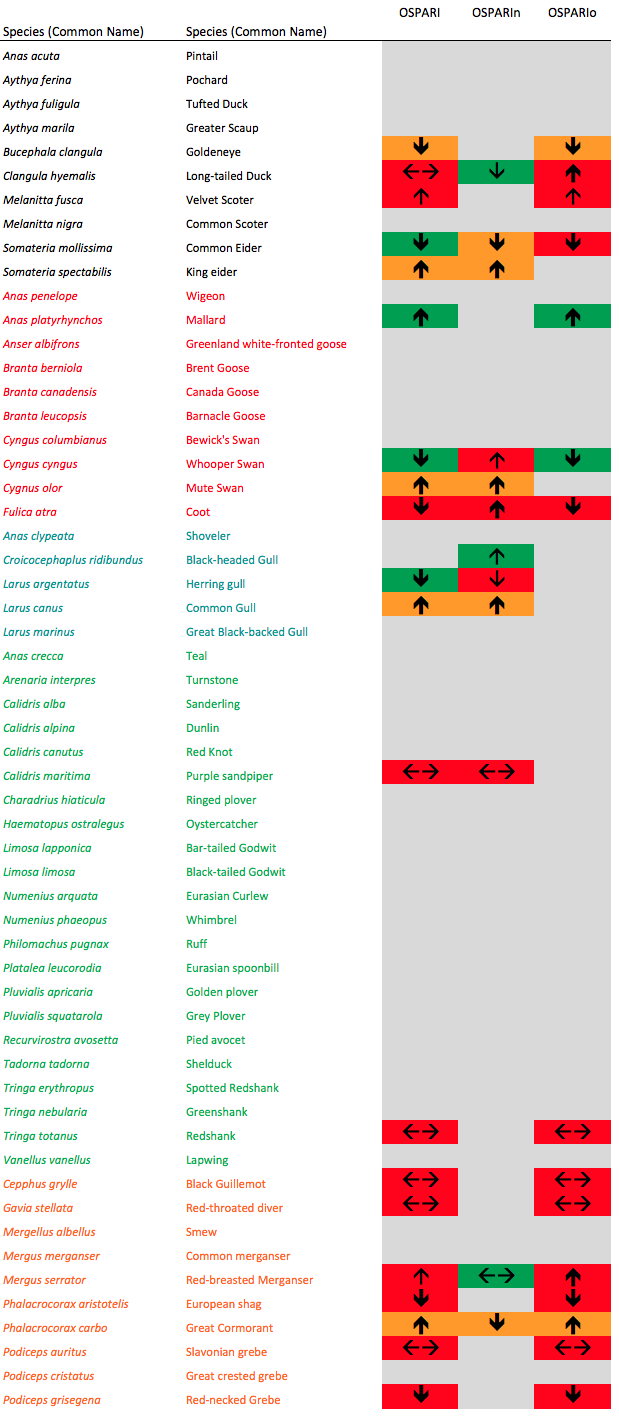
Figure i: Species-specific assessment of relative non-breeding abundance in 2015 in the sub-divisions of the Norwegian part of the Arctic Waters (see Figure a)
There is moderate confidence in the methodology. There is consensus within the scientific community regarding this methodology, which was developed for the OSPAR EcoQO for seabird population trends, but it has not often been applied. There was also moderate confidence in the data. The assessment is undertaken using data with a mostly sufficient spatial coverage for the area assessed, but gaps are apparent in certain areas.
Conclusion
Since the mid-2000s, the breeding abundance of more than a quarter of the marine bird species assessed in the OSPAR Maritime Area has been below the baseline set in 1992, indicating that the populations are not healthy. A similar pattern was found in the non-breeding abundance of species that visit the Arctic Waters and Celtic Seas during migration and / or during winter. In contrast, non-breeding populations in the Greater North Sea are doing much better, and with 75% or more of species meeting assessment values in every year since 1993 are considered healthy.
The majority of the breeding populations assessed were marine birds that forage offshore, mostly on fish. The species feeding on fish within the water column are faring better than those feeding at the surface. This suggests that the availability of small forage fish species at the surface is probably limiting the breeding success of some species. Drivers of food availability are likely to be ecosystem-specific changes, possibly initiated by past and present fisheries, in combination with climate change.
The non-breeding populations assessed are from all five marine bird functional groups, with the majority being wading feeders. The assessments of non-breeding abundance showed few differences between the functional groups.
The findings of this assessment relating to the importance of small forage fish species (e.g. lesser sandeel, sprat) at the surface of the sea as a limiting factor for breeding of some species (e.g. black-legged kittiwake, Rissa tridactyla) concurs with the results of the Common indicator on marine bird breeding success / failure .
Knowledge Gaps
This indicator assessment could also be applied to the Bay of Biscay and Iberian Coast and to the marine birds breeding on the Azores, if data were available from Contracting Parties. The assessment for Arctic Waters lacks data. This indicator assessment could also be expanded to include more data on seabirds and waterbirds collected at sea.
The baselines used in this indicator assessment were assigned to the start of the data series being assessed. It would be more objective to set baselines that include ‘historical reference levels’, which reflect abundance at a point in the past long before the time series began, or ‘reference levels’, where anthropogenic impacts on population size are assumed to be negligible.
Expansion of the indicator to other OSPAR Regions
Of the 21 marine bird species breeding in the Bay of Biscay and Iberian Coast region, nine occur in very low numbers, and with no monitoring data collected for two (Cory’s shearwater, Calonectris diomedea and band-rumped storm-petrel, Oceanodroma castro) (ICES, 2008). Data quality for six of the 10 remaining species was assessed as ‘good’, three were assessed as ‘sparse’, and data quality for one (little tern, Sternula albifrons) breeding in Portugal was unknown (ICES, 2008).
The Azores are currently working with the other Macaronesian archipelagos (Madeira and the Canary Islands) to establish a common monitoring plan for breeding seabirds within the framework of the MISTIC Seas Project (European Union funded). This plan will be implemented, with the support of a recently granted European Union Project MISTIC SEAS II, and will enable the collection of data on seabird abundance.
Inclusion of at-sea data
Data on seabirds at sea, collected from boats or planes, were not included in the abundance indicator. However, these data need to be included in the future to obtain reliable results on trends in species that occur in substantial numbers offshore. At present, several Contracting Parties carry out, or plan to carry out, national at-sea monitoring programmes. Elsewhere, there are either no at-sea surveys or those that do exist are very limited in spatial and temporal coverage. Overall, coordination of surveys (e.g. regarding timing) between countries is lacking. There is a need to develop a concept for joint survey efforts delivering the necessary data basis for the abundance indicator work, to implement this concept in the frame of national survey programmes in future years, and to develop a methodological approach for aggregating and analysing the data.
Baselines
Most Contracting Parties did not provide baselines in 2016. As an alternative, relative breeding abundance was calculated using a baseline equal to the abundance in the second year of the time series (i.e. 1992). ICES (2015) recommended that it is preferable to set baselines objectively, using one of the methods (a) or (b), below.
- 'Historical reference’: where abundance is known at a point in the past long before the time series began, but where the reasons for subsequent change are unknown. Historical population estimates should be used as baselines if they were recorded: before known human impacts; and / or before other major declines in population; or at known plateaus in population trends, following increases and peaks in population size.
- ‘Reference level’: the population size that could be expected if human impacts were negligible (this can be derived from known population sizes either historically or from within available time series). Use of the highest known population estimate when the population has decreased in size, as a result of human impacts (e.g. periods of severe contamination) or following stochastic natural impacts (e.g. severe weather events). Use of recent population estimates (e.g. previous five-year mean) when a species has been colonising.
ICES. 2008. Report of the Workshop on Seabird Ecological Quality Indicator, 8–9 March 2008, Lisbon, Portugal. ICES CM 2008/LRC:06. 60 pp.
ICES. 2010. Report of the Working Group on Seabird Ecology (WGSE). 15–19 March 2010, Copenhagen. ICES CM 2010/SSGEF:10. 81 pp.
ICES. 2011. Report of the Working Group on Seabird Ecology (WGSE). 1–4 November 2011, Madeira, Portugal. ICES CM 2011/SSGEF:07. 77 pp.
ICES. 2012. ICES advice on EcoQO for seabird populations in OSPAR regions II and III. In Report of the ICES Advisory Committee, 2012. ICES Advice 2012, Book 1, Section 1.5.5.1. Also available as a separate advice sheet at: http://www.ices.dk/sites/pub/Publication%20Reports/Advice/2012/Special%20Requests/OSPAR_EcoQO_for_seabird_populations.pdf
ICES. 2013a. OSPAR request on ecological quality objective for seabird populations in OSPAR Region III (Celtic seas). In Report of the ICES Advisory Committee, 2013. ICES Advice 2013, Book 1, Section 1.5.6.1. Also available as a separate advice sheet at: http://www.ices.dk/sites/pub/Publication%20Reports/Advice/2013/Special%20requests/OSPAR_EcoQO_region_III.pdf
ICES. 2013b. Report of the ICES Ad hoc Group on Seabird Ecology (AGSE), 28–29 November 2012, ICES Headquarters, Copenhagen, Denmark. ICES CM 2012/ACOM:82. 30 pp.
ICES. 2013c. Report of the Joint ICES/OSPAR Expert Group on Seabirds (WGBIRD), 22–23 October 2013, ICES Headquarters , Copenhagen, Denmark. ICES CM 2013/ACOM:78. 24 pp.
ICES. 2013d. OSPAR request on an update of the ecological quality objective (EcoQO) on seabird population trends. In Report of the ICES Advisory Committee, 2013. ICES Advice 2013, Book 1, Section 1.5.6.9.
ICES. 2015. Report on the Joint ICES/OSPAR Working Group on Seabirds (JWGBIRD), 17-21 November 2014, Copenhagen, Denmark. ICES CM 2014/ACOM:30, 115 pp.
Blew, J., Günther, K., Hälterlein, B., Kleefstra, R., Laursen,K., Scheiffarth, G. 2016. Trends of Migratory and Wintering Waterbirds in the Wadden Sea 1987/1988 - 2013/2014. Wadden Sea Ecosystem No. 37. Common Wadden Sea Secretariat, Joint Monitoring Group of Migratory Birds in the Wadden Sea,Wilhelmshaven, Germany.
Blew, J. and Südbeck, P. (Eds.) 2005. Migratory Waterbirds in the Wadden Sea 1980 – 2000. Wadden Sea Ecosystem No. 20. Common Wadden Sea Secretariat, Trilateral Monitoring and Assessment Group, Joint Monitoring Group of Migratory Birds in the Wadden Sea, Wilhelmshaven, Germany.
Humphreys E M, Risely K, Austin G E, Johnston A and Burton N.H.K. 2012. Development of MSFD Indicators, Baselines and Targets for Population Size and Distribution of Marine Birds in the UK. BTO Research Report No. 626.
Koffijberg, K., K. Laursen, B. Hälterlein, G. Reichert, J. Frikke & L. Soldaat 2015. Trends of Breeding Birds in the Wadden Sea 1991 - 2013. Wadden Sea Ecosystem No. 35. Common Wadden Sea Secretariat, Joint Monitoring Group of Breeding Birds in the Wadden Sea, Wilhelmshaven, Germany.
Thomas, G.E. (1993) Estimating annual total heron population counts. Appl. Statistics 42: 473-486.
Underhill, L.G. & Prŷs-Jones, R. (1994) Index numbers for waterbird populations. I. Review and methodology. J. Appl. Ecol., 31, 463-480.
| Sheet reference | BDC16/D110 |
|---|---|
| Assessment type | Intermediate Assessment |
| Context (1) | Biological Diversity and Ecosystems - Targeted actions for the protection and conservation of species, habitats and ecosystem processes |
| Context (2) | OSPAR Publication 2009/307, Handbook of the application of Ecological Quality Objectives in the North Sea |
| Context (3) | D1 - Biological Diversity |
| Context (4) | D1.2 - Population Size |
| Point of contact | OSPAR Secretariat |
secretariat@ospar.org | |
| Metadata date | 2016-09-13 |
| Title | Marine Bird Abundance |
| Resource abstract | Since the mid-2000s, the abundance of more than 25% of the marine bird species assessed in the Norwegian part of the Arctic Waters, the Greater North Sea and the Celtic Seas has been more than 20-30% below levels observed in 1992. This is based on numbers of seabirds breeding on the coast and on numbers of waterbirds in coastal areas during migration and over-winter |
| Linkage | https://www.ospar.org/documents?v=7127 |
| Topic category | Environment |
| Indirect spatial reference | L2.1.1;L2.1.2;L2.1.4;L2.2.1;L2.2.3;L2.2.8;L2.2.5;L2.2.6;L2.2.7;L2.3.1;L2.3.2;L2.3.3;L2.2.2;L2.2.4 |
| N Lat | 81.172826679208 |
| E Lon | 51.0000830647817 |
| S Lat | 48.0000507707265 |
| W Lon | -13.6295555748299 |
| Countries | BE, DE, DK, IE, NL, NO, SE, UK |
| Start date | 1991-01-01 |
| End date | 2015-12-31 |
| Date of publication | 2017-06-30 |
| Conditions applying to access and use | https://www.ospar.org/site/assets/files/1215/ospar_data_conditions_of_use.pdf |
| Conditions applying to access and use | http://www.ices.dk/marine-data/guidelines-and-policy/Pages/ICES-data-policy.aspx |
| Data Snapshot | https://odims.ospar.org/documents/194/download |
| Data Results | https://odims.ospar.org/documents/195/download |
| Data Source | http://biodiversity.ices.dk |