

Marine Bird Breeding Success / Failure
D1 - Biological Diversity
D1.3 - Population condition
Key Message
Seabird species have experienced frequent and widespread breeding failure over the period assessed (2010 to 2015 inclusive) in Norwegian parts of Arctic Waters, the Greater North Sea and in the Celtic Seas. The surface feeding birds in the Greater North Sea and Celtic Seas frequently failed to raise young.
Area Assessed
Printable Summary
Background
Breeding failure is the extreme event of almost no chicks being produced by a seabird colony in a single breeding season. This assessment describes changes in breeding failure rates in seabird colonies throughout the North-East Atlantic. The assessment is based on how many chicks are fledged (having wing feathers that are large enough for flight) annually, per pair, clutch or nest.
For tern species, widespread breeding failure occurs when the percentage of colonies failing per year exceeds the mean percentage for the preceding 15 years. For all other species, widespread breeding failure occurs when the percentage of colonies failing per year exceeds 5%. Frequent breeding failure is when breeding failure occurs for four years or more out of six (2010-2015 inclusive).
As long-lived species with delayed maturity, changes in the productivity (number of fledged young per nesting pair) of seabirds are expected to reflect changes in environmental conditions long before these are evident as changes in population size. Breeding success or failure in marine birds can be a valuable indicator of population health, especially in areas where commercial fisheries and seabirds target the same prey. Therefore, results of this assessment should be viewed as an early warning of changes in the environment.
This Indicator Assessment has relevance to some of the seabird species included in the OSPAR List of Threatened and /or Declining Species and Habitats.
The seabirds in this assessment can be divided into two species groups based on how and where they feed at sea. Surface feeders forage on small fish, zooplankton and other invertebrates at or within the surface layer (the upper 1–2 m), whereas water column feeders dive below the surface to feed on fish and invertebrates (e.g. squid, zooplankton) at a broad range of depths or close to the seabed.
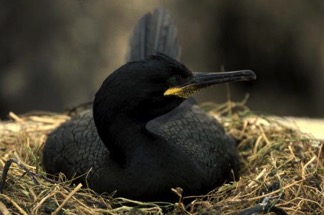
European shag (courtesy of Andy Webb)
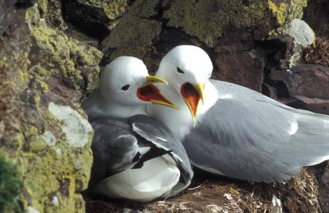
Black-legged kittiwake (courtesy of Matt Parsons)
Justification for the Indicator
Cook et al. (2014b) confirmed that colony failure rate could be used as an indicator of seabird population health in parts of the Greater North Sea where commercial fisheries and seabirds target the same prey. The indicator could also provide evidence of other impacts from human disturbance, contaminants and predation by invasive species. Natural factors may also affect this indicator, such as climate driven perturbations in prey-fish availability, and predation and disturbance from native predators (e.g. peregrine falcon and red fox). Distinguishing between natural and human-induced effects on breeding performance is challenging and not always possible.
Species Included in the Indicator Assessment
This assessment focuses on seabird species because there were insufficient data on other species of marine bird (waterfowl and shorebirds) that also use the marine environment when breeding. This assessment features species from the following taxa: petrels and shearwaters (Procellariiformes); gannets and cormorants (Suliformes); skuas, gulls, terns and auks (Charadriiformes).
Most of these species spend the majority of their time at sea, feeding on prey living within the water column (plankton, fish and squid) or detritus from the sea surface. Cormorants, gulls and terns tend to occur in inshore waters, whereas petrels, shearwaters, gannets, skuas and auks venture much further offshore and beyond the shelf break.
This Indicator Assessment has relevance to two seabird species included in the OSPAR List of Threatened and/or Declining Species and Habitats (OSPAR agreement 2008-6); black-legged kittiwake (Rissa tridactyla) and roseate tern (Sterna dougallii). Some of the lesser black-backed gull (Larus fuscus fuscus) colonies in Norwegian parts of the Arctic Waters may include wrongly counted fuscus sub-species due to similarities in the visual appearance of the sub-species.
The OSPAR List was developed on the basis of the Criteria for Identification of Species and Habitats in Need of Protection and their Method of Application (Texel-Faial Criteria) (OSPAR agreement 2003-13). Assessments of the abundance, distribution and condition of seabird species on the OSPAR List were prepared for the Quality Status Report 2010 (QSR 2010) and included in its supporting documentation.
The QSR 2010 did not include any quantitative assessment of breeding failure in the seabird community comparable with this indicator. Seabird breeding failure was addressed through reporting in relation to the Ecological Quality Objective (EcoQO) for local sandeel availability to black-legged kittiwakes.
Indicators of breeding failure were constructed using time series of annual mean breeding success (number of chicks fledged per pair, clutch or nest) of marine bird species at colonies throughout the North-East Atlantic (total counts or survey plots). A separate assessment was conducted for each species in each OSPAR Region. An assessment was also conducted for each sub-division of the Greater North Sea, as shown in Figure a, and the Norwegian parts of the Arctic Waters. Separate assessments were not conducted for each Arctic sub-division because there were too few colonies included in each sub-division.
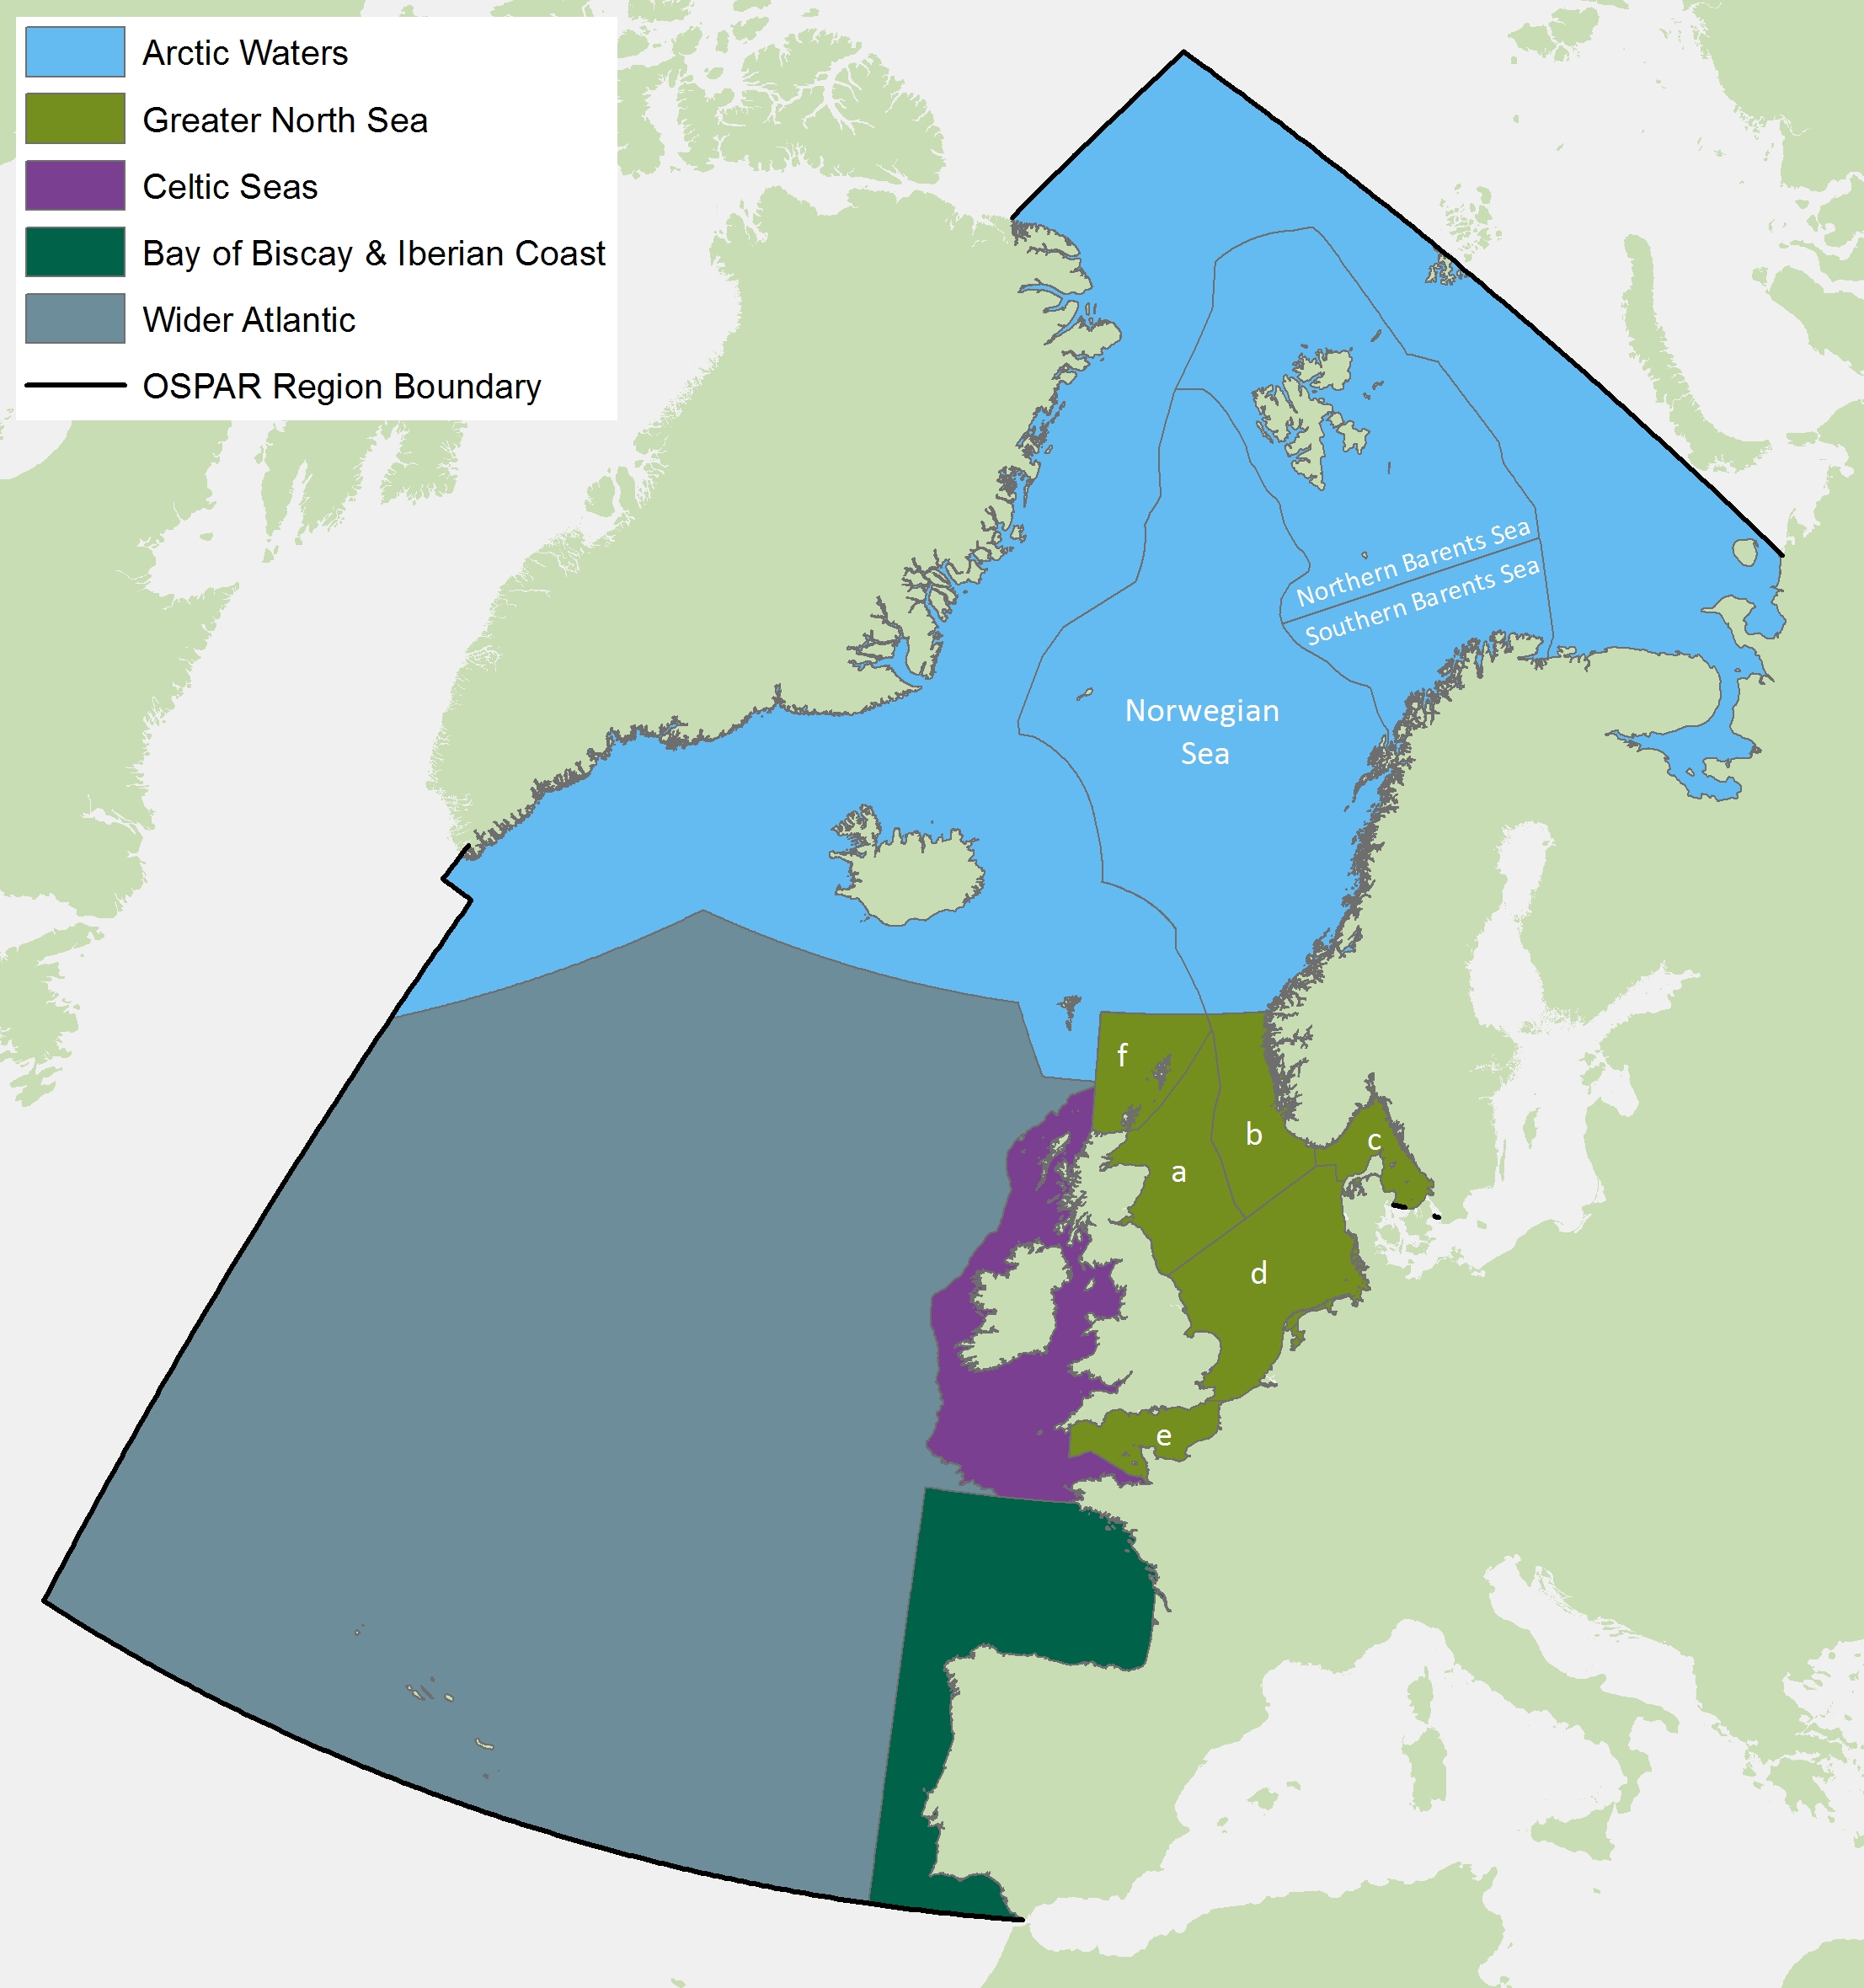
Figure a: Marine bird assessment units. Greater North Sea sub-divisions are a) North-east coast of Britain; b) west coast of Norway; c) Skagerrak/Kattegat; d) Southern North Sea; e) The English Channel; f) North coast of Scotland and the Northern Isles.
The breeding failure assessments for each species were constructed from time series of annual estimates of breeding success at a sample of colonies. The time series used covered the periods 1991–2015 for the Greater North Sea and Celtic Seas and 2010–2015 for the Norwegian parts of Arctic Waters. Not all colonies in the sample will have been observed every year in the time series, therefore (prior to the analysis) missing annual observations were predicted using models (for methodology see Trend Analysis).
Species-Specific Assessment of Breeding Failure
Rationale for Assessment Values
The assessment values applied for this indicator were developed by Cook et al. (2014a) and were agreed to be technically appropriate by the Joint OSPAR / ICES / HELCOM Working Group on Marine Birds (ICES 2015). The rationale and values are described in the following sections.
OSPAR Intermediate Assessment (IA) 2017 Indicator Assessment values are not necessarily to be considered as equivalent to proposed EU Marine Strategy Framework Directive (MSFD) criteria threshold values, however they can be used for the purposes of their MSFD obligations by those Contracting Parties that wish to do so.
Parameter / metric
‘Annual colony failure rate’, that is, the percentage of colonies failing per year, per species (from Cook et al. 2014a).
‘Failure’ is defined as when a colony fails to produce any young or produces very few young during a single breeding season. Failure is quantified by Cook et al. (2014a) as when the mean annual productivity of a breeding colony is 0.1 or less chicks per pair, clutch or nest. As failure could be interpreted as an unusual deviation from ‘normal’ levels of breeding success, the precise assessment value below which a colony is defined as failing may be different at some colonies, even for the same species. The assessment value used for determining failure can be adjusted according to knowledge of the colony in question. Ideally, the assessment value should be obtained from any clear response to important environmental factors such as low food availability (e.g. Cury et al. 2011). The assessment value of 0.1 chicks per pair, clutch or nest should be used as the default assessment value, unless there is good evidence to show that ‘failure’ of some species in some areas should be set at a different level (ICES 2015).
Trend analysis
The assessments for each species are constructed from a time series of annual estimates of breeding success at a sample of colonies. Not all colonies in the sample will have been observed every year in the time series. Missing annual observations were predicted using a Generalised Linear Model (GLM) framework with a binomial error structure (after Cook et al. 2014a and 2014b). Breeding success for each colony in each year was calculated, and where this value was 0.1 or less chicks per pair, clutch or nest, the colony was assessed as having failed in that year. Breeding success or failure was modelled in relation to year and site, because not all sites were covered in all years. The coefficient for each year was then taken to represent the probability of breeding failure occurring at any given site within that calendar year. The parameter ‘Year’ was included in the GLM as a fixed effect factor, rather than a random effect, so that the coefficients would not be constrained to follow a normal distribution.
To minimise the impact of differences in sampling rate, and to ensure that breeding success was likely to be representative of the colony as a whole, minimum criteria were set for inclusion of data within the model. Only those colonies at which a mean of ten nests were monitored for at least three years were considered. To prevent any individual site having an undue influence over the value of the coefficients, a jack-knife statistical approach was used, dropping each site from the model in turn. Models were run for each species in each sub-region in turn. The final indicator value presented for each species, in each sub-region, in each year is the mean probability of breeding failure calculated from each run of the jack-knife analysis.
Assessment
In summary, ‘breeding failure’ is when the annual mean breeding success of a colony is 0.1 or less chicks per pair, clutch or nest, and ‘annual colony failure rate’ is the percentage of colonies of species that are experiencing breeding failure in a single breeding season.
Breeding failure for each species was assessed in two stages:
1. Assessing if colony failure is widespread - the annual colony failure rate (the percentage of colonies experiencing breeding failure) can be considered to be ‘widespread’ if it exceeds the assessment values set for each species (see below).
2. Assessing the frequency of widespread breeding failure occurrence. Widespread breeding failure will be considered to be frequently occurring if it occurs in four years or more out of six.
Assessing if colony failure rate is widespread
The annual colony failure rate (the percentage of colonies failing) of each species was assessed against one of the two upper assessment values below, depending on the species. This was done for each region:
a) terns: mean percentage of colonies failing per year, over the preceding 15 years;
b) all species except terns: 5% of colonies failing per year.
The aim of the assessment values for annual colony failure rate is to identify widespread breeding failures and to differentiate large-scale impacts from local problems, where only a small proportion of colonies fail per year. The above assessment values were taken from Cook et al. (2014a), who tested various assessment values for each species.
A different assessment value was applied to the breeding failure rate of terns because they often desert colonies, sometimes before laying eggs, in response to local disturbances or impacts on food supply (Shealer and Kress 1991; Holt 1994; Cook et al. 2011). The assessment value for terns is designed to identify years of unusually high rates of breeding colony failure.
A fixed assessment value of 5% was appropriate for all other species that do not tend to desert colonies all at once. Cook et al. (2014a) found that years in which colony failure rate is more than 5% are much rarer in other species and they therefore provide a good indicator that pressures may be impacting on the population.
Assessing the frequency of widespread colony failure
For each species, the frequency of widespread colony failure was assessed over the most recent six-year period from 2010 to 2015, inclusive. A six-year period was chosen because it equals the length of the EU’s MSFD reporting cycle. To carry out an assessment of a species over a certain time period, there needed to be some observed data of breeding success at some colonies during the most recent year in the period (2015).
One or two years of widespread colony failure were considered as ‘acceptable’, given the wide range of possible natural and anthropogenic factors that could cause breeding failure in some species. The cumulative effect of widespread colony failure in four or more years out of six, was considered most likely to have a significant impact on recruitment into the regional population (Cook et al. 2014a). Low recruitment could lead to declines in population size and to affect the assessments of the OSPAR indicator on marine bird abundance.
Breeding failure is a ‘life history’ strategy for some species such as Arctic tern which, if conditions are sub-optimal, will desert a colony all at the same time, rather than remaining and trying, but failing, to raise young. Therefore, the definition of failure used in this indicator assessment (i.e. <0.1 chicks fledged per pair, clutch or nest) may provide an overly pessimistic indication of breeding performance in such species. However, this approach of assessing the frequency of widespread failure could reduce the chance of false negative assessments being made (ICES 2015).
Species Selection and Aggregation (functional groups)
There were sufficient time series data to conduct assessments of 16 species in the Norwegian parts of Arctic Waters, 20 in the Greater North Sea and 20 in the Celtic Seas. Overall, 25 different species were assessed in at least one region.
Some species were omitted from the regional assessments because the time series did not contain an estimate of breeding success in 2015 and the model was unable to predict missing values beyond the length of the time series. These included data from the Netherlands on common eider (Somateria mollissima), Eurasian spoonbill (Platalea leucorodia), pied avocet (Recurvirostra avosetta), and oystercatcher (Haematopus ostralegus) and from roseate tern (Sterna dougallii) colonies in Ireland (Celtic Seas). However, the breeding failure rates for these species in the years when data were available are presented in Figure b26 to Figure b29 for information.
Table a presents the five marine bird functional groups. The species assessed in each region were all seabirds from two of the five functional groups:
a) Surface feeders, which forage on small fish, zooplankton and other invertebrates at or within the surface layer (within 1 m to 2 m of the surface);
b) Water column feeders, which actively dive below the surface to a broad range of depths to feed on fish and invertebrates (for example, squid, zooplankton) in the water column or close to the seabed.
The 25 different species assessed and the functional groups to which they were assigned, are presented in Table b.
| Functional Group | Typical Feeding Behaviour | Typical Food Types | Additional Guidance |
|---|---|---|---|
| Wading feeders | Walk / wade in shallow waters | Invertebrates (molluscs, polychaetes, etc.) | |
| Surface feeders | Feed within the surface layer (within 1 m – 2 m of the surface) | Small fish, zooplankton and other invertebrates | “Surface layer” defined in relation to normal diving depth of plunge-divers (except gannets) |
| Water column feeders | Feed at a broad depth range in the water column | Pelagic and demersal fish and invertebrates (e.g. squid, zooplankton) | Include only species that usually dive by actively swimming underwater; but including gannets. Includes species feeding on benthic fish (e.g. flatfish). |
| Benthic feeders | Feed on the seabed | Invertebrates (e.g. molluscs, echinoderms) | |
| Grazing feeders | Grazing in intertidal areas and in shallow waters | Plants (e.g. eelgrass, saltmarsh plants), algae | Geese, swans and dabbling ducks, coot |
| Functional groups | Included in indicator assessment | ||||||||
|---|---|---|---|---|---|---|---|---|---|
| Species (English Name) | Species (Scientific Name) | Grazing feeders | Wading feeders | Surface feeders | Water column feeders | Benthic feeders | Arctic | Greater North Sea | Celtic Seas |
| Red-throated diver | Gavia stellata | X | |||||||
| Black-throated diver | Gavia arctica | X | |||||||
| Great Northern diver | Gavia immer | X | |||||||
| White-billed diver | Gavia adamsii | X | |||||||
| Great crested grebe | Podiceps cristatus | X | |||||||
| Red-necked Grebe | Podiceps grisegena | X | |||||||
| Slavonian grebe | Podiceps auritus | X | |||||||
| Northern Fulmar | Fulmarus glacialis | X | (X) | X | X | X | |||
| Sooty Shearwater | Puffinus griseus | X | (X) | ||||||
| Manx Shearwater | Puffinus puffinus | X | (X) | X | |||||
| Balearic shearwater | Puffinus mauretanicus | X | (X) | ||||||
| Cory's Shearwater | Calonectris diomedea | X | (X) | ||||||
| European Storm-petrel | Hydrobates pelagicus | X | (X) | ||||||
| Leach's Storm-petrel | Oceanodroma leucorhoa | X | (X) | ||||||
| Northern gannet | Morus bassanus | (X) | X | X | X | X | |||
| Great Cormorant | Phalacrocorax carbo | (X) | X | X | X | ||||
| European shag | Phalacrocorax aristotelis | X | (X) | X | X | X | |||
| Eurasian spoonbill | Platalea leucorodia | X | a | ||||||
| Mute Swan | Cygnus olor | X | |||||||
| Bewick's Swan | Cygnus bewickii | X | |||||||
| Whooper Swan | Cygnus cygnus | X | |||||||
| Greylag goose | Anser anser | X | |||||||
| Greenland white-fronted goose | Anser albifrons flavirostris | X | |||||||
| Canada Goose | Branta canadensis | X | |||||||
| Barnacle Goose | Branta leucopsis | X | |||||||
| Brent Goose | Branta bernicla | X | |||||||
| Shelduck | Tadorna tadorna | X | |||||||
| Wigeon | Anas penelope | X | |||||||
| Teal | Anas crecca | X | |||||||
| Mallard | Anas platyrhynchos | X | X | ||||||
| Pintail | Anas acuta | X | X | ||||||
| Shoveler | Anas clypeata | X | |||||||
| Pochard | Aythya ferina | X | |||||||
| Tufted Duck | Aythya fuligula | X | |||||||
| Greater Scaup | Aythya marila | X | |||||||
| Common Eider | Somateria mollissima | X | a | ||||||
| King eider | Somateria spectabilis | X | |||||||
| Steller’s eider | Polysticta stelleri | X | |||||||
| Long-tailed Duck | Clangula hyemalis | X | |||||||
| Common Scoter | Melanitta nigra | X | |||||||
| Velvet Scoter | Melanitta fusca | X | |||||||
| Goldeneye | Bucephala clangula | X | |||||||
| Common merganser | Mergus merganser | X | |||||||
| Red-breasted Merganser | Mergus serrator | X | |||||||
| Smew | Mergellus albellus | X | |||||||
| Coot | Fulica atra | X | |||||||
| Oystercatcher | Haematopus ostralegus | X | a | ||||||
| Black-winged Stilt | Himantopus himantopus | X | |||||||
| Pied avocet | Recurvirostra avosetta | X | a | ||||||
| Lapwing | Vanellus vanellus | X | |||||||
| Golden plover | Pluvialis apricaria | X | |||||||
| Grey Plover | Pluvialis squatarola | X | |||||||
| Ringed plover | Charadrius hiaticula | X | |||||||
| Kentish Plover | Charadrius alexandrinus | X | |||||||
| Bar-tailed Godwit | Limosa lapponica | X | |||||||
| Whimbrel | Numenius phaeopus | X | |||||||
| Curlew | Numenius arquata | X | |||||||
| Spotted Redshank | Tringa erythropus | X | |||||||
| Redshank | Tringa totanus | X | |||||||
| Greenshank | Tringa nebularia | X | |||||||
| Wood Sandpiper | Tringa glareola | X | |||||||
| Turnstone | Arenaria interpres | X | |||||||
| Red-necked Phalarope | Phalaropus lobatus | X | |||||||
| Grey Phalarope | Phalaropus fulicarius | X | |||||||
| Red Knot | Calidris canutus | X | |||||||
| Sanderling | Calidris alba | X | |||||||
| Little Stint | Calidris minuta | X | |||||||
| Curlew Sandpiper | Calidris ferruginea | X | |||||||
| Purple sandpiper | Calidris maritima | X | |||||||
| Dunlin | Calidris alpina schinzii & arctica | X | |||||||
| Ruff | Philomachus pugnax | X | |||||||
| Arctic skua | Stercorarius parasiticus | X | X | X | |||||
| Long-tailed Skua | Stercorarius longicaudus | X | |||||||
| Pomarine Skua | Stercorarius pomarinus | X | |||||||
| Great Skua | Stercorarius skua | X | X | X | X | ||||
| Glaucous gull | Larus hyperboreus | X | X | ||||||
| Great Black-backed Gull | Larus marinus | X | X | X | X | ||||
| Herring gull | Larus argentatus | X | X | X | X | X | |||
| Lesser black-backed gull | Larus fuscus intermedius/graellsii | X | X | X | X | X | |||
| Common Gull | Larus canus | X | X | X | X | ||||
| Mediterranean Gull | Larus melanocephalus | X | a | ||||||
| Black-headed Gull | Croicocephalus ridibundus | X | X | X | X | ||||
| Little Gull | Larus minutus | X | |||||||
| Black-legged kittiwake | Rissa tridactyla | X | X | X | X | ||||
| Ivory gull | Pagophila eburnea | X | |||||||
| Little Tern | Sternula albifrons | X | X | X | |||||
| Roseate tern | Sterna dougallii | X | X | ||||||
| Common tern | Sterna hirundo | X | X | X | |||||
| Arctic tern | Sterna paradisaea | X | X | X | |||||
| Sandwich tern | Sterna sandvicensis | X | X | X | |||||
| Black Tern | Chlidonias niger | X | |||||||
| Razorbill | Alca torda | X | X | X | X | ||||
| Common Guillemot | Uria aalge | X | X | X | X | ||||
| Brünnich’s guillemot | Uria lomvia | X | X | ||||||
| Black Guillemot | Cepphus grylle | X | X | X | |||||
| Little Auk | Alle alle | X | X | ||||||
| Puffin | Fratercula arctica | X | X | X | X | ||||
a denotes species that were omitted from the regional assessments because the time series did not contain an estimate of breeding success in 2015.
Results
For the six year period (2010 to 2015 inclusive), widespread seabird breeding failures frequently occurred in 35% of species assessed in the Greater North Sea, 25% in the Celtic Seas and 44% in the Norwegian parts of the Arctic Waters (Figure 1).
In the Celtic Seas and Greater North Sea, none of the six water column feeders showed frequent and widespread breeding failure during this period (Figure 1). In contrast, a third of surface feeders in the Celtic Seas and half the surface feeders in the Greater North Sea showed frequent and widespread breeding failure during the six year study period (Figure 1).
In the Norwegian parts of Arctic Waters, there was little difference between surface feeders and water column feeders, with up to 44% of species in each group showing frequent and widespread breeding failure during the six year study period (Figure 1).
The proportion of surface feeders experiencing widespread breeding failure has exceeded 25% in every year since 2007 in the Greater North Sea (Figure 3) and in every year since 2010 in the Celtic Seas (Figure 4) and in the Norwegian parts of Arctic Waters (except for 2012) (Figure 2).
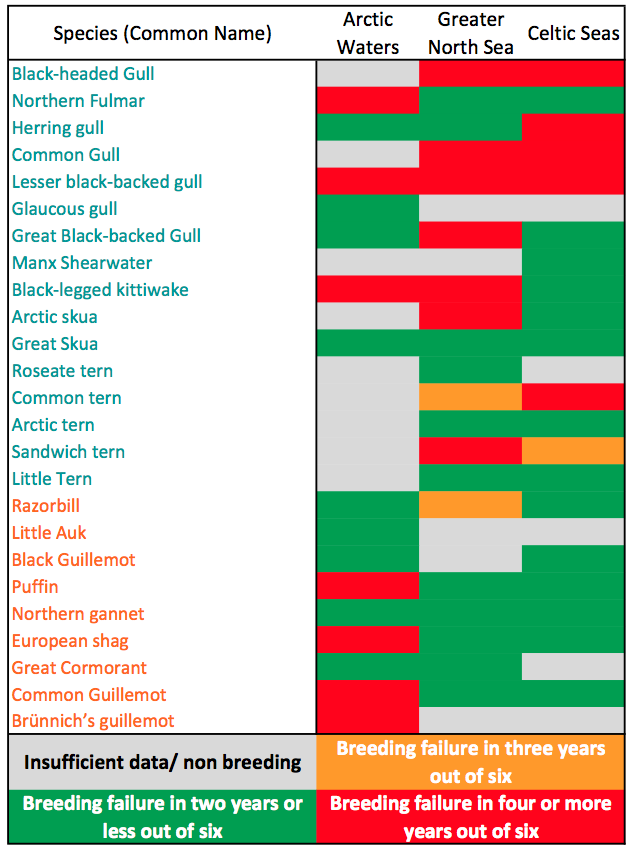
Figure 1: Frequency of widespread breeding failure for seabird species in the North-East Atlantic area (2010–2015 inclusive)
There is moderate / low confidence in the methodology used and moderate confidence in the data coverage.
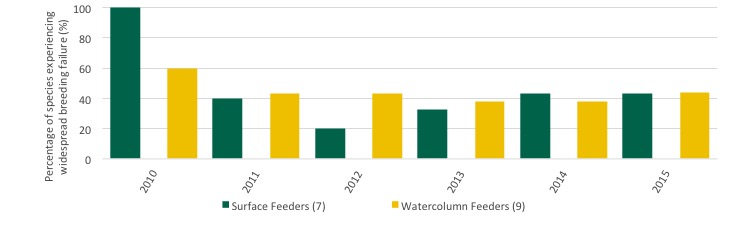
Figure 2: Change over time in the proportion of seabird colonies experiencing widespread breeding failure (for those species assessed each year), in Norwegian parts of Arctic Waters
Maximum number of species included per year in each group shown in brackets in the figure legend. Number of species varied each year depending on data availability.
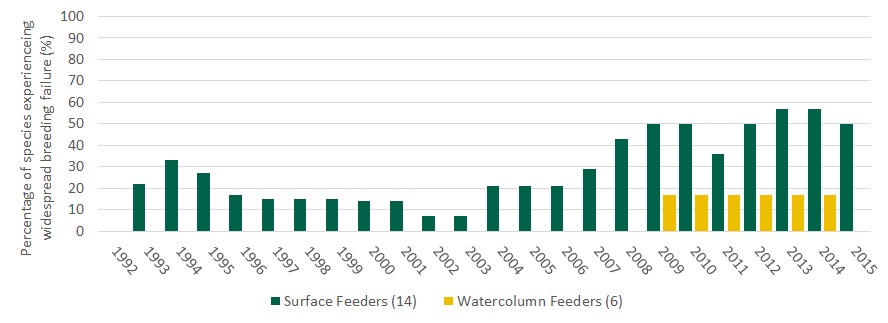
Figure 3: Changes in the proportion of marine bird species assessed, which have experienced widespread annual colony failures in each year in the Greater North Sea
Maximum number of species included per year in each group shown in brackets in the figure legend. Number of species varied each year depending on data availability.
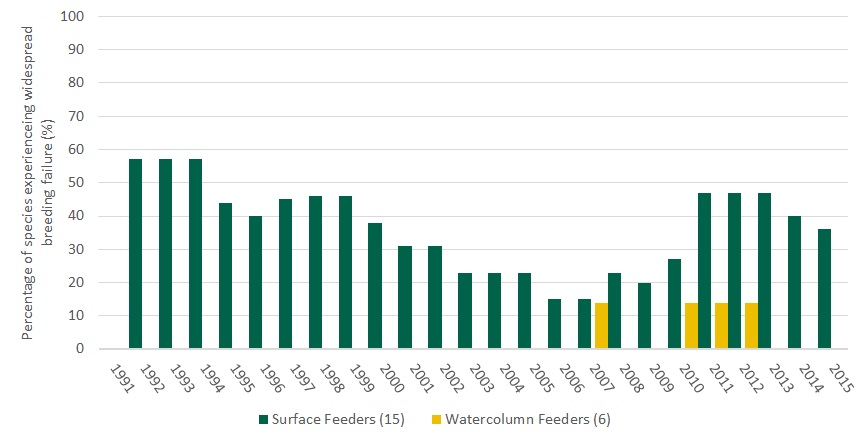
Figure 4: Changes in the proportion of marine bird species assessed, which have experienced widespread annual colony failures in each year, in the Celtic Seas
Maximum number of species included per year in each group shown in brackets in the figure legend. Number of species varied each year depending on data availability.
Species-Specific Assessments
Separate assessments were undertaken for Arctic Waters (Norwegian areas only, including Svalbard and Jan Mayen), the Greater North Sea and the Celtic Seas. No data were provided by OSPAR Countries for the Bay of Biscay and Iberian Coast, and Wider Atlantic, including Macaronesia sub-regions. The annual colony failure rate of each species was plotted separately for each region (Figures b1-25). Figures b26-29 present colony failure rates for species that were omitted from the regional assessment (as listed in Figure 1) because the time series did not contain an estimate of breeding success in 2015, i.e. common eider, Eurasian spoonbill, pied avocet, and oystercatcher. It should be noted that Figure b16 – roseate tern, shows colony failure rates for the Celtic Seas but these are not included in the regional assessment (as listed in Figure 1) because there were no data for roseate tern colonies in Ireland since 2013.
The maps in Figure c can be used to identify spatial patterns in breeding failure occurrence in all species assessed. Figures c16-29 also contain species that were not included in the regional assessments (those species included are listed in Figure 1).
The traffic light assessment was also conducted in each of the six sub-divisions of the Greater North Sea (see Figure a) and is shown in Figure d. The assessments in some sub-divisions were limited by data availability and should be viewed with caution. However, Figure d does demonstrate how this indicator assessment can be disaggregated into smaller assessment units. The sub-divisions which had incomplete spatial coverage of data were:
Sub-division (c) - Skagerrak/Kattegat – data limited to Norwegian coast;
Sub-division (d) - Southern North Sea – data limited to UK, Belgium and Netherlands coasts;
Sub-division (e) - The English Channel – data limited to UK coast, Jersey and Guernsey.
The species-specific indicator assessments (Figures b1 to b29) of annual colony failure between 1986 and 2015 can be downloaded here . A list of the species by figure number is as follows: Figure b1 northern fulmar, Figure b2 Manx shearwater, Figure b3 northern gannet, Figure b4 great cormorant, Figure b5 European shag, Figure b6 Arctic skua, Figure b7 great skua, Figure b8 glaucous gull, Figure b9 great black-backed gull, Figure b10 herring gull, Figure b11 lesser black-backed gull, Figure b12 common gull, Figure b13 black-headed gull, Figure b14 black-legged kittiwake, Figure b15 little tern, Figure b16 roseate tern, Figure b17 common tern, Figure b18 Arctic tern, Figure b19 Sandwich tern, Figure b20 razorbill, Figure b21 common guillemot, Figure b22 Brünnich’s guillemot, Figure b23 black guillemot, Figure b24 little auk, Figure b25 Atlantic puffin, Figure b26 oystercatcher, Figure b27 Eurasian spoonbill, Figure b28 pied avocet, and Figure b29 common eider.
In Figures b1 to b29, assessment values are shown as red dotted lines. The assessment value for tern species is the mean percentage of colonies failing per year, over the preceding 15 years. The assessment value for all other species (except terns) is 5% of colonies failing per year. The black dotted line denotes the mean percentage of colonies failing per year, over the preceding 15 years, where this is not used as the assessment value. All values below the assessment value are coloured green and all those above are coloured red and indicate ‘widespread breeding failure’.
The spatial distribution in breeding colony failures (Figures c1 to c29) can be downloaded here . A list of the species by figure number is as follows: Figure c1 northern fulmar, Figure c2 Manx shearwater, Figure c3 northern gannet, Figure c4 great cormorant, Figure c5 European shag, Figure c6 Arctic skua, Figure c7 great skua, Figure c8 glaucous gull, Figure c9 great black-backed gull, Figure c10 herring gull, Figure c11 lesser black-backed gull, Figure c12 common gull, Figure c13 black-headed gull, Figure c14 black-legged kittiwake, Figure c15 little tern, Figure c16 roseate tern, Figure c17 common tern, Figure c18 Arctic tern, Figure c19 Sandwich tern, Figure c20 razorbill, Figure c21 common guillemot, Figure c22 Brünnich’s guillemot, Figure c23 black guillemot, Figure c24 little auk, Figure c25 Atlantic puffin, Figure c26 oystercatcher, Figure c27 Eurasian spoonbill, Figure c28 pied avocet, and Figure c29 common eider.
In Figures c1 to c29, the pie charts show proportion of years during 2010 to 2015 in which breeding success was more than 0.1 chicks per pair (green), or 0.1 or less chicks per pair (red). Grey indicates number of years in which breeding success was not measured.
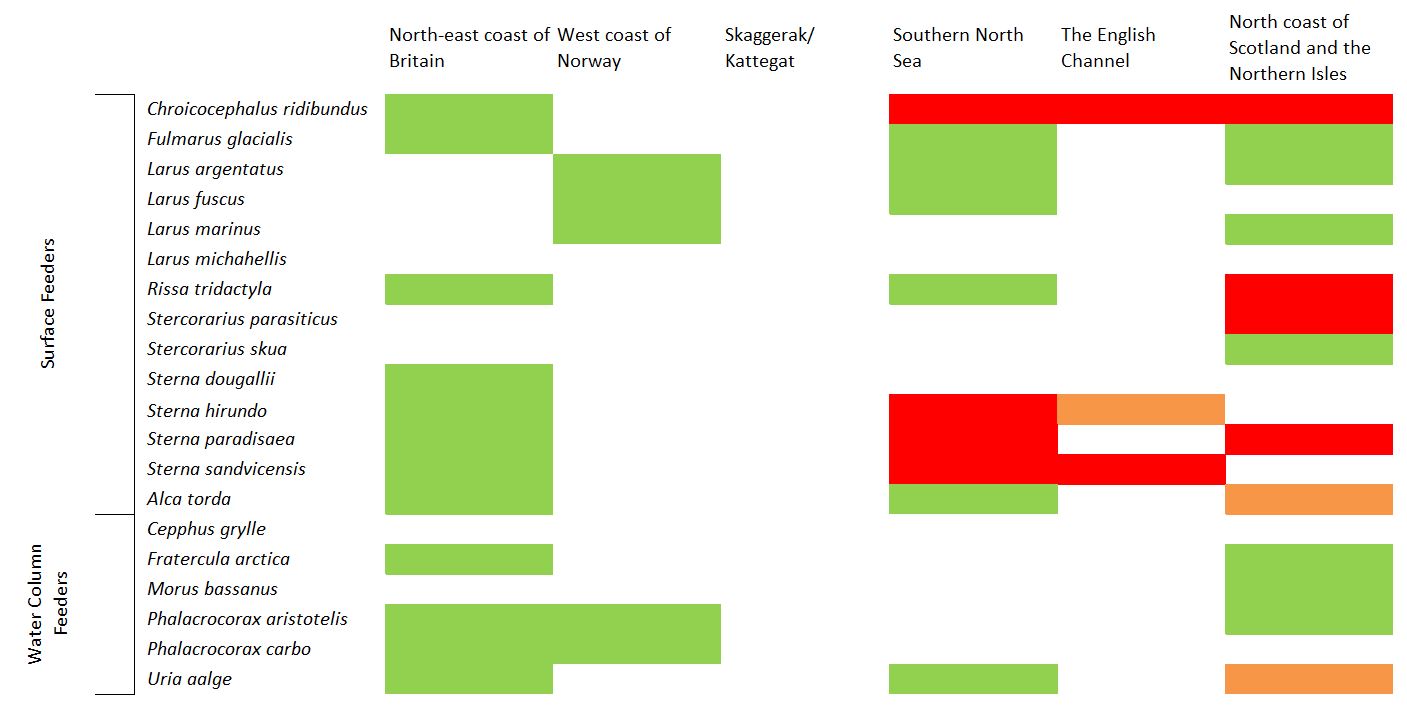
Figure d: Species-specific assessments of annual colony failure in the sub-divisions of the Greater North Sea
Species ordered by functional group. Colour of cells indicates the number of years during the six year assessment period (2010 to 2015) that annual colony failure rate was widespread (i.e. exceeded species-specific assessment values ): green = two years or less; orange cells = three years; red = four years or more. Greater North Sea sub-divisions are a) North-east coast of Britain; b) west coast of Norway; c) Skagerrak/Kattegat; d) Southern North Sea; e) The English Channel; f) North coast of Scotland and the Northern Isles.
Confidence Assessment
The methodology used has been developed specifically for this assessment and has not been used in a previously published assessment, therefore the confidence in the methodology is moderate / low. The assessment is undertaken using data with a mostly sufficient spatial coverage for the area assessed, but gaps are apparent in certain areas. Therefore the confidence in data coverage is moderate.
Conclusion
In the Greater North Sea and Celtic Seas, all seabird species that frequently failed to raise young feed on small fish in surface waters. Widespread breeding failure in seabird species feeding in deeper waters or at the seabed was far less frequent. This difference could be linked to the availability of small forage fish species at the surface (e.g. lesser sandeel and sprat) that are typical prey for various surface feeding species (e.g. black-legged kittiwake).
In the Norwegian parts of the Arctic Waters, an equal proportion of surface feeders and water column feeders exhibited widespread breeding failure. This suggests the availability of prey fish may be low throughout the water column in some areas (from the surface to the seabed), for example sandeel and young herring. Prey availability is likely to be driven by ecosystem specific changes, possibly initiated by commercial fisheries (past and present) in combination with climate change.
In all regions, breeding failure (especially for ground nesting terns and gulls and cliff nesting guillemots on open ledges) will reflect the combined result of factors such as predation and disturbance from native and non-native mammalian predators and by other birds. Likewise, disturbance by humans may also have an impact.
Knowledge Gaps
This Indicator Assessment does not include the Bay of Biscay and Iberian Coast or the Wider Atlantic, because data were not available for France, Spain and Portugal. The assessment for Arctic Waters was confined to Norwegian coasts (including High-Arctic islands) owing to a wider lack of data; other OSPAR Countries in the Arctic are encouraged to make data available for future assessments. In the Greater North Sea, areas outside the UK, Norway, the Netherlands and Belgium were not assessed due to lack of data. Data collected since 2012 in the Danish and German Wadden Sea were not available and these areas were therefore not included in the assessment.
| OSPAR Country | OSPAR Region | Country Region | Seabird Breeding Success | Waterbird Breeding Success |
|---|---|---|---|---|
| Norway | I (Barents Sea) | Barents Sea coasts, including Svalbard and Jan Mayen | Y | N |
| Russia | I (Barents Sea) | ? | ? | |
| Denmark | I (Greenland and Iceland Seas) | Greenland | ? | ? |
| Iceland | I (Greenland and Iceland Seas) | ? | ? | |
| Denmark | I (Faroes) | Faroe Islands | ? | ? |
| Norway | I (Norwegian Sea) | Norwegian Sea coast | Y | N |
| UK | II-a | Y | N | |
| Norway | II-b | Coast of western Norway | Y | N |
| Denmark | II-c | Skagerrak/Kattegat coast | N | N |
| Norway | II-c | Norwegian Skagerrak coast | Y | N |
| Sweden | II-c | N | N | |
| Belgium | II-d | Y | N | |
| Germany | II-d | Wadden Sea | Y | Y |
| Germany | II-d | Helgoland | A | N |
| Denmark | II-d | Wadden Sea | N | N |
| Denmark | II-d | North Sea coast Jutland | N | N |
| Netherlands | II-d | Y | Y | |
| UK | II-d | Y | N | |
| France | II-e | Nord Pas de Calais & Picardie | A | N |
| France | II-e | Normandy | A | N |
| UK | II-e | Y | N | |
| France | II-e | Brittany | A | N |
| France | III | Brittany | A | N |
| UK | III | Y | N | |
| Ireland | III | Y | ? | |
| France | IV | Pays de Loire, Poitou Charente, Aquitaine | A | N |
| Portugal | IV | ? | ? | |
| Spain | IV | A | N | |
| Portugal | V | Azores | ? | N |
Arctic Waters
The Arctic sub-region contains the highest concentrations of breeding seabirds in the North-East Atlantic. For the first time, this Indicator Assessment includes data from monitoring of seabird productivity along the Norwegian coasts (including Svalbard and Jan Mayen) of the Norwegian and Barents Seas. In future it would be beneficial if other Contracting Parties in the region could make their monitoring data available in a similar way.
Greater North Sea
Most countries in the Greater North Sea collect seabird productivity data and undertake some monitoring of a few breeding waterbird species (Table c). The main gap in data is in the Skagerrak and Kattegat where breeding success is measured along the Norwegian coast, possibly along the Swedish coast, but not along the Danish coast. There is a coordinated scheme of annual monitoring of breeding success within the Wadden Sea (Netherlands, Denmark and Germany) that was initiated in 2009 (monitoring in the Netherlands part of the Wadden Sea started in 2005). However, data collected by this scheme since 2012 in Denmark, Lower Saxony and Schleswig-Holstein (Germany) were not available and therefore these areas were not included in this assessment. Continued monitoring in these areas should mean they will be included in future assessments of this indicator.
Bay of Biscay and Iberian Coast
In the Bay of Biscay and Iberian Coast, monitoring of productivity in France and Spain has created time series of data suitable for constructing this Indicator Assessment, but in Spain this is restricted to a single species – the European shag (Table c). It is uncertain what productivity monitoring is carried out along the Portuguese mainland coast.
Wider Atlantic
Currently, the Azores, in partnership with the other Macaronesian archipelagos outside the OSPAR Maritime Area (Madeira and the Canary Islands) have been working to establish a common monitoring plan for breeding seabirds within the framework of an EU co-financed project, MISTIC Seas. If the plan is implemented, it would enable data on seabird breeding success (and other parameters) to be collected and used for future assessment cycles.
Assessment Methods: Knowledge Gaps
The ICES / OSPAR / HELCOM Joint Working Group on Marine Birds (JWGBird) developed this indicator assessment but has acknowledged some limitations (ICES 2015). The assessment methods for the marine bird breeding success / failure indicator currently focus on the extreme events of almost no chicks being produced by a colony, on average, per year. In doing so, they fail to identify other years where poor breeding success could still have significant negative impacts on the population in the longer term.
However, it is not straightforward to categorise annual breeding success as ‘good’ or ‘poor’. The reason breeding has not been directly assessed as ‘good’ or ‘poor’ in this indicator is because the number of chicks that need to be produced each year to sustain a population or cause it to grow, varies substantially as other demographic parameters (e.g. survival rates) also vary in space and time. Information on demographics such as survival rate, age at first breeding and immature survival rates are more resource demanding to measure owing to the need to monitor individual birds from year to year. For well-studied species and at a few intensively studied sites these data do exist.
A possible step forward towards setting accurate and objective targets for annual breeding success rates would be to collate an inventory of ongoing monitoring of survival rates in the North-East Atlantic and conduct a review of published estimates. Once survival estimates and other demographics have been collated, some simple population modelling could be undertaken to produce some preliminary estimates of the levels of breeding success required to sustain or increase the population.
Cook, A.S.C.P., Calbrade, N.A., Austin, G.E. and Burton, N.H.K. 2011. Determining foraging use of the Dee estuary by common terns from the recent declining colony at the Shotton Lagoons and Reedbeds SSSI. BTO report to CCW, Thetford.
Cook, A.S.C.P., Robinson, R.A. and Ross-Smith, V.H. 2014a. Development of MSFD Indicators, Baselines and Target for Seabird Breeding Failure Occurrence in the UK (2012), JNCC Report 539, ISSN 0963 8901.
Cook A.S.C.P., Dadam, D., Mitchell, I., Ross-Smith, V.H. and Robinson, R.A. 2014b. Indicators of seabird reproductive performance demonstrate the impact of commercial fisheries on seabird populations in the North Sea. Ecological Indicators 38: 1–11.
Cury, P.M., Boyd, I.L., Bonhommeau, S., Anker-Nilssen, T., Crawford, R.J.M., Furness, R.W., Mills, J.A., Murphy, E.J., Österblom H., Paleczny, M., Piatt, P.F., Roux, J.-P., Shannon, L. and Sydeman, W.J. 2011. Global seabird response to forage fish depletion – one-third for the birds. Science 334: 1703–1706.
Holt, D.W. 1994. Effects of short-eared owls on common tern colony desertion, reproduction, and mortality. Colonial Waterbirds 17: 1-6.
ICES. 2015. Report of the Joint ICES/OSPAR Working Group on Seabirds (JWGBird), 17–21 November 2014, Copenhagen, Denmark. ICES CM 2014/ACOM: 30. 115 pp.
ICES. 2015. Report of the Joint ICES/OSPAR/HELCOM Working Group on Seabirds (JWGBIRD), 9–13 November 2015, Copenhagen, Denmark. u117234. 42 pp.
Shealer, D.A. and Kress, S.W. 1991. Nocturnal abandonment response to black-crowned night-heron disturbance in a common tern colony. Colonial Waterbirds, 14, 51-56.
| Sheet reference | BDC17/D107 |
|---|---|
| Assessment type | Intermediate Assessment |
| Context (1) | Biological Diversity and Ecosystems - Targeted actions for the protection and conservation of species, habitats and ecosystem processes |
| Context (2) | CEMP Guideline B3 Marine Bird breeding success and failure (in prep) |
| Context (3) | D1 - Biological Diversity |
| Context (4) | D1.3 - Population Condition |
secretariat@ospar.org | |
| Metadata date | 2015-11-08 |
| Title | Marine bird breeding success or failure |
| Resource abstract | Common indicator assessment of B3-Marine bird breeding success/failure. Applicable to OSPAR Regions I (Arctic Waters) II (Greater North Sea), III (Celtic Seas). Over the last decade, widespread breeding failure has occurred frequently in a growing number of seabird species across the Greater North Sea, Celtic Seas and Norwegian parts of Arctic Waters. In the Greater North Sea and Celtic Seas, species that frequently failed to raise young all feed on small fish at the surface. |
| Linkage | https://www.ospar.org/work-areas/bdc/species-habitats/list-of-threatened-declining-species-habitats |
| Topic category | Environment |
| Indirect spatial reference | L2.1.1;L2.1.2;L2.1.4;L2.2.1;L2.2.3;L2.2.8;L2.2.5;L2.2.6;L2.2.7;L2.3.1;L2.3.2;L2.3.3;L2.2.2;L2.2.4 |
| N Lat | 81.172826679208 |
| E Lon | 51.0000830647817 |
| S Lat | 48.0000507707265 |
| W Lon | -13.6295555748299 |
| Countries | BE, DE, IE, NL, NO, UK |
| Start date | 1986-01-01 |
| End date | 2015-12-31 |
| Conditions applying to access and use | https://www.ospar.org/site/assets/files/1215/ospar_data_conditions_of_use.pdf |
| Data Snapshot | https://odims.ospar.org/documents/191/download |
| Data Results | https://odims.ospar.org/documents/192/download |
| Data Source | http://biodiversity.ices.dk |