

Seal Abundance and Distribution
D1 - Biological Diversity
D1.1 - Species distribution D1.2 - Population size
Atlantic grey seals and harbour seals are resident in the Greater North Sea and Celtic Seas. Harbour seal abundance is stable or increasing in most of the Greater North Sea, but declining in a few areas. The reasons for this decline are unclear. Grey seal abundance is increasing and distribution is stable.
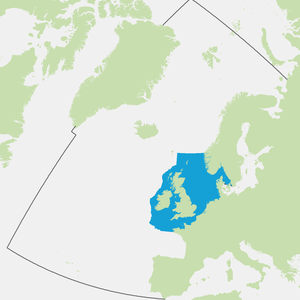
Area Assessed
Printable Summary
Background
Atlantic grey seals and harbour seals are both regularly found in the Greater North Sea and Celtic Seas. As higher predators, seals can be used as an indicator to reflect the state of the marine ecosystem. This assessment of seal abundance and distribution aims to determine if populations of both species are in a healthy state, with no long-term decrease in population size, beyond natural variability. Historically, populations have declined due to anthropogenic influences. This assessment will help to determine trends in abundance.
Seal abundance and distribution are influenced by many factors, such as disease, competition with other species, changes in the distribution and abundance of prey, disturbance and interactions with fisheries. Seals were hunted into the 20th century, and as a result have disappeared entirely in some areas, but are now protected in most areas of Europe.
Future changes in distribution or declines in abundance may signal that populations are no longer in a healthy state. Further studies would then be needed to establish the cause of these changes and to determine whether management measures are required.
The conservation status of harbour seals and grey seals is also assessed under the European Union Habitats Directive (Council Directive 92/43/EEC).
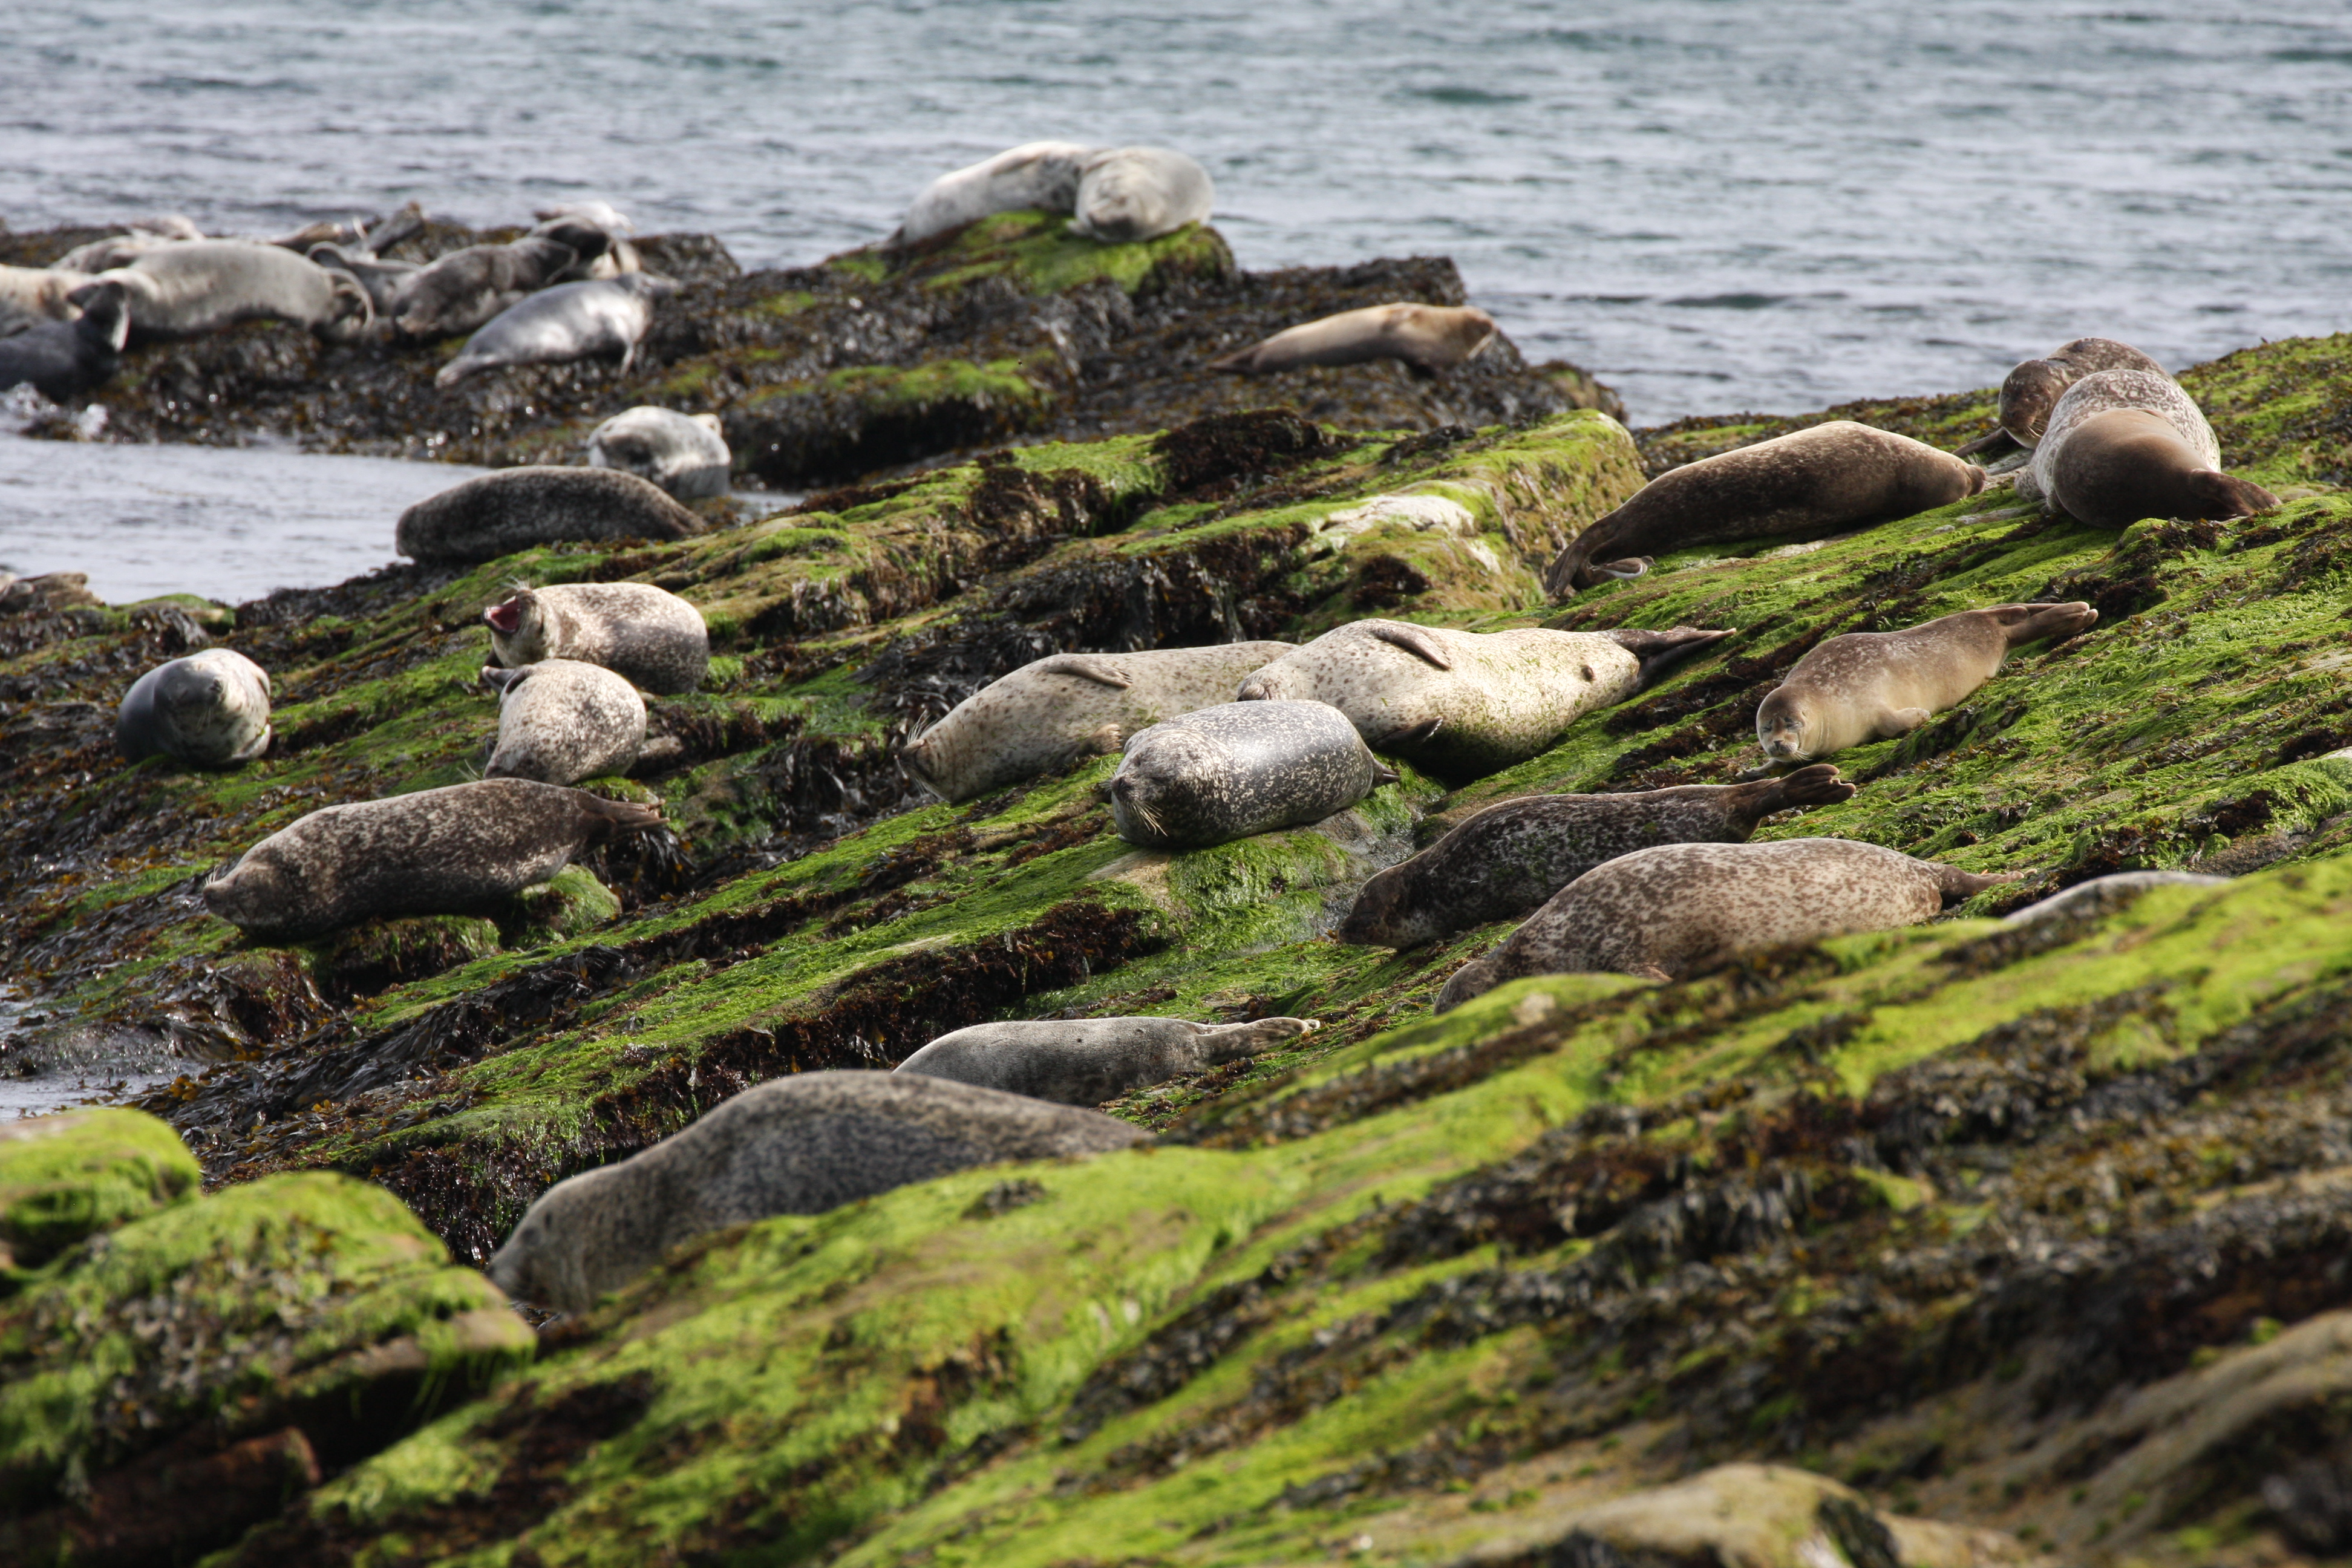
Harbour seals (courtesy of Silje-Kristin Jensen, Sea Mammal Research Unit)
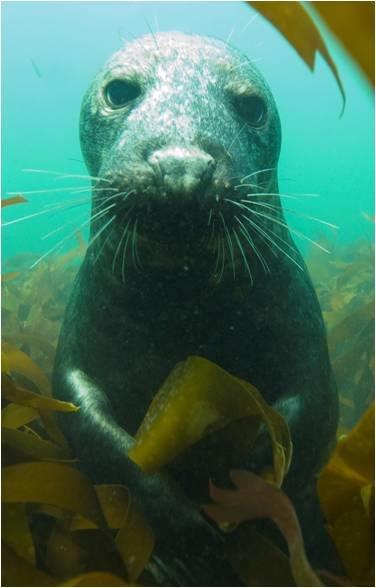
Atlantic grey seal (courtesy of John Weinberg)
Seal populations were highlighted in the OSPAR Quality Status Report (QSR) 2010 by means of the two OSPAR Ecological Quality Objectives (EcoQOs) applied in the Greater North Sea. The harbour seal EcoQO was not met in several areas, where declines in seal populations of more than 10% occurred between 2001 and 2006 (Shetland, Orkney, east of Scotland, east coast of England, Limfjorden in Denmark and west Norway). Of these areas only the Limfjorden had been affected by morbillovirus in the years assessed. The reasons for changes in the other areas are not yet clear. The EcoQO for no decline of greater than 10% in grey seal pup production over a five-year running mean was assessed as met in all areas of the Greater North Sea with relevant populations and where data were reported. It should be noted that the EcoQOs are not equivalent to either of the assessment values applied in this assessment.
Overview
This indicator assessment uses estimates of seal numbers from monitoring programmes that count seals on land when they are moulting or breeding, for two species: Atlantic grey seal (Halichoerus grypus) and harbour seal (Phoca vitulina). Assessments were not possible along the Norwegian North Sea coast because not enough annual counts had been conducted. Data for Ireland were not available for this assessment. Sweden provided data but due to differences in formatting and spatial resolution the data could not be used. Furthermore the grey seal population is too small in Swedish waters in the Skagerrak and Kattegat to provide a robust assessment.
Assessments of changes in abundance and distribution were made within discrete geographical areas of coastline, or ‘Assessment Units’ (AUs). The seals counted within each AU are more likely to forage in a similar area of the sea and to be more closely related to one another. Grey seals forage across a much wider area, so their abundance is assessed across the whole of the Greater North Sea and the United Kingdom (UK) part of the Celtic Seas using a single AU (Figure a). The large number of small AUs for harbour seals (Figure b) reflects the fact that they tend to range over shorter distances.
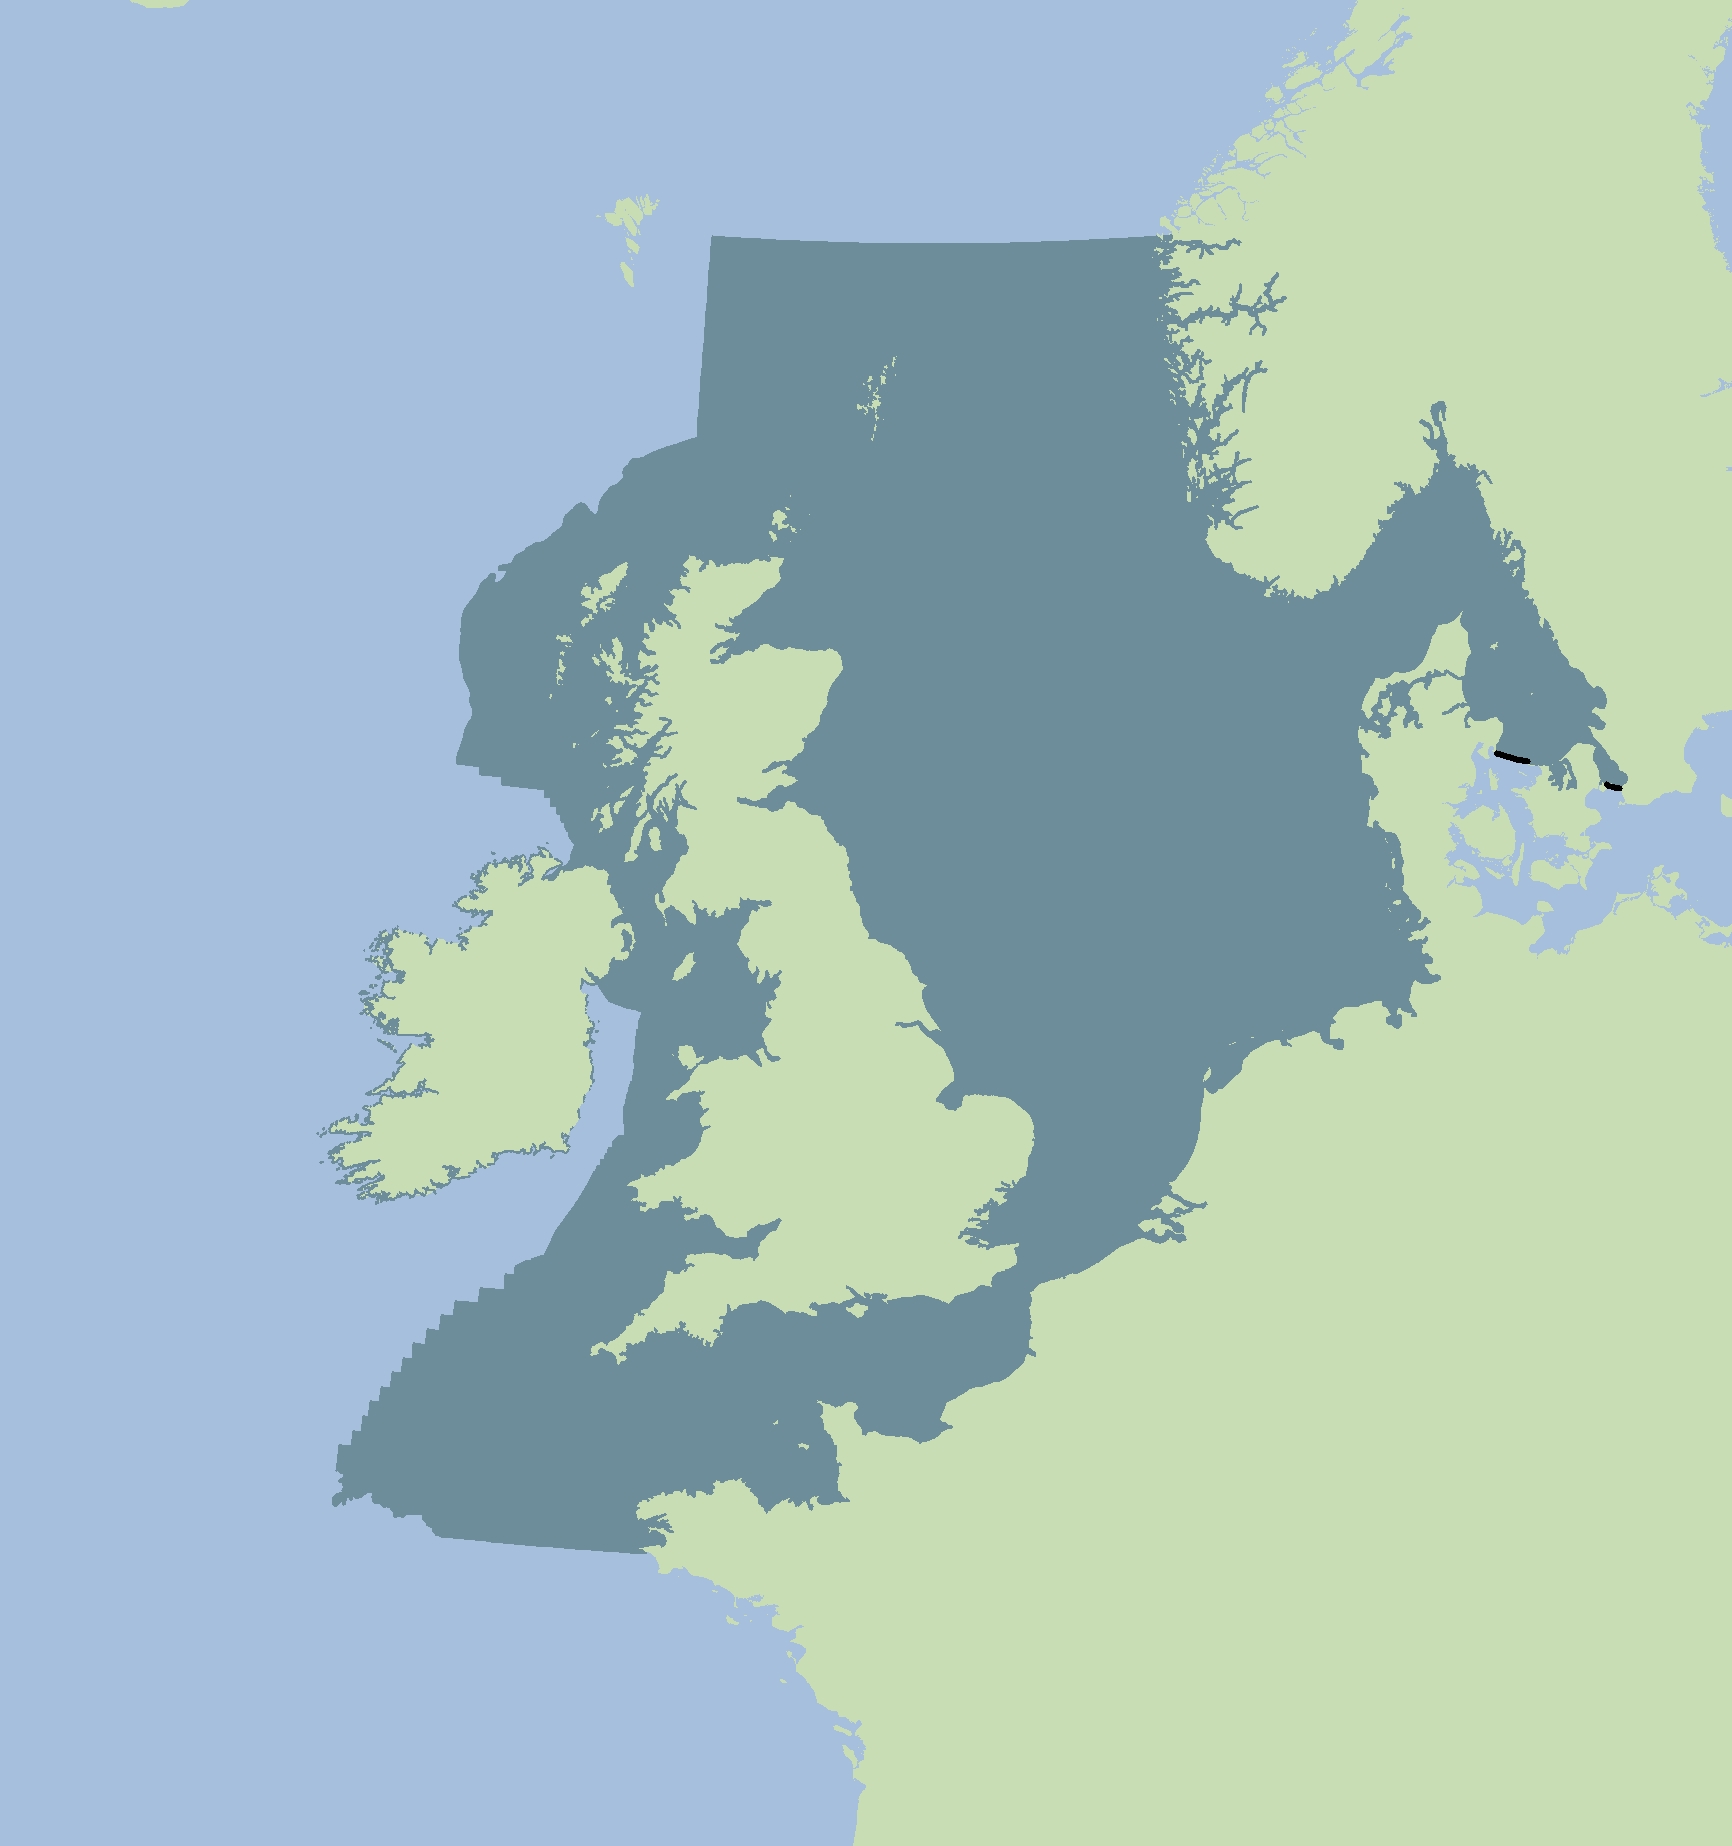
Figure a: Assessment Unit for grey seal abundance
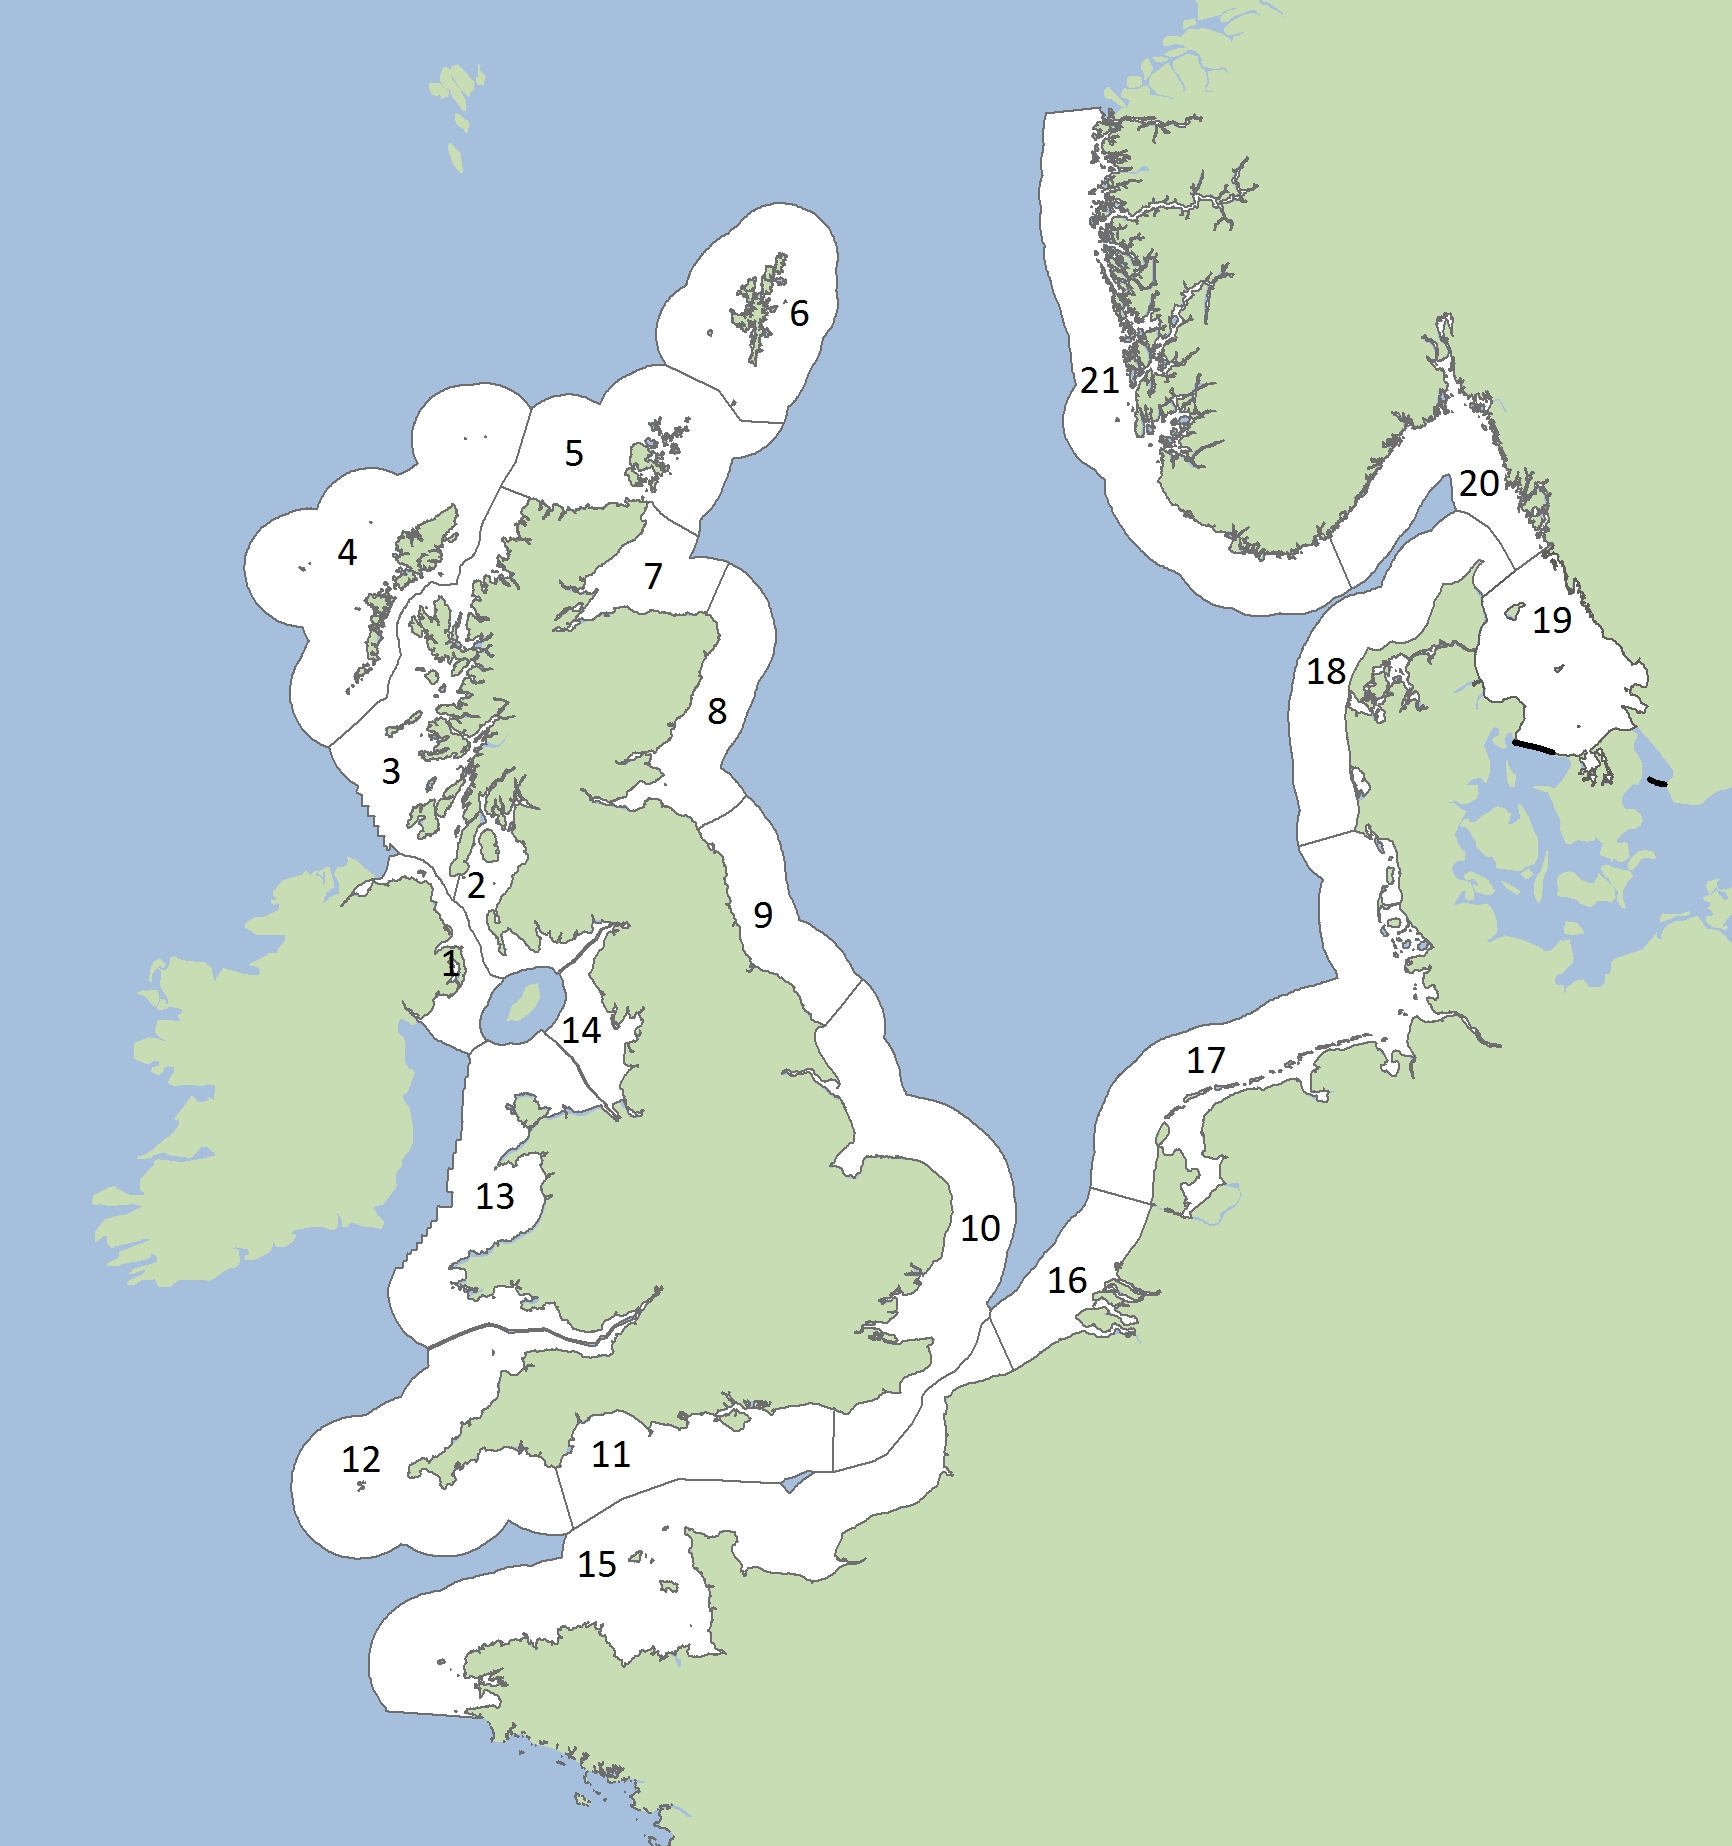
Figure b: Assessment Units for harbour seal abundance and distribution and for grey seal distribution (see AU key)
Trends in the abundance of harbour seals counted during the annual moult (every August) were assessed within each AU. Total abundance of grey seals in the single large AU was modelled using summer counts of adult grey seals and counts of pups at grey seal colonies during the autumn and winter for the Wadden Sea area. In addition, trends in the abundance of grey seals counted during their spring moult were assessed in areas where such surveys took place. Trends in both species were assessed over the short term (2009–2014) and over the long term (1992–2014, for most areas).
The presence or absence of seals at monitored haul-out and breeding sites was used to assess changes in the number of sites occupied (‘occupancy rate’) and the number of sites deserted or newly colonised (‘distributional shift’). Changes in occupancy rate and distributional shift were compared between the periods 2003–2008 and 2009–2014 for both species in each of the AUs used for the harbour seal abundance assessment (Figure b). Seal abundance surveys are not designed to detect changes in distribution; they reflect the distribution of seals only at specific times of the year. Therefore, change in distribution is used as a ‘surveillance indicator’ to help interpret changes in abundance. The distribution metrics were not compared to any assessment values.
Seal Monitoring in the North-East Atlantic
Grey seals and harbour seals are surveyed when they come ashore (‘haul-out’) and can be most easily counted. Surveys are usually conducted from the air, but may also be conducted from land or by boat. In most areas, aerial surveyors take photographs of the haul-out sites and animals are later counted from the images (see example in Figure c).
There are two periods during the year when most grey and harbour seal surveys take place: breeding (pupping) and moulting. Harbour seals give birth to pups in early summer and moult after breeding in late summer. Grey seals pup in the autumn or winter and moult in early spring. The frequency of surveys during these periods varies across OSPAR Contracting Parties due to differences in the total number of resident animals, funding, geography and historical development of the monitoring programmes. Repeated surveys of both grey and harbour seals throughout the year are not economically feasible and Contracting Parties use population censuses in one or perhaps two seasons of the year. For grey seals in particular, choosing an ideal single time to survey is difficult because of the potential for discrepancies between the breeding population and the population present during other times of the year (Brasseur et al. 2015; Russell et al. 2013). Table a provides details of current and known seal monitoring programmes in each Assessment Unit.
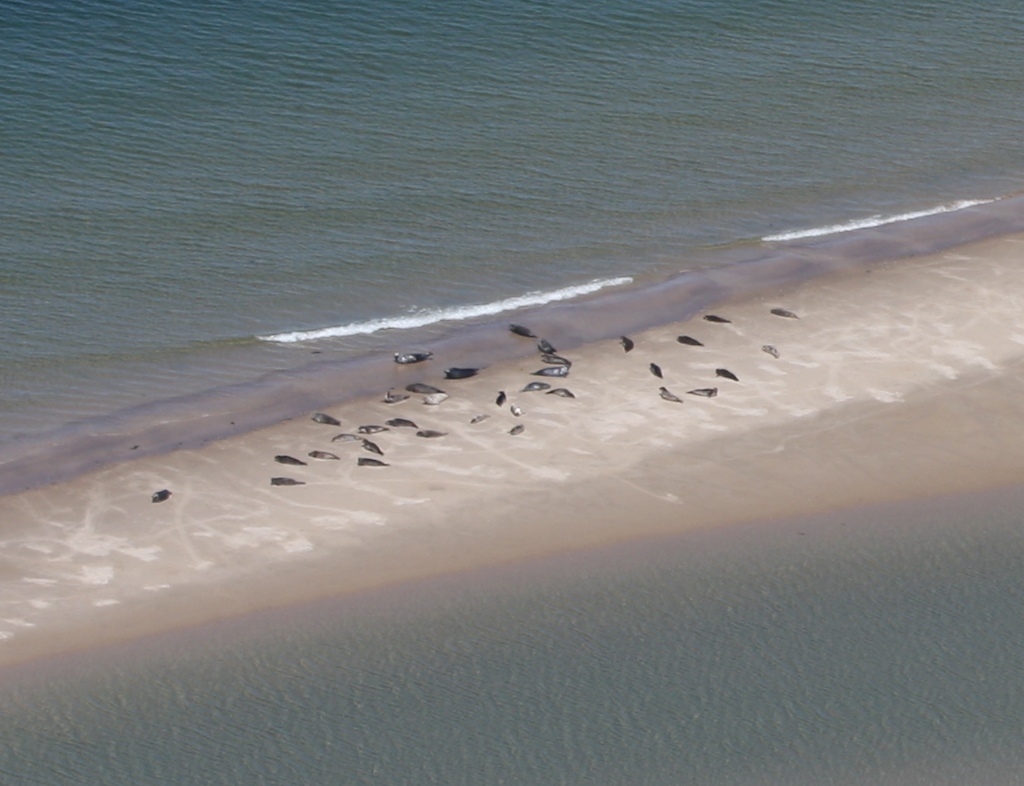
Figure c: Aerial survey image of harbour seals hauled-out (courtesy of Chris Morris, Sea Mammal Research Unit)
| OSPAR indicator | Seal abundance and distribution | Grey seal pup production | ||||
|---|---|---|---|---|---|---|
| Species | Grey seals (ALL AGES) | Harbour seals (ALL AGES) | Grey seals (PUPS) | |||
| Metric | August counts (in conjunction with harbour seal moult counts) | Moult counts (spring) | August moult counts | Pup Counts (number of pups present at any one time) | Pup production (total number of pups produced during entire breeding season) | |
| United Kingdom | Northern Ireland | Single aerial survey approx every 5 years | Single aerial survey approx every 5 years | SMRU partial survey 2002, 2005; Boat-based monthly surveys of Strangford Lough | ||
| Southwest Scotland | Single aerial survey approx every 5 years | Single aerial survey approx every 5 years | No formal monitoring as population very low | |||
| West Scotland | Single aerial survey approx every 5 years | Single aerial survey approx every 5 years | Repeat aerial survey, annual to 2010 biennial thereafter | |||
| Western Isles | Single aerial survey approx every 5 years | Single aerial survey approx every 5 years | Repeat aerial survey, annual to 2010 biennial thereafter | |||
| Orkney & North coast | Single aerial survey approx every 5 years | Single aerial survey approx every 5 years | Repeat aerial survey, annual to 2010 biennial thereafter | |||
| Shetland | Single aerial survey approx every 5 years | Single aerial survey approx every 5 years | Ground count, annual since 2004 | |||
| Moray Firth | Repeat aerial survey, annual | Repeat aerial survey, annual | Repeat aerial survey, annual to 2010 biennial thereafter | |||
| East coast Scotland | Single aerial survey, annual | Single aerial survey, annual | Repeat aerial survey, annual to 2010 biennial thereafter | |||
| Northeast England | No formal monitoring as population very low | No formal monitoring as population very low | Ground count, annual | |||
| Southeast England | Repeat aerial survey, annual | Repeat aerial survey, annual | Ground count, annual | |||
| South England | ||||||
| Southwest England | ||||||
| Wales | ||||||
| Northwest England | ||||||
| France | French North Sea & Channel coasts | Combination aerial and land surveys, approx 2-3 per month | Combination aerial and land surveys, approx 2-3 per month | Combination aerial and land surveys, approx 2-3 per month | Monthly ground surveys | |
| Denmark | Wadden Sea | Repeat aerial survey, annual | Repeat aerial survey, annual | Repeat aerial survey, annual | Repeat aerial survey, annual from 2008 | |
| Limfjord | Repeat aerial survey, annual | Repeat aerial survey, annual from 2015 | Repeat aerial survey, annual | Repeat aerial survey, annual from 2015 | ||
| Kattegat | Repeat aerial survey, annual | Repeat aerial survey, annual | Repeat aerial survey, annual | |||
| Netherlands | Wadden Sea | Repeat aerial survey, annual | Repeat aerial survey, annual | Repeat aerial survey, annual | Repeat aerial survey, annual from 2001 | |
| Dutch Delta | Monthly aerial survey | Monthly aerial survey | Monthly aerial survey | Monthly aerial surveys have not yeilded a credible pup production in the area | ||
| Germany | Wadden Sea (inc Helgoland) | Repeat aerial survey for harbour seals with recording of incidental grey seal sigthings,annual | Repeat aerial survey, annual | Repeat aerial survey, annual | Repeat aerial (Lower Saxony + Hamburg, from 2016 onwards also Schleswig-Holstein) or ground/ship based (Schleswig-Holstein, Helgoland) survey, annual from 2008 | |
| Norway | Norwegian west coast, south of 62N | Single aerial survey approx every 5 years | Ground count at least every 5 years | |||
| Northern Skagerrak and Oslo Fjord | Aerial survey, annual | |||||
All Contracting Parties have some form of monitoring in place for harbour seals during their annual summer moulting period, this is when the probability that animals will haul-out and be detectable during a survey is highest. Minimum abundance can be estimated from these counts. Using telemetry data, the proportion of seals hauled-out during the survey window is estimated.
Grey seals are also counted during the harbour seal surveys (except in Norway). The number of grey seals hauled-out during the harbour seal moult can be very variable. In all AUs outside the United Kingdom and Norway, grey seals are also counted during their annual moult period in early spring. The total number of grey seal pups born at colonies during the autumn / winter breeding season is also counted.
Spatial Scope: Assessment Units
The European populations of grey and harbour seals were sub-divided into a number of AUs (Figure a and Figure b). These AUs were based on proposals by the International Council for the Exploration of the Sea (ICES, 2014a) and cover the full distributional range for both species. It is important to note that AUs do not represent demographically independent populations. In addition, survey coverage and monitoring effort is high for both species where they are most abundant. In some AUs monitoring is undertaken in specific areas by local organisations and does not form part of synoptic national survey programmes (see Table a for details of monitoring programmes in each AU).
Grey Seal Assessment Units
Grey seals range more widely at sea than harbour seals and may visit multiple distant haul-out sites (McConnell et al., 1999). Immigration of grey seals may account for as much as 35% of the observed population growth in the Dutch Wadden Sea (Brasseur et al., 2015) and hundreds of adults from the United Kingdom visit the area temporarily. Grey seal abundance was therefore assessed across the whole of the Greater North Sea and Celtic Seas as a single AU (Figure a). Assessments were not possible along the Norwegian North Sea coast because not enough annual counts had been conducted. It is important to note that grey seal populations exist along the coast of Ireland but data from Ireland were not available to be included in this assessment. Additionally grey seal populations in Sweden were too small for a robust assessment.
A single large AU was not considered appropriate for assessing the distribution of grey seals because of the substantial loss of local-scale information. Grey seal distribution was therefore assessed using the smaller AUs already defined for harbour seals (Figure b).
Despite their ability to travel long distances, individual mature grey seals of both sexes are usually faithful to particular breeding sites, and may return to within 10–100 m of individual breeding locations (Pomeroy et al., 2000). Insights into the seasonal movement of grey seals in the United Kingdom from telemetry data indicate that grey seal breeding distribution can be considerably different from their foraging distribution during other times of the year (Russell et al., 2013). Grey seal distribution metrics are presented both for the breeding (i.e. colony locations) and non-breeding seasons (i.e. moult) where this information is available.
Harbour Seal Assessment Units
The harbour seal AUs are shown in Figure b. The AUs in the Greater North Sea are broadly similar to those previously defined as OSPAR Ecological Quality Objectives (EcoQO) sub-units. The AUs for harbour seal are much smaller than those used for grey seal because harbour seals tend to undertake shorter excursions from their favoured haul-out sites, and there is some evidence of population structuring in European harbour seals (e.g. Goodman, 1998; Olsen et al., 2014).
In the Celtic Seas, only data from United Kingdom sites were available for assessment. Harbour seal populations do exist along the coast of Ireland, but no data were available because data density could not support the assessment.
Data Collation
All Contracting Parties were asked to provide data on grey seals and harbour seals for the period 1992–2014. Data were received from Denmark, France, Germany, the Netherlands, Norway and the United Kingdom. Counts were provided for individual haul-out sites (both species) and breeding colonies (grey seals only) and summed to give a single number for that year for that AU. Not all Contracting Parties monitor all sites annually. Assessment of trends in abundance of both species was only completed where at least four annual data points were available.
Grey Seal Abundance Estimation
The data provided and used in this assessment comprised: grey seal counts conducted during surveys of harbour seals in their summer moult period (August), counts of grey seal pups made at breeding colonies in the autumn / winter, and counts during the grey seal moult period which follows the breeding season in early spring.
The summer counts of grey seals (made during surveys of harbour seals in their summer moult period) can be variable and are not, on their own, a reliable estimate of the size of the grey seal breeding population. There are three reasons for this: a large proportion of grey seals will not be hauled-out on land and thus counted during the harbour seal moult, and this proportion can vary widely; animals counted in a particular location during the summer are not necessarily those that breed in the same area, because grey seals may travel extensively between breeding and foraging sites (Russell et al., 2013; Brasseur et al., 2015); and in summer more grey seals lie in the midst of harbour seals, potentially leading to confusion between the species and over-estimation or under-estimation is more likely to occur at this time than in other seasons.
The first of these concerns can be addressed by estimating the proportion of time grey seals spent hauled-out during August surveys using telemetry (geolocation) data. However, all of these points have been addressed by some Contracting Parties who use counts made during the harbour seal moult period as estimates of abundance. Such data are not extensively collected in the United Kingdom where a large proportion of the grey seal population is found.
Data for grey seal pup counts, which is separately assessed in the Grey Seal Pup Production indicator , are collected by most Contracting Parties. The fact that grey seals form large breeding colonies in the autumn and winter provides an indirect way to estimate abundance by counting the number of pups born or ‘produced’ at a colony. Multiple surveys are conducted and the number of pups is either reported as the maximum of multiple counts (referred to as peak pup counts), or is used in an established statistical model to provide an estimate of the total number of pups produced at that colony during the entire breeding season (referred to as pup production). Data from the United Kingdom were provided in the form of pup production. Peak pup counts (provided by other Contracting Parties) are an under-estimate of pup production. In order to estimate pup production from peak pup counts, a pup production curve was fitted to the United Kingdom pup counts to generate an estimate of pup production and to estimate a scalar between peak counts and pup production. If less than four counts were conducted, this scalar was used to raise the peak pup count to pup production.
Pup production estimates and prior knowledge of life history parameters (e.g. pup survival, adult survival, fecundity) were incorporated into a Bayesian state-space model currently used by the Seal Mammal Research Unit (SMRU) in the United Kingdom to estimate total population size and life history parameters (SCOS, 2014). This model had to be fitted at a sub-regional level because previous work in the United Kingdom has shown that pup survival is density-dependent and acts on a more local scale. Movement of females was also estimated, recognising that some females born in the United Kingdom recruit into the breeding population in continental Europe (Brasseur et al., 2015). Like pup survival, movement was assumed to be density-dependent.
The population model provides estimates of total grey seal abundance for the Greater North Sea (except Norway and Sweden) and the United Kingdom part of the Celtic Seas. These model outputs were then ‘checked’ with another form of information: the total number of grey seals estimated from summer counts in a single year. The total grey seal summer population of the Greater North Sea (excluding Norway because grey seals are not counted here during the summer months) and the United Kingdom part of the Celtic Seas was estimated using summer haul-out counts in 2008. This was the year (2008) with the most comprehensive survey coverage in Scotland, where the majority of the population is found. If no counts were made in 2008 for an area but there were counts made both before and after 2008, the count in 2008 was estimated (interpolated) from these counts. If there were only counts either before or after 2008, the count from the nearest year was used. Lonergan et al. (2011) used telemetry data to estimate that grey seals in the United Kingdom spend 31% of the time hauled-out during the usual survey window. This was used to estimate the total United Kingdom population from observed counts during summer 2008 . The annual estimates produced by the pup production model were refined by inputting the estimated summer population in 2008. For further details of the analytical method, and its development see SCOS (2014).
Baselines
Seals have been hunted both illegally and legally for a long time and it is not possible to know the undisturbed state, nor the current carrying capacity that could be attained alongside protection from illegal hunting. Time series data for abundance and distribution of both seal species do not provide an indication of a time when seal populations were not impacted and what it would look like in terms of abundance and distribution. It is therefore not possible to identify a baseline representing un-impacted conditions.
The baseline used was the abundance estimate for each species in 1992, which is the baseline year used by some Member States for seals under the European Union Habitats Directive (Council Directive 92/43/EEC). For harbour seal, data for 1992 were not available in all AUs; in such cases, the start of the data time series was used as the baseline. Indicator assessment values were set as a deviation from the baseline value (Method 3; OSPAR, 2012).
Bearing in mind that the arbitrarily assigned baseline does not necessarily reflect a state without impacts, it is not possible to assess the status of seals in relation to the concept of a “favourable conservation status”. Instead, trends in the seal populations were assessed. A short term rate-based assessment value was also adopted that uses a rolling baseline (Method 1; OSPAR, 2012). Here, the average annual rate of population change over consecutive six-year periods (the reporting cycle for the European Union Marine Strategy Framework Directive; MSFD) was assessed against the next. The rolling baseline provides a means to indicate change in population size compared with the previous six-year assessment period, rather than relying solely on an historical fixed baseline, which probably reflects a point in time when the population is already subject to anthropogenic pressures.
A potential issue with this type of quantitative trend thresholds, known as ‘shifting baselines’ is that each successive assessment uses a different starting point as the basis for comparison. This could result in a substantial cumulative decrease occurring over more than one six-year assessment period not being flagged as a problem, because in each six-year period the rate of decline remained below the assessment value (OSPAR, 2012).
Harbour Seal and Grey Seal Abundance Assessment Values
OSPAR Intermediate Assessment 2017 Indicator Assessment values are not to be considered as equivalent to proposed European Union MSFD criteria threshold values, however they can be used for the purposes of their MSFD obligations by those Contracting Parties that wish to do so.
Two assessment values were used to assess grey and harbour seal abundance in each AU in the Greater North Sea in relation to the baselines above:
Assessment Value 1:
No decline in seal abundance of > 1% per year in the previous six-year period (a decline of approximately 6% over six years).
This uses a rolling baseline based on the previous six-year period which seeks to identify if seal populations are maintained in a healthy state, with no decrease in population size with regard to the baseline (beyond natural variability) and to identify if efforts are needed to restore populations, where they have deteriorated due to anthropogenic influences, to a healthy state.
To estimate the annual increase or decrease in the number of animals counted within the previous six-year reporting round, a trend was fitted to the sum of all available data in each AU for the period 2009–2014. Generalised linear models (GLMs) were fitted to count data with a quasi-Poisson error distribution and log link. Annual growth rate (%) and 80% confidence intervals were estimated for each AU. Although no formal hypothesis testing was conducted, 80% confidence intervals were calculated to reflect the choice to set the statistical significance level, α, equal to 0.20 or 20%.
Assessment Value 2:
No decline in seal abundance of >25% since the fixed baseline in 1992 (or closest value).
To avoid the problem of shifting baselines when using the rolling baseline applied in assessment value 1, an assessment value relating to a fixed baseline is needed (assessment value 2). The baseline chosen was 1992, as used by some Member States for seals under the European Union Habitats Directive (Council Directive 92/43/EEC) (or if such data are not available, the start of the data series). The 25% chosen for the second assessment value currently approximates to 1% a year since 1992. Testing shows that there is sufficient monitoring to assess against this assessment value with confidence.
Where a shorter timescale is assessed, the 25% decline since the baseline is therefore not equivalent to those AUs where data do extend to 1992 (for example, a 25% decline since 2003 describes a more rapid contraction in the population than a 25% decline since 1992).
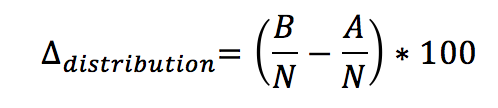
To determine the change in the abundance of seals since the baseline year, generalised linear models (GLMs) or generalised additive models (GAMs) were fitted to the sum of count data within an AU with a quasi-Poisson error distribution and log link using all available annual survey data in the range 1992 to 2014. The percentage change in abundance since baseline year (Δbaseline) and 80% confidence intervals were calculated from fitted values. Although no formal hypothesis testing was conducted, 80% confidence intervals were calculated to reflect the choice to set the significance level, α, equal to 0.20 or 20% (Formula A).
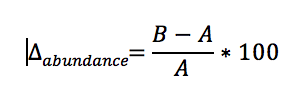
Formula A: Calculation of long-term trend in abundance
Where A is the count fitted by the model in the baseline year and B is the count fitted by the model in the most recent survey year.
The use of the two assessment values aims to provide an indicator that would warn against both a slow but long-term steady decline (the problem of ‘shifting baselines’ associated with only having a rolling baseline) and against a recovery followed by a subsequent decline (potentially missed with a fixed baseline set below reference conditions). The two assessment values together would be able to act as a trigger for investigation of any necessary management measures to promote a steady recovery and subsequent slowing of growth as carrying capacity is approached.
Statistical Power of Assessments
There are many ways in which the number of seals counted during any one year could vary, aside from representing true changes in population size. These include variation in weather, or a disturbance at a haul-out site prior to counting. It is therefore advisable to examine the variability in survey counts and to incorporate this variability into trend or population size change estimates. The International Council for the Exploration of the Sea (ICES) Working Group for Marine Mammal Ecology (WGMME) (ICES, 2014b) provided general advice on the need to understand the statistical power of current and proposed monitoring programmes. In the present context, statistical power is the percentage confidence in not missing a significant decline. Statistical power depends on the sample size (number of surveys), the level of statistical significance set (α-level), variance in the counts, and the magnitude of the trend, that is, -1% and -25%. The ICES WGMME (ICES, 2014b) recommended that monitoring should achieve a minimum of 80% power – which equates to a 20% chance of making a Type II error (i.e. the frequency with which a true decline would not be detected). The same group also recommended that the threshold for detection of a ‘significant’ trend be relaxed from the traditional α = 0.05 to α = 0.20. The α parameter, or significance level, equates to the probability of concluding that a significant trend exists when in fact it does not (Type I error). An α value of 0.2 and power of 80% means there is equal probability of making an incorrect conclusion (either Type I or Type II error) about the detection of a trend.
Current monitoring programmes vary in the level of statistical power achievable. To carry out a full study of retrospective power to detect changes in the observed population trends, detailed information about the between- and within-year variability in all survey counts would be necessary. A full assessment of power was not undertaken here; this has already been done for the Wadden Sea and Southern Scandinavia where comprehensive coordinated survey efforts throughout the year provide some of the most robust estimates of trends in seal counts (Meesters et al., 2007; Teilmann et al., 2010). In other areas, however, the survey area is too large or complex so comprehensive and repeated surveys have not been feasible (such as in many parts of the Scottish coast) and the power to detect change in these units is reduced (SCOS, 2014).
Because 80% statistical power is not feasible to achieve in most areas, confidence intervals (CIs) were used to provide a relevant measure of confidence in the assessment. Simply said, they describe the frequency with which the true, unobservable, population parameter (here, the mean count) could be expected to fall within the intervals described by an upper and lower confidence limit. Where the confidence intervals encompass the assessment value the data do not provide conclusive evidence for the calculated value being above or below the assessment value.
Assessing Changes in Harbour Seal and Grey Seal Distribution
Describing the distribution of seals from surveys that are designed primarily to assess abundance is problematic because these are designed for when the seals are on land. Any distribution metric based on these data will have inherent limitations arising from three main issues:
- Spatial coverage: Seal abundance surveys necessarily census animals seen hauled-out on land and do not address the distribution at sea. To estimate at-sea usage, long-term telemetry data are necessary (e.g. Jones et al., 2013).
- Sampling effort: Ideally in studies of distributional change, a complete and standardized survey is conducted repeatedly in the area of interest. The areas of interest for this indicator assessment are the AUs. Those shown in Figure a and Figure b are not all surveyed completely on an annual basis due to geographical and / or financial constraints. Surveys have been prioritised towards those areas of known and high seal occurrence. Statistically, this could lead to a bias in seal distribution metrics due to preferential sampling.
- Temporal coverage: the surveys cover narrow time windows during key life-stages such as moulting, breeding and pupping. The distribution of seals can be different between these stages. Grey seals, for example, may completely vacate breeding areas for the rest of the year. The present analysis assesses changes in moulting distribution for harbour seals, and changes in breeding colony distribution for grey seals.
These general limitations are applicable to most studies of animal abundance and distribution (Fortin et al., 2005). Despite these limitations, survey data may be useful to detect large-scale contractions in population distributions in terms of reduced use or abandonment of haul-outs or breeding areas, depending on the spatial resolution with which presence / absence data are reported.
To explore changes in seal distribution from available survey data, it was necessary to further sub-divide the AU into subareas. The borders of sub-areas were (arbitrarily) prescribed by the data provider, but with the intention to aggregate haul-out sites by seaward proximity and likelihood that seals travel between sites rather than aligning with any pre-existing municipal boundaries. In cases where haul-out sites rather than geographic areas were defined, these were taken to be areas / sites routinely used by the population to haul-out. Using presence or absence of seals within these spatial units, two metrics of change in distribution were calculated (following an approach developed for marine bird roost sites and breeding colonies – Humphreys et al., 2015):
1. Distributional pattern – percentage change in occupancy between two periods for a given spatial unit:
Formula B: Calculation of changes in distributional pattern
Where A is the number of spatial units (e.g. sub-areas, grid cells) in an AU occupied by seals during reference period A; B is the number of units occupied in a subsequent period B, and N is the total number of spatial units within the AU. For the present assessment, period A is 2003–2008 and period B is 2009–2014.
2. Shift in occupancy – an index to describe the overall shift in the seasonal distribution of seals between sub-areas or grid cells over time:
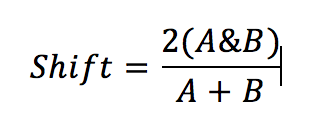
Formula C: Calculation of shift index
Where A is the number of spatial units (e.g. sub-areas, grid cells) occupied by seals during reference period A; B is the number of units occupied in a subsequent period; A&B is the number of identical units occupied in both periods. For the present assessment, period A is 2003–2008 and period B is 2009–2014.
The shift index value is between 0 and 1: a value of 0 indicates that there has been a complete shift in the spatial units occupied; a value of 1 indicates there has been no shift.
The shift index was not calculated for grey seal breeding colonies because female seals usually return to the same colony year after year and the colony location does not shift much over time.
A similar set of assessment values was suggested for seal distribution but as meaningful changes in seal distribution are currently difficult to detect and assess from abundance surveys, this aspect of the Indicator will be considered as a ‘surveillance indicator’: the metric(s) are described but not quantitatively assessed against an assessment value.
Grey seal and harbour seal are also assessed under the Habitat Directive Article 17 reporting in 2013 (EU, 2013).
Results
This indicator assessment uses estimates of seal numbers from monitoring programmes that count seals on land when they are moulting or breeding. Assessments of changes in abundance and distribution were made within discrete geographical areas of coastline, or ‘Assessment Units’ (AUs).
Grey Seal Abundance and Distribution
Grey seal abundance in the Greater North Sea (excluding AUs in Norway) and in the United Kingdom part of the Celtic Seas has increased since 1992. In the Greater North Sea (excluding the United Kingdom, Sweden and Norway), where sufficient data were available, grey seal numbers during their moulting period in spring have increased substantially since 1992. The number of breeding colonies occupied between 2003–2008 and 2009–2014 generally increased or remained unchanged.
Harbour Seal Abundance and Distribution
In the Greater North Sea, harbour seal abundance has increased over both the short term (2009–2014) and long term (1992–2014) in all AUs along the coast of continental Europe and along the east coast of England (Figure 1 and 2). In the Wadden Sea (AU17), which holds over 40% of harbour seals in the total area being assessed, numbers have trebled since 1992. Increases in abundance on the Belgian Coast and in the Dutch Delta (AU16) are likely to be due to immigration of seals from the Wadden Sea and possibly also from the South-East England (AU10) and French North Sea and English Channel Coast (AU15). Elsewhere in the Greater North Sea, short- and long-term declines in abundance exceeded the assessment values (declined >1% per year and decreased by >25% against baseline year, respectively) in East Scotland (AU8), North Coast and Orkney (AU5), and Shetland (AU6), but were inconclusive in the Moray Firth (AU7) (Figure 1 and 2). The causes of these declines are currently unknown and are the subject of a major research initiative in the United Kingdom.
In the United Kingdom part of the Celtic Seas there were insufficient data to conduct assessments in most AUs (Figure 1). In West Scotland (AU3), numbers have increased substantially since 1992 and the AU holds over 20% of harbour seals in the total assessed area of the Greater North Sea and Celtic Seas. In the Western Isles (AU4) and Northern Ireland (AU1) numbers have decreased since 1992, but have not conclusively exceeded assessment values. The presence of harbour seals at haul-out sites has either increased or remained the same in most AUs in the Greater North Sea and the United Kingdom part of the Celtic Seas. A notable exception is East Scotland (AU8), where abundance has declined dramatically since the mid-2000s. In this AU, the number of occupied areas has decreased from seven (out of a total of nine surveyed) in the period 2003–2008, to four (out of a total of six surveyed) in the period 2009–2014 (Figure 2).
There is a moderate / low confidence in the methodology used and moderate confidence in the availability of data.
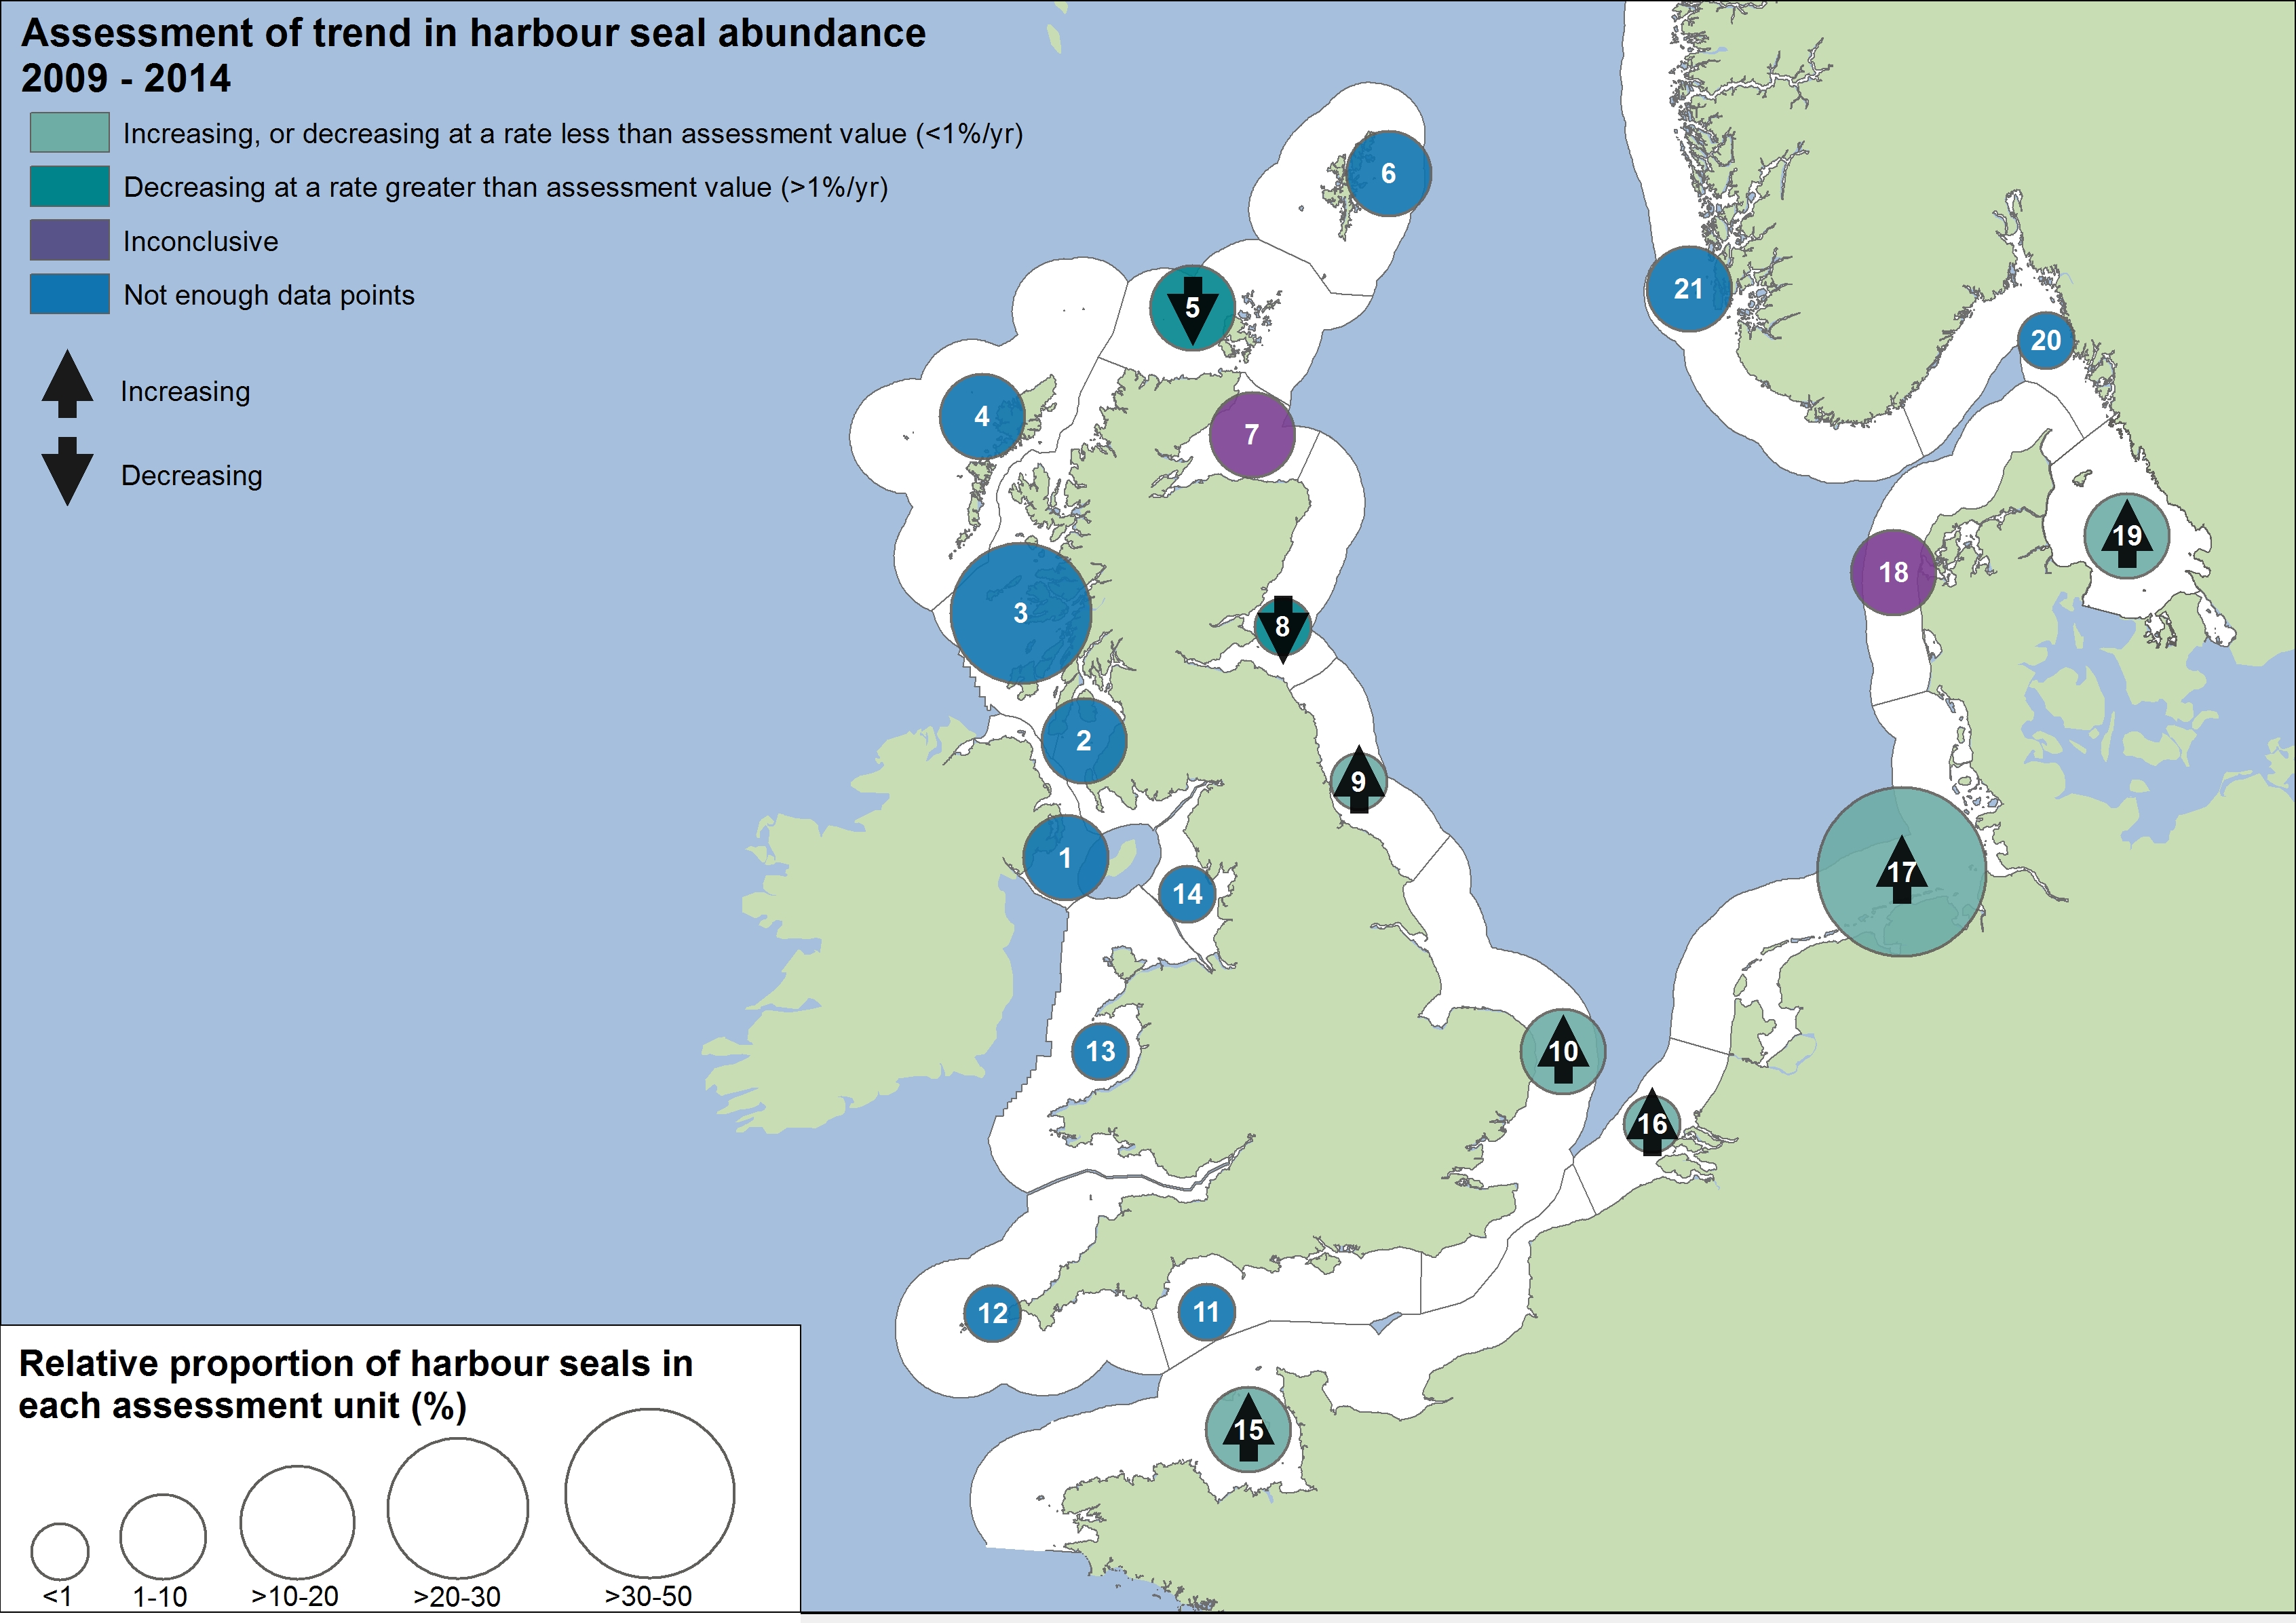
Figure 1: Assessment of recent change in harbour seal abundance (2009–2014)
The numbers in each circle refers to the Assessment Unit ID (see key)
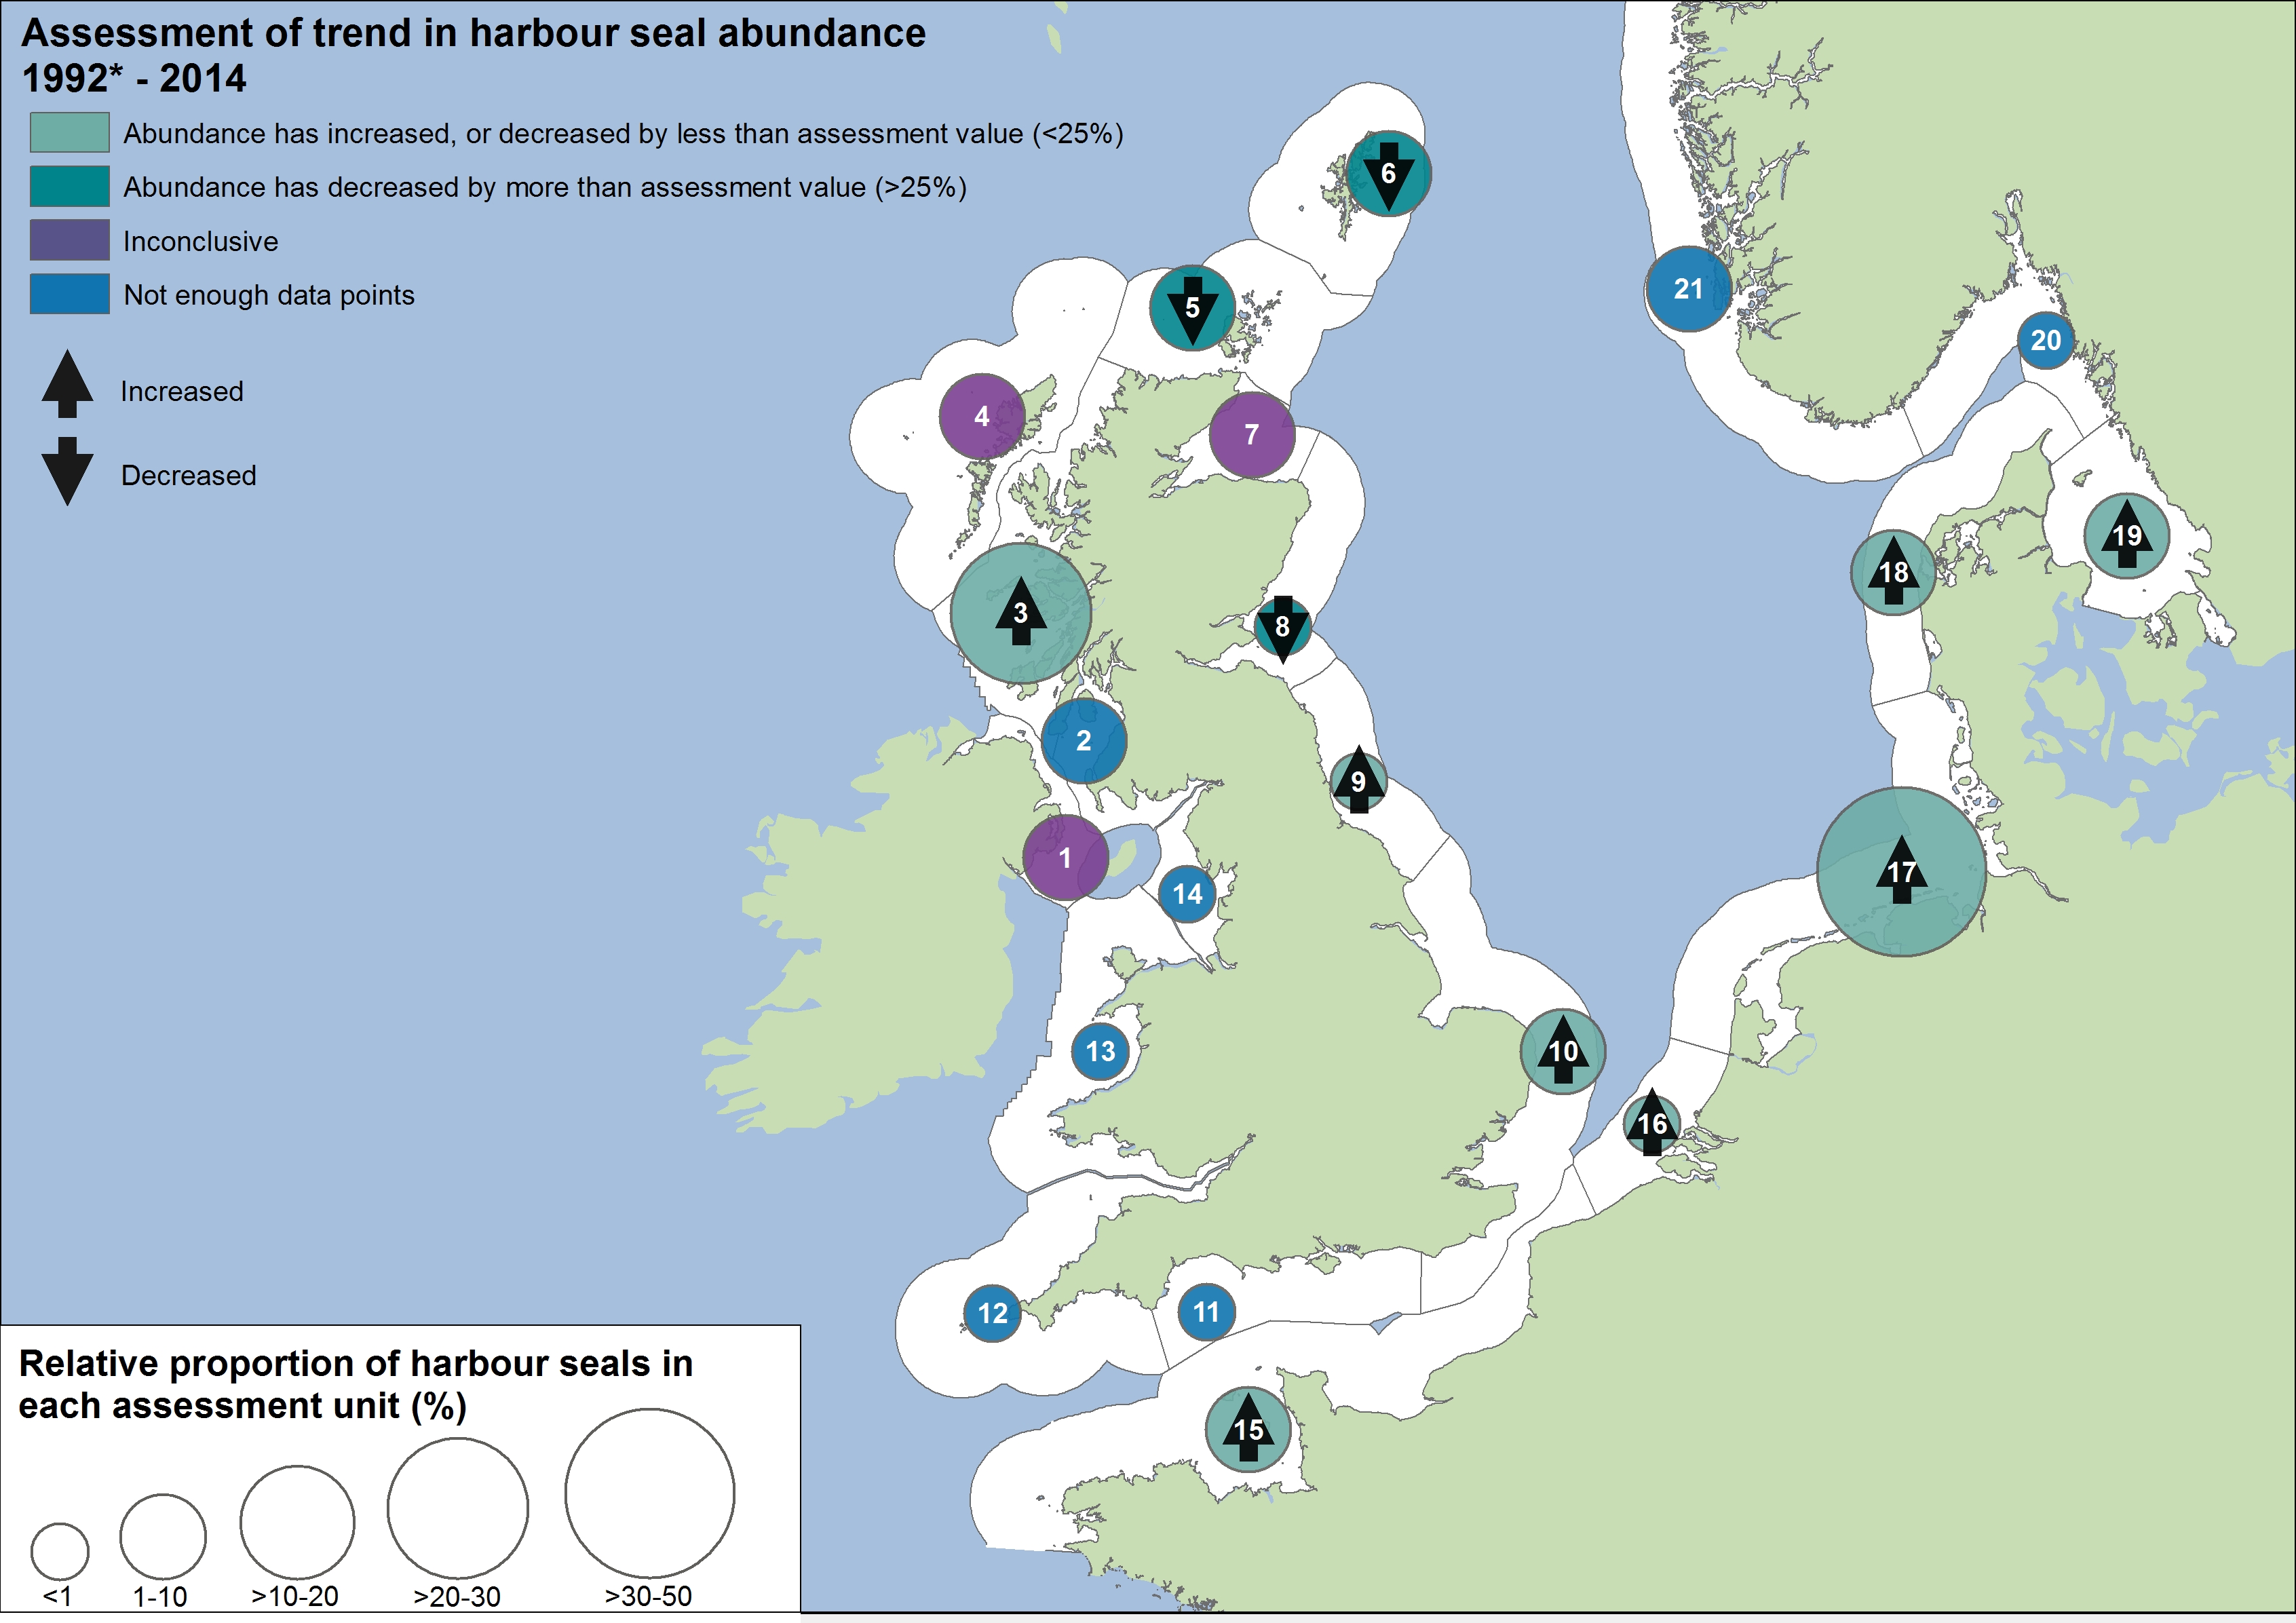
Figure 2: Assessment of long-term change in harbour seal abundance (1992*–2014)
The numbers in each circle refers to the Assessment Unit ID (see key).
*1992 was used as a baseline year, but in some Assessment Units a later year was used (see year in brackets in key).
Assessment Unit (AU) Key
1. Northern Ireland (2002), 2. South-West Scotland (1996), 3. West Scotland (1997), 4. Western Isles, 5. North Coast & Orkney (1993), 6. Shetland (1993), 7. Moray Firth (1994), 8. East Scotland (1997), 9. North-East England (1994), 10. South-East England (1995), 11. South England (1997), 12. South-West England (1997), 13. Wales (1997), 14. North-West England (1997), 15. French North Sea & Channel Coast, 16. Belgium Coast and Dutch Delta (2003), 17. Wadden Sea, 18. Limfjorden, 19. Kattegat, 20. Northern Skagerrak and Oslo Fjord (1999), 21. Norwegian West Coast, south of 62N (1999).
The assessment in the Celtic Seas does not include Ireland due to the density of Irish data available, which is not sufficient to make a comprehensive assessment of change in abundance. In Ireland, the status of both the grey seal and harbour seal is favourable given the current knowledge of the species population size, distribution, ecology and prevailing pressures on these species (NPWS, 2013).
Harbour Seal
Of the 21 assessment units (AUs), ten had a sufficient number of survey years to assess trends in abundance in the period 2009–2014. Annual change in harbour seal abundance during this period ranged from a 10% reduction per year on the North Coast and Orkney (AU5) to 23% increase per year in the Belgium Coast and Dutch Delta region (AU16) ( Table b ). In general, abundance in AUs on the north eastern coasts of Scotland appear to be in decline whereas on the coasts of mainland Europe, and the west coast and south-east coast of the United Kingdom, harbour seal numbers are increasing or have remained stable (Figure d). These results are similar to those found in more detailed analyses of harbour seal surveys in the United Kingdom (Lonergan et al., 2007, 2011; Hanson et al., 2015).
The high growth rate in population size in the Belgium Coast and Dutch Delta (AU16) is remarkable because it is much higher than the recorded births, and even more remarkable as the births are exceeded by the number of animals found dead in the area. This area is therefore considered a satellite colony of the Wadden Sea and possibly to some extent of the South-East England (AU10) and French North Sea and English Channel Coast (AU15). Here, the observed rate of increase and confidence intervals exceeded 13% per year (an accepted maximum intrinsic rate of increase for harbour seal populations is less than 13%; Härkönen et al., 2002), again suggesting that immigration of harbour seals is occurring.
Key: Abundance: T1: Growth rate2009-2014 refers to the annual growth (%) in counts between 2009 and 2014. T2: Δbaseline refers to the change in numbers since the baseline year. Upper and lower 80% confidence limits for the CI are given for both parameters based on modelled growth rates (upperCIT1, lowerCIT1 and upper CIT2, lowerCIT2 respectively). YearsT1 and YearsT2 refers to the number of years of count data in the periods 2009–2014 and 1992–2014, respectively. Observed change in numbers since the baseline, not from modelled data, is denoted by Observed Δbaseline. The Baseline year refers to 1992 or the start of the time series if this is later. The most recent count refers to the most recent count of animals; this may not have occurred in 2014.
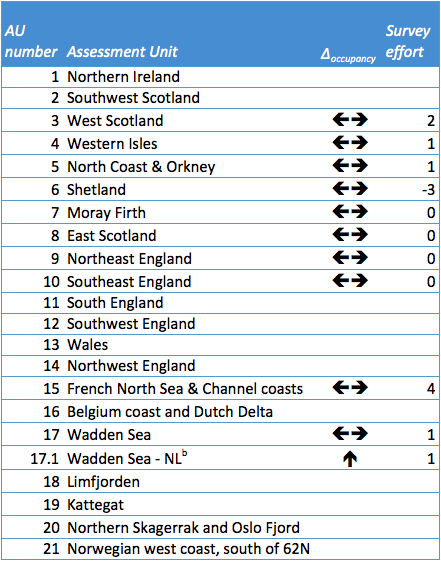
Distribution: Δoccupancy refers to the change in occupancy of sub-areas between the periods 2003–2008 and 2009–2014. This is marked as increasing (é) if index is greater than 10% ; or decreasing (ê) if index is negative and less than -10%; or otherwise, no change (çè). The change in the number of subareas surveyed between the periods 2003–2008 and 2009–2014 is denoted by Survey effort. Shift index describes shifts in distributional pattern within an Assessment Unit. aNot a population: animals seen here are likely to be visitors from other areas. bDistribution metrics do not include data from German sub-areas: no spatial sub-areas were defined.
Table b: Changes in harbour seal in abundance and distribution from surveys of haul-outs during the harbour seal moult (in August) in each Assessment Unit (see Figure b)
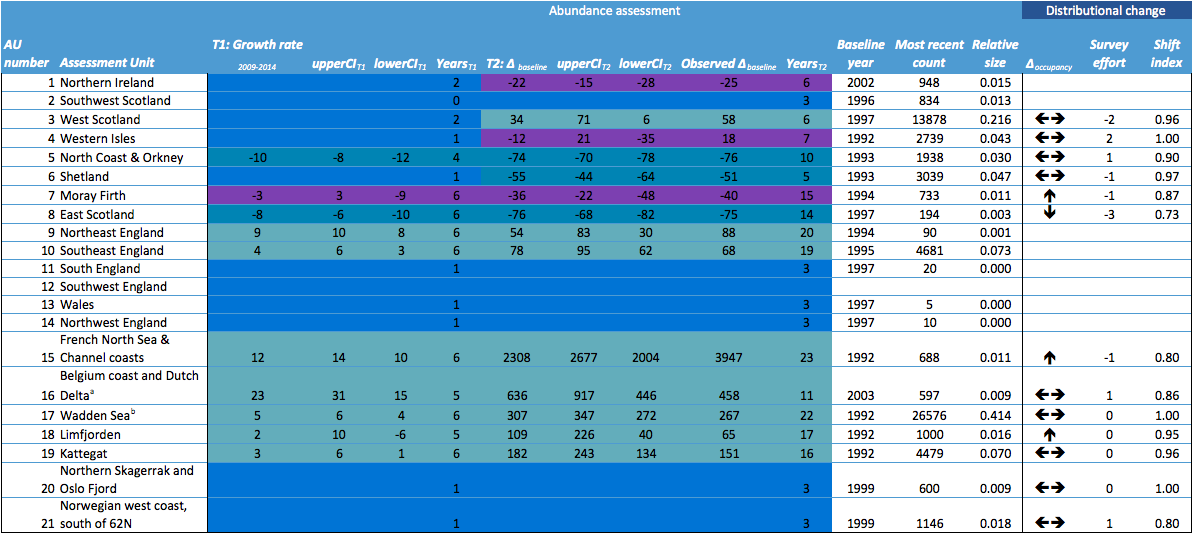
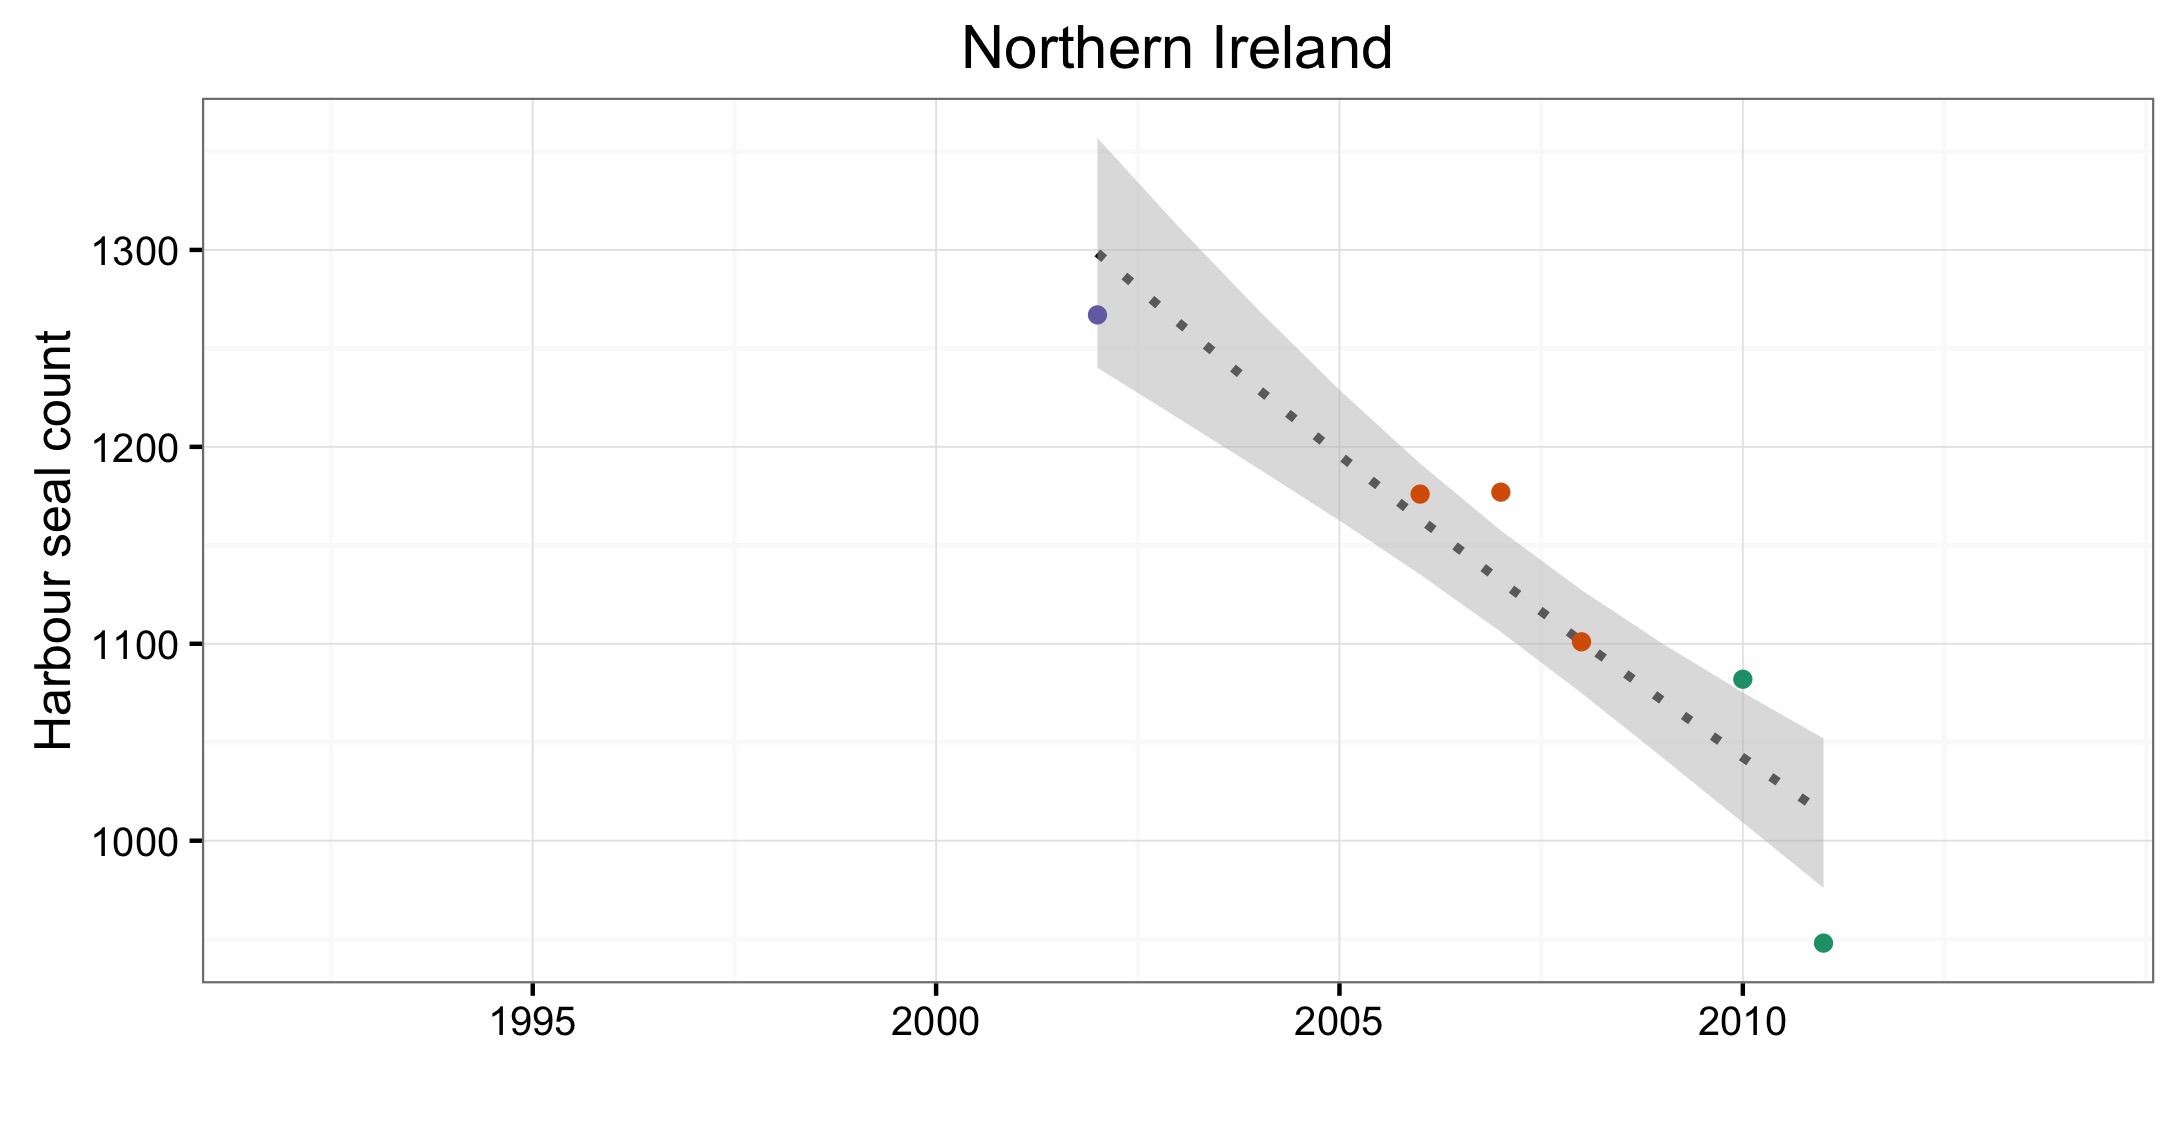
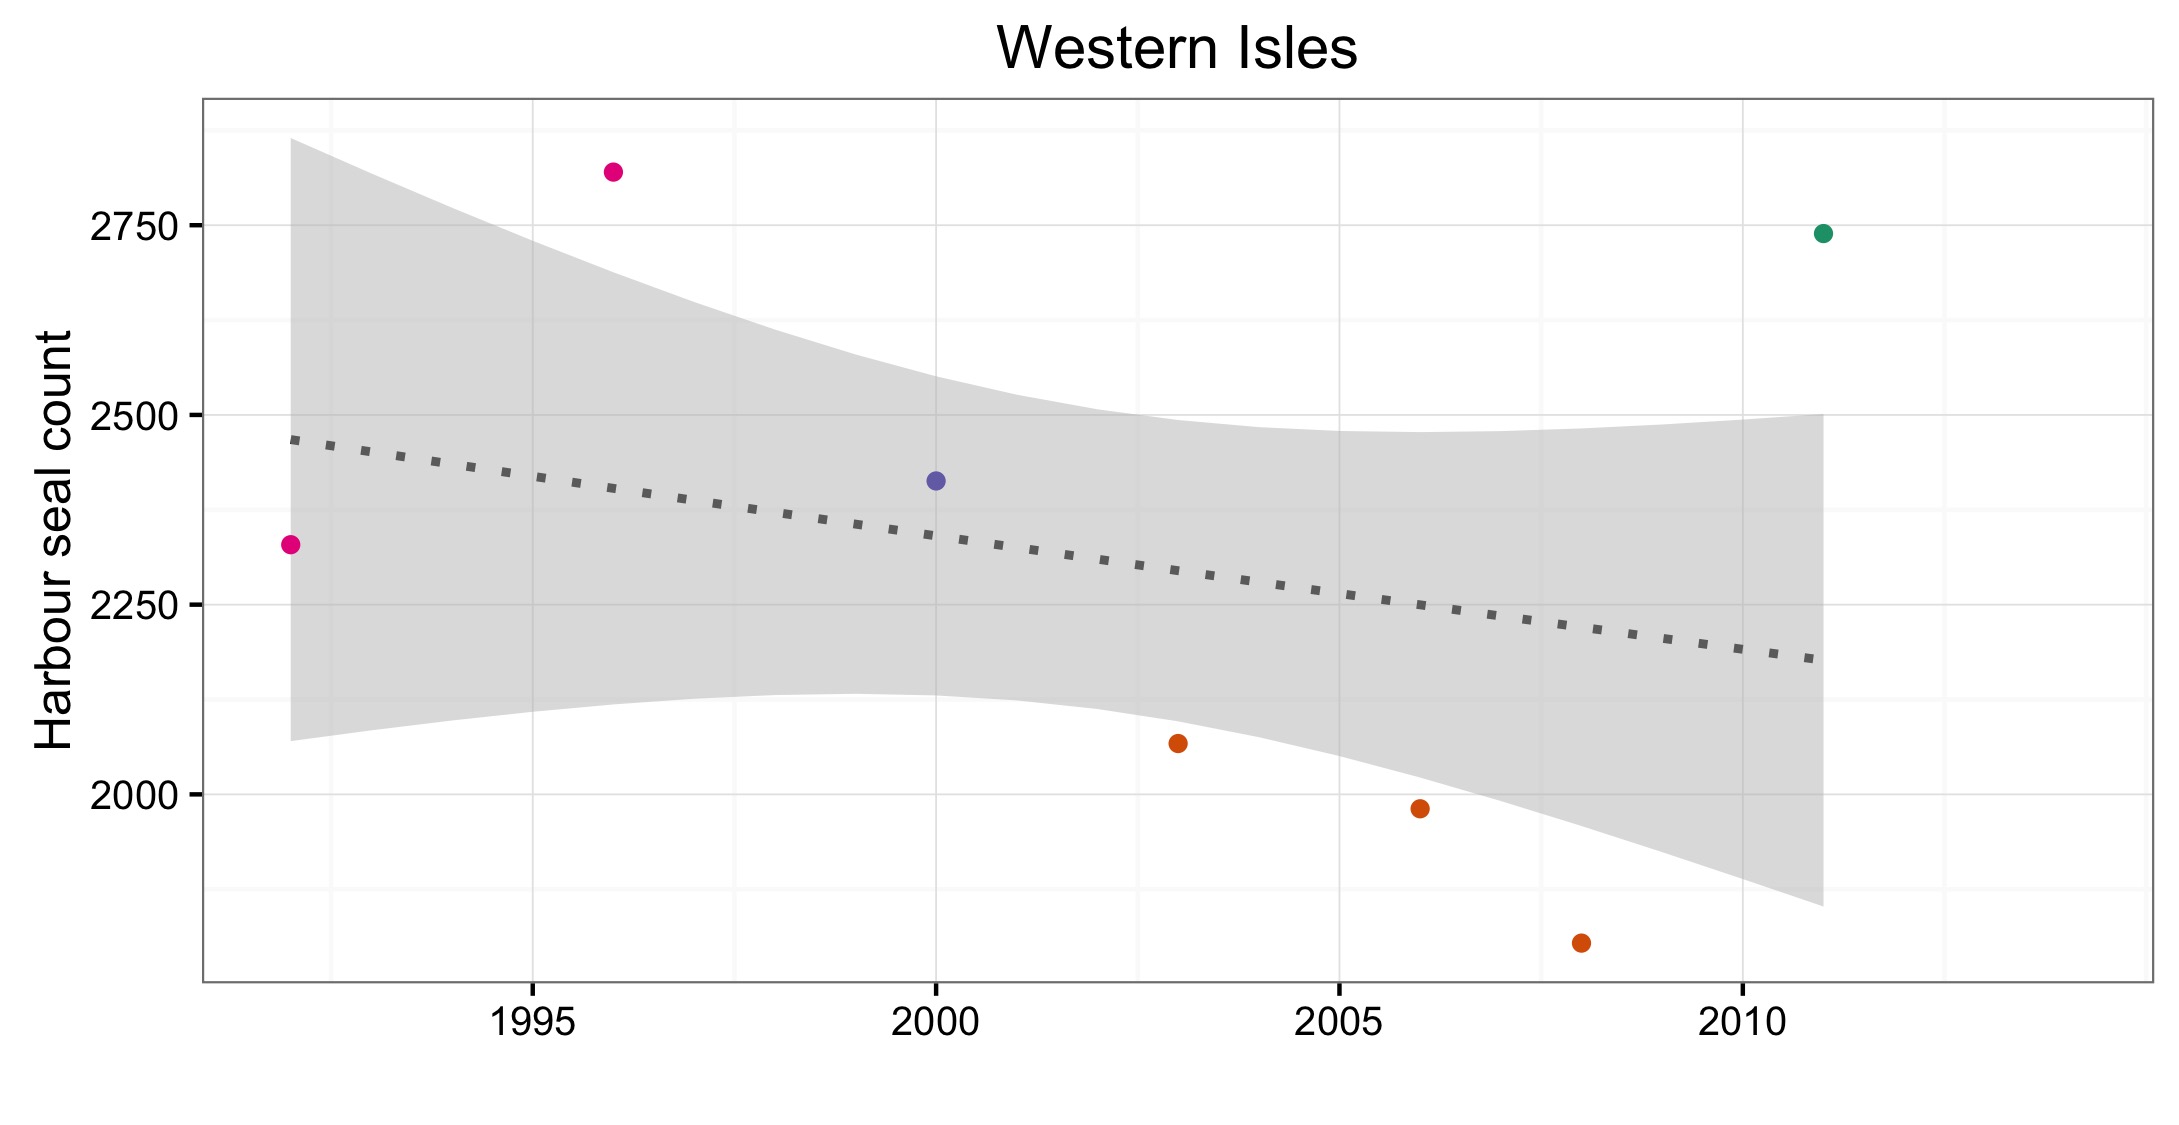
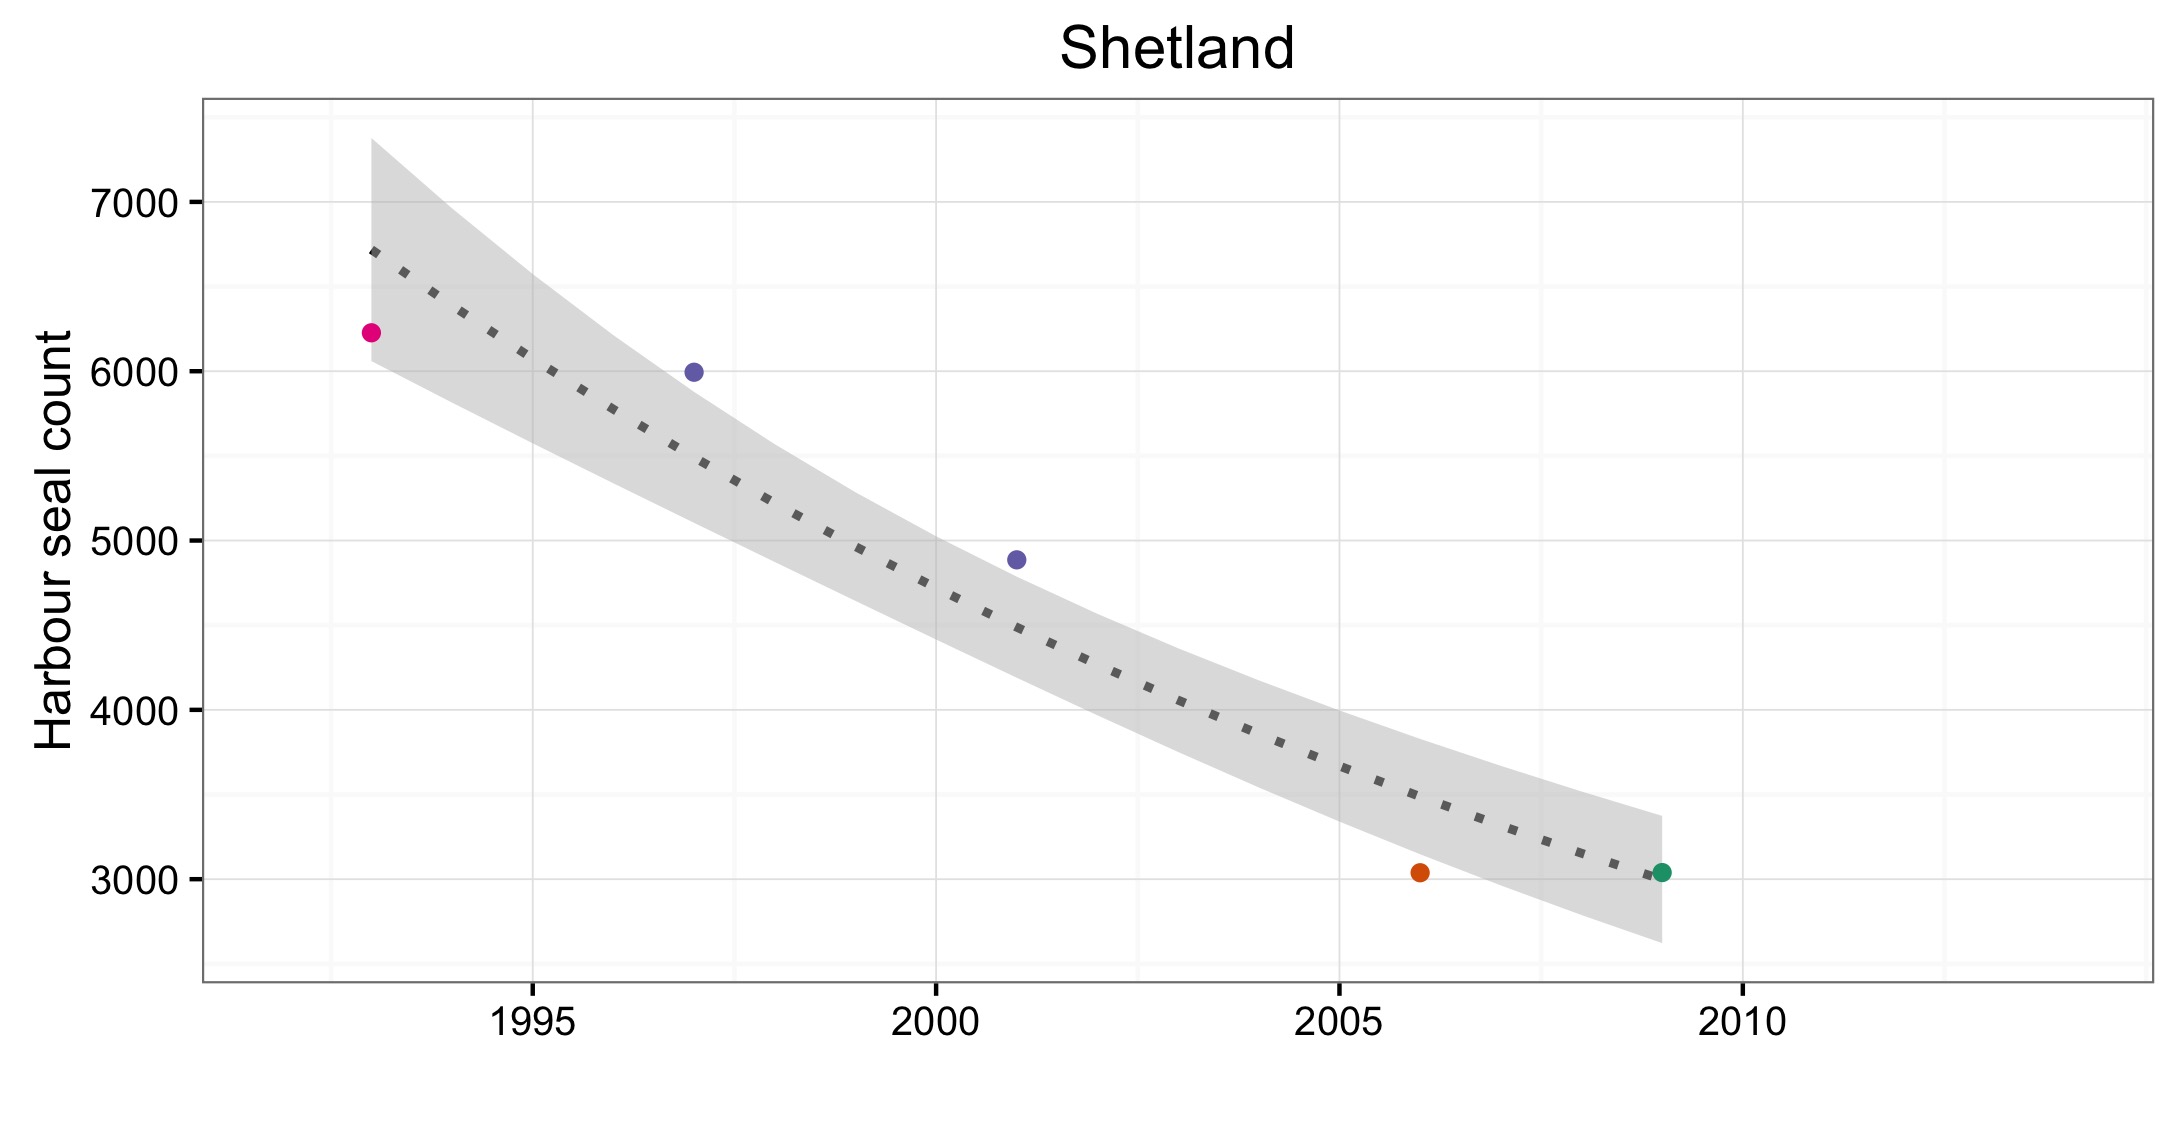
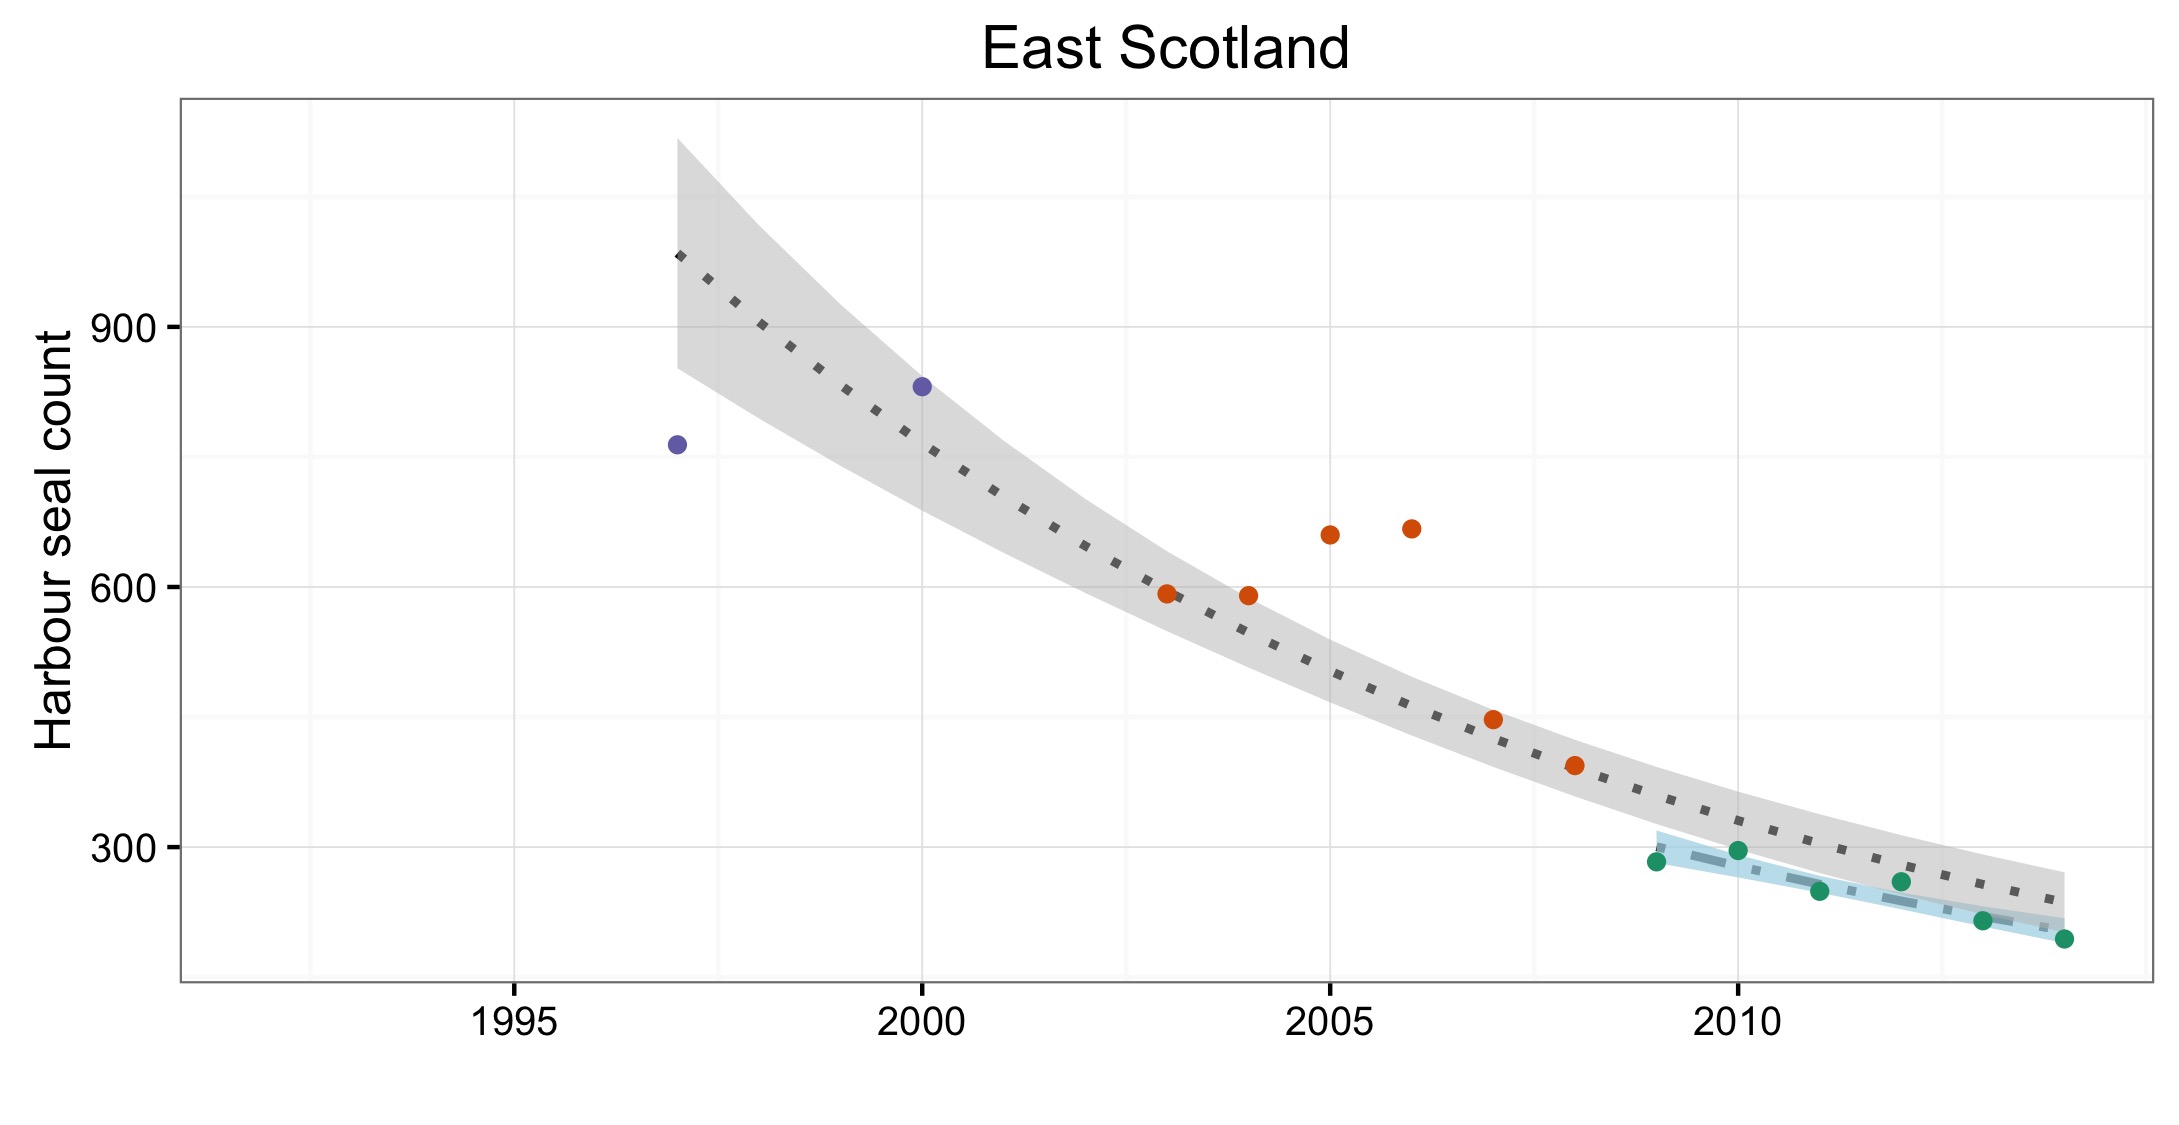
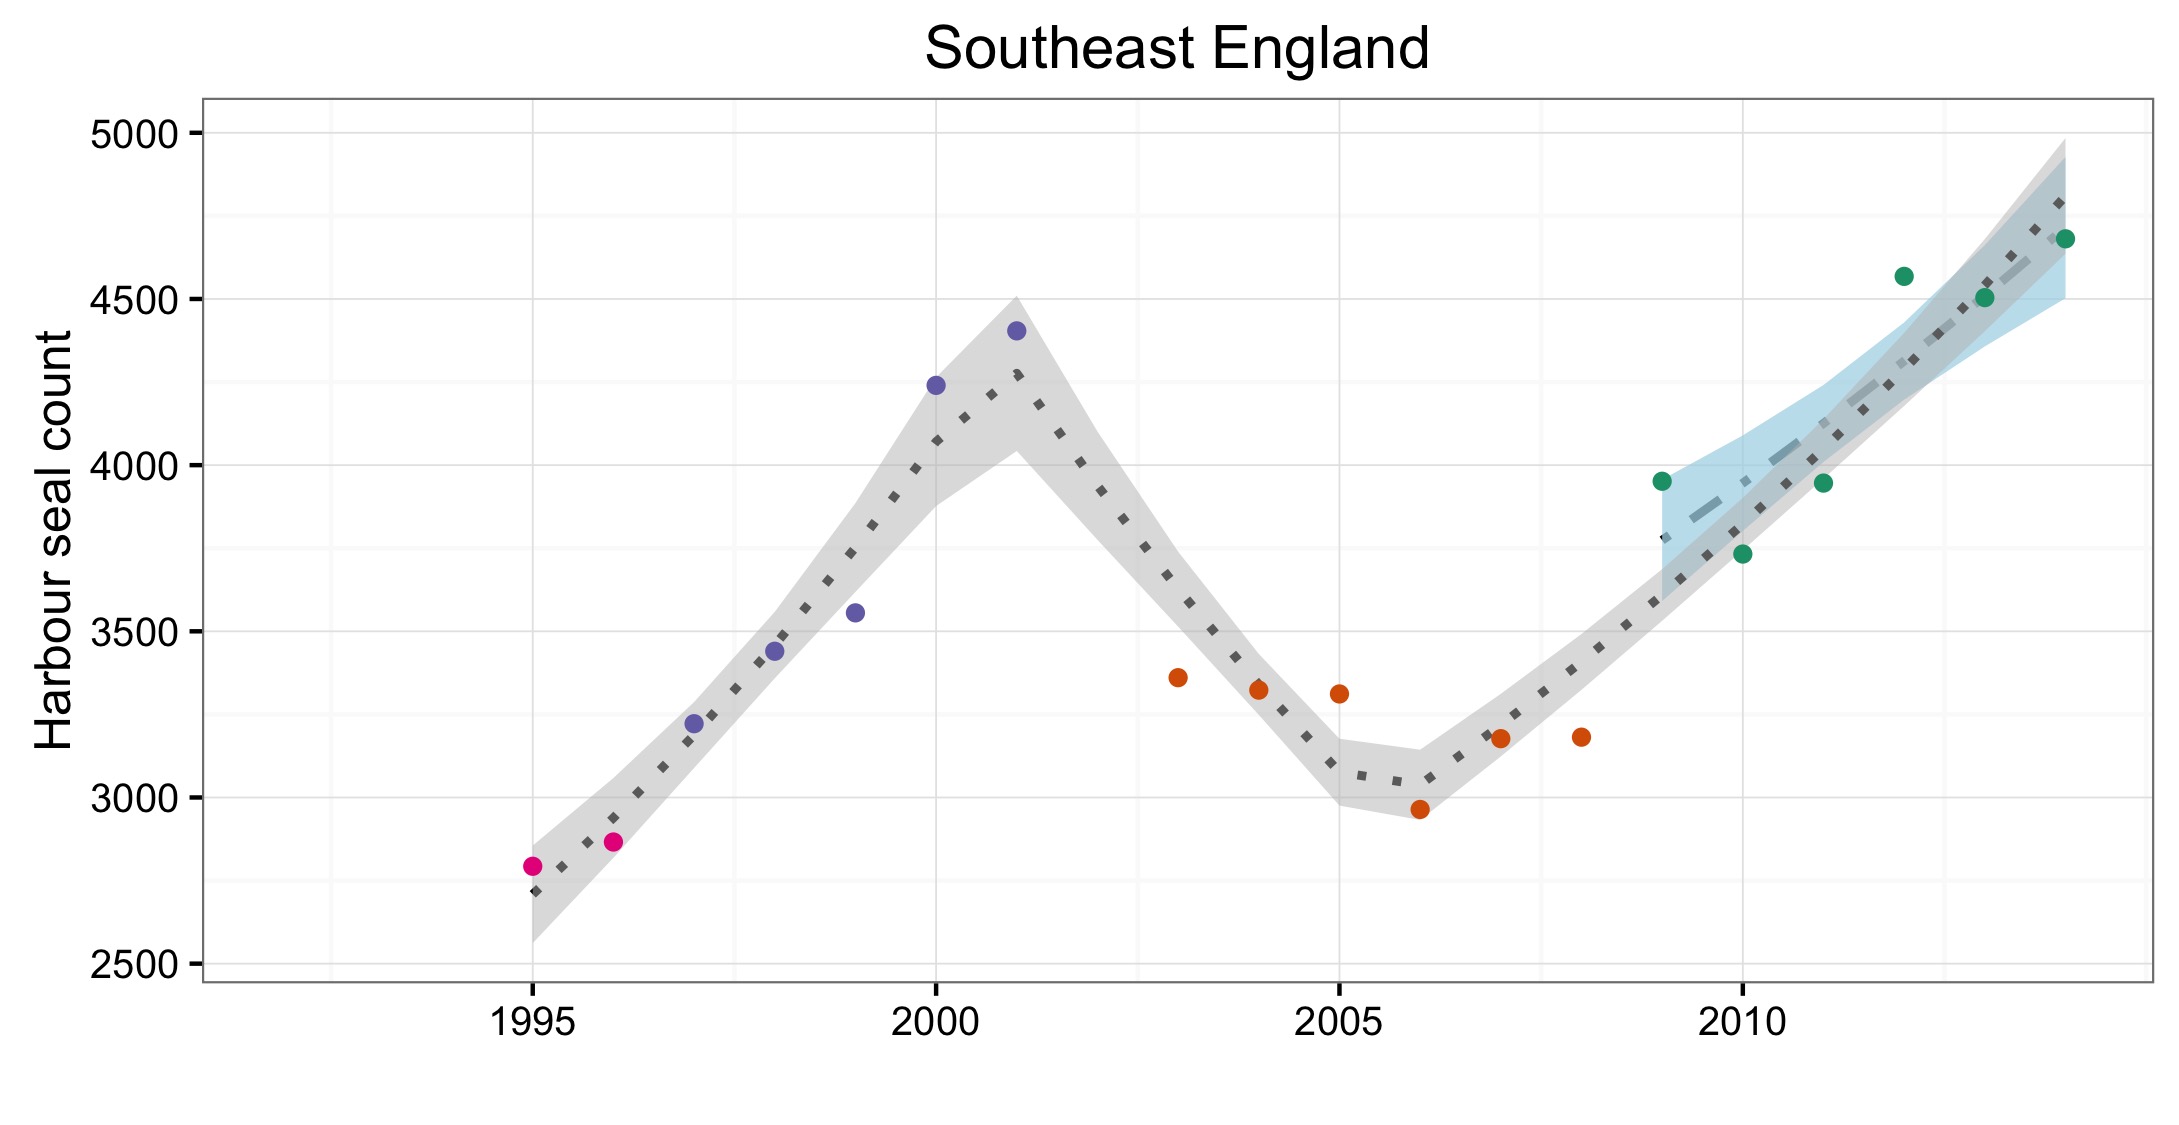
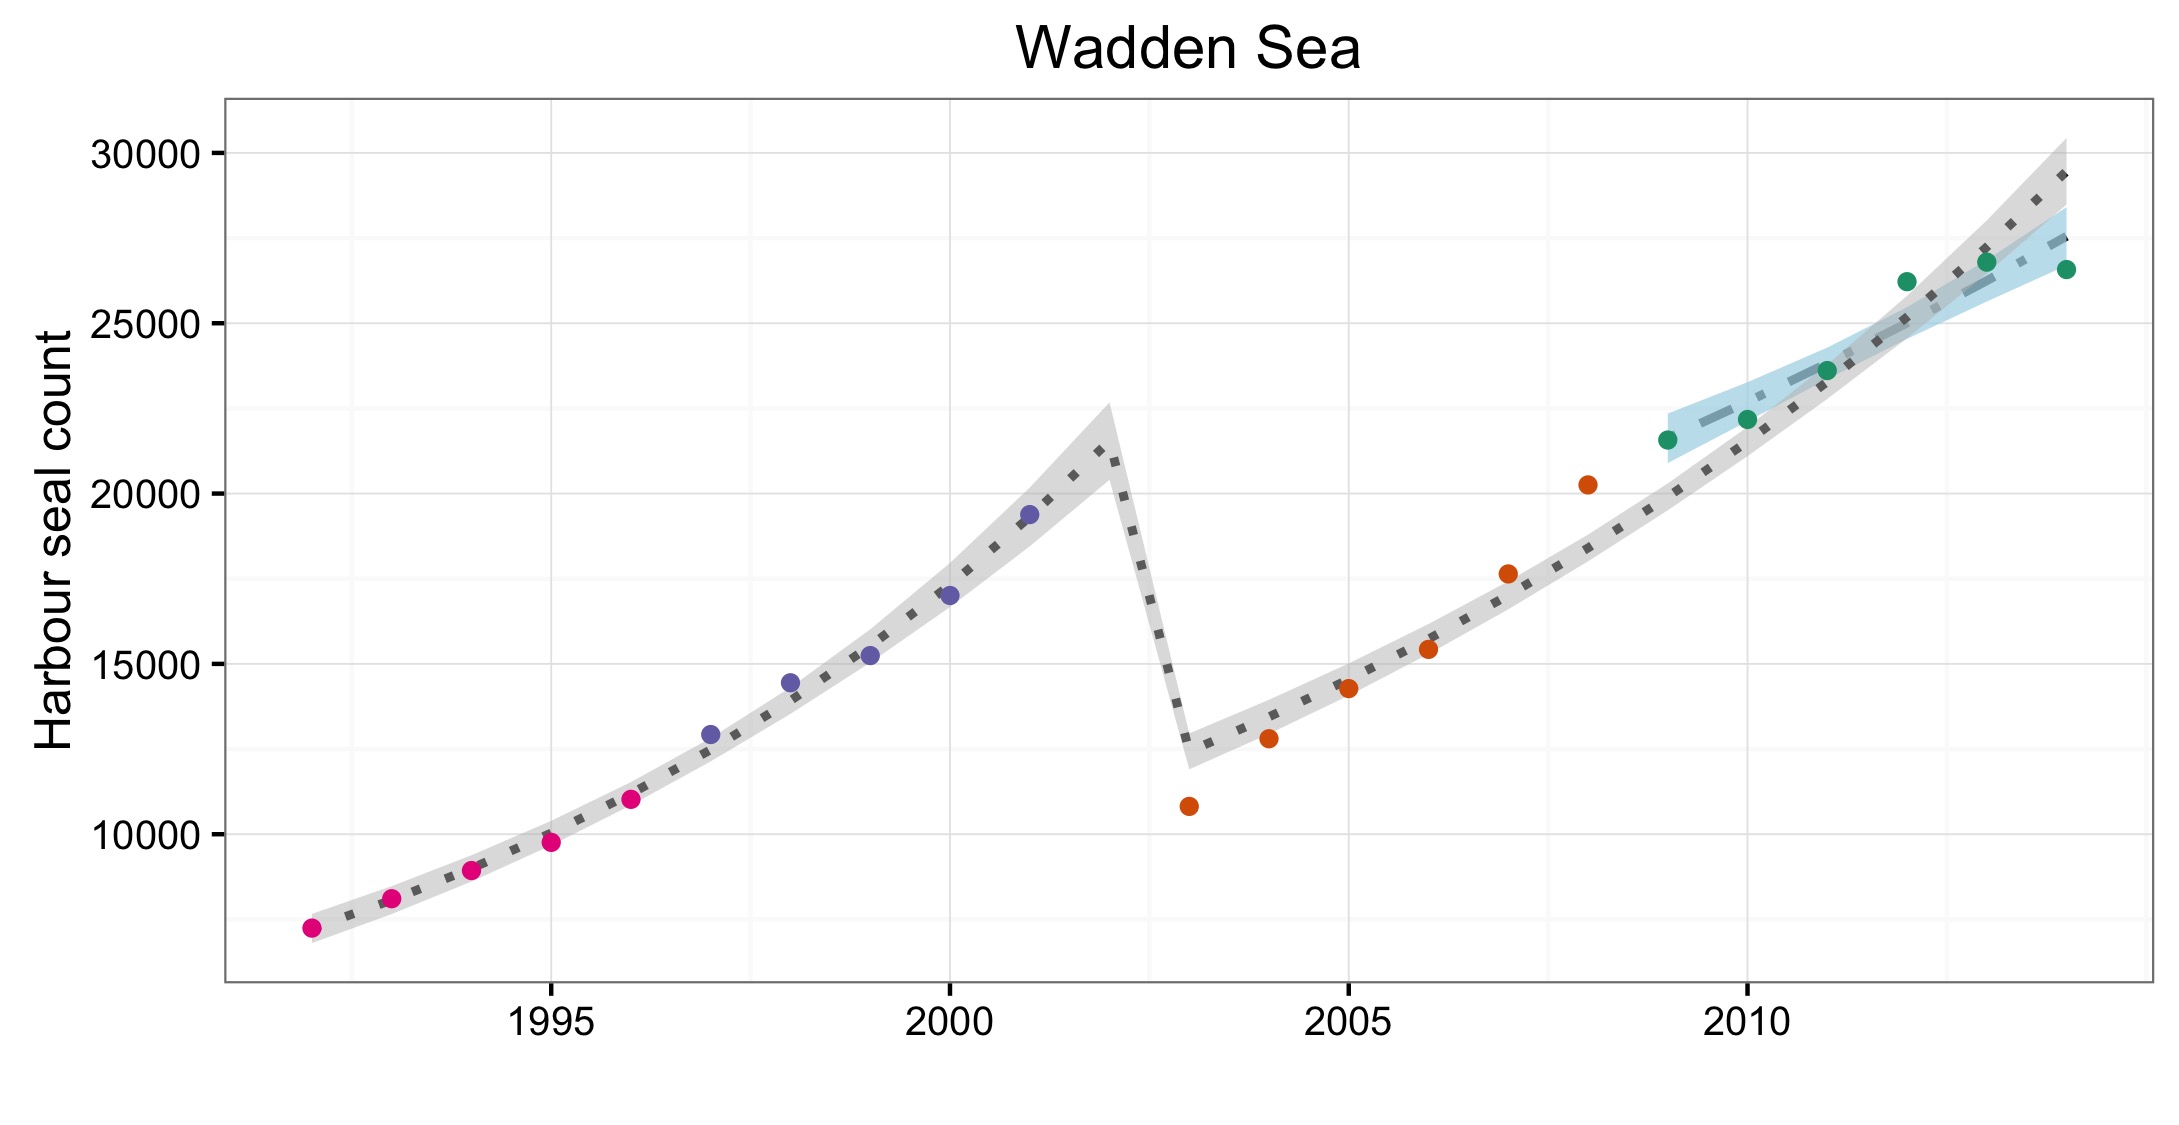
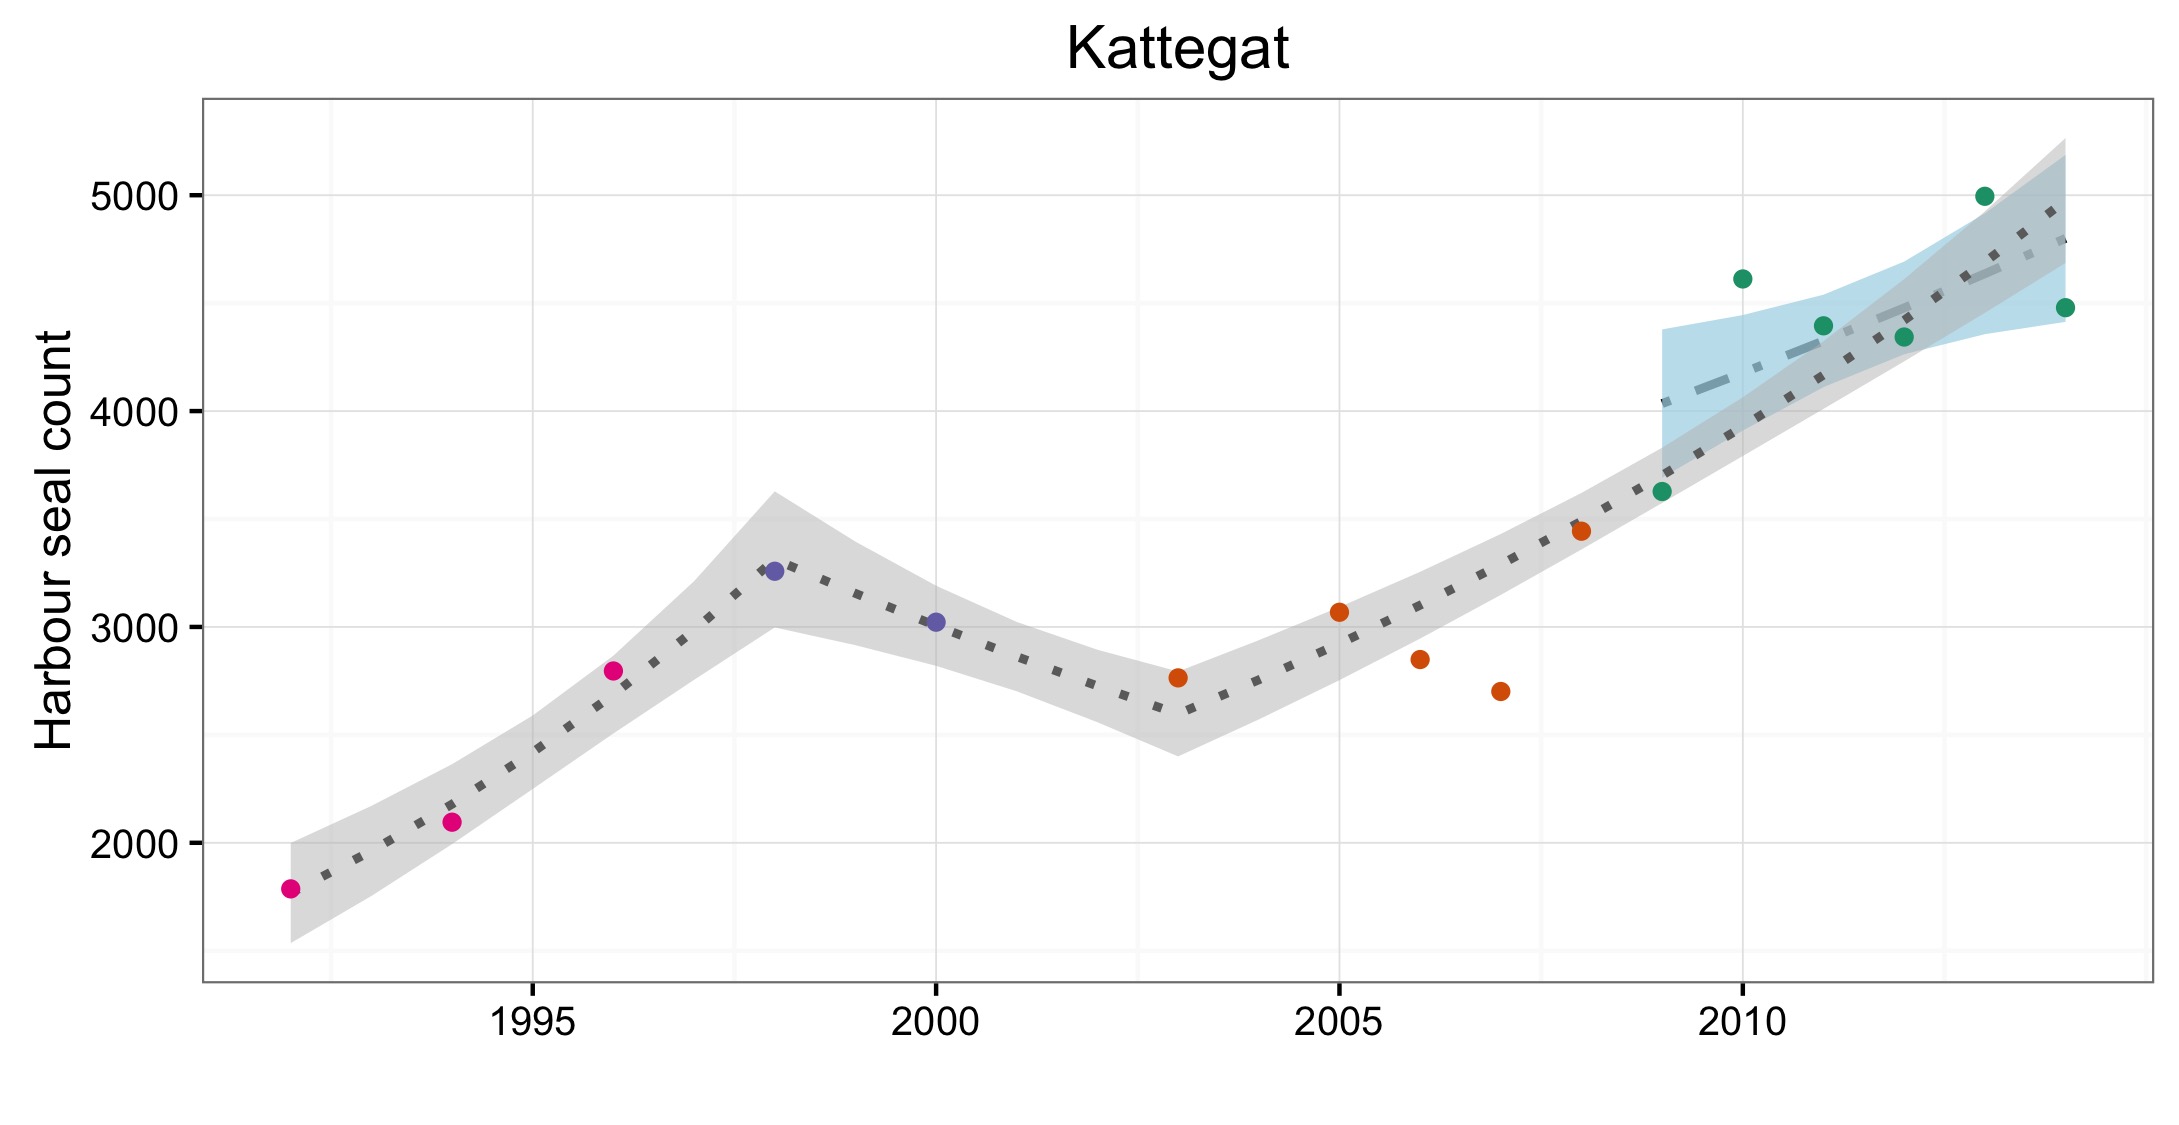
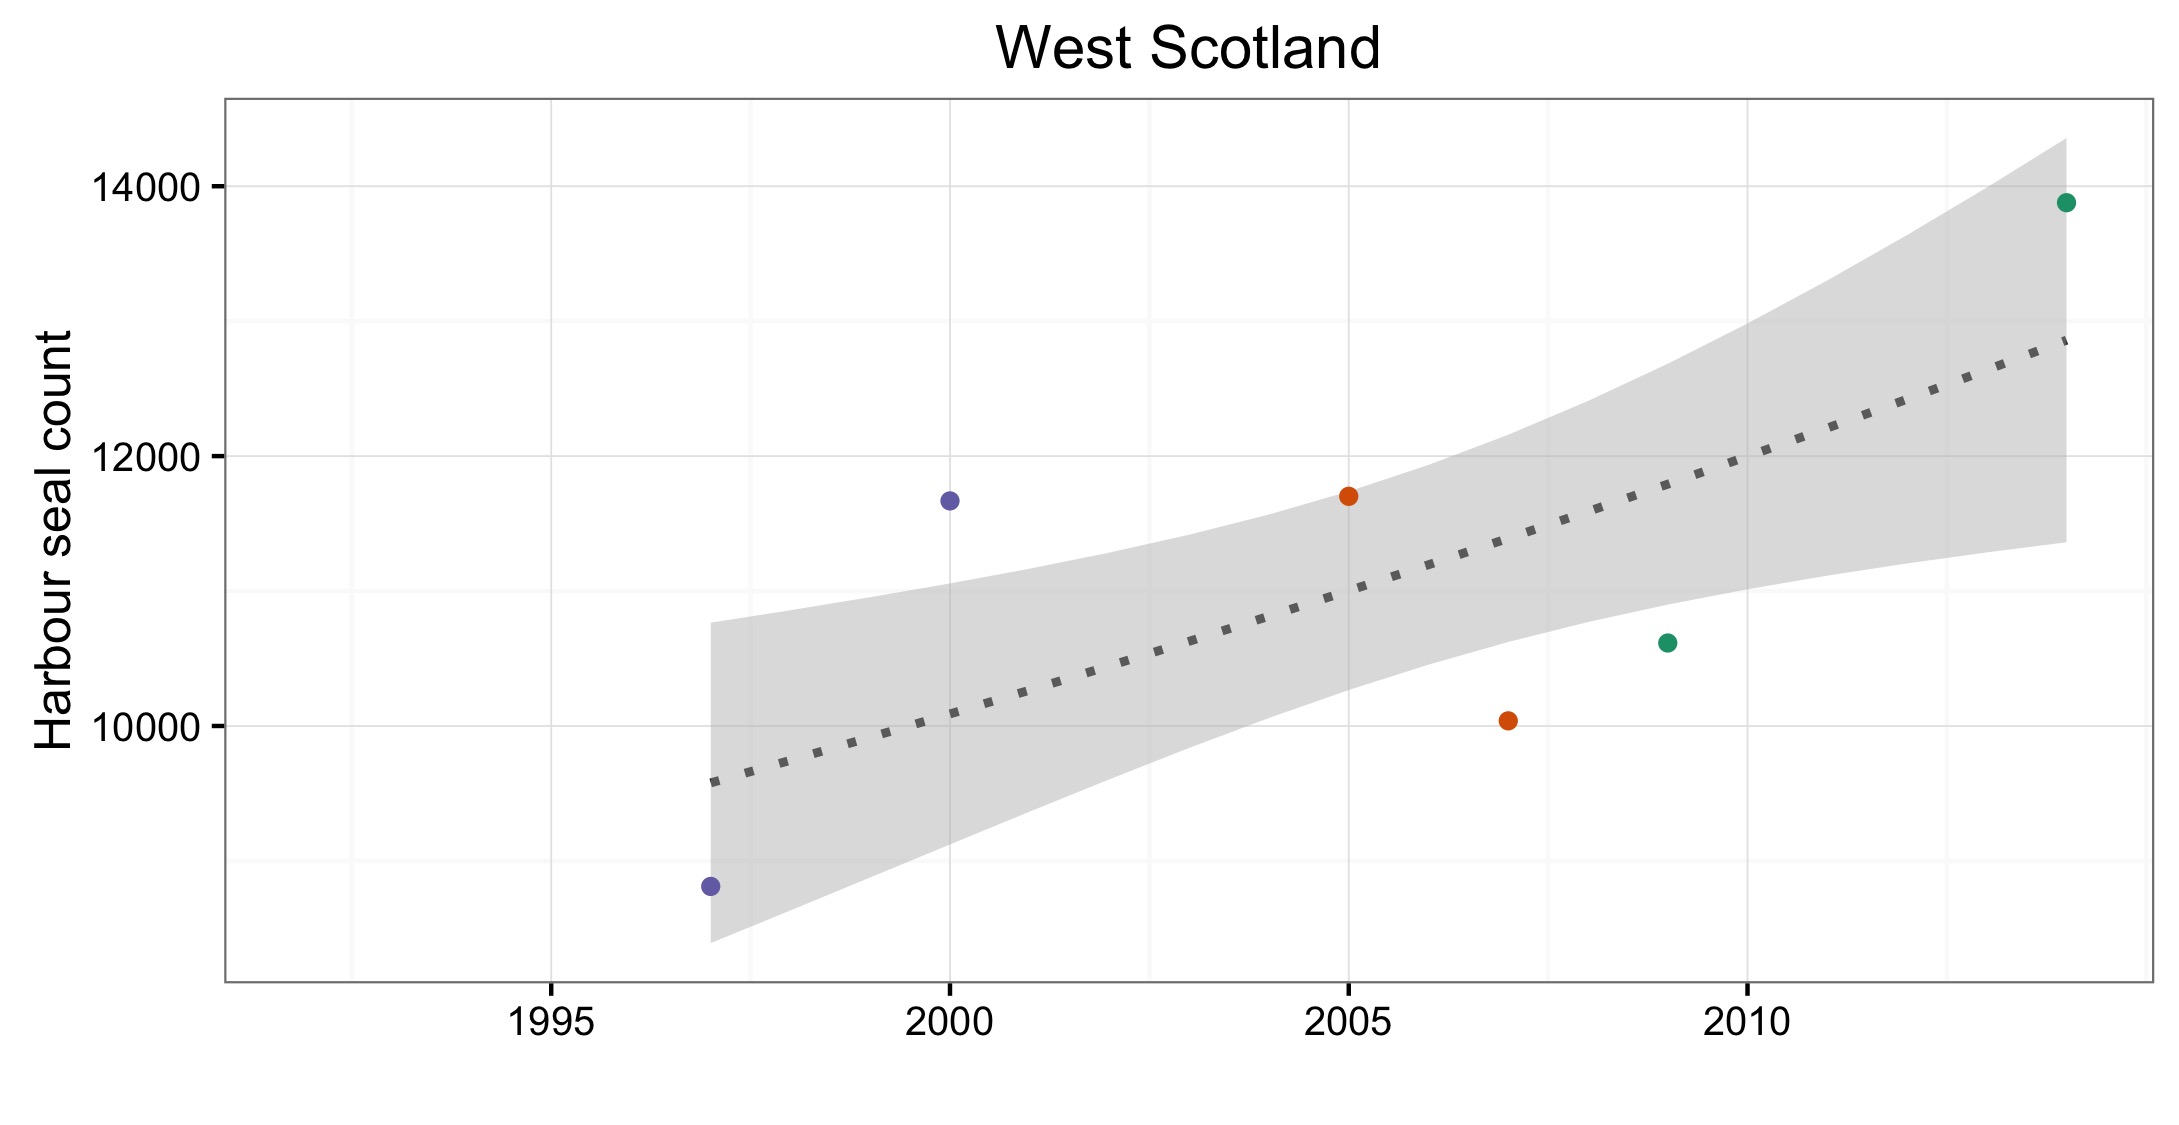
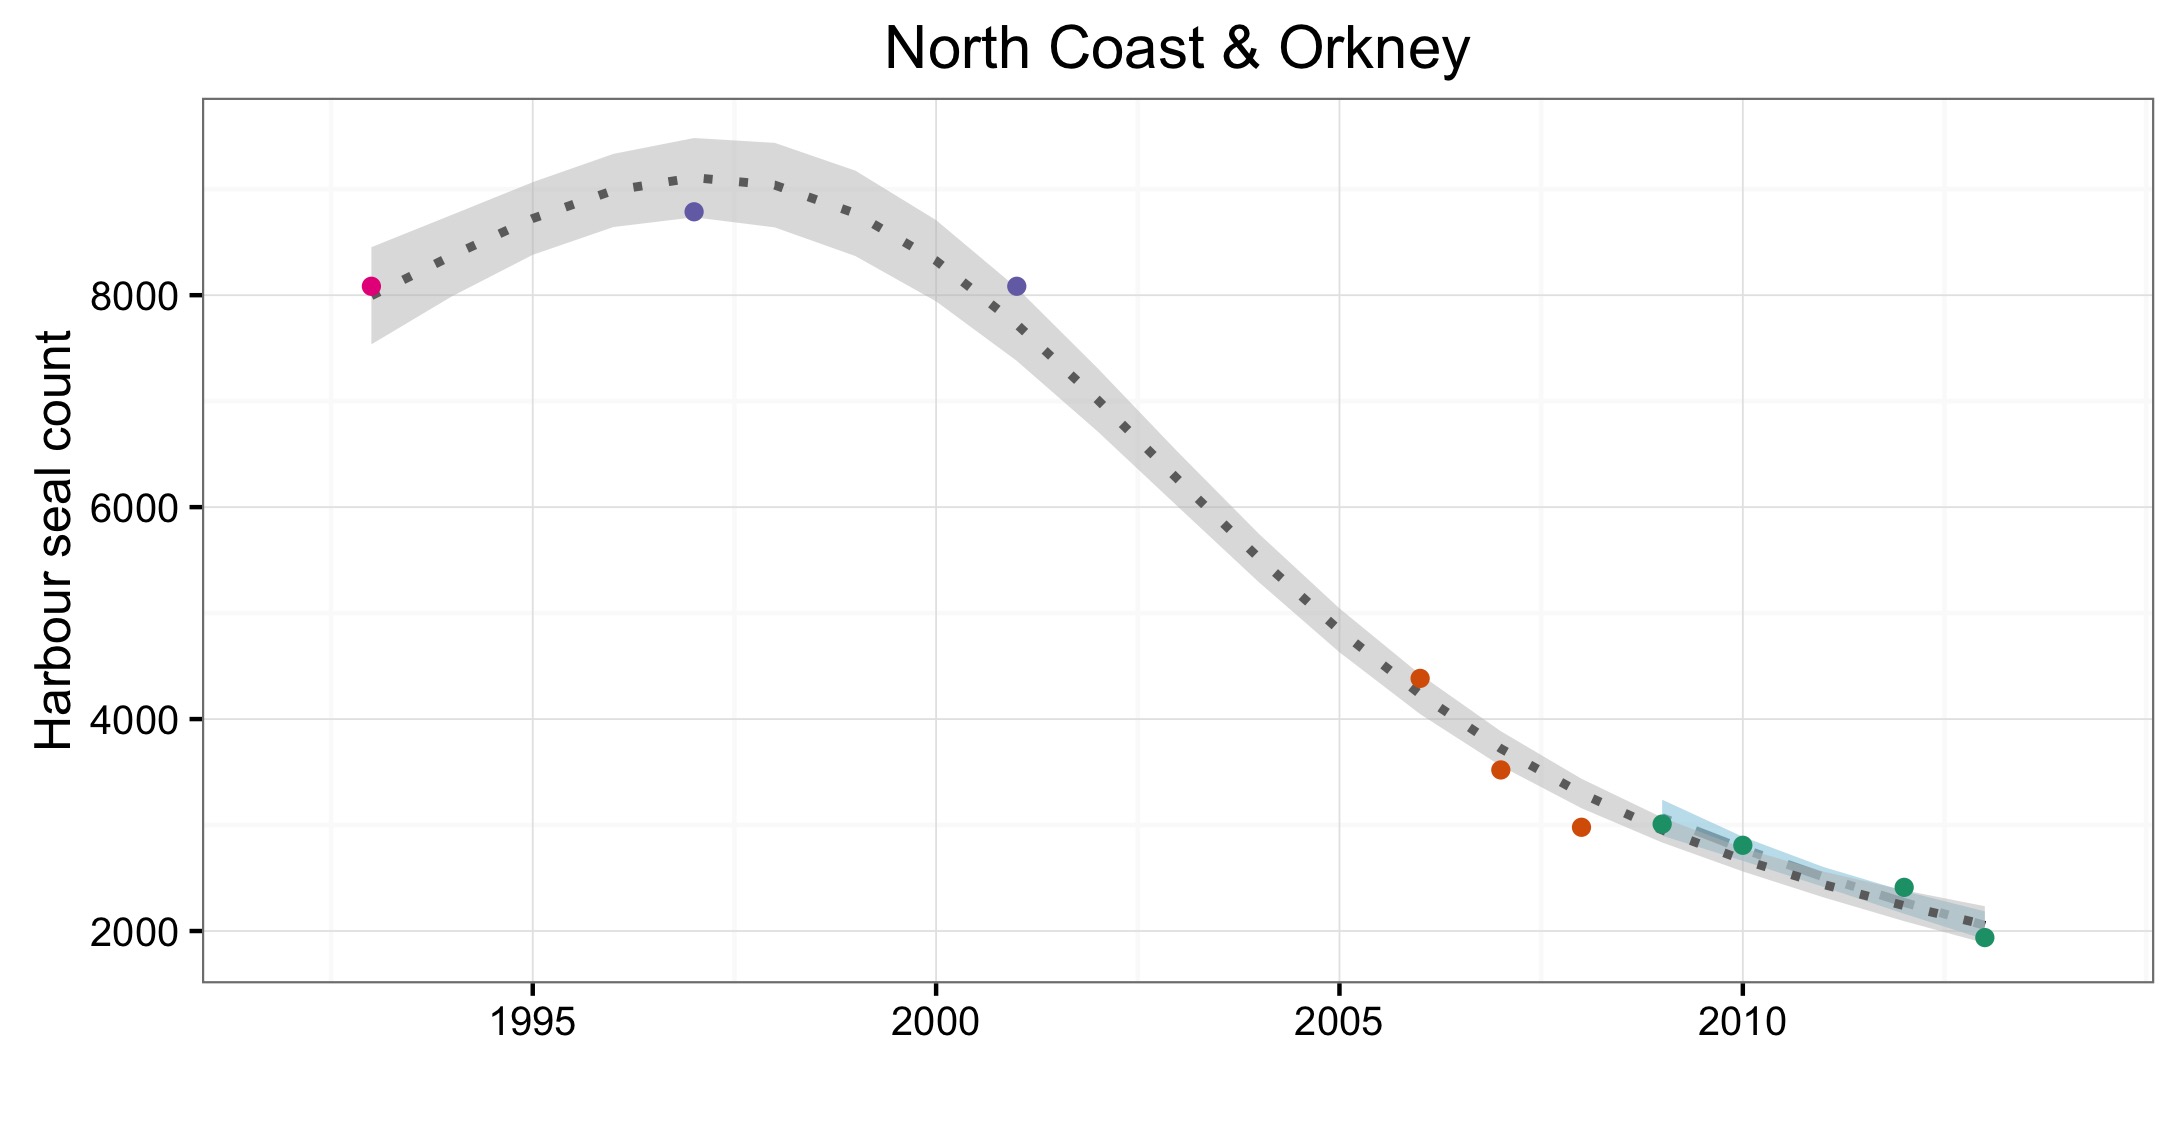
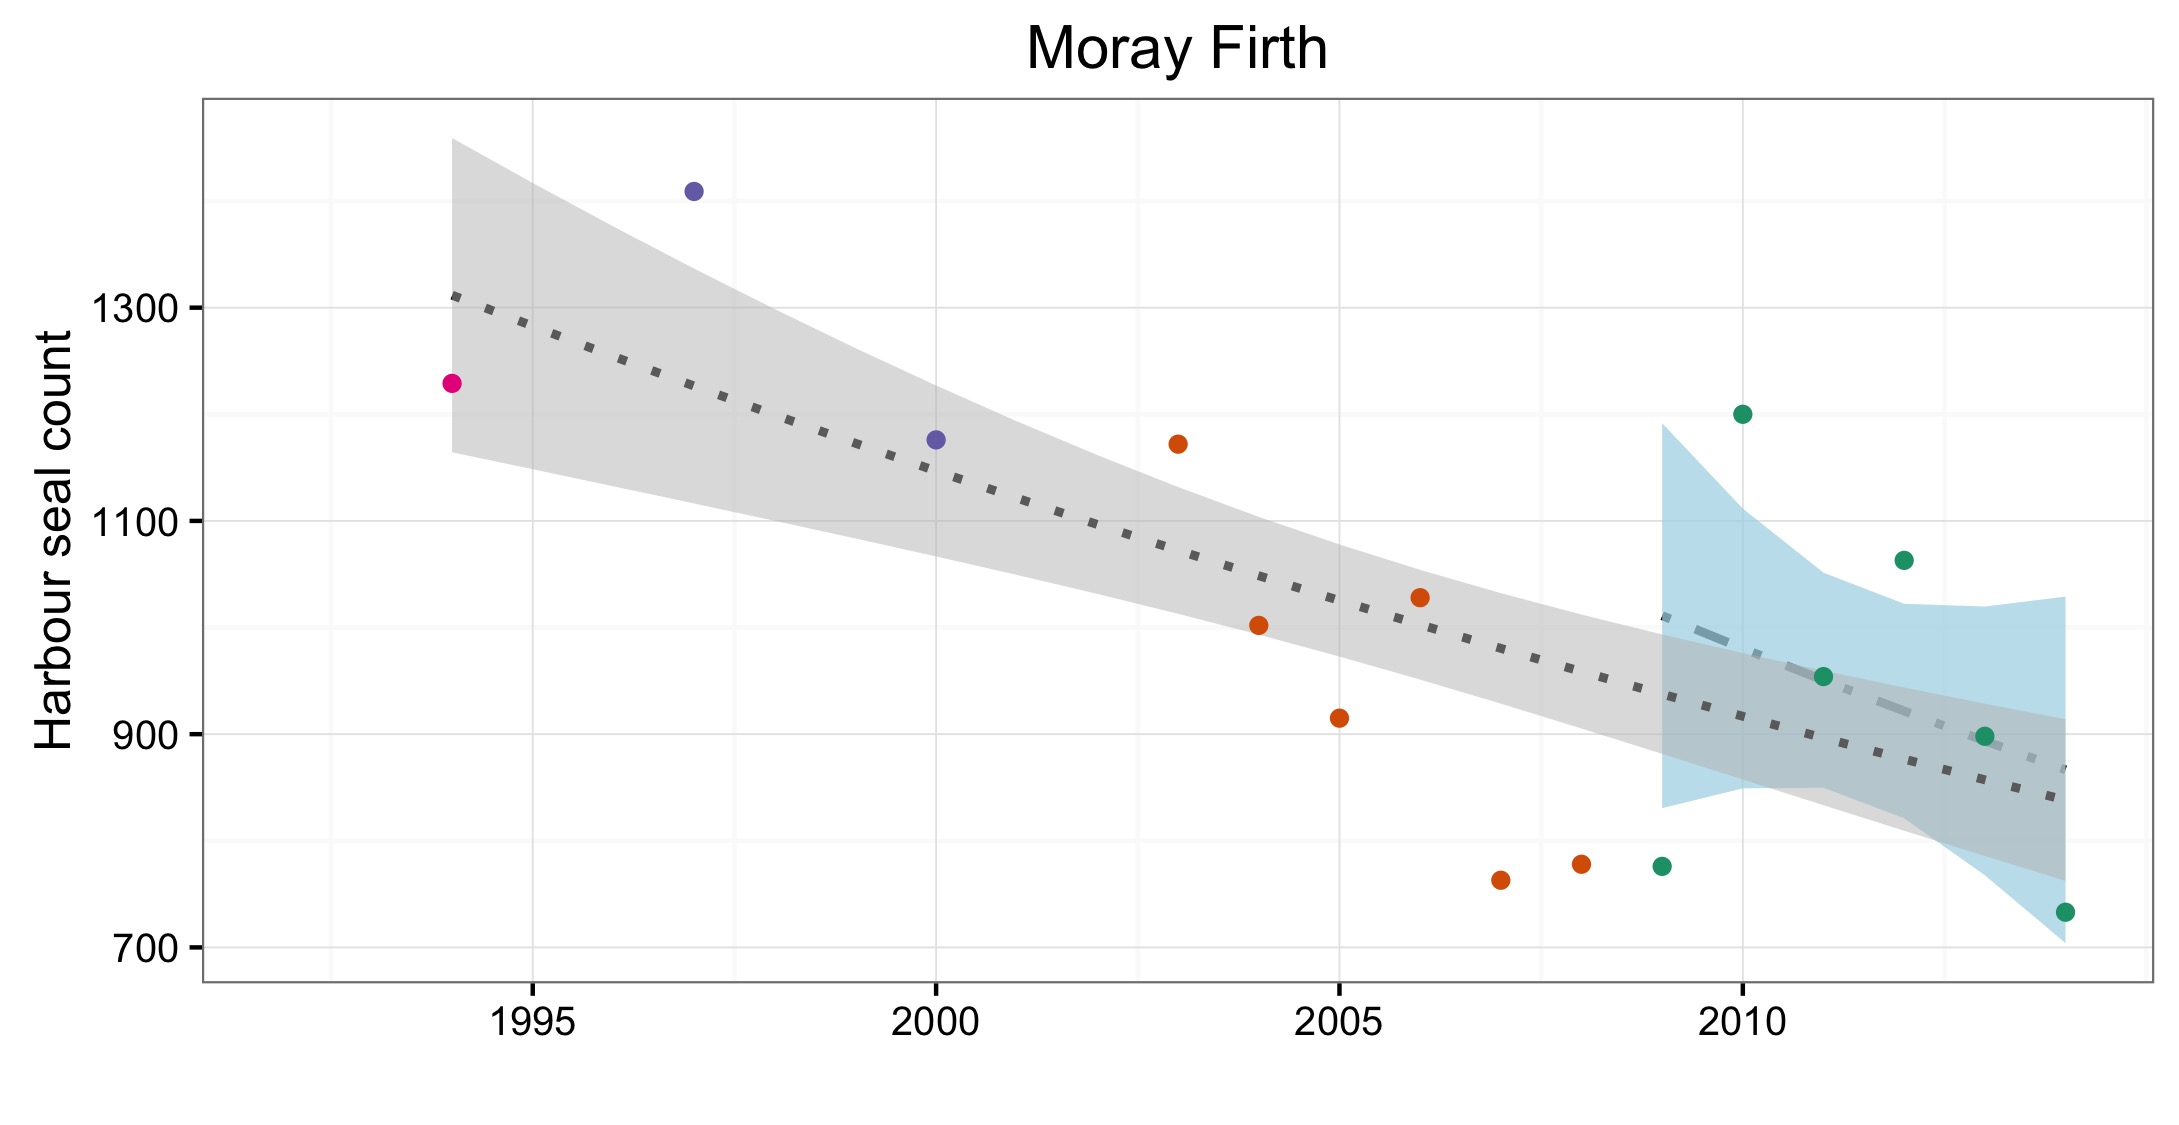
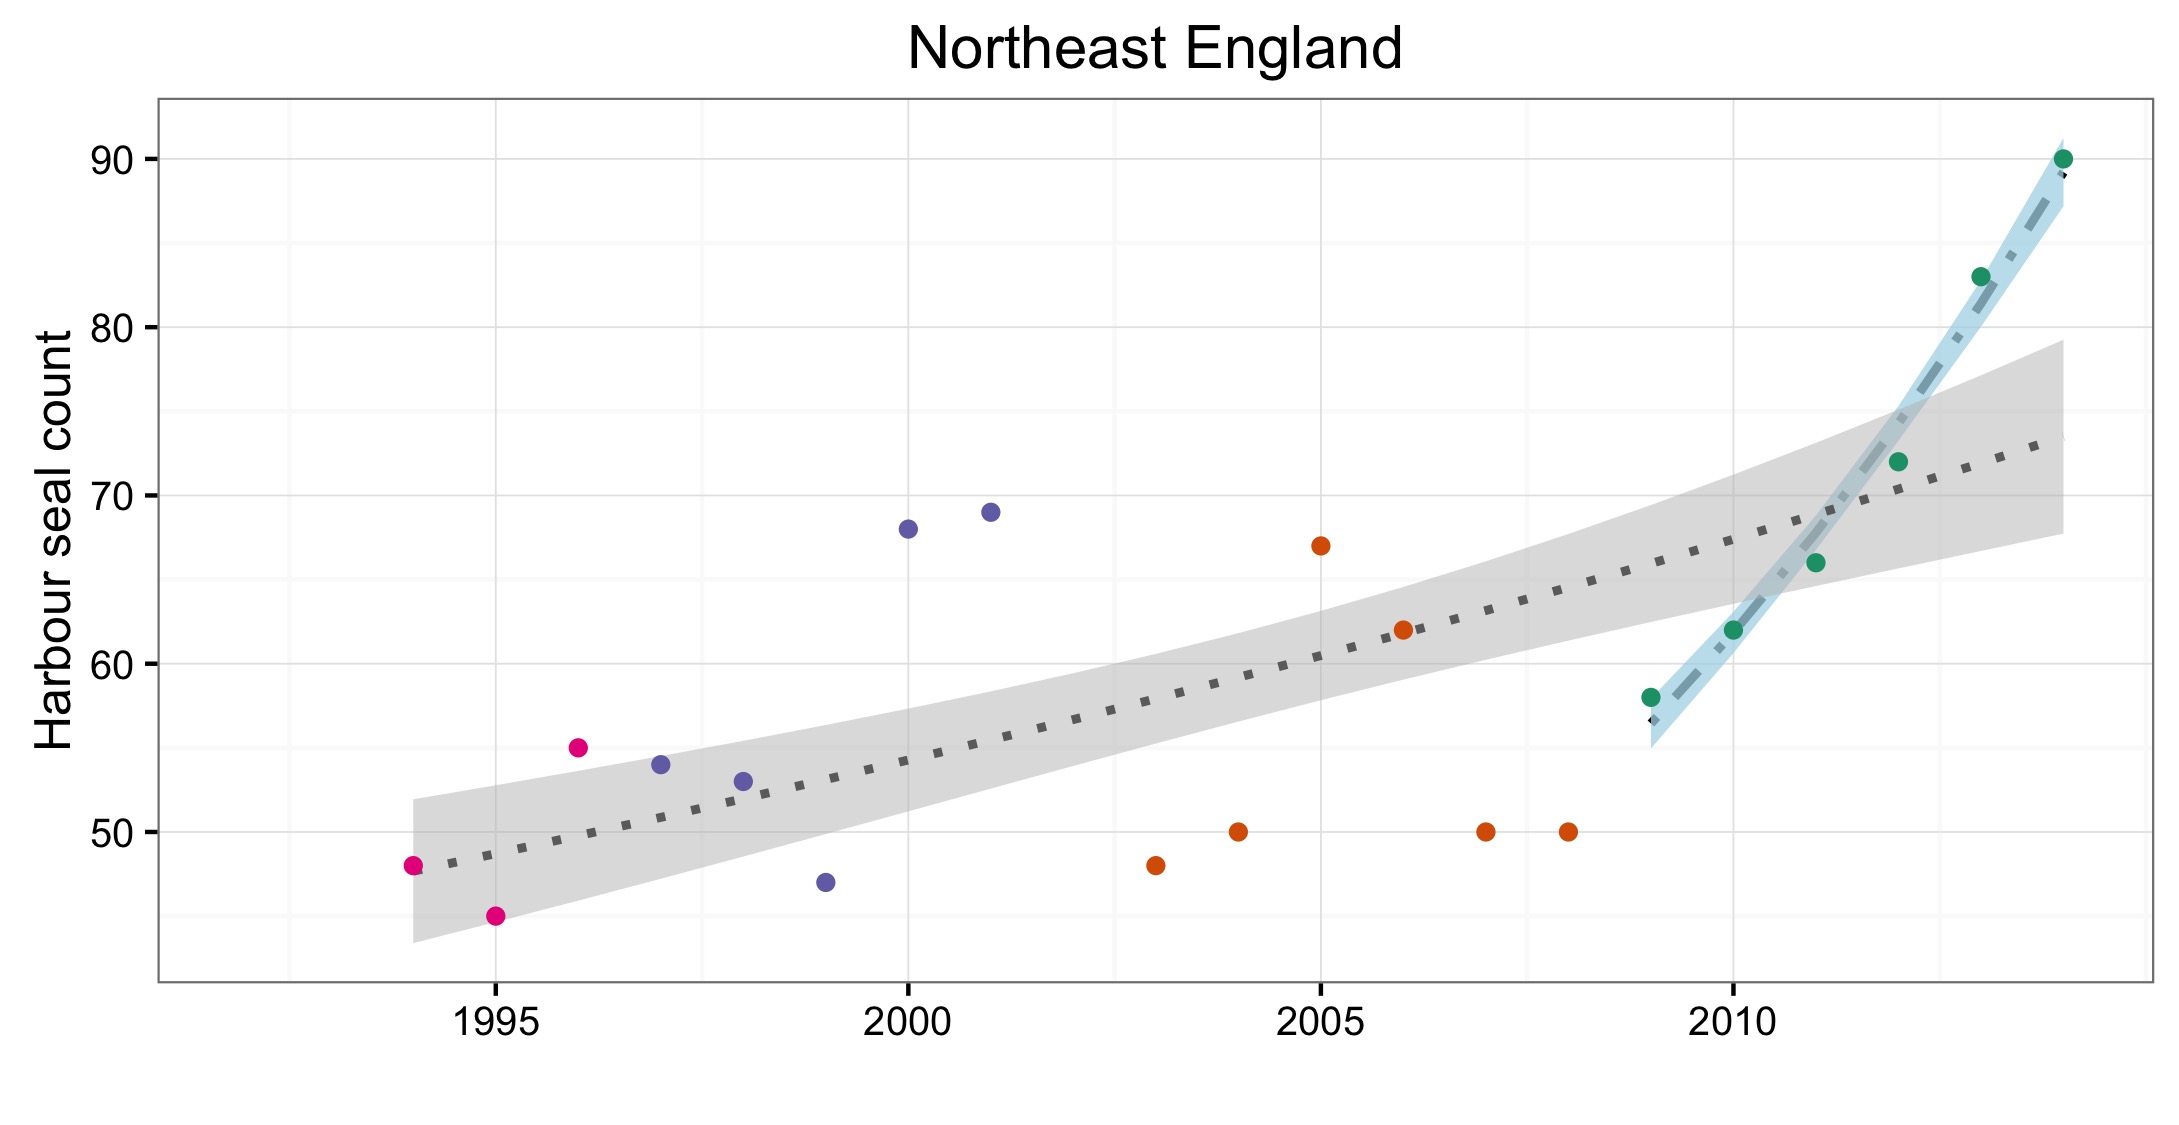
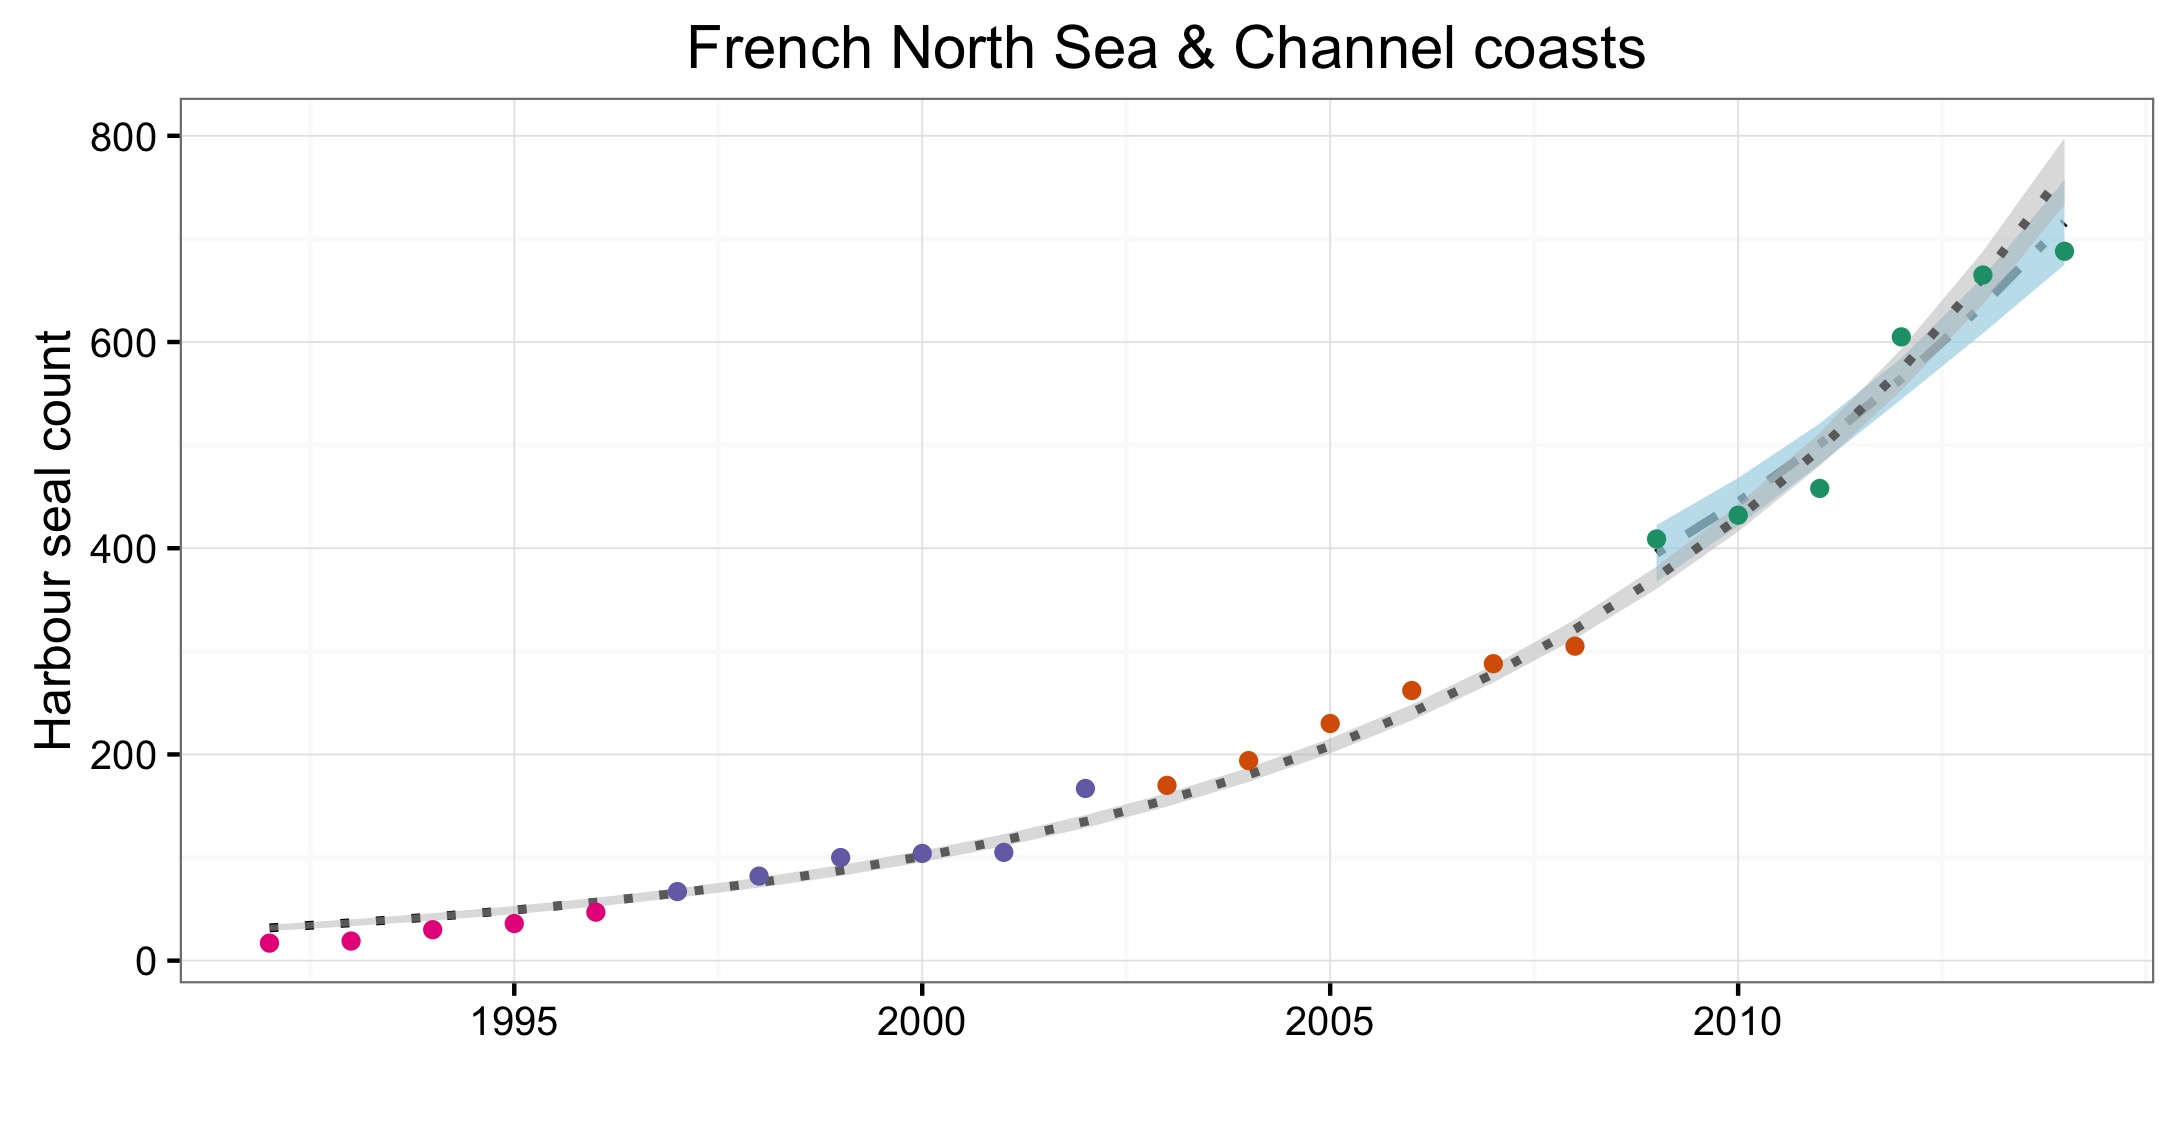
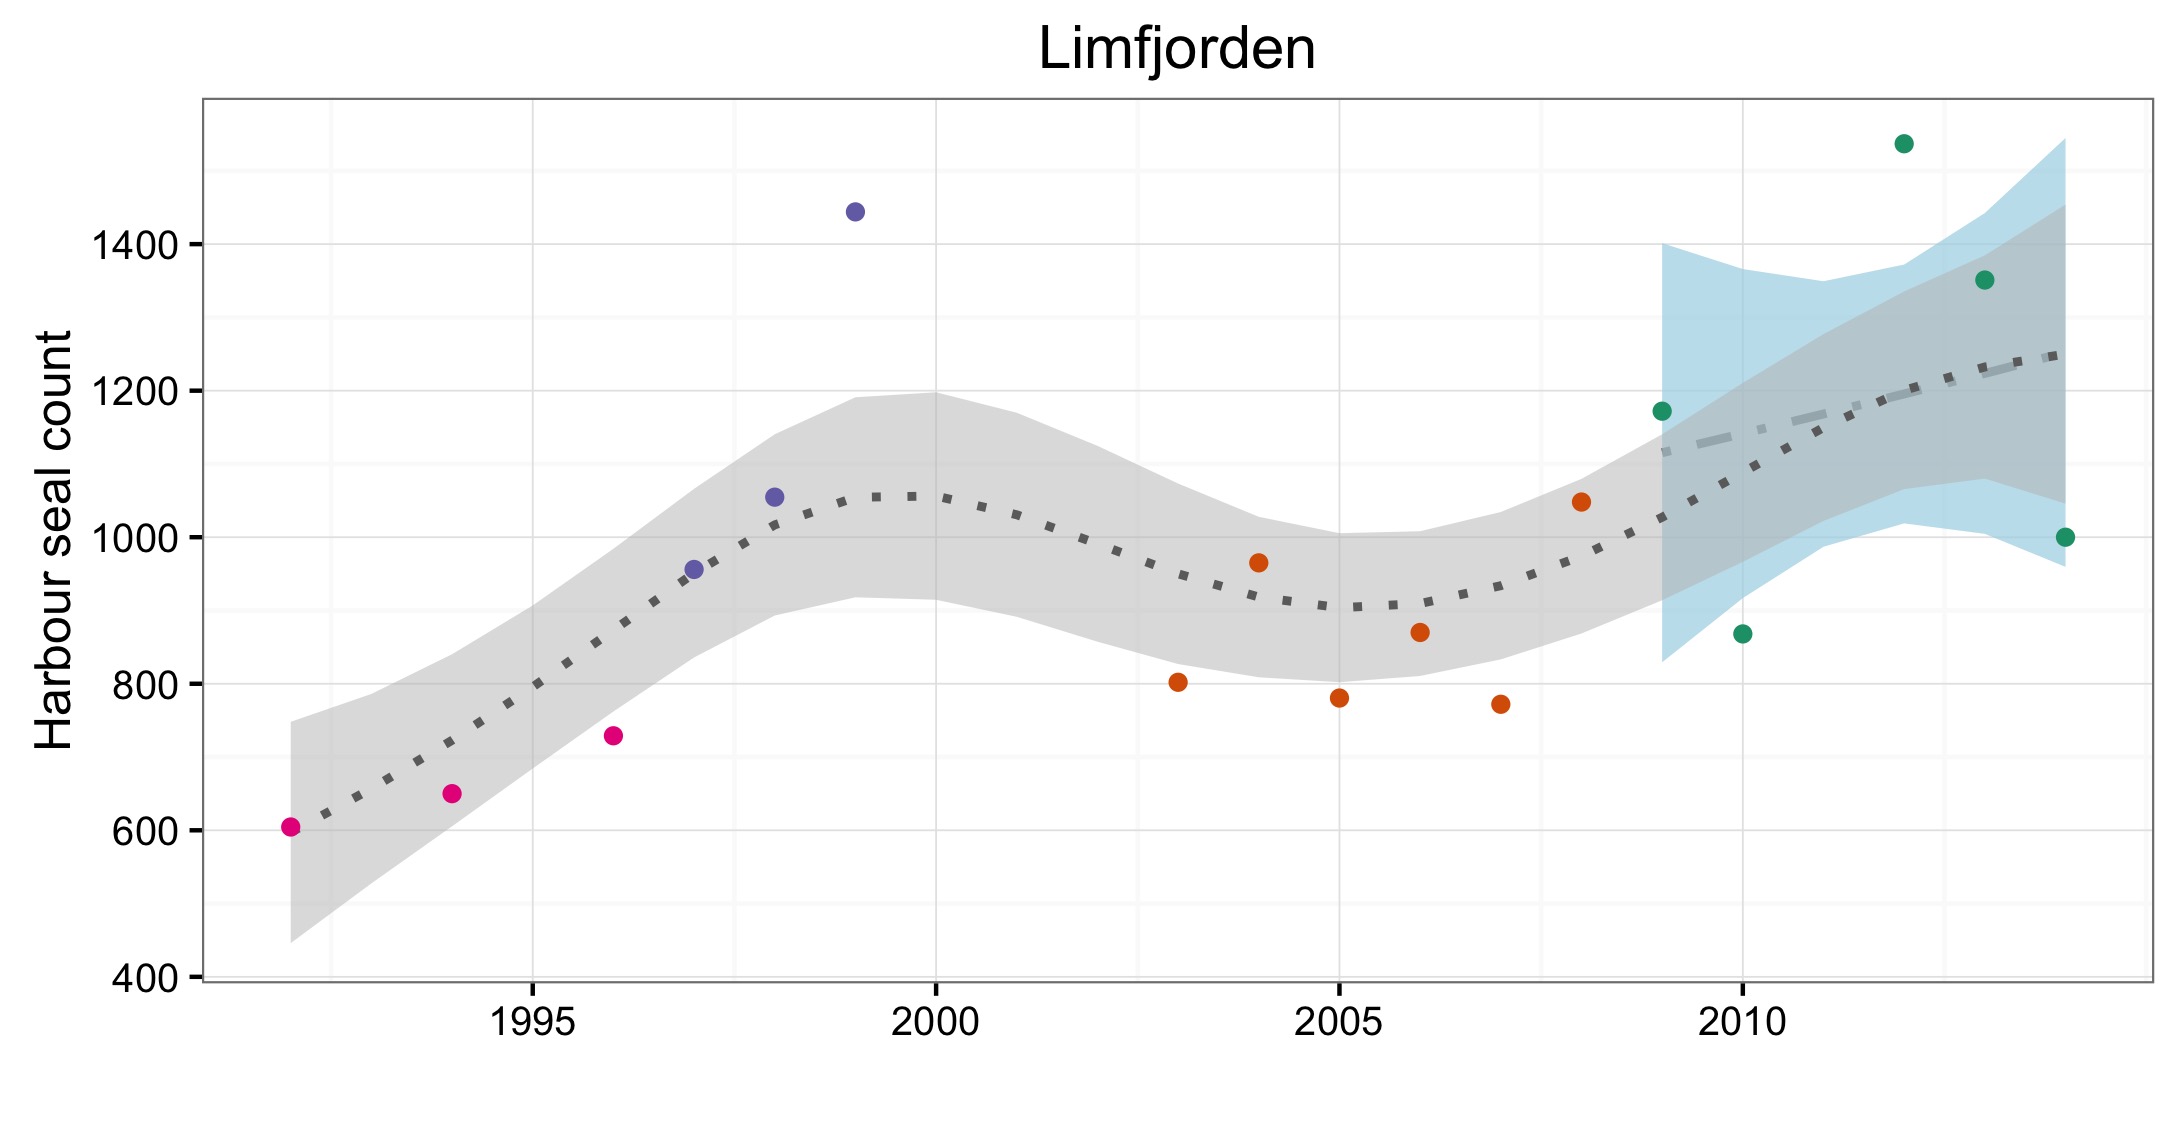
Figure d: Trends in harbour seal abundance from surveys of haul-outs during the harbour seal moult (August) in each Assessment Unit (see Figure b)
Points denote observed numbers of seals, coloured according to four periods between 1992 and 2014: 1992–1996 (pink), 1997–2002 (purple), 2003–2008 (orange), 2009–2014 (green). Modelled trends in annual abundance are shown for the period from the start of the time-series (baseline year) to 2014 (dash line) and for 2009–2014 (dotted and dashed line); the 80% confidence interval around each trend is shown as a greyed area on the plot. Assessment units: 1. Northern Ireland, 3. West Scotland, 4. Western Isles, 5. North coast & Orkney, 6. Shetland, 7. Moray Firth, 8. East Scotland, 9. North-east England, 10. South-east England, 15. French North Sea & Channel Coast, 17. Wadden Sea, 18. Limfjorden, 19. Kattegat.
Grey Seal
Changes in the number of colonies occupied by breeding grey seals were either stable or increasing in all areas where the animals occur and such data were available.
In those AUs where grey seals are counted during their annual moult, the results of the assessment indicate that grey seal numbers were increasing or stable over the two time periods (Table d; Figure e). On the Belgium Coast and Dutch Delta (AU16), the French North Sea and English Channel Coast (AU15) and Wadden Sea (AU17), both grey and harbour seal numbers are increasing.
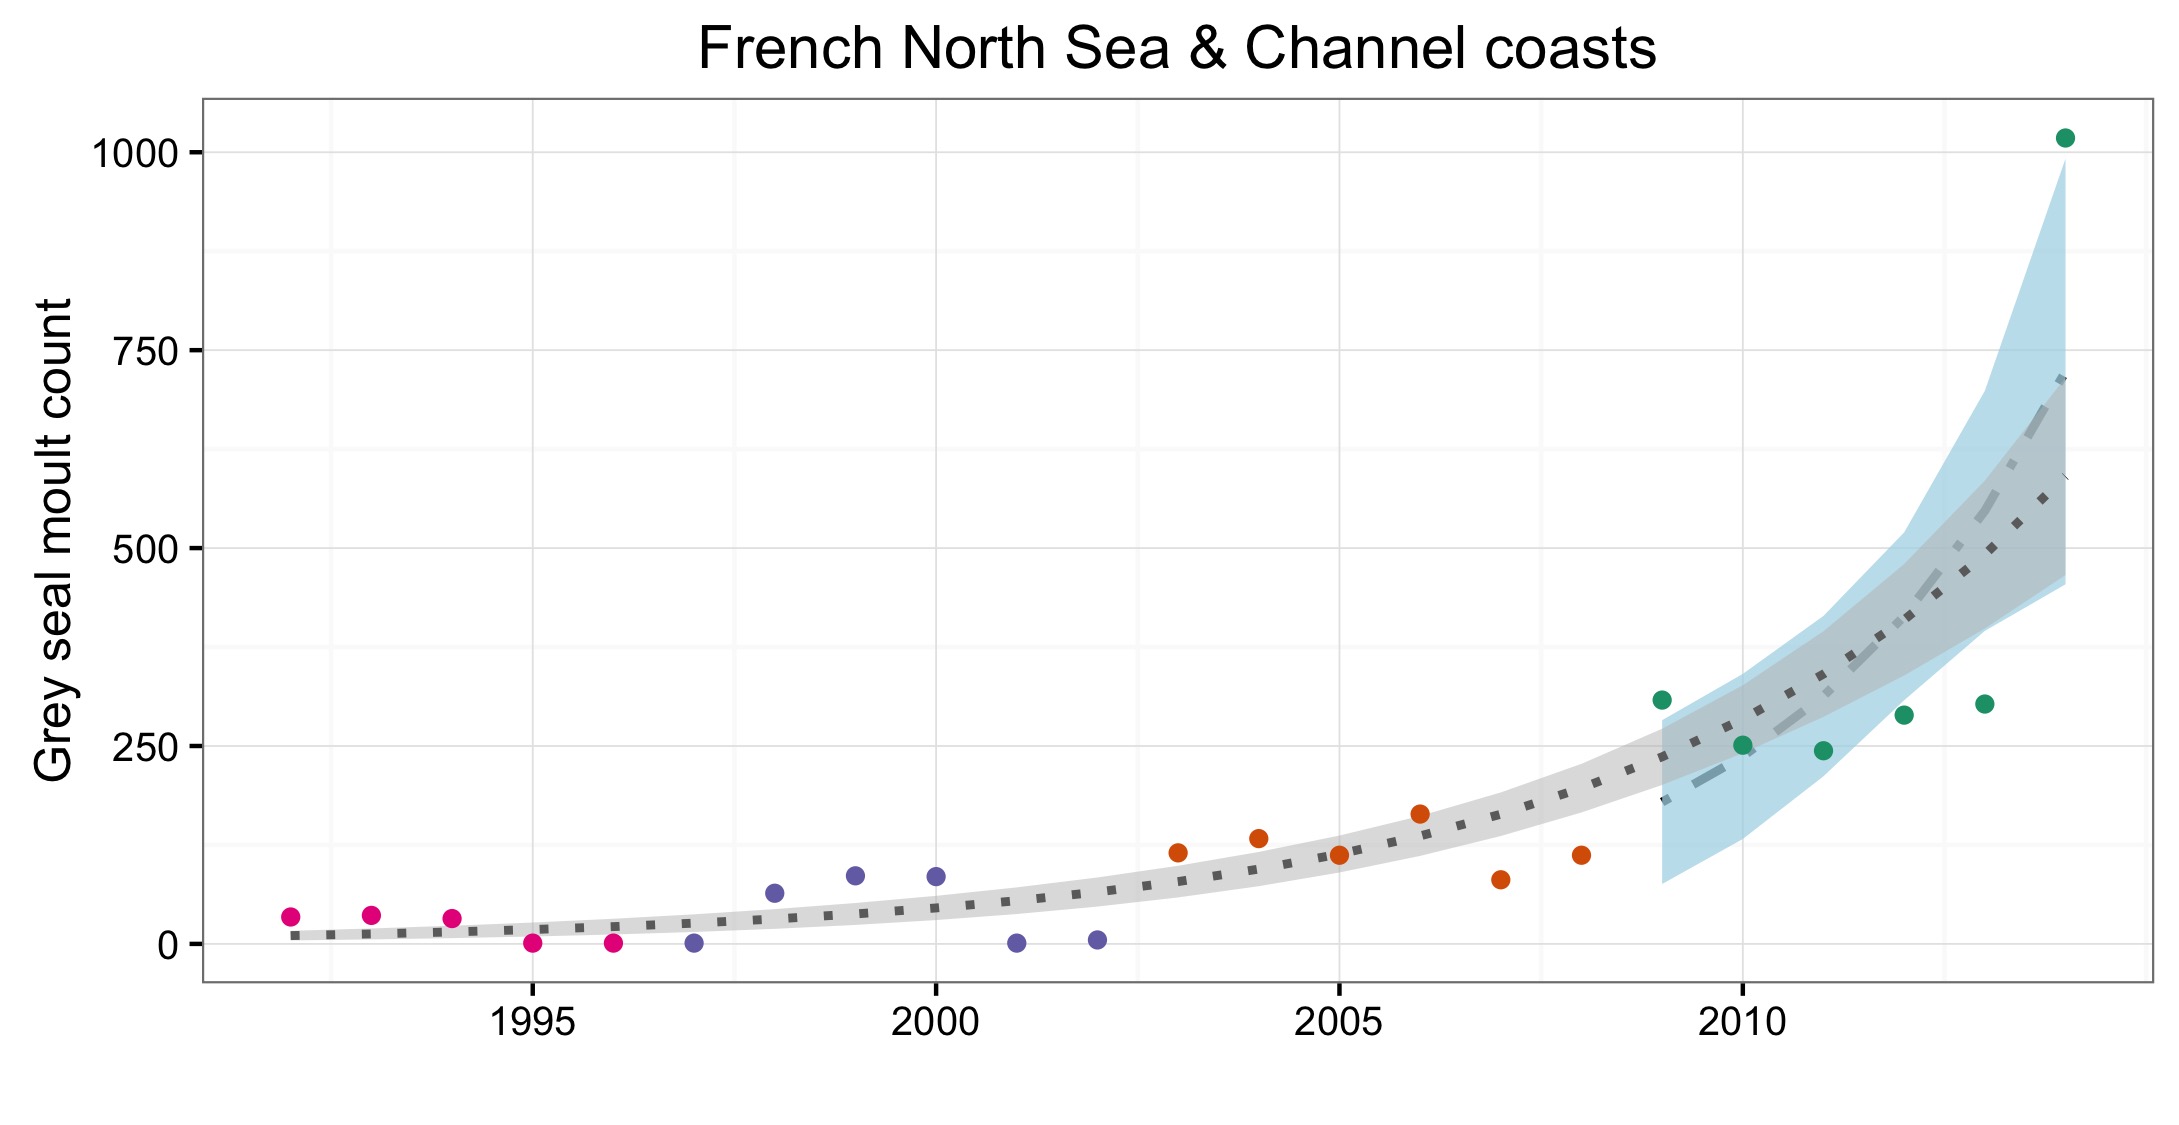
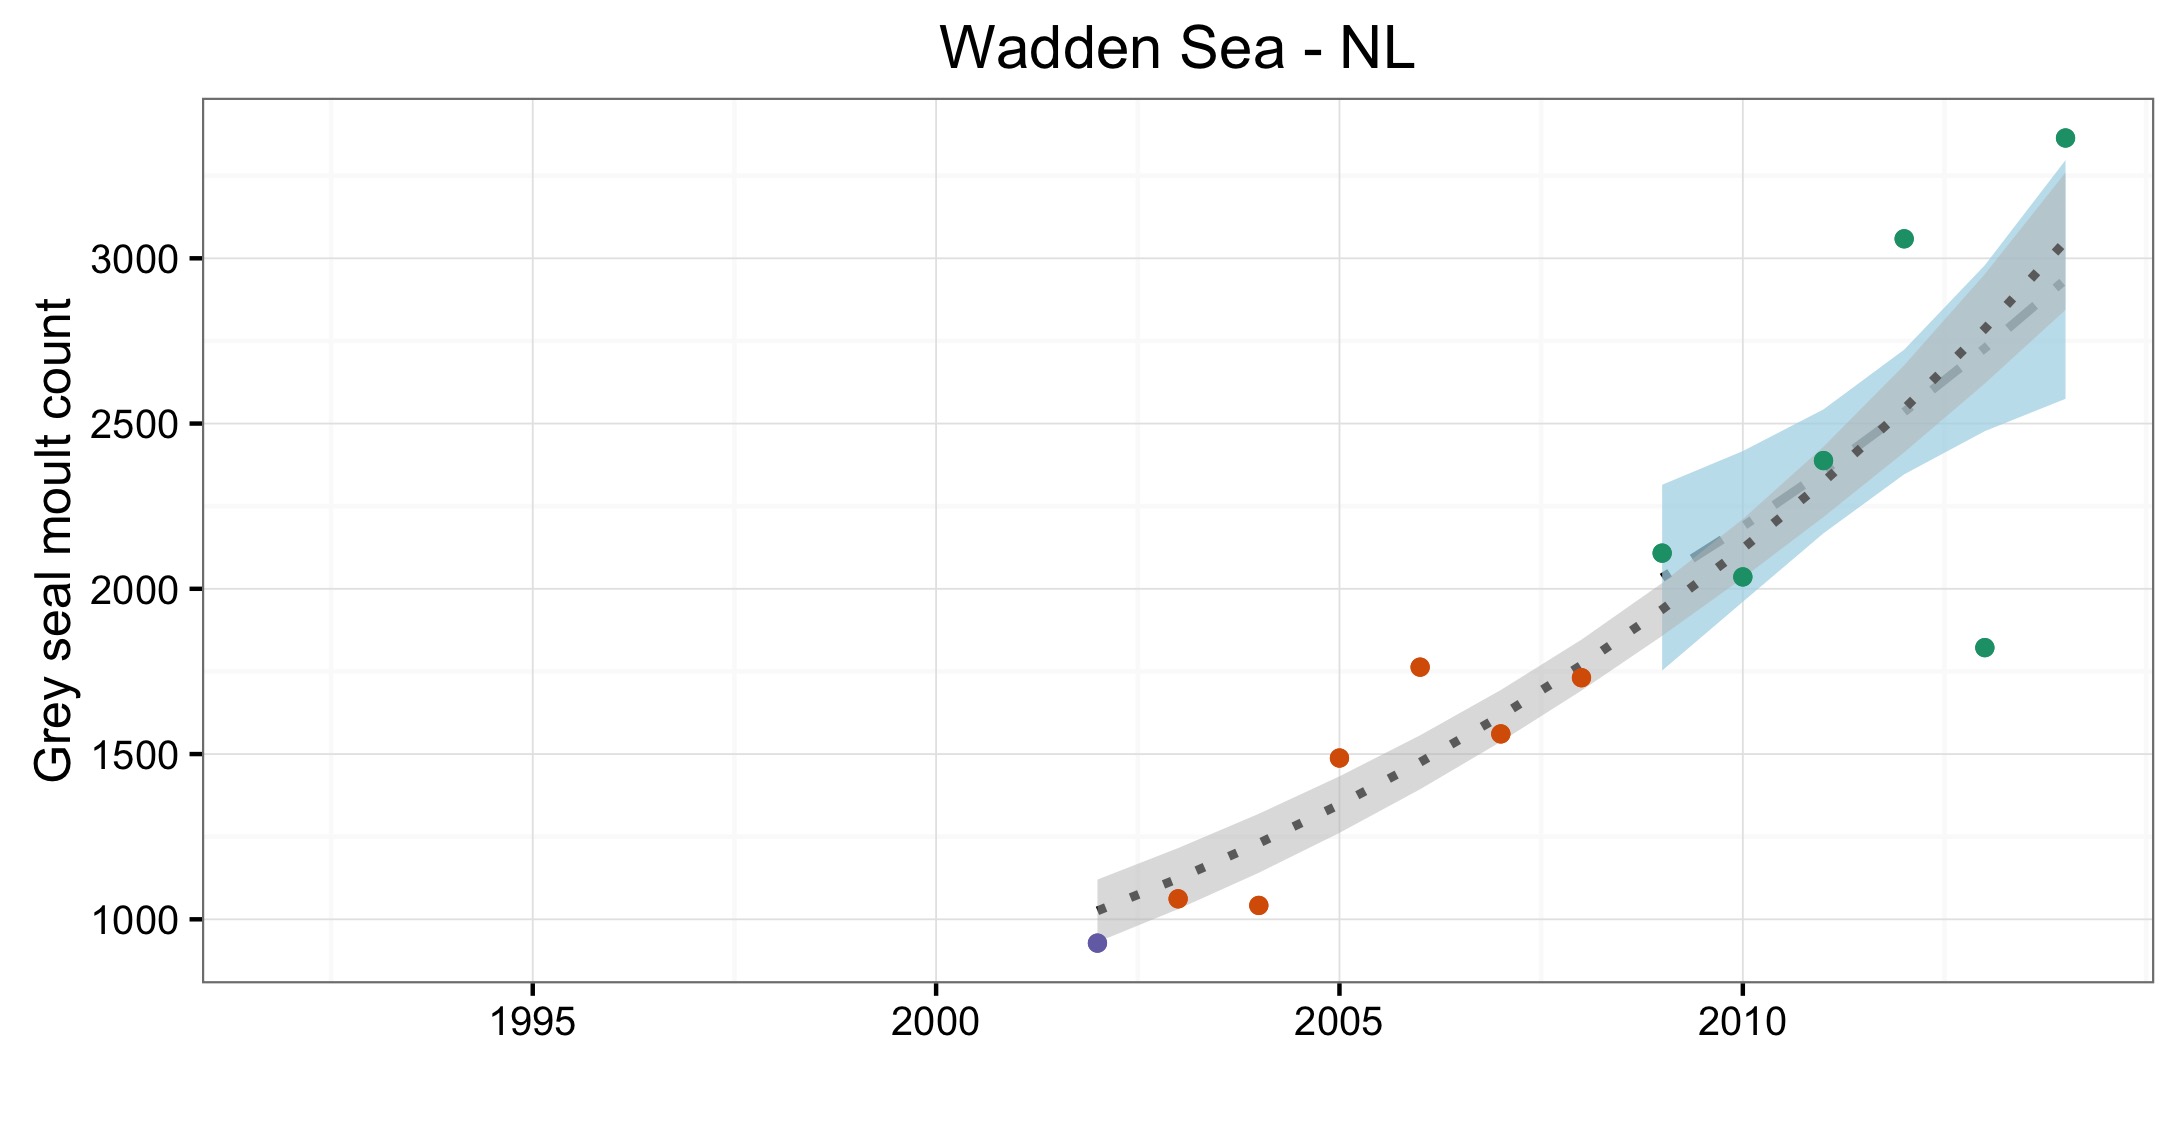
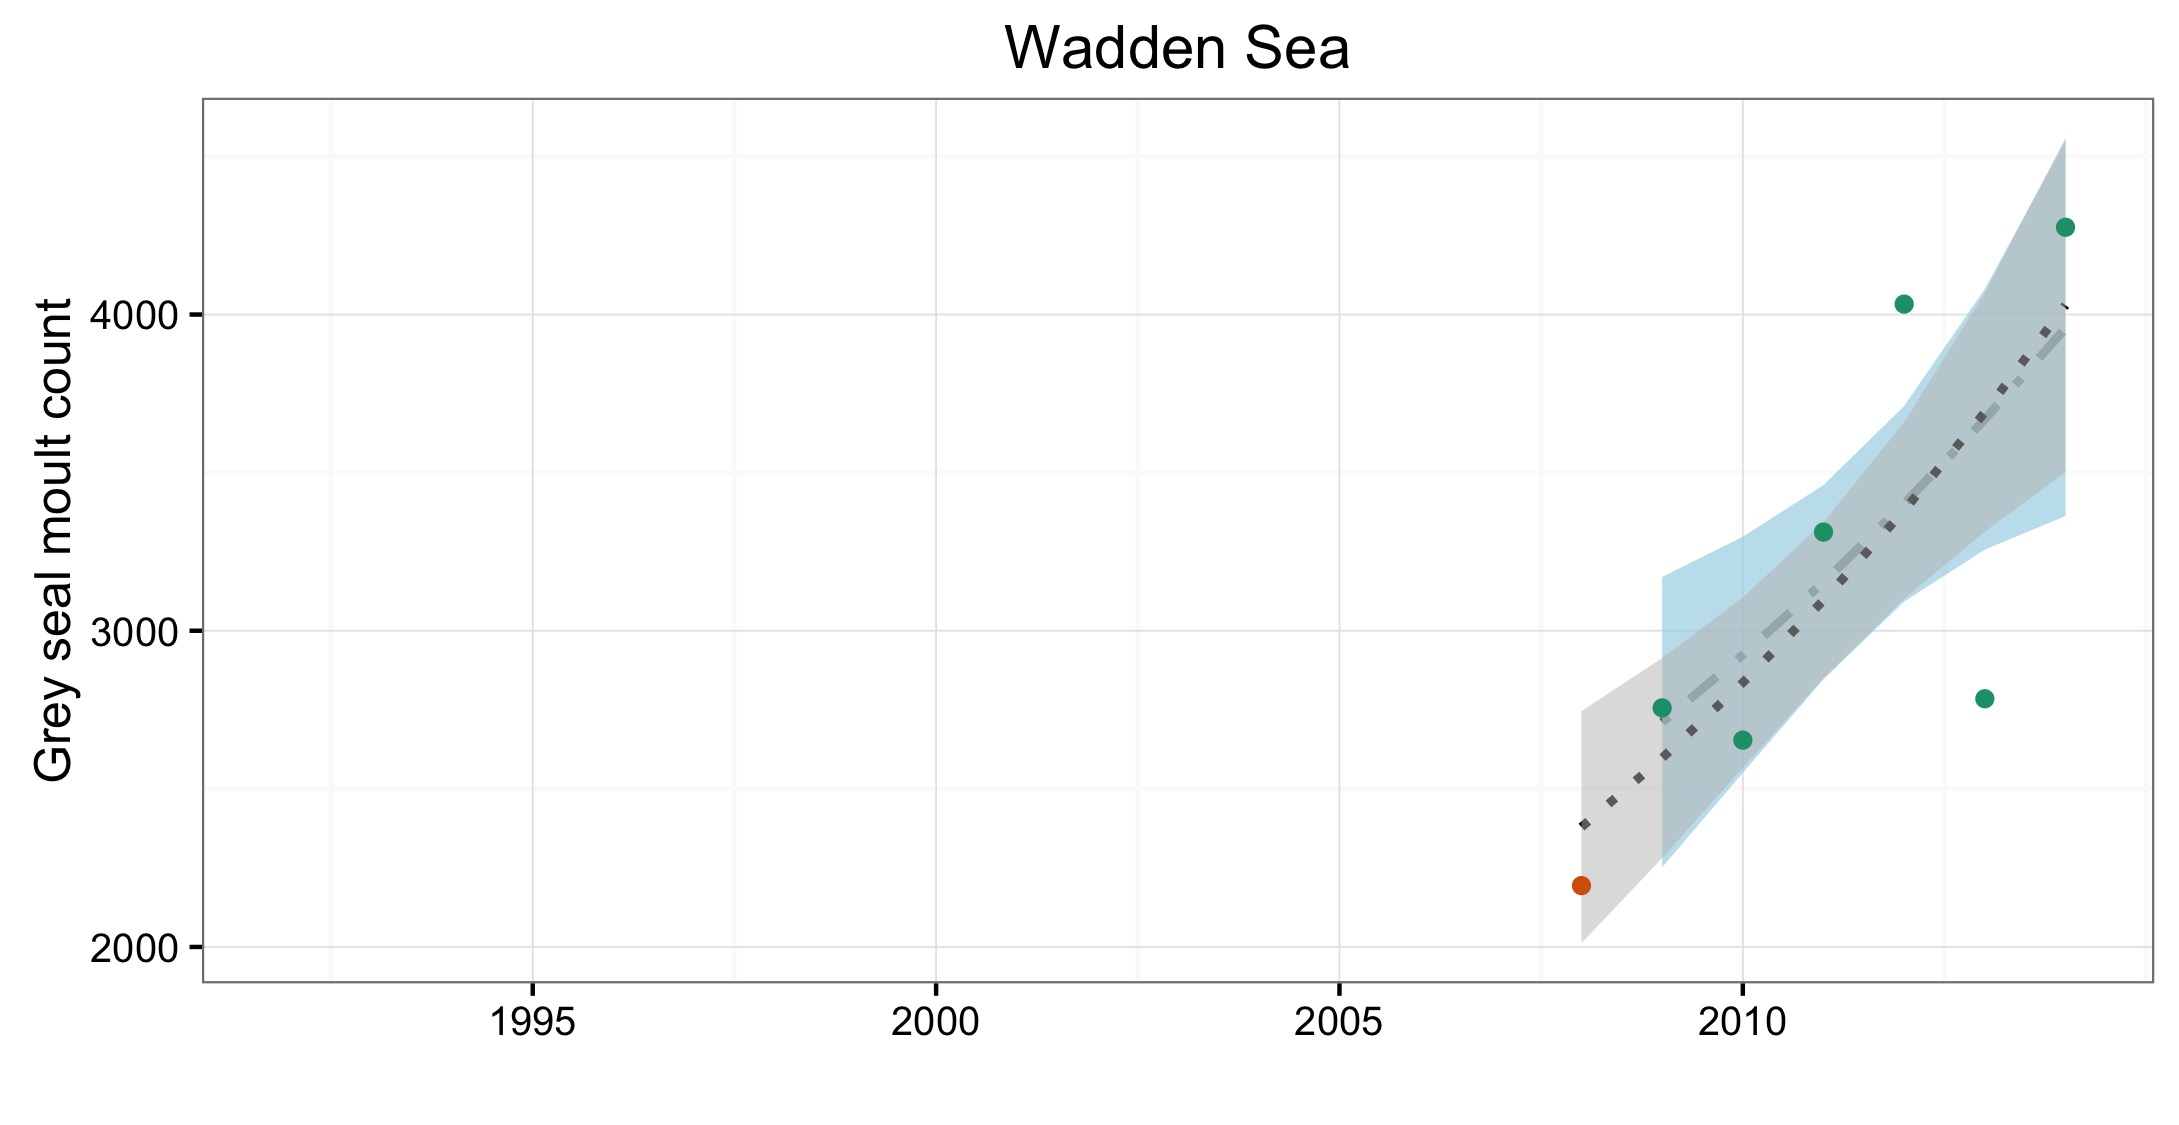
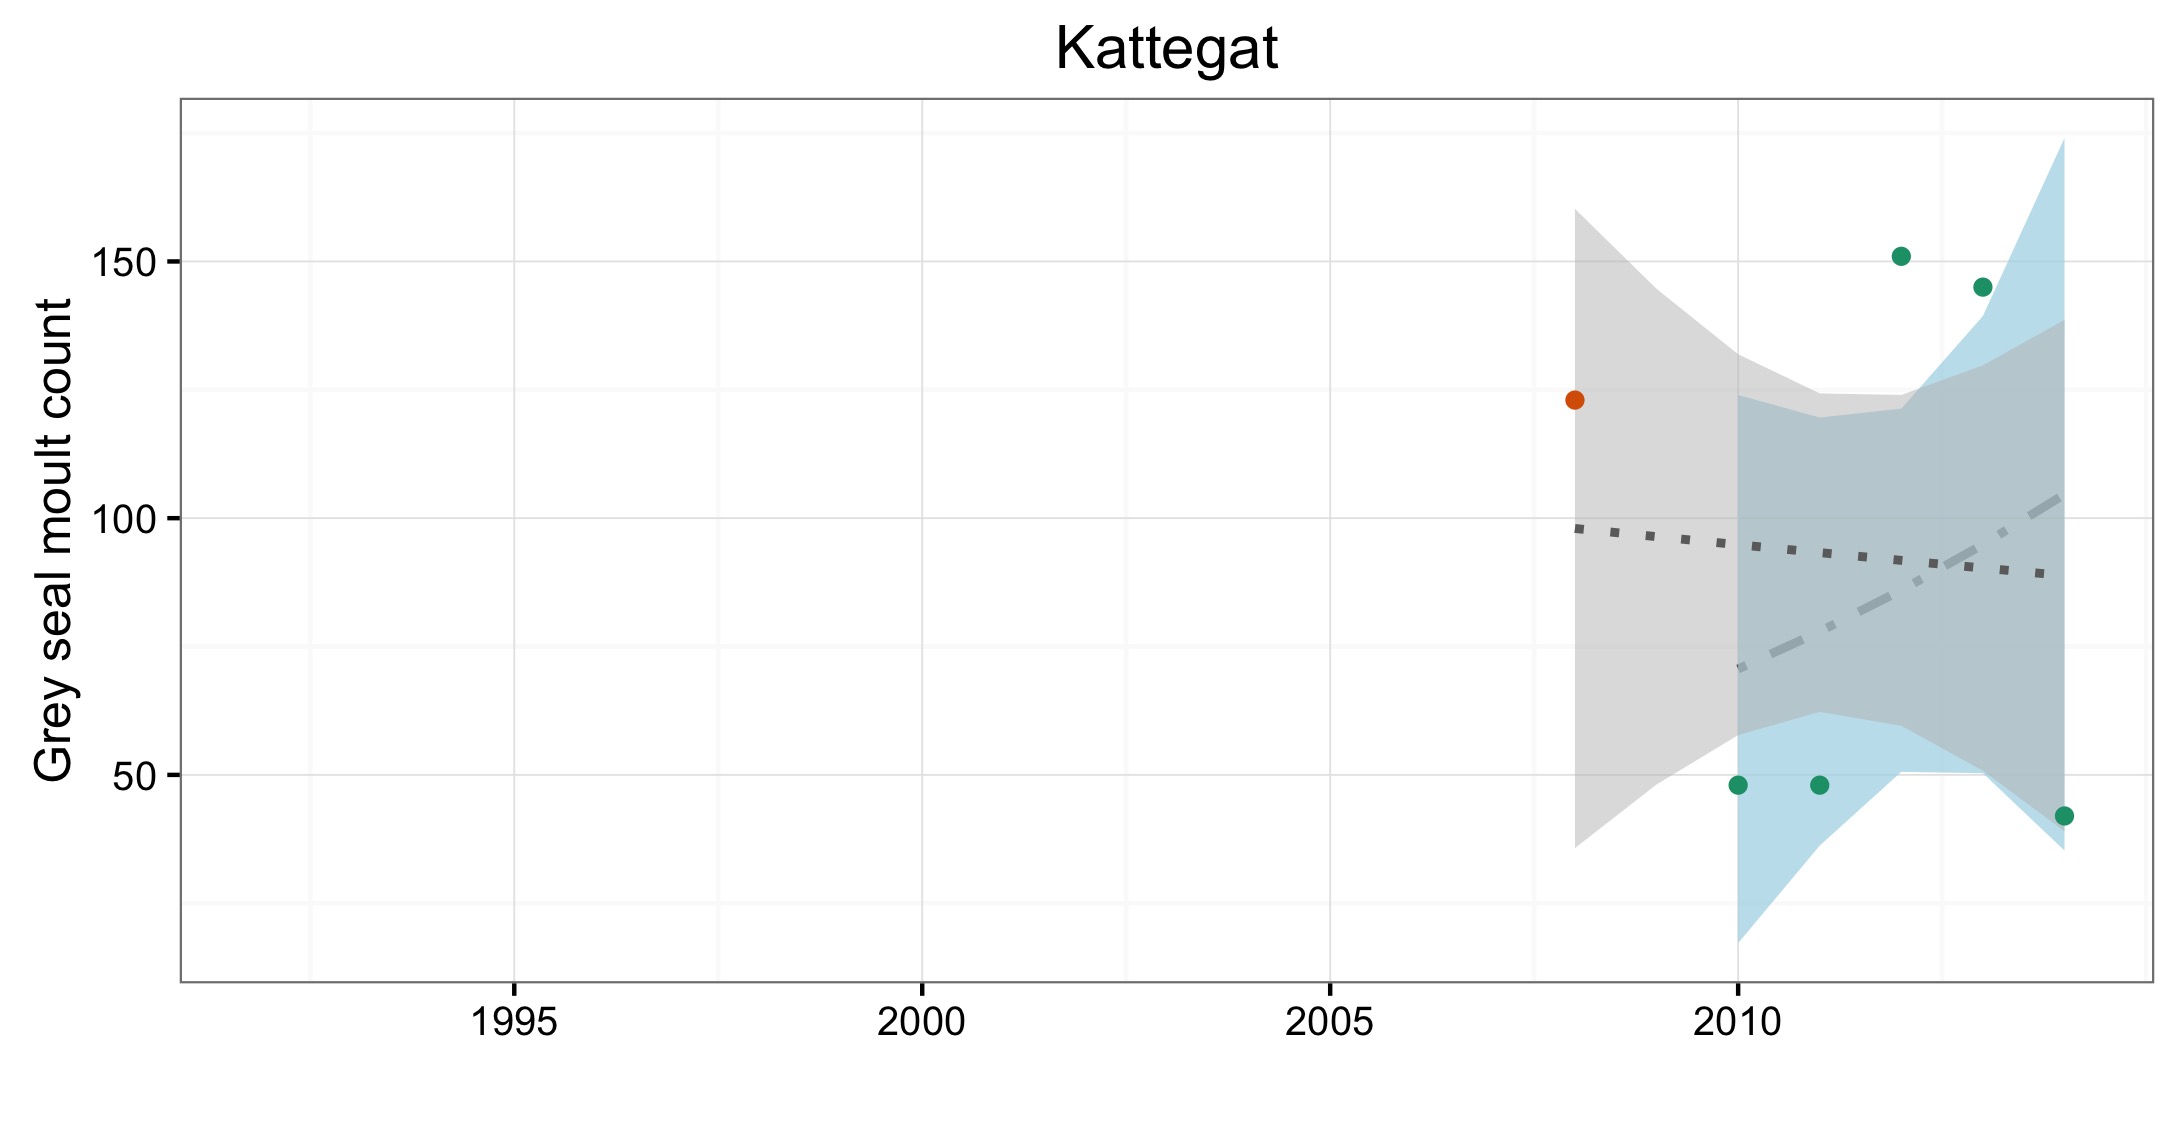
Figure e: Trends in grey seal abundance from surveys of haul-outs during the grey seal moult (early spring) in Assessment Units (Figure b) where counts of moulting grey seals are regularly undertaken
Points denote observed numbers of seals, coloured according to four periods from 1992 to 2014: 1992–1996 (pink), 1997–2002 (purple), 2003–2008 (orange), 2009–2014 (green). Modelled trends in annual abundance are shown for the period from the start of the time series (baseline year) to 2014 (dash line) and for 2009–2014 (dotted and dashed line); the 80% confidence interval around each trend is shown as a greyed area on the plot. Assessment Units: 15. French North Sea and English Channel Coast, 17. Wadden Sea, 17a. Wadden – Netherlands only (longer times eries); 19. Kattegat.
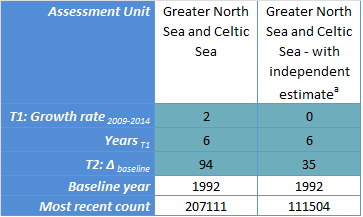
The population model predicted that the grey seal population in the Greater North Sea and Celtic Seas (excluding Norway) is currently growing (Figure f). When the summer population estimate (2008) is included in the model, the rate of growth is slower (left panel Figure f). This first run of the model is encouraging but the modelling approach needs further refinement. Both the short- and long-term assessment values were met, using either modelling approach ( Table c ). The estimate from the population model is based on pup production data and an independent estimate derived from summer counts of grey seal adults. These are combined to produce the trend in the right panel of Figure f (without independent estimate). Because the uncertainty around the summer population estimate (point in 2008) is much less than that around the population estimate from the pup model, the summer population estimate has more weight and hence the combined model (left panel) is much closer to the summer population estimate than the original population model prediction.
Table c: Changes in grey seal abundance in the Greater North Sea and United Kingdom part of Celtics Seas combined (see Assessment Unit in Figure a)
Based on surveys of grey seal haul-outs during the harbour seal moult (August) and on pup production at grey seal colonies (autumn/winter).
Key for Table c
Threshold 1 (T1): Growth rate 2009-2014 refers to the annual growth (%) in abundance between 2009 and 2014.
Threshold 2 (T2): Δbaseline refers to the change in abundance since the baseline year.
Years T1 refers to the number of years of count data in the period 2009–2014.
The baseline year refers to 1992 or the start of the time series if later.
The most recent count refers to the most recent count of animals; this may not have occurred in 2014.
a See text for details of the model used.
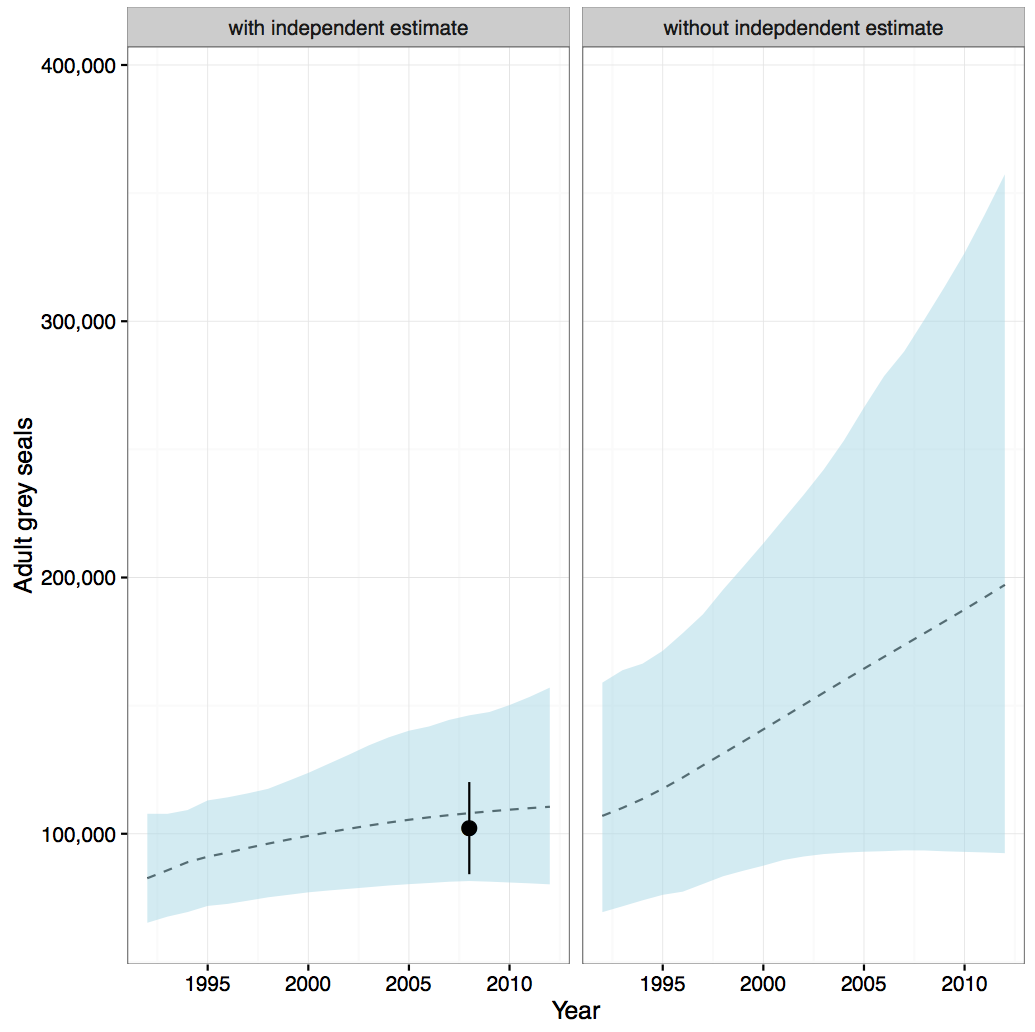
Figure f: Predicted trends in grey seal abundance in the Greater North Sea (excluding Norway) and United Kingdom part of Celtics Seas combined (see Assessment Unit in Figure a)
Left panel: mean trend (dashed line) predicted from a model derived from data on pup production at grey seal colonies, combined with the 2008 summer population estimate (shown as a point with 95% confidence interval), derived from counts of grey seals hauled-out during harbour seal moult surveys. Right panel: mean trend predicted from a model derived from data on pup production alone. Greyed areas indicate 95% confidence intervals of mean trends.
Table d: Changes in grey seal abundance and distribution from surveys of haul-outs during the grey seal moult (early spring) in Assessment Units (Figure b) where counts of moulting grey seals are regularly undertaken.
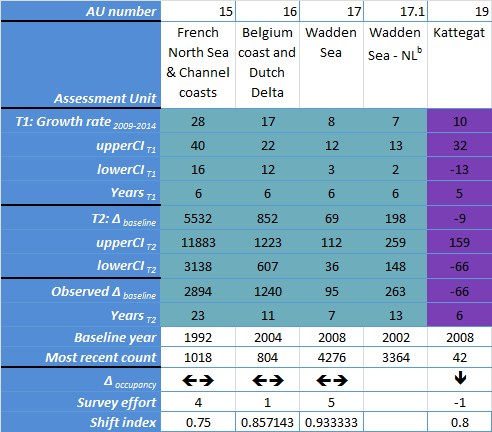
Table e: Changes in the distribution of grey seal breeding colonies in each Assessment Unit (see Figure b).
Key for Table d
Threshold 1 (T1): Growth rate 2009-2014 refers to the annual growth (%) in counts between 2009 and 2014.
T2: Δbaseline refers to the change in numbers since the baseline year.
Upper and lower 80% limits for the confidence intervals are given for both parameters based on modelled growth rates (upperCIT1, lowerCIT1 and upper CIT2, lowerCIT2 respectively).
YearsT1 and YearsT2 refers to the number of years of count data in the periods 2009–2014 and 1992–2014, respectively.
Observed change in numbers since the baseline, not from modelled data, is denoted by Observed Δbaseline.
The baseline year refers to 1992 or the start of the time series if later.
The most recent count refers to the most recent count of animals; this may not have occurred in 2014.
Δoccupancy refers to the change in occupancy of sub-areas between the periods 2003–2008 and 2009–2014. This is marked as increasing (é) if index is greater than 10%; or decreasing (ê) if the index is negative and less than -10%; or otherwise, no change (çè).
The change in the number of subareas surveyed between the periods 2003–2008 and 2009–2014 is denoted by Survey effort.
bDutch portion of Wadden Sea only (longer data series).
Key for Table e
Δoccupancy refers to the change in occupancy of subareas between the periods 2003–2008 to 2009–2014. This is marked as increasing (é) if index is greater than 10%; or decreasing (ê) if the index is negative and less than -10%; or otherwise, no change (çè).
The change in the number of subareas surveyed between the periods 2003–2008 and 2009–2014 is denoted by Survey effort.
b Dutch portion of Wadden Sea only (longer data series).
Confidence Assessment
There is moderate / low confidence in the methodology used in this assessment. There is consensus within the scientific community regarding this methodology therefore the confidence could be considered moderate, however as the method has been developed specifically for this assessment and not been more widely used it is considered moderate / low.
The assessment is undertaken using data with a spatial coverage and temporal extent that is mostly sufficient for the area assessed but gaps are apparent in certain areas. As such, confidence in data availability is moderate.
Conclusion
Grey seal numbers have increased throughout the areas assessed, as they recover from historical hunting pressure. Harbour seals are in decline in parts of the north-east of the United Kingdom, but are stable or increasing in most other regions. The reason(s) for the marked and prolonged declines detected in Orkney (AU5), Shetland (AU6), and East Scotland (AU8) are presently unclear but major research initiatives are already in place to investigate potential causes. One possibility is that the decline in harbour seal abundance has resulted naturally from increased competition with grey seals.
The relationship between decline in seal populations and human activities is unclear. In those areas where marked and prolonged declines have been detected (Orkney, Shetland, East Scotland, Lonergan et al., 2007, 2013; SCOS, 2014; Hanson et al., 2015) major research initiatives are already in place to further characterise the demographic parameters driving the change and to investigate potential causes. Another consideration is the historical and present dynamic between grey seals and harbour seals, which have considerably overlapping coastal and at-sea distributions. In some areas, the present abundance of harbour seals may be higher, in part, because historical hunting pressure on grey seals drove some local populations to extinction, potentially reducing the competitive pressure on harbour seals. As grey seal populations recover, harbour seals may face increased competitive pressure from grey seals that could have a detrimental effect on their abundance. While direct effects of human activities on seal population growth (hunting) have been greatly reduced or removed in most areas, other human pressures such as pollution and underwater noise could influence future growth by determining the level of carrying capacity.
Knowledge Gaps
There are several knowledge gaps that need to be addressed to improve this assessment for its next iteration. Data collection could be improved for some North Sea assessment units (AU) and the geographic scale could be increased. The frequency of monitoring could be improved to increase the power of the assessment. Further studies could be undertaken into the reasons for historic declines to help develop the understanding of pressures and impacts on the grey and harbour seal populations. Interactions between grey and harbour seal populations could also be investigated to develop understanding of how these impact each other.
Improving Estimates of Grey Seal Abundance
The estimates of grey seal population size and trajectories from the Bayesian population model are preliminary. Combining data across different areas and monitoring programmes resulted in two key assumptions having to be made: (1) that the proportion of grey seals hauled-out during the August survey windows does not vary geographically and (2) that peak pup counts could be scaled to production using a single scalar based on United Kingdom data. In reality the value of this scalar will depend on factors such as whether the true peak count was observed and the shape of the pup production. Referring to assumption (1): the only published proportion estimate available is based on United Kingdom telemetry data. Other telemetry datasets (for example, from France, Ireland, Netherlands, and Denmark) could be examined to refine this assumption in the future.
It is possible that haul-out habitat (substrate) could influence haul-out behaviour and this would be important to incorporate into the model. In addition, the estimates produced by the model are sensitive to the prior distributions input to the model (SCOS-BP 14/02). ‘Priors’ are probability distributions used in Bayesian statistical models that describe parameters before some evidence is taken into account. The priors which have been found to be most appropriate for the United Kingdom grey seal population model (SCOS-BP 14/02) were used here with the exception of the movement parameters which are not in the current United Kingdom population model. Further model runs with different priors on these parameters will ensure that the population predictions are robust to changes in the priors on the movement parameters.
Reducing Uncertainty in Seal Abundance Estimates
Uncertainty in quantitative assessment can arise from a lack of data or due to the dynamic fluctuations of seal populations that occur naturally. Historically, national monitoring programmes were designed to detect and report changes in abundance and distribution at a national scale. Aggregating these data across OSPAR regions could provide an opportunity to place regional / national population trends at a more appropriate scale. Gaining this understanding would make it easier to assess what additional data may be required to improve confidence in the assessments.
Understanding the Implications of the Grey Seal Population Increase
The grey seal population appears to be still increasing. It is likely that the population is recovering from a time when populations were significantly depleted by human activities. Hunting, pollution and overfishing are all likely to have reduced populations in the 20th century. Although an increase in grey seal abundance can be seen as a positive sign, this does not indicate that there are no anthropogenic pressures (such as from fisheries bycatch, resource competition, noise, habitat loss, disturbance or pollutants) only perhaps that there is less pressure than there was previously. More research is needed if direct links between population and human activities are to be established. Even with no pressure from human activities, the grey seal population cannot keep increasing indefinitely as a growing population will eventually approach its natural carrying capacity. What this carrying capacity might be for grey seals, or what the consequences of population change will be for harbour seals is not yet known.
Improving the Power to detect Trends in Harbour Seal Abundance
Power to detect the growth rate specified in assessment value 1 (-1% per year) was retrospectively calculated using the formulae from Thomas (1997) where λ (the non-centrality parameter) is a function of the specified effect size (here, the assessment growth rate of -1% per year), the sum of squares and variance estimated from the fitted model. The total sample size was calculated as the product of the number of years of survey data and the typical number of replicate surveys performed in the Assessment Unit (AU). Using this method, the statistical power to detect a harbour seal population rate of decline of 1% per year was low (around 20%) in some AUs, especially where monitoring occurs on a less than annual basis. This assessment value may need to be revised for future assessments and / or monitoring programmes improved to enhance the power to detect trends. In the present assessment, the confidence intervals provide a robust assessment of uncertainty in the magnitude of observed trends.
Improving the Power to detect Changes in Distribution of Seals
Both distribution metrics are sensitive to the number of sub-divisions within the spatial units defined within each AU by the Contracting Party. In an AU with relatively few total sub-divisions, an absence of animals in one sub-division will equate to a large change in occupancy (Δoccupancy) between the reporting rounds. In addition, variation in survey effort between reporting period can confound assessment of this metric.
Brasseur, S., van Polanen Petel, T., Gerrodette, T., Meesters, E., Reijnders, P., Aarts, G. 2015. Rapid recovery of Dutch grey seal colonies fuelled by immigration. Marine Mammal Science. 31: 405-426.EU (2013) Habitat Directive reporting Article 17 reporting progress portal http://ec.europa.eu/environment/nature/knowledge/rep_habitats/index_en.htm Accessed 21 September 2016
Fortin, M., Keitt, T., Maurer, B., Taper, M., Kaufman, D., Blackburn, T. 2005. Species’ geographic ranges and distributional limits: pattern analysis and statistical issues. Oikos 108: 7-17.
Goodman, S. 1998. Patterns of extensive genetic differentiation and variation among European harbor seals (Phoca vitulina vitulina) revealed using microsatellite DNA polymorphisms. Molecular Biology and Evolution 15: 104-118.Hanson, N., Thompson, D., Duck, C., Baxter, J., Lonergan, M. (2015) Harbour seal (Phoca vitulina) abundance within the Firth of Tay and Eden Estuary, Scotland: recent trends and extrapolation to extinction. Aquatic Conservation: Marine and Freshwater Ecosystems. DOI: 10.1002/aqc.2609
Hanson, N., Thompson, D., Duck, C., Baxter, J., Lonergan, M. (2015) Harbour seal (Phoca vitulina) abundance within the Firth of Tay and Eden Estuary, Scotland: recent trends and extrapolation to extinction. Aquatic Conservation: Marine and Freshwater Ecosystems. DOI: 10.1002/aqc.2609
Härkönen, T., Harding, K., Heide-Jørgensen, M. 2002. Rates of increase in age-structured populations: a lesson from the European harbour seals. Canadian Journal of Zoology 80: 1498-1510.
Humphreys, E.M. Austin, G.E., Thaxter, C., Johnston, A., Risely, K., Frederiksen, M. & Burton, N.H.K. 2015. Development of MSFD Indicators, Baselines and Targets for Population Size and Distribution of Marine Birds in the UK. JNCC Report. JNCC, Peterborough 2015. ISSN 0963 8901
ICES 2014a. OSPAR request on implementation of MSFD for marine mammals. ICES Advice 2014 Book 1: 1.6.6.1. ICES May 2014.
ICES 2014b. Report of the working group on Marine Mammal Ecology (WGMME). 10-13 March, 2014 Woods Hole, Massachusetts, USA. ICES CM 2014/ACOM: 27, 230pp
Jones, E., McConnell, B., Sparling, C., Mattiopoulos, J. 2013. Grey and harbour seal usage maps. Marine Mammal Scientific Support Research Programme MMSS/001/11. Currently available from: http://www.scotland.gov.uk/Topics/marine/science/MSInteractive/Themes
Lonergan, M., Duck, C., Moss, S., Morris, C., Thompson, D. 2013. Rescaling of aerial survey data with information from small numbers of telemetry tags to estimate the size of a declining harbour seal population. Aquatic Conservation: Marine and Freshwater Ecosystems 23: 135-144.
Lonergan, M., Duck, C., Thompson, D., Mackey, B., Cunningham, L., Boyd, I. 2007. Using sparse survey data to investigate the declining abundance of British harbour seals: Harbour seal declines. Journal of Zoology 271: 261-269.
Lonergan, M., Duck. C., Thompson, D., Moss, S. McConnell, B. 2011. British grey seal (Halichoerus grypus) abundance in 2008: an assessment based on aerial counts and satellite telemetry. ICES Journal of Marine Science 68: 2201–2209.
NPWS (2013). The Status of Protected EU Habitats and Species in Ireland Overview Volume 1. Unpublished Report National Parks & Wildlife Services. Department of Arts, Heritage and the Gaeltacht Dublin Ireland.)
McConnell, B. J., Fedak, M. A., Lovell, P. and Hammond, P. S. 1999. Movements and foraging areas of grey seals in the North Sea. Journal of Applied Ecology 36:573–590.
Meesters, E., Reijnders, P, Brasseur, S., Ursula, S., Stede, M., Tougaard, S., Härkönen, T. 22 March 2007. An effective survey design for harbour seals in the Wadden Sea: tuning Trilateral Seal Agreement and EU-Habitat Directive requirements. TWG 07/1/5.1 SMP-Monitoring Scheme. 26pp.
Olsen, M., Andersen, L., Dietz, R., Teilman, J., Härkönen, T., Siegismund, H. 2014. Integrating genetic data and population viability analyses for the identification of harbour seal (Phoca vitulina) populations and management units. Molecular Ecology 23: 815-831.
OSPAR, 2012. MSFD Advice Manual and Background Document on Biodiversity. Version 3.2. OSPAR Biodiversity Series. Available at: http://www.ospar.org/documents/dbase/publications/p00581/p00581_advice%20document%20d1_d2_d4_d6_biodiversity.pdf
Pomeroy, P. P., Twiss, S. D. and Redman, P. 2000. Philopatry, site fidelity and local kin associations within grey seal breeding colonies. Ethology: 899–919.
Russell, D., McConnell, B., Thompson, D., Duck, C., Morris, C., Harwood, J., Matthiopoulos, J. 2013. Uncovering the links between foraging and breeding regions in a highly mobile mammal. Journal of Applied Ecology 2:499-509.
SCOS 2014. Scientific advice on matters related to the management of seal populations, 2014. Scientific Committee on Seals (SCOS). http://www.smru.st-and.ac.uk/documents/2259.pdf
Teilmann, J., Rigét, F., Härkönen, T. 2010. Optimizing survey design for Scandinavian harbour seals: population trend as an ecological quality element. ICES Journal of Marine Science 67: 952-958
Thomas, L. 1997. Retrospective power analysis. Conservation Biology 11: 276-280.Thomas, L. 1997. Retrospective power analysis. Conservation Biology 11: 276-280
| Sheet reference | BDC17/D101 |
|---|---|
| Assessment type | Intermediate Assessment |
| Context (1) | Biological Diversity and Ecosystems - Targeted actions for the protection and conservation of species, habitats and ecosystem processes |
| Context (2) | OSPAR Publication 2009/406, EcoQOs on harbour and grey seal population trends |
| Context (3) | D1 - Biological Diversity |
| Context (4) | D1.1 - Species Distribution, D1.2 - Population Size |
| Point of contact | Ian Mitchell |
secretariat@ospar.org | |
| Metadata date | 2016-08-31 |
| Title | Seal Abundance and Distribution |
| Resource abstract | Common indicator assessment of M3-Seal abundance and distribution. Applicable to the Greater North Sea and Celtic Seas (OSPAR Regions II and III). |
| Linkage | http://qsr2010.ospar.org/media/assessments/p00406_supplements/p00406_suppl_1_healthy_seal_population.pdf |
| Linkage | https://www.ospar.org/documents?v=7127 |
| Topic category | Environment |
| Indirect spatial reference | L1.2;L1.3 |
| N Lat | 62.0000000002998 |
| E Lon | 13.0665752428532 |
| S Lat | 48.0000507707265 |
| W Lon | -12.0250000001498 |
| Countries | DE, DK, FR, NL, NO, UK |
| Start date | 1992-01-01 |
| End date | 2014-12-31 |
| Date of publication | 2017-06-30 |
| Conditions applying to access and use | http://www.ospar.org/site/assets/files/1215/ospar_data_conditions_of_use.pdf |
| Data Snapshot | https://odims.ospar.org/uploaded/data_uploads/ospar_seal_abundance_2017_01_001-other-IA2017_Seal_Abundance_Snapshot.zip |
| Data Results | https://odims.ospar.org/uploaded/data_uploads/ospar_seal_abundance_2017_02_001-other-IA2017_Seal_Abundance_DataResults.zip |
| Data Source | http://www.ices.dk/marine-data/data-portals/Pages/Biodiversity.aspx |