

Status and Trend for Heavy Metals (Mercury, Cadmium, and Lead) in Fish and Shellfish
D8 - Concentrations of Contaminants
D8.1 - Concentration of contaminants
In most areas assessed (since 2009) concentrations of mercury, cadmium and lead in mussels and fish are above background levels. Nevertheless, all concentrations are below European Commission limits for foodstuffs. Concentrations are decreasing or show no significant change in all areas assessed; except for cadmium in a few North Sea and Irish Sea locations.
Area assessed
Printable Summary
Background
OSPAR’s strategic objective is to prevent pollution of the OSPAR Maritime Area by continuously reducing discharges, emissions and losses of hazardous substances. Metals are ubiquitous hazardous substances in the environment, and are found in mussels and fish in all OSPAR regions. The most toxic metals to humans and animals are mercury, cadmium and lead, known as heavy metals, all of which naturally occur in the environment.
Mercury, cadmium and lead enter the marine environment from a number of natural, agricultural and industrial processes ( heavy metal inputs indicator assessment ), via long-range transportation by air, riverine input or run-off from land. In some cases direct input occurs. For example, some metals used as antifouling chemicals (mainly copper) and corrosion anodes (mainly zinc) are deliberately placed in the marine environment, through their use on ships’ hulls or marine installations, causing hot spots of metal concentrations in and around harbours.
Mercury is highly toxic. Mercury and cadmium accumulate in the food chain. Lead is not accumulated via the food chain.
Heavy metals do not disappear over time and can be trapped in deeper levels of sediment until mining, geological or biological processes release them, at which point they may affect biota. There are natural concentrations of heavy metals in all waters, sediments, mussels and fish, referred to as background concentrations. OSPAR uses the maximum concentration limits for heavy metals in fish and mussels set by the European Commission as proxy values for Environmental Assessment Criteria (EAC).
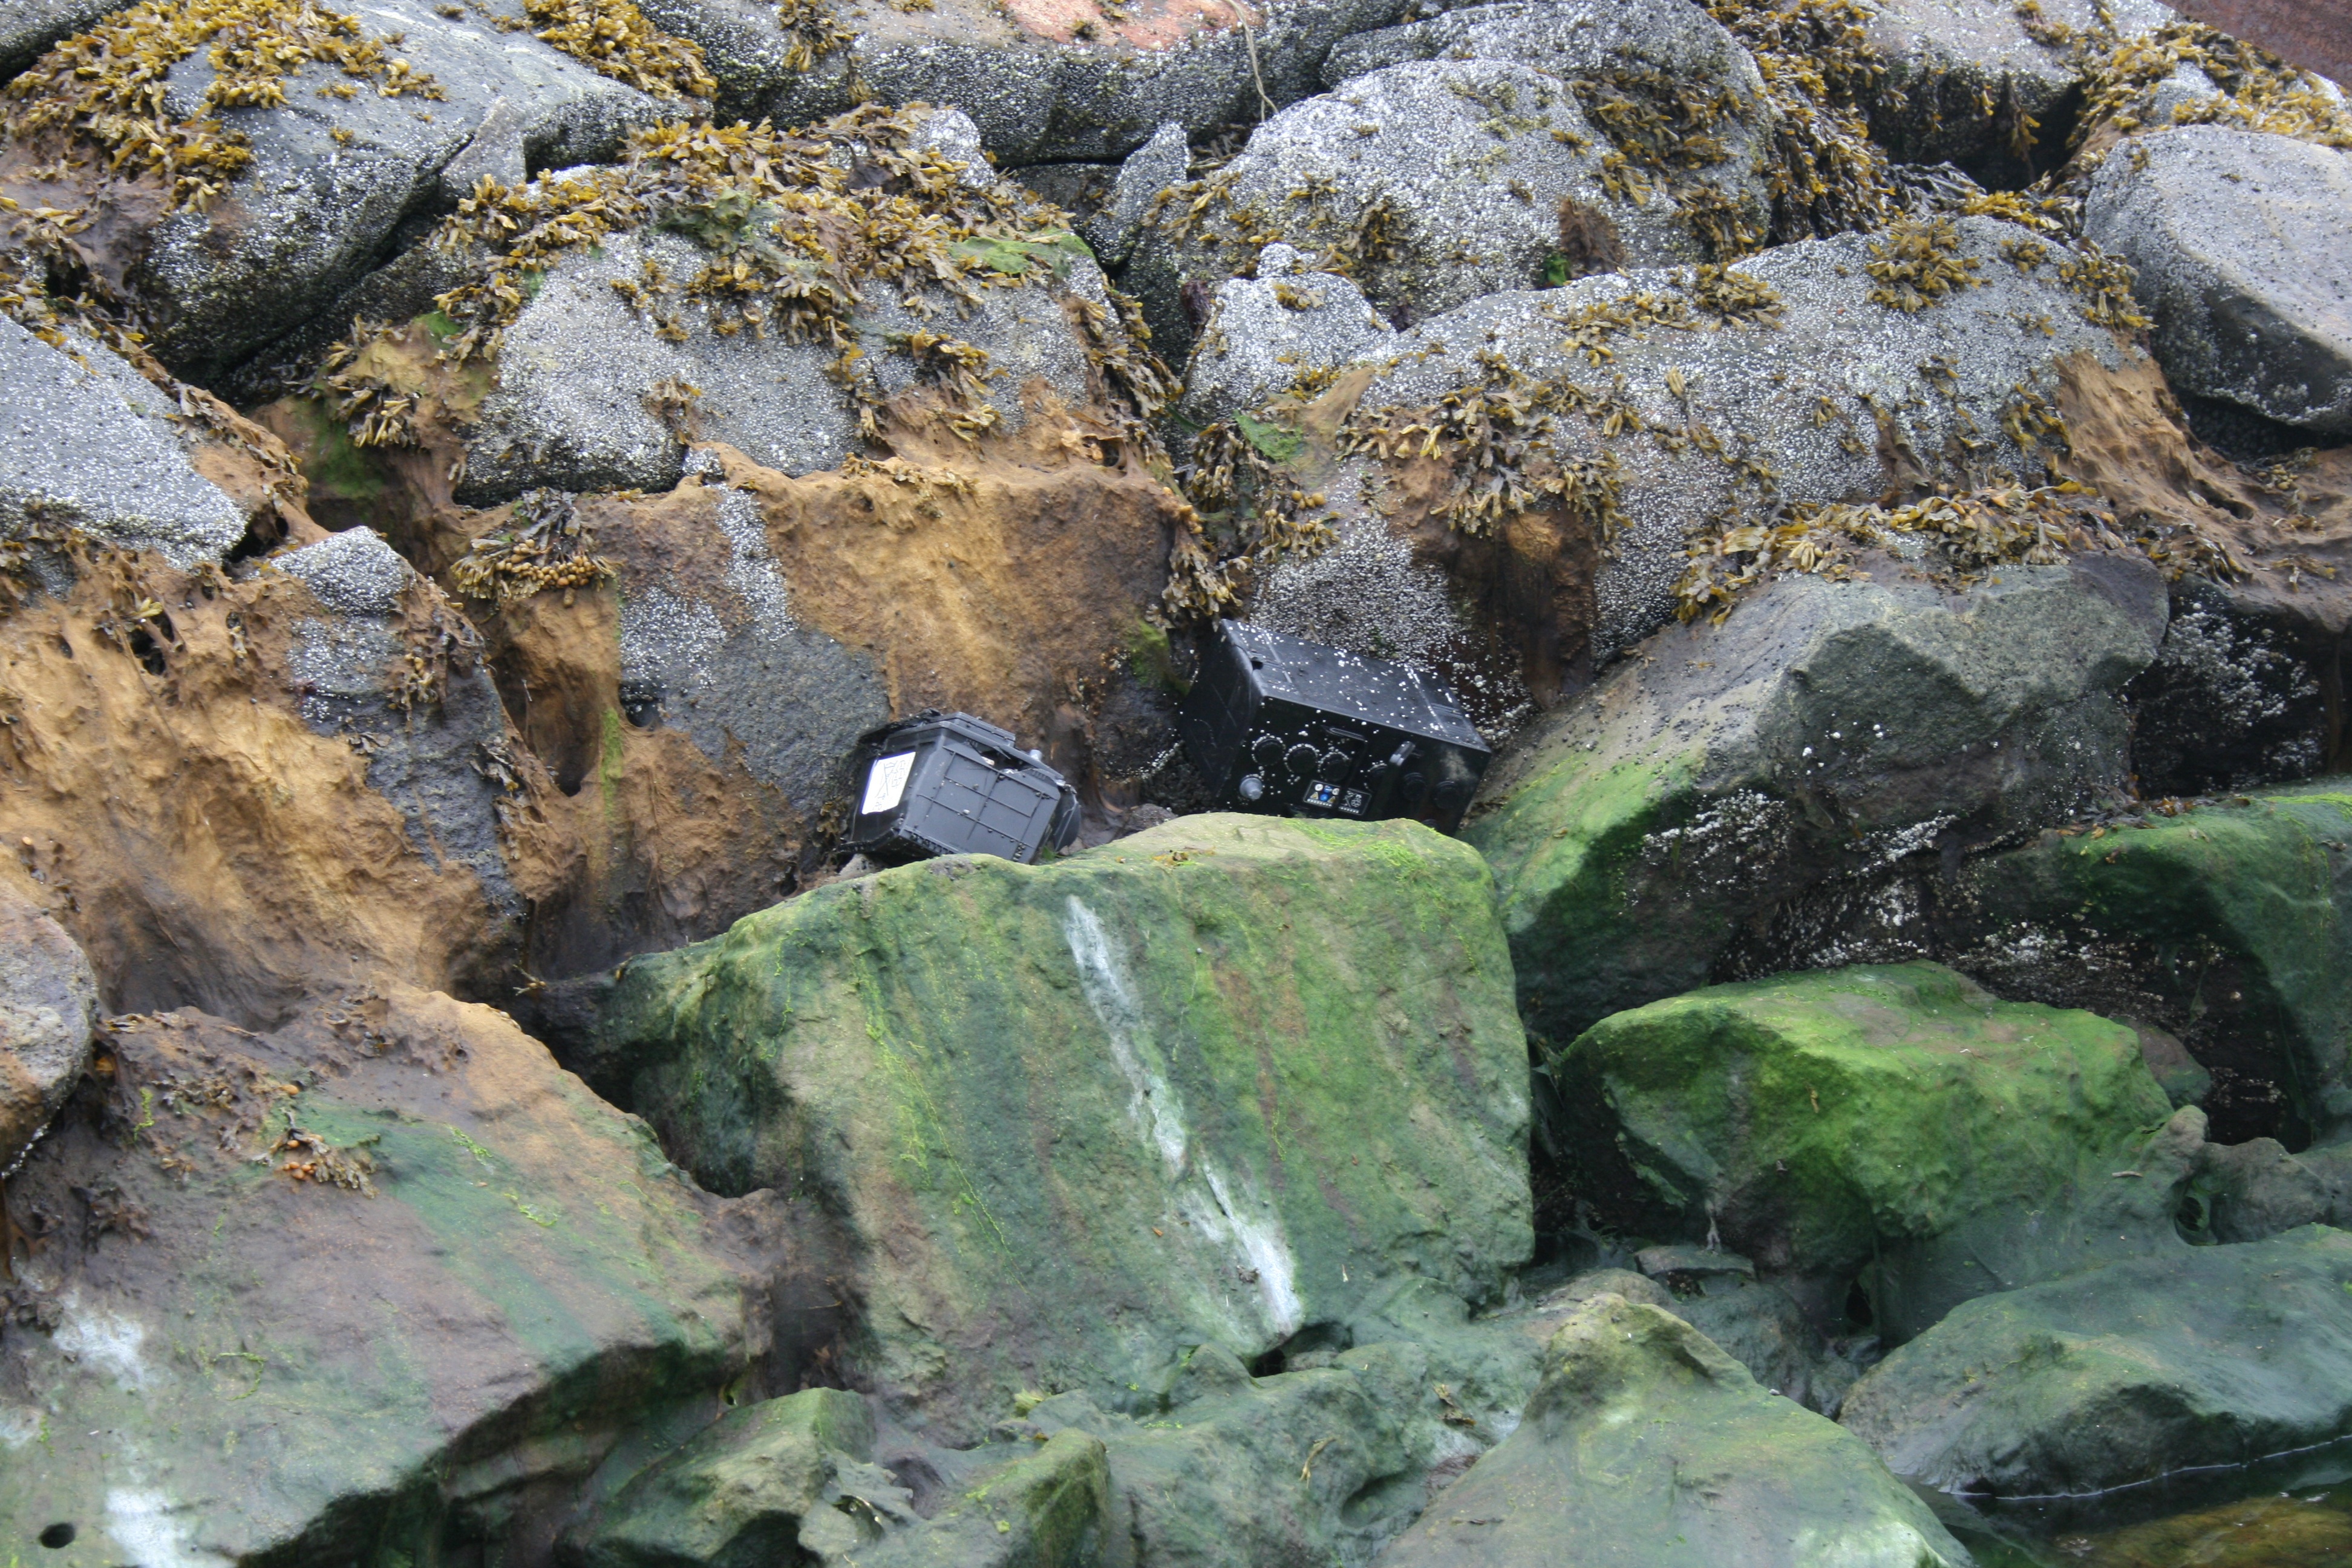
Lead-acid batteries dumped in a harbour, just below the high tide level are a source of lead input to the marine environment © Martin M. Larsen
Mercury is highly toxic. Mercury and cadmium accumulate in the food chain. Lead is not accumulated via the food chain.
Heavy metals do not disappear over time and can be trapped in deeper levels of sediment until mining, geological or biological processes release them, at which point they may affect biota. There are natural concentrations of heavy metals in all waters, sediments, mussels and fish, referred to as background concentrations. OSPAR uses the maximum concentration limits for heavy metals in fish and mussels set by the European Commission as proxy values for Environmental Assessment Criteria (EAC).
The most toxic metals to fish and animals are mercury, cadmium and lead. Although other metals are also included in the OSPAR Coordinated Environmental Monitoring Programme, these are the three priority heavy metals.
Mercury has the potential to evaporate and be transported as a gas through the air; other heavy metals are mainly transported as fine particles or bound to other particles. Heavy metals can be trapped in deeper levels of sediment until mining, geological or biological processes release them, at which point they may affect biota.
Mercury and cadmium accumulate in the food chain and are considered the most toxic of the three heavy metals. The effects of high concentrations of heavy metals on humans can include: decreased learning ability (lead and mercury); reduced strength of bones (cadmium); and damage to the central nervous system (mercury). This has led to restrictions on most uses of cadmium and lead, and strict bans on mercury use.
In the Roman empire lead was used for water pipes, as sweetener in wine (lead-acetate) and as colouring for skin-cream. In modern times it is still being used in car batteries and until 2000 in leaded fuel as an engine lubricant, the major source of lead pollution in air and water during the 1970s until its ban (Larsen et. al, 2012). It has also been used as a softener in PVC piping.
Mercury has been used in medicine as an antibacterial agent and as a liquid anode in electrolysis in the paper industry. It has also been used in dental fillings, in thermometers and other scientific instruments. The Minamata Convention adopted in 2013 but still to enter into force, is a global treaty to protect human health and the environment from the adverse effects of mercury (http://www.zeromercury.org).
Cadmium is used in batteries and electronics and previously in some red paints and plastics. It is found in minerals mined for zinc, copper and lead, and is a minor constituent of all products of these heavy metals. As it is taken up from soil by plants, it is also concentrated in plants, especially tobacco leaves, sunflower and linseed.
Both mercury and cadmium are suspected carcinogens.
In assessing heavy metals both ‘relative’ and ‘absolute’ aspects have been
- ‘Trend assessment’ or spatial distribution assessment to focus on relative differences and changes on spatial and temporal scales – provides information about the rates of change and whether contamination is widespread or confined to specific locations; and
- ‘Status’ assessment of the significance of the (risk of) pollution, defined as the status where heavy metals are at a hazardous level, usually requires assessment criteria that take account of the possible severity of the impacts and hence requires criteria that take account of the natural conditions (background concentrations) and the ecotoxicology of the heavy metals. For example, the European Commission (EC) maximum concentration limits for heavy metals in seafood (fish and mussels) are used by OSPAR as proxy Environmental Assessment Criteria (EACs).
OSPAR has clarified that in assessing the Co-ordinated Environmental Monitoring Programme (CEMP) data the primary assessment value used in the assessment of heavy metal concentrations in sediment and biota, “corresponds to the achievement, or failure to achieve, statutory targets or policy objectives for contaminants in these matrices” (OSPAR, 2009). This set of assessment criteria was specifically compiled for the assessment of CEMP monitoring data on hazardous substances contributing to the QSR 2010. The use of this set was considered an interim solution for the purposes of the QSR 2010 until more appropriate approaches to defining assessment criteria could be agreed on and implemented. These criteria have also been used in the annually recurring CEMP assessments since 2010 and will be used until OSPAR agrees on the adoption of improved assessment criteria and subject to the conditions set out in the agreement.
Trends in heavy metal concentrations in biota are presented. Two assessment criteria are used to assess the status of heavy metal concentrations in biota: Background Assessment Concentrations (BACs) and European Commission maximum levels for fish and seafood (EC, 2006).
OSPAR IA 2017 Indicator Assessment values are not to be considered as equivalent to proposed European Union Marine Strategy Framework Directive (MSFD) criteria threshold values, however they can be used for the purposes of their MSFD obligations by those Contracting Parties that wish to do so.
Provenance and limitations of BACs
Background Assessment Concentrations (BACs) were developed by OSPAR for testing whether measured concentrations are near background for naturally occurring substances and close to zero for man-made substances, the ultimate aim of the OSPAR Hazardous Substances Strategy. Mean concentrations significantly below the BAC are said to be near background (naturally occurring concentrations). BACs are statistical tools defined in relation to the background concentrations or low concentrations, which enable statistical testing of whether observed concentrations could be considered to be near background concentrations.
Background concentrations (BCs) represent the concentrations of hazardous substances that would be expected in the North-East Atlantic if certain industrial developments had not happened. They represent the concentrations of those substances at ‘remote’ sites, or in ‘pristine’ conditions based on contemporary or historical data respectively, in the absence of significant mineralisation and/or oceanographic influences. In this way, they relate to the background values referred to in the OSPAR Hazardous Substances Strategy. BCs for synthetic, man-made substances should be regarded as zero. It is recognised that natural processes such as geological variability or upwelling of oceanic waters near the coast may lead to significant variations in background concentrations of contaminants, for example trace heavy metals. The natural variability of background concentrations should be taken into account in the interpretation of CEMP data, and local conditions should be taken into account when assessing the significance of any exceedance.
Low concentrations (LCs) are values used to assist the derivation of BACs where there have been difficulties in assembling a dataset on concentrations in remote or pristine areas from which to derive BCs. LCs have been prepared on the basis of datasets from areas that could generally be considered remote but which could not be guaranteed to be free from the influence of long-range atmospheric transport of contaminants.
BACs are calculated according to the method set out in Section 4 of the CEMP Assessment Manual (OSPAR, 2008). The outcome is that, on the basis of what is known about variability in observations, there is a 90% probability that the observed mean concentration will be below the BAC when the true mean concentration is at the BC. Where this is the case, the true concentrations can be regarded as ‘near background’ (for naturally occurring substances) or ‘close to zero’ (for man-made substances).
BACs are calculated on the basis of variability within the CEMP dataset currently available through databases held by the International Council for the Exploration of the Sea (ICES) Data Centre and will be refined at the working level by the relevant assessment group as further CEMP monitoring data are collected.
Provenance and limitations of EC maximum levels in fish and seafood
OSPAR has not yet established EACs for heavy metals in biota. Therefore the European Commission maximum levels in fish and seafood (EC, 2006) have been used as a proxy means for assessing the ecological significance of biota concentrations of heavy metals. EC maximum levels are applied in European Union Member States’ control of foodstuffs with the aim to protect public health by excluding the most contaminated food from the market. The limits are set on the basis of the diet of the ‘average’ European consumer, and should according to Regulation 1881/2006 be set at “a strict level which is reasonably achievable by following good agricultural, fishery and manufacturing practices and taking into account the risk related to the consumption of the food”. So if there are improvements in the practices (i.e. a decrease in the levels of environmental contaminants) the EC maximum levels may be reviewed. If the EC maximum food levels for fish and mussels are exceeded, the catch should not be put on the market.
The maximum EC levels for lead, mercury and cadmium in fish muscle and bivalve molluscs are used as alternatives to EACs for heavy metals in both fish and shellfish species. These values are firmly established by EC regulation, but have the disadvantage that the standards for cadmium and lead have not been directly designed for all the matrix/contaminant combinations required for the assessment. In general, it is recognised that the use of dietary standards is not fully satisfactory for assessing environmental risk, and that these values and their use to draw conclusions concerning the heavy metals in biota common indicator assessment should be treated with care. They are used as an interim solution to address the need for criteria until a more appropriate approach can be defined and agreed.
Assessment method
Concentrations of heavy metals in biota are monitored on a yearly basis in the CEMP monitoring programme at 304 monitoring sites (Figure 1).
For each heavy metal at each monitoring site, the time series of concentration measurements was assessed for trends and status using the methods described in the contaminants online assessment tool (http://dome.ices.dk/osparmime2016/main.html). The results from these individual time series were then synthesised at the assessment area scale in a series of meta-analyses.
Trend assessments included those monitoring sites that were representative of general conditions, and excluded those monitoring sites impacted due to a point source and baseline monitoring sites where trends would not be expected. The analysis was also restricted to assessment areas where there were at least three monitoring sites with trend information and where those monitoring sites had reasonable geographic spread.
The trend in each metal at each monitoring site was summarised by the estimated annual change in log concentration, with its associated standard error. The annual change in log concentration was then modelled by a linear mixed model with fixed effects:
~ heavy metal: OSPAR contaminants assessment areas
and random effects:
~ monitoring site + metal: monitoring site + within-series variation
The choice of fixed and random effects was motivated by the assumption that the heavy metals could have very different trends as they have different sources and are metabolised differently. Thus, the fixed effects measure the trend in each heavy metal in each OSPAR contaminants assessment area and the random effects measure variation in trends:
- between monitoring sites common across heavy metals (monitoring site); and
- residual variation (metal: monitoring site + within-series variation)
There are two residual terms. Within-series variation is the variation associated with the estimate of the trend from the individual time series and is assumed known (and given by the square of the standard error). Heavy metal: monitoring site allows for any additional residual variation.
Evidence of trends in heavy metal concentrations at the assessment area scale was then assessed by plotting the estimated fixed effects with point-wise 95% confidence intervals.
Similar analyses explored status at the assessment area scale. Two summary measures were considered: the log ratio of the fitted concentration in the last monitoring year to the EC maximum levels; and the log ratio of the fitted concentration in the last monitoring year to the BAC. Baseline monitoring sites were also included in these analyses.
For heavy metals, BACs have been developed for mussels and fish. The upper limit for good status is set as the EC maximum levels in fish and seafood for the heavy metals, which might not be precautionary for the most sensitive species. An EC Environmental Quality Standard of 20 µg/kg ww for mercury has been developed for whole fish, but is not used as it requires re-calculation of the results to a top predator level in the food chain, resulting in all measurements failing to comply (OSPAR, 2016). It is also below what is considered a natural background concentration of mercury.
BACs and EC levels are available for three heavy metals only, cadmium, mercury and lead (Table a)
| None | BAC | EC levels | ||
|---|---|---|---|---|
| mussels | oysters | fish | all species | |
| μg/kg dw | μg/kg dw | μg/kg ww | μg/kg ww | |
| Mercury | 90 | 180 | 35 | 500 |
| Cadmium | 960 | 3000 | 26 | 1000 |
| Lead | 1300 | 1300 | 26 | 1500 |
Table a notes:
- BACs for mussels and oysters are expressed as μg/kg dw (dry weight) and BACs for fish and EC levels are expressed as μg/kg ww (wet weight);
- Cadmium and lead are monitored in fish liver, for which no food standard exists; concentrations in fish liver are naturally higher than in fish muscle, so the food standards for fish muscle are not used; instead the food standards for shellfish are used as a proxy; and
- BACs and EC levels are converted to other bases (wet, dry or lipid weight) using species-specific conversion factors.
| OSPAR region | OSPAR assessment area | Status | Trends | ||||
|---|---|---|---|---|---|---|---|
| Mercury | Cadmium | Lead | Mercury | Cadmium | Lead | ||
| Arctic Waters | Barents Sea | 9 | 9 | 9 | 1 | 1 | 1 |
| Norwegian Sea | 2 | 3 | 3 | 1 | 2 | 1 | |
| Greater North Sea | Norwegian Trench | 25 | 20 | 22 | 12 | 11 | 9 |
| Northern North Sea | 46 | 46 | 46 | 42 | 40 | 40 | |
| Skagerrak and Kattegat | 34 | 30 | 31 | 17 | 16 | 16 | |
| Southern North Sea | 43 | 42 | 41 | 35 | 34 | 32 | |
| English Channel | 33 | 33 | 33 | 31 | 31 | 30 | |
| Celtic Seas | Irish and Scottish West Coast | 36 | 37 | 37 | 23 | 27 | 26 |
| Irish Sea | 49 | 52 | 52 | 42 | 46 | 45 | |
| Celtic Sea | 11 | 12 | 12 | 4 | 5 | 5 | |
| Bay of Biscay and Iberian Coast | Northern Bay of Biscay | 29 | 29 | 29 | 29 | 28 | 29 |
| Iberian Sea | 44 | 45 | 44 | 23 | 23 | 23 | |
| Gulf of Cadiz | 4 | 4 | 4 | 1 | 1 | 1 | |
Differences in methodology used for the IA 2017 compared with the QSR 2010
For the IA 2017, a meta-analysis is used to synthesise the individual time series results and provide an assessment of status and trend at the assessment area level. Meta-analyses take into account both the estimate of status or trend in each time series and the uncertainty in that estimate. They provide a more objective regional assessment than was possible in the QSR 2010, where a simple tabulation of the trend and status at each monitoring site was presented.
Results
Different species of fish and shellfish are monitored for metal concentrations in the OSPAR Maritime Area. At coastal sites monitoring is mainly in blue mussels. Oysters are monitored in the Bay of Biscay and the Irish coast. At the remaining monitoring sites, mostly in open water, flatfish are monitored (Figure 1).
There are 22 monitoring sites in Arctic Waters not reported because they are not geographically representative of the region as a whole. This includes six to eight temporal trend monitoring sites in the Barents Sea, depending on the heavy metal monitored, and no heavy metals showed upward trends in concentration.

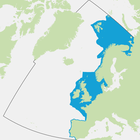
Figure 1: Monitoring sites used to assess heavy metal concentrations in fish and shellfish by OSPAR contaminants assessment areas (white lines) determined by hydrogeographic principles and expert knowledge not OSPAR internal boundaries
EC maximum levels for heavy metal concentrations in fish and shellfish are five times greater, or more, than background concentrations. In all OSPAR regions assessed since 2009 the average heavy metal concentrations are below EC maximum levels.
Mercury concentrations in biota are at or above background in all contaminants assessment areas (Figure 2). The highest concentrations are found in the Norwegian Trench, Northern North Sea, Southern North Sea and Irish Sea, at around twice the background concentration.
Cadmium concentrations in biota are above background in nine of the 12 assessment areas; the exceptions are the English Channel, Northern Bay of Biscay and Iberian Sea. Concentrations in biota from the Barents Sea and Southern North Sea are at 2–5 times higher than the background level (Figure 2).
With the exception of the Irish and Scottish West Coast (Figure 2), lead concentrations in biota are above background. Mean concentrations in the Barents Sea, Skagerrak and Kattegat, and Northern Bay of Biscay are below the background level, but the upper confidence limits are above background. Lead concentrations in the Northern North Sea, Irish Sea, and Gulf of Cadiz all are at 2–5 times the background concentration.
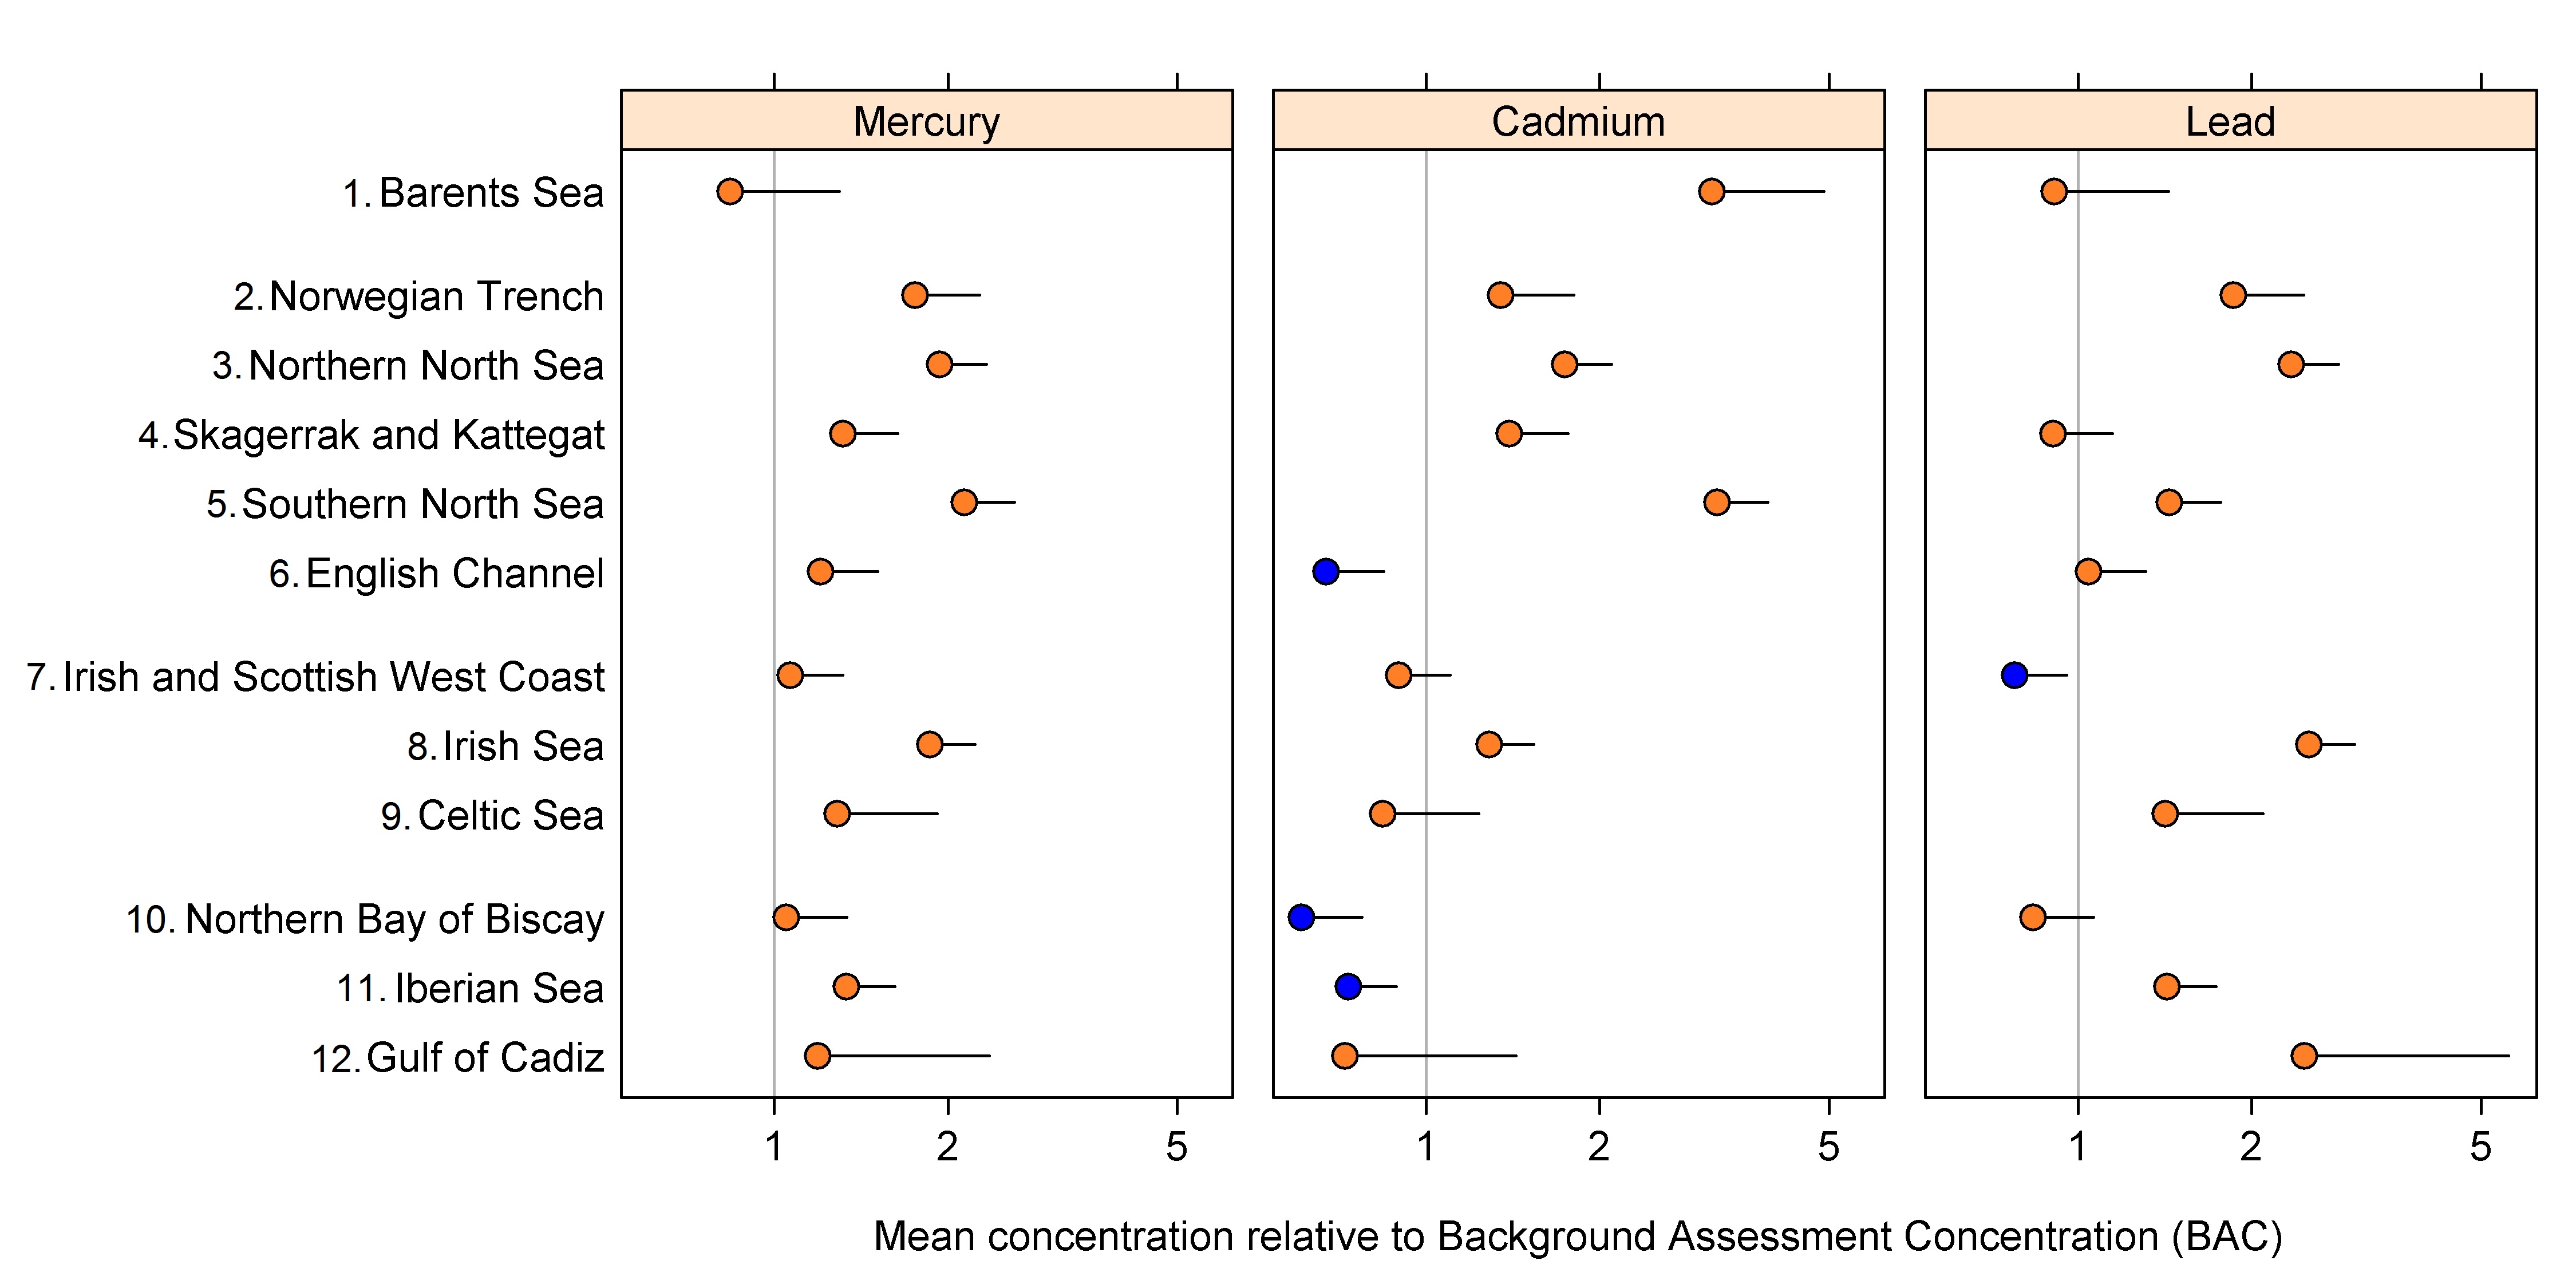
Figure 2: Mean concentrations of each heavy metal in fish and shellfish in each OSPAR contaminants assessment area relative to Background Assessment Concentrations (BAC) (with 95% upper confidence limits)
Value of 1 means that the mean concentration equals the BAC. Blue: mean concentration statistically significantly (p <0.05) below the Background Assessment Concentration (BAC) and the European Commission maximum levels for food, orange: mean concentration at (if confidence limit crosses 1), or above the BAC, but significantly below the EC maximum levels for food. The EC maximum levels are generally more than five times higher than the BAC and hence not shown
There is high confidence in the assessment and sampling methodology and high confidence in the data used.
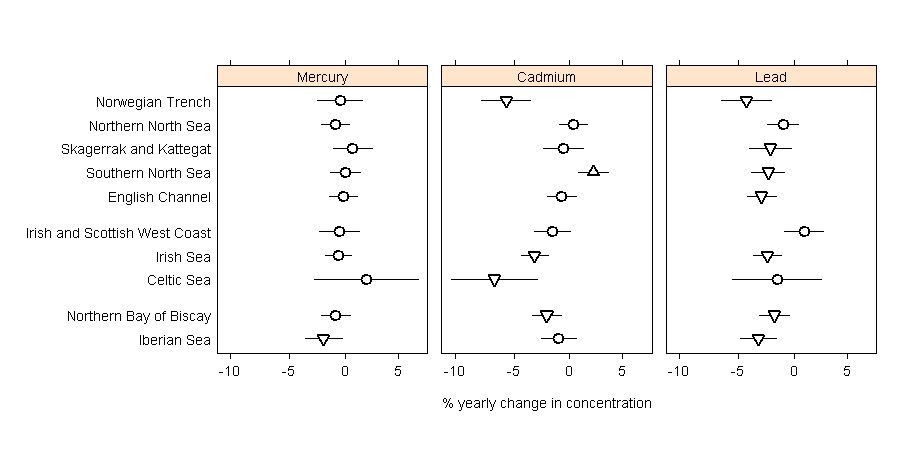
Figure a: Percentage yearly change in heavy metal concentrations in fish and shellfish in each OSPAR contaminant assessment area
No statistically significant (p <0.05) change in mean concentration (circle), mean concentration is significantly decreasing (downward triangle), mean concentration is significantly increasing (upward triangle) trends, 95% confidence limits (lines)
Mercury concentrations in biota show no statistically significant change in all assessment areas except for the Iberian Sea where there is a downward trend (Figure a). In contrast, lead concentrations are declining in seven of the ten assessment areas and show no significant change at three.
The only assessment area where concentrations are increasing is the Southern North Sea, for cadmium (Figure a). Here, half of the monitoring sites show upward trends for cadmium, resulting in a yearly increase in concentration of approximately 2%.
Individual Time Series Results per Monitoring Site
A summary of individual time series results at monitoring sites across the OSPAR Maritime Area for heavy metal concentrations in biota is presented here http://dome.ices.dk/osparmime2016/regional_assessment_biota_metals.html. In total, mean concentrations of heavy metals in biota are above EC limits for foodstuffs in 36 out of 1130 time series. In 88 out of 904 time series where trend assessments have been undertaken, mean concentrations have increased over the assessment period (1996–2015). It should be noted that not all individual time series results are included in the regional assessments (see number of time series used in each OSPAR region and assessment area in Table b), due to the criteria set out in the Assessment Methods.
Confidence Assessment
There is high confidence in the quality of the data used for this assessment. The data have been collected over many years using established sampling methodologies. There is sufficient temporal and spatial coverage and no significant data gaps in the areas assessed over the relevant time periods. Although synthesis of monitoring site data for assessment area scale uses new methods they are based on established and internationally recognised protocols for monitoring and assessment per monitoring site, therefore there is also high confidence in the methods.
Conclusion
The ultimate aim of the OSPAR Hazardous Substances Strategy is for concentrations of heavy metals in biota to be at natural background levels. However, heavy metal concentrations in biota in most assessment areas are above natural background concentrations.
Average heavy metal concentrations in shellfish and fish are below European Commission maximum limits for foodstuffs in all OSPAR regions. Mercury concentrations show no significant change or show a downward trend in most assessment areas. The only assessment area showing an increasing trend in metal concentrations in biota is the Southern North Sea for cadmium.
Although mercury, cadmium and lead concentrations in shellfish and fish are below EC maximum levels in foodstuffs in all areas assessed, there is a potential to further reduce heavy metal levels in biota in order to reach natural background levels.
Knowledge Gaps
The assessment criteria are based on background concentrations and European Commission maximum levels in foodstuffs, rather than on environmental limits.
The European Commission has derived environmental quality criteria for fish only for mercury, which are lower than background concentrations, and should be re-examined. Environmental Assessment Criteria for all heavy metals in mussels and fish should be developed.
The reasons for the increasing concentrations of cadmium in the Southern North Sea need to be investigated to identify the sources.
EC (2006). European Union: Commission Regulation (EC) No. 1881/2006 of 19 December 2006 setting maximum levels for certain contaminants in foodstuffs
Larsen M.M., Blusztajn J.S., Andersen O., Dahllöf I. (2012). Lead isotopes in marine surface sediments reveal historical use of leaded fuel. Journal of Environmental Monitoring, 2012:14, 2893-2901. DOI: 10.1039/c2em30579h
OSPAR (2008). OSPAR Publication 2008-379 CEMP Assessment Manual: Co-ordinated Environmental Monitoring Programme Assessment Manual for contaminants in sediment and biota
OSPAR (2009). OSPAR Publication 2009-461 Background Document on CEMP Assessment Criteria for the QSR 2010
OSPAR (2016). OSPAR Publication 2016-679 Assessment criteria comparison (EAC/EQS) for mercury
| Sheet reference | HASEC16/D809 |
|---|---|
| Assessment type | Intermediate Assessment |
| Context (1) | Hazardous Substances |
| Context (2) | OSPAR Agreement 1997-08 JAMP Guidelines for the sampling and analysis of mercury in air and precipitation |
| Context (3) | D8 - Concentrations of Contaminants |
| Context (4) | D8.1 - Concentration of contaminants |
| Point of contact | Martin Mørk Larsen |
secretariat@ospar.org | |
| Title | Status and Trend for Heavy Metals (Mercury, Cadmium, and Lead) in Fish and Shellfish |
| Resource abstract | Common indicator assessment of trends and concentrations of heavy metals (mercury, cadmium and lead) in fish and shellfish. Applicable to Arctic Waters, Greater North Sea, Celtic Seas, Bay of Biscay and Iberian Coast. |
| Linkage | https://www.ospar.org/convention/agreements?q=1997-08&t=32281&a=&s= |
| Topic category | Environment |
| Indirect spatial reference | L3.1.2.2;L3.1.2.3;L3.1.2.4;L3.1.4.1;L3.1.4.2;L3.1.4.3;L3.1.4.4;L3.1.4.5;L3.1.4.6;L3.1.4.7;L3.2.1.1;L3.2.1.2;L3.2.1.3;L3.2.1.4;L3.2.1.5;L3.2.1.6;L3.2.1.7;L3.2.1.8;L3.2.1.9; |
| N Lat | 81.172826679208 |
| E Lon | 51.0000830647817 |
| S Lat | 36.0002573554926 |
| W Lon | -12.0250000001498 |
| Countries | BE, DE, DK, ES, FR, IE, NL, NO, PT, SE, UK |
| Start date | 2009-01-01 |
| End date | 2015-01-01 |
| Date of publication | 2017-06-30 |
| Conditions applying to access and use | https://www.ospar.org/site/assets/files/1215/ospar_data_conditions_of_use.pdf |
| Data Snapshot | https://odims.ospar.org/documents/316/download |
| Data Results | http://dome.ices.dk/osparmime2016/regional_assessment_biota_metals.html |
| Data Results | https://odims.ospar.org/documents/294/download |
| Data Source | http://ices.dk/marine-data/data-portals/Pages/DOME.aspx |
| Data Source | http://dome.ices.dk/osparmime2016/main.html |
| Data Source | http://dome.ices.dk/views/ContaminantsBiota.aspx |
| Data Source | https://odims.ospar.org/layers/geonode:ospar_ia2017_metals_biota_2017_01_001 |