

Status and Trends of Polychlorinated Biphenyls (PCB) in Sediment
D8 - Concentrations of Contaminants
D8.1 - Concentration of contaminants
Polychlorinated biphenyls (PCBs) were banned in many countries in the mid-1980s. Since then, while local problems remain, mean PCB concentrations in sediment have decreased in three of five OSPAR contaminants assessment areas. With the exception of the most toxic congener CB118, concentrations in sediment are below the level at which they could present an unacceptable risk to the environment.
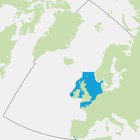
Area assessed
Printable Summary
Background
The OSPAR Hazardous Substances Strategy has the ultimate aim of achieving concentrations in the marine environment near background values for naturally occurring substances and close to zero for synthetic substances.
Polychlorinated biphenyls (PCBs) are man-made chemical compounds that were banned in the mid-1980s owing to concerns about their toxicity, persistence and potential to bioaccumulate in the environment. Since the 1980s, global action has resulted in big reductions in releases, and remaining stocks have been phased out. However, despite European and global action, releases continue through diffuse emissions to air and water from building sites and industrial materials. Remaining sources include electrical and hydraulic equipment containing PCBs, waste disposal, redistribution of historically contaminated marine sediments and by-products of thermal and chemical industrial processes.
PCBs do not break down easily in the environment and are not readily metabolised by humans or animals. They are extremely toxic to animals and humans. A sub-group of PCBs is ‘dioxin-like’, meaning they are more toxic than other PCB congeners.
Seven PCB congeners were selected as indicators of wider PCB contamination due to their relatively high concentrations and toxic effects.
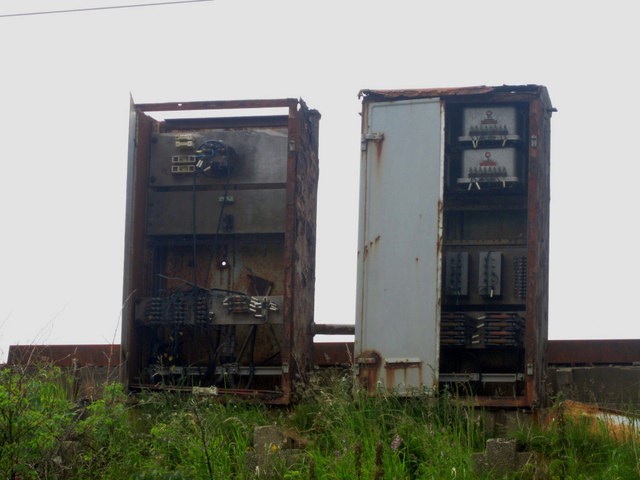
Derelict line side electrical equipment cabinets with high concentrations of polychlorinated biphenyls (PCBs)
Polychlorinated biphenyls (PCBs) (Figure a) are industrial compounds with multiple industrial and commercial uses. It has been estimated that globally 1.3 million tonnes of PCB compounds have been produced (Breivik et al., 2007). PCBs have been used as coolants and lubricants in transformers, capacitors, and other electrical equipment. PCBs have also been used in adhesives, paints, inks and as plasticisers and sealing agents in products such as rubber and especially in polyvinyl chloride plastics used to coat electrical wiring.
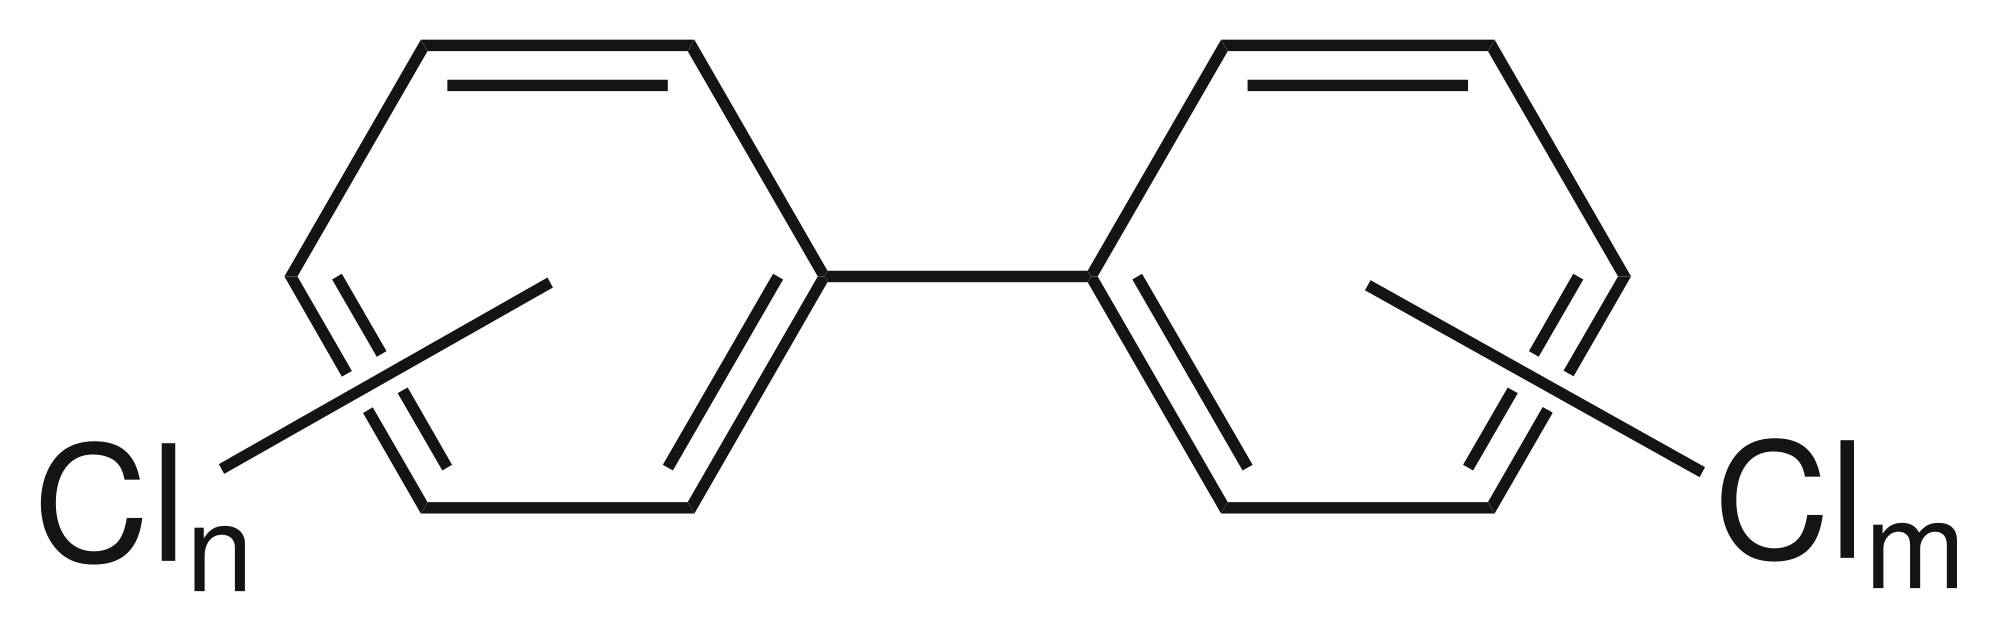
Figure a. Chemical structure of polychlorinated biphenyls
Although usage of PCBs was banned in most forms over 30 years ago (PARCOM, 1992), they still exist in old electrical equipment and environmental media to which humans can be exposed. PCBs are expected to be present in electronic waste streams from which they can leach into the environment (Menad et al., 1998). Humans are exposed mainly via food, mostly from contaminated animal fats. Indoor air can also contribute to human exposure. Worldwide monitoring programmes have shown that PCBs are present in most samples of human breast milk (Pietrzak-Fiecko et al., 2005).
PCBs do not burn easily and are good insulators (Bergman et al., 2012). These properties contribute greatly to PCBs having become environmental contaminants, which are regulated by the Stockholm Convention on Persistent Organic Pollutants (2004, amended 2007). The chemical inertness and heat stability properties that make PCBs desirable for industry also enable PCB residues to persist in the environment for long periods and to be transported worldwide associated with particulate matter as this is dispersed through waters, precipitation, wind, and other physical forces (Jaward et al., 2004; Eckhardt et al., 2007; Gioia et al., 2008).
Of the 209 PCB congeners, the most toxic are the so-called ‘dioxin-like’ PCBs. These are the four non-ortho PCBs (CB77, CB81, CB126, CB169) and eight mono-ortho PCBs (CB105, CB114, CB118, CB123, CB156, CB157, CB167, CB189).
Owing to their persistence, potential to bioaccumulate and toxicity they have been included on the OSPAR List of Chemicals for Priority Action (OSPAR, 2007). Six PCB congeners were recommended for monitoring by the European Commission (2001). As the most toxic PCB, CB118 is also monitored. As per the OSPAR Coordinated Environmental Monitoring Programme (CEMP) (OSPAR, 2016), Contracting Parties are required to monitor the seven PCB congeners CB28, CB52, CB101, CB118, CB138, CB153, and CB180 (OSPAR, 1997) on a mandatory basis in biota (fish and mussels) and sediments for temporal trends and spatial distribution. Marine sediments, in particular those with a high organic carbon content, may accumulate hydrophobic compounds like PCBs to considerably higher concentrations than surrounding waters. The sampling strategy is defined by the purpose of the monitoring programme and the natural conditions of the region to be monitored (OSPAR, 1997). Typically sampling approaches include fixed-monitoring site sampling, stratified random sampling, or stratified fixed sampling. Muddy sediments, namely those containing a high proportion of fine material, are preferable for organic contaminant monitoring, although sieving of sediments may be an alternative (OSPAR, 2002).
In assessing contaminants both ‘relative’ and ‘absolute’ aspects have been analysed:
• ‘Trend assessment’ or spatial distribution assessment to focus on relative differences and changes on spatial and temporal scales – provides information about the rates of change and whether contamination is widespread or rather confined to specific locations; and
• ‘Status’ assessment of the significance of the (risk of) pollution, defined as the status where chemicals are at a hazardous level, usually requires assessment criteria that take account of the possible severity of the impacts and hence requires criteria that take account of the natural conditions (background concentrations) and the ecotoxicology of the contaminant. For example, Environmental Assessment Criteria (EAC) are tools in this type of assessment.
OSPAR has clarified that in assessing the Co-ordinated Environmental Monitoring Programme (CEMP) data the primary assessment value used in the assessment of contaminant concentrations in sediment and biota, “corresponds to the achievement, or failure to achieve, statutory targets or policy objectives for contaminants in these matrices” (OSPAR, 2009a). This set of assessment criteria was specifically compiled for the assessment of CEMP monitoring data on hazardous substances contributing to the QSR 2010. The use of this set was considered an interim solution for the purposes of the QSR 2010 until more appropriate approaches to defining assessment criteria could be agreed upon and implemented. These criteria have also been used in the annually recurring CEMP assessments since 2010 and will be used until OSPAR agrees on the adoption of improved assessment criteria and subject to the conditions set out in the agreement.
Two assessment criteria are used to assess PCB concentrations in sediment: background assessment concentrations (BACs) and environmental assessment criteria (EACs).
OSPAR IA 2017 Indicator Assessment values are not to be considered as equivalent to proposed European Union Marine Strategy Framework Directive (MSFD) criteria threshold values, however they can be used for the purposes of their MSFD obligations by those Contracting Parties that wish to do so.
Provenance and limitations of BACs
BACs were developed by OSPAR for testing whether measured concentrations are near background levels for naturally occurring substances and close to zero for synthetic substances, the ultimate aim of the OSPAR Hazardous Substances Strategy. Mean concentrations significantly below the BAC are said to be near background (naturally occurring concentrations). BACs are statistical tools defined in relation to the background concentrations or low concentrations, which enable statistical testing of whether observed concentrations could be considered to be near background concentrations.
Background concentrations (BCs) are assessment tools intended to represent the concentrations of hazardous substances that would be expected in the North-East Atlantic if certain industrial developments had not happened. They represent the concentrations of those substances at ‘remote’ sites, or in ‘pristine’ conditions based on contemporary or historical data respectively, in the absence of significant mineralisation and/or oceanographic influences. In this way, they relate to the background values referred to in the OSPAR Hazardous Substances Strategy. BCs for synthetic, man-made substances should be regarded as zero. It is recognised that natural processes such as geological variability or upwelling of oceanic waters near the coast may lead to significant variations in background concentrations of contaminants, for example trace metals. The natural variability of background concentrations should be taken into account in the interpretation of CEMP data, and local conditions should be taken into account when assessing the significance of any exceedance.
Low concentrations (LCs) are values used to assist the derivation of BACs where there have been difficulties in assembling a dataset on concentrations in remote or pristine areas from which to derive BCs. LCs have been prepared on the basis of datasets from areas that could generally be considered remote but which could not be guaranteed to be free from influence from long-range atmospheric transport of contaminants. LCs have also been used to assess concentrations in sediments from Spain due to the specific bulk composition of sediments from the coasts of the Iberian Peninsula. It is recognised that natural background concentrations may be lower than the LCs and that they may not be directly applicable across the entire Convention area.
BACs are calculated according to the method set out in Section 4 of the CEMP Assessment Manual (OSPAR, 2008). The outcome is that, on the basis of what is known about variability in observations, there is a 90% probability that the observed mean concentration will be below the BAC when the true mean concentration is at the BC. Where this is the case, the true concentrations can be regarded as ‘near background’ (for naturally occurring substances) or ‘close to zero’ (for man-made substances).
BACs are calculated on the basis of variability within the CEMP dataset currently available through databases held by the ICES Data Centre and will be refined by the relevant assessment group as further CEMP monitoring data are collected.
Provenance and limitations of EACs
Environmental Assessment Criteria were developed by OSPAR and ICES for assessing the ecological significance of sediment and biota concentrations. Some EAC values were specifically compiled for the assessment of CEMP monitoring data on hazardous substances contributing to the QSR 2010 (OSPAR Agreement 2009-2). EACs do not represent target values or legal standards under the OSPAR Convention and should not be used as such. The EAC values were set so that hazardous substance concentrations in sediment and biota below the EAC should not cause chronic effects in sensitive marine species, including the most sensitive species, nor should concentrations present an unacceptable risk to the environment and its living resources. However, the risk of secondary poisoning is not always considered. EACs continue to be developed for use in data assessments.
As concentrations below the EAC are considered to present no significant risk to the environment, in most cases EAC are considered analogous to the Environmental Quality Standards applied to concentrations of contaminants in water or biota, for example under the European Union Water Framework Directive.
For PCBs in biota, equilibrium concentrations were calculated from sediment concentrations and partition coefficients based on the assumption of equilibrium between PCBs in lipids of biota and in sediment (OSPAR, 2009a,b). Thus, the EACs for PCBs in sediment were used to calculate concentrations of PCBs in fish liver (on a lipid weight basis) and in mussels, in equilibrium with sediment containing PCB concentrations equal to the EAC in sediment.
Caution should be exercised in using these generic environmental assessment criteria in specific situations. Their use does not preclude the use of common sense and expert judgement when assessing environmental effects and/or the potential for them.
Assessment method
For each PCB compound at each monitoring site, the time series of concentration measurements was assessed for trends and status using the methods described in the contaminants online assessment tool (http://dome.ices.dk/osparmime2016/main.html). The results from these individual time series were then synthesised at the assessment areas scale in a series of meta-analyses.
Trend assessments included those monitoring sites that were representative of general conditions, and excluded those monitoring sites impacted due to a point source as well as baseline monitoring sites where trends would not be expected. The analysis was also restricted to assessment areas where there were at least three monitoring sites with trend information and where those monitoring sites had reasonable geographic spread.
The trend in each congener at each monitoring site was summarised by the estimated annual change in log concentration, with its associated standard error. The annual change in log concentration was then modelled by a linear mixed model with a fixed effect:
~ OSPAR contaminants assessment areas
and random effects:
~ congener + congener: OSPAR contaminants assessment area + monitoring site + congener: monitoring site + within-series variation
The choice of fixed and random effects was motivated by the assumption that the PCB congeners would have broadly similar trends, since they have similar sources. Thus, the fixed effect measures the common trend in PCB congeners in each OSPAR contaminants assessment area and the random effects measure variation in trends:
- between congeners common across OSPAR contaminants assessment areas (congener);
- between congeners within OSPAR contaminants assessment areas (congener: contaminants assessment area);
- between monitoring sites common across congeners (monitoring site); and
- residual variation (congener: monitoring site + within-series variation).
There are two residual terms. Within-series variation is the variation associated with the estimate of the trend from the individual time series and is assumed known (and given by the square of the standard error). Congener: monitoring site allows for any additional residual variation.
Evidence of trends in PCB concentrations at the contaminants assessment area scale was then assessed by plotting the estimated fixed effects with point-wise 95% confidence intervals. Differences between congeners were explored by plotting the predicted trend for each congener and for each congener / assessment area combination with point-wise 95% confidence intervals.
Similar analyses explored status at the assessment area scale. Two summary measures were considered: the log ratio of the fitted concentration in the last monitoring year to the EAC; and the log ratio of the fitted concentration in the last monitoring year to the BAC. Baseline monitoring sites were also included in these analyses.
Finally, concentration profiles across congeners at the assessment area scale were explored using the fitted log concentration in the last monitoring year.
BACs and EACs are available for the following PCBs in sediment (Table a).
| BAC (μg/kg dw) | EAC (μg/kg dw) | |
|---|---|---|
| All OSPAR assessment areas except Iberian Sea and Gulf of Cadiz | All OSPAR assessment areas | |
| CB28 | 0.22 | 1.7 |
| CB52 | 0.12 | 2.7 |
| CB101 | 0.14 | 3.0 |
| CB118 | 0.17 | 0.6 |
| CB138 | 0.15 | 7.9 |
| CB153 | 0.19 | 40 |
| CB180 | 0.10 | 12 |
Table a notes: BACs are normalised to 2.5% organic carbon; BACs are under development for the Iberian Sea and Gulf of Cadiz, where concentrations are only assessed against the EAC.
The number of monitoring sites used to assess trends and status by assessment area is shown in Tables b and c.
| OSPAR contaminants assessment areas | Monitoring sites | CB28 | CB52 | CB101 | CB118 | CB138 | CB153 | CB180 |
|---|---|---|---|---|---|---|---|---|
| Northern North Sea | 21 | 8 | 16 | 17 | 16 | 17 | 19 | 15 |
| Southern North Sea | 42 | 39 | 31 | 41 | 42 | 42 | 41 | 37 |
| English Channel | 34 | 11 | 16 | 27 | 32 | 3 | 34 | 22 |
| Irish and Scottish West Coast | 9 | 6 | 4 | 6 | 6 | 8 | 8 | 3 |
| Irish Sea | 19 | 17 | 16 | 17 | 19 | 19 | 18 | 16 |
| Celtic Sea | 1 | 1 | 1 | 1 | 1 | 1 | 1 | 1 |
| Iberian Sea | 15 | 15 | 15 | 15 | 15 | 15 | 15 | 15 |
| Gulf of Cadiz | 14 | 13 | 13 | 14 | 14 | 14 | 14 | 14 |
| OSPAR contaminants assessment area | Monitoring sites | CB28 | CB52 | CB101 | CB118 | CB138 | CB153 | CB180 |
|---|---|---|---|---|---|---|---|---|
| Northern North Sea | 17 | 5 | 8 | 12 | 12 | 11 | 15 | 8 |
| Southern North Sea | 33 | 29 | 22 | 32 | 31 | 32 | 31 | 27 |
| Channel | 2 | 0 | 0 | 2 | 2 | 2 | 2 | 1 |
| Irish and Scottish West Coast | 7 | 2 | 4 | 5 | 6 | 6 | 6 | 3 |
| Irish Sea | 10 | 9 | 9 | 10 | 10 | 10 | 10 | 8 |
| Celtic Sea | 1 | 1 | 1 | 1 | 1 | 1 | 1 | 1 |
| Gulf of Cadiz | 9 | 4 | 8 | 3 | 4 | 5 | 8 | 4 |
Differences in methodology used for the IA 2017 compared to the QSR 2010
For the IA 2017, a meta-analysis is used to synthesise the individual time series results and provide an assessment of status and trend at the assessment area level. Meta-analyses take into account both the estimate of status or trend in each time series and the uncertainty in that estimate. They provide a more objective regional assessment than was possible in the QSR 2010, where a simple tabulation of the trend and status at each monitoring station was presented.
Results
Polychlorinated biphenyl (PCB) concentrations are measured in sediment samples taken annually (or every few years) from monitoring sites throughout much of the Greater North Sea, Celtic Seas, Iberian Coast and Bay of Biscay (Figure 1).
The time series used to inform this assessment started in 1995. The data are used to investigate trends in PCB concentration over the period 1995–2015 and to compare concentrations against two sets of assessment values: Background Assessment Concentrations (BACs) and Environmental Assessment Criteria (EACs). Where concentrations are below the EAC they should not cause chronic effects in sensitive marine species and so should present no significant risk to the environment. BACs are used to assess whether concentrations are close to zero for man-made substances, the ultimate aim of the OSPAR Hazardous Substances Strategy.
Trend Assessment
PCB concentrations are decreasing in the Northern North Sea, Southern North Sea and Gulf of Cadiz. In contrast, concentrations show no statistically significant change in the Irish and Scottish West Coast and the Irish Sea (Figure 2).

Figure 1: Monitoring sites used to assess PCB concentrations in sediment by OSPAR contaminants assessment areas (white lines) determined by hydrogeographic principles and expert knowledge not OSPAR internal boundaries
Status Assessment
Concentrations in sediment for six out of seven PCB congeners are below the EAC in all OSPAR contaminants assessment areas (Figure 3) within the period 1995–2015. However, there are differences between congeners, with concentrations in sediment for one of the most toxic PCBs (CB118) close to or above the EAC in three assessment areas (English Channel, Southern North Sea and Irish Sea), indicating possible adverse effects on marine life in these areas. In the Irish and Scottish West Coast, Northern North Sea and Gulf of Cadiz assessment areas, CB118 concentrations in sediment are below the EAC, but still above the BAC. CB28 in the Irish and Scottish West Coast assessment area is the only measured concentration in sediment below the BAC.
There is high confidence in the assessment and sampling methodology and high confidence in the data used.
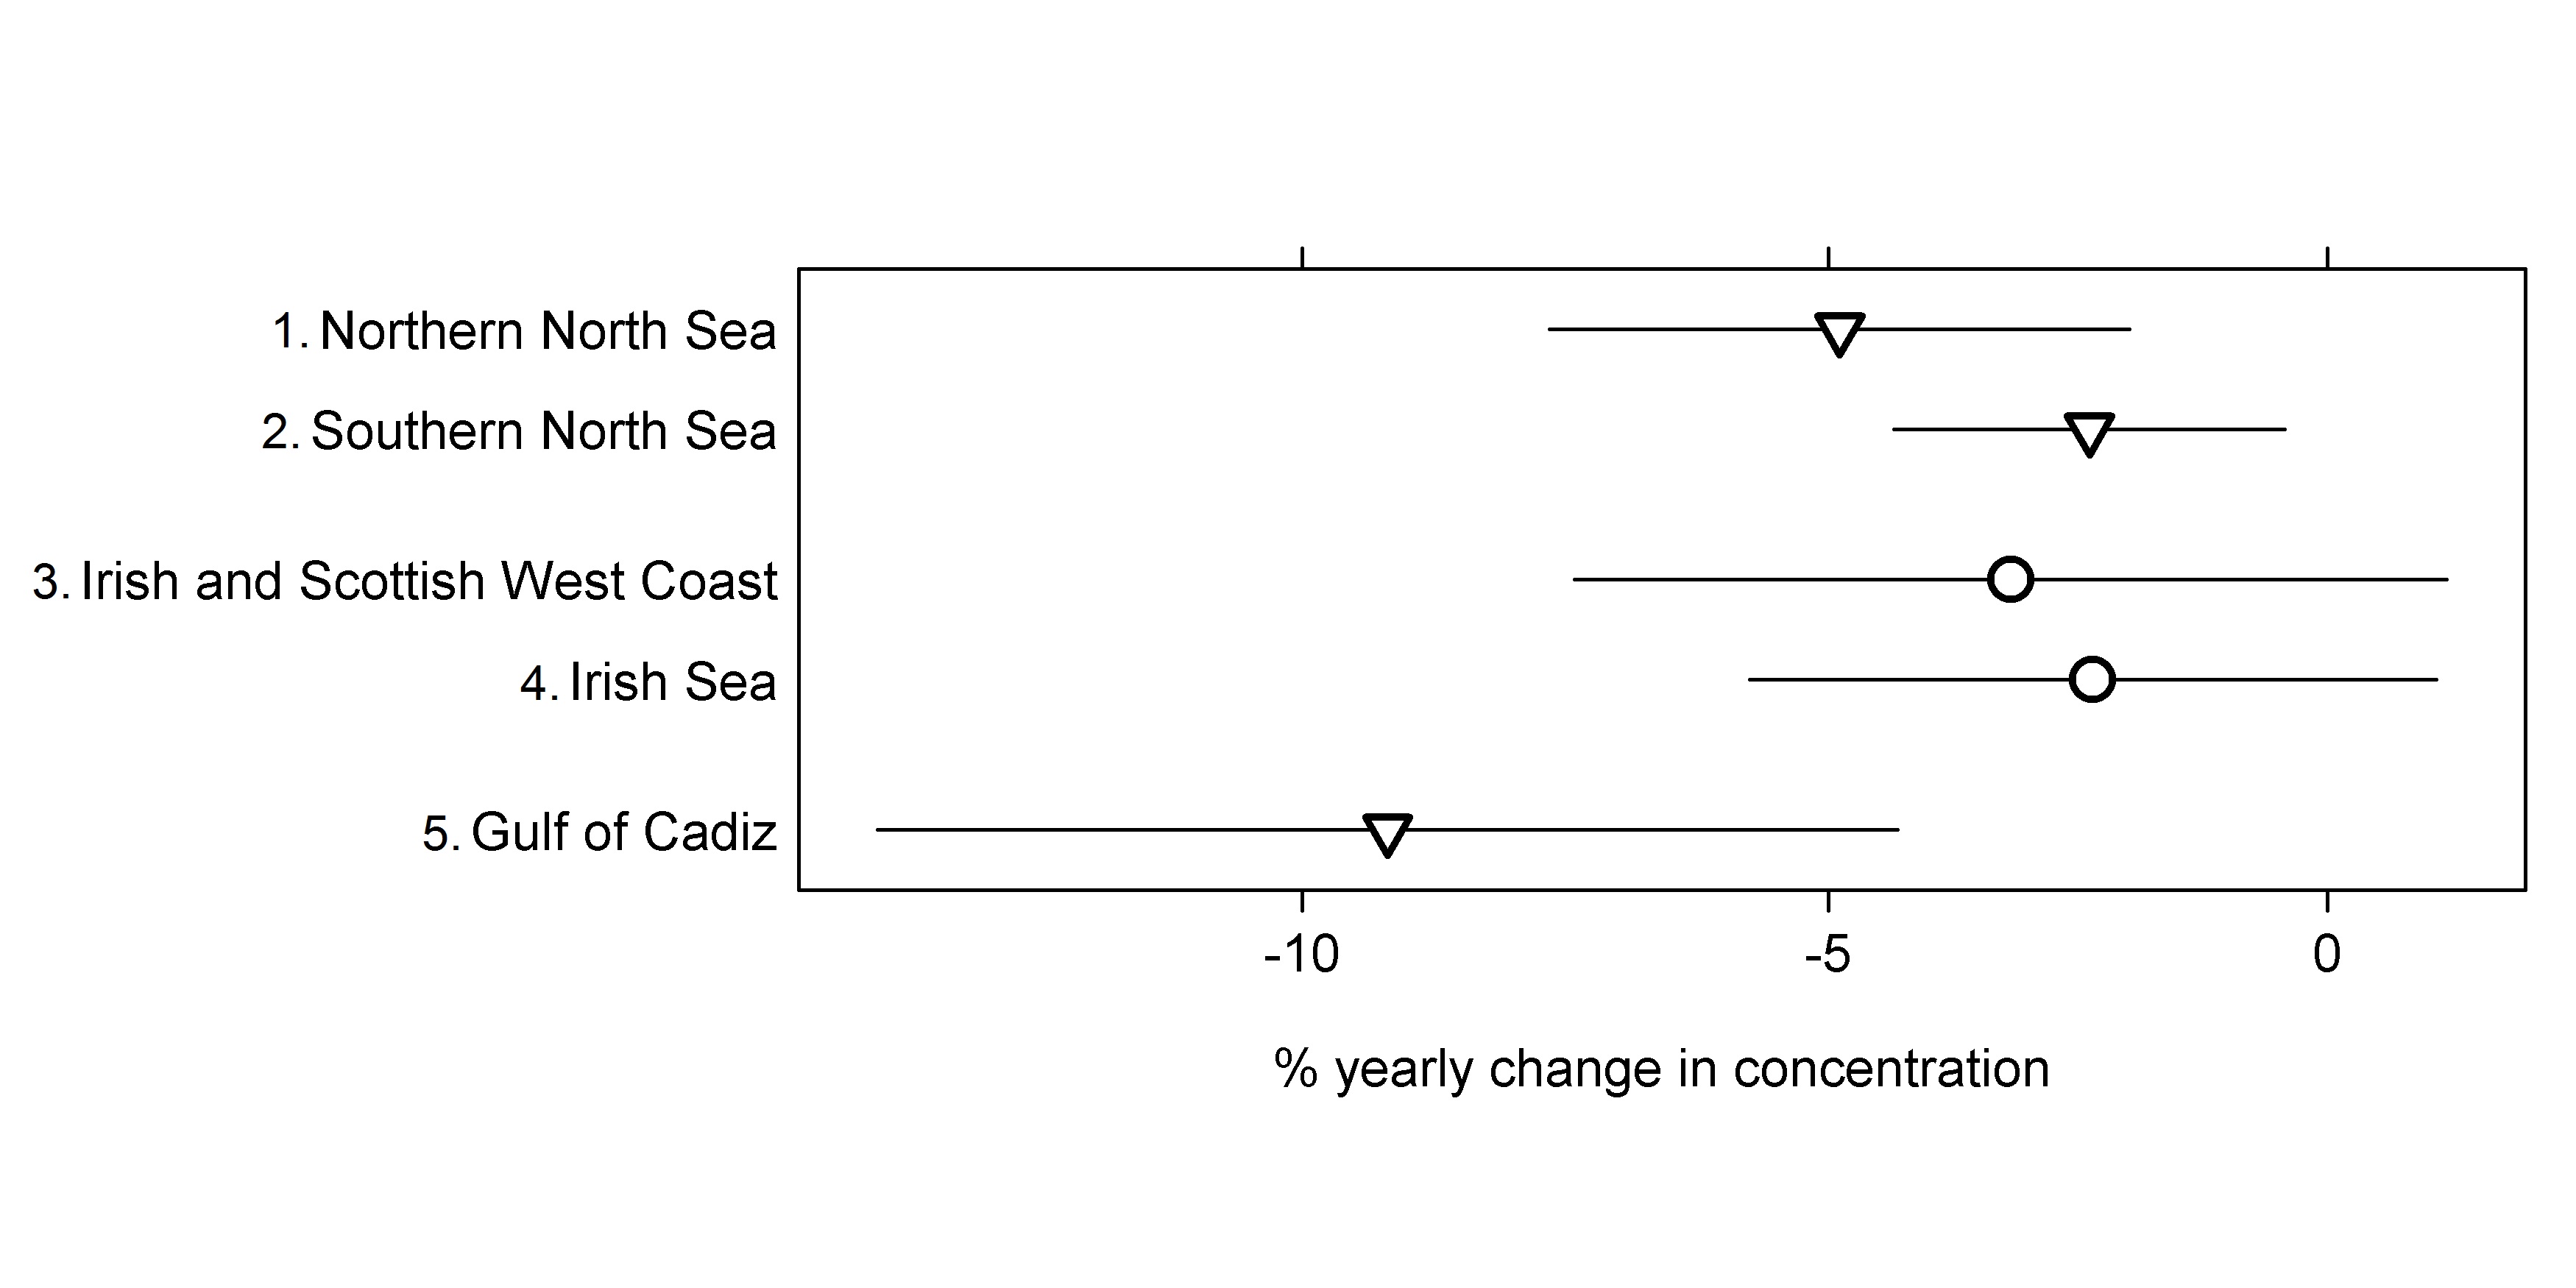
Figure 2: Percentage yearly change in PCB concentration in sediment (1995–2015) in each OSPAR contaminants assessment area
No statistically significant (p <0.05) change in mean concentration (circle), mean concentration is significantly decreasing (downward triangle). Missing regions have too few monitoring sites for an assessment

Figure 3: Mean PCB concentrations in sediment by congener (1995–2015) in each OSPAR contaminants assessment area relative to the EAC (with 95% upper confidence limits)
Value of 1 means that the mean concentration equals the EAC. Blue, mean concentration statistically significantly (p <0.05) below the congener’s Background Assessment Concentration (BAC). Green, mean concentration statistically significantly above the congener’s BAC but below the Environmental Assessment Criteria (EAC). Red, mean concentration not statistically significantly below the EAC
Regional Assessment Results
Contamination from polychlorinated biphenyls (PCBs) is widespread and persists in the marine environment, especially in biological systems. There are few areas where concentrations are close to zero.
PCB concentrations are lowest in the Northern North Sea, the Irish and Scottish West Coast and the Gulf of Cadiz. However, PCBs are not yet at concentrations close to zero even at monitoring stations remote from industrial activity. In three assessment areas (English Channel, Southern North Sea, Irish Sea) there are locations where concentrations of the most toxic PCB congener (CB118) pose a risk of pollution effects.
Owing to their slow breakdown in the environment, PCBs will persist in marine sediments for many years to come.
Individual Time Series Results per Monitoring Site
A summary of individual time series results at monitoring sites across the OSPAR Maritime Area for PCB concentrations in sediment is presented here http://dome.ices.dk/osparmime2016/regional_assessment_sediment_chlorobiphenyls.html. In total, mean concentrations of PCBs in sediment are above the EAC in 207 out of 1016 time series. In 27 out of 563 time series, mean concentrations have increased over the assessment period (1996–2015). It should be noted that not all individual time series results are included in the regional assessments (see number of time series used in each OSPAR region and assessment area in Tables b and c), due to the criteria set out in the assessment methodology.
Confidence Assessment
There is high confidence in the quality of the data used for this assessment. The data have been collected over many years using established sampling methodologies. There is sufficient temporal and spatial coverage and no significant data gaps in the areas assessed over the relevant time period (1995–2015). The methods are based on established and internationally recognised protocols for monitoring and assessment per monitoring site, with a new secondary step of synthesising monitoring site data at the assessment area scale. Therefore there is also high confidence in the methodology.
Conclusion
More than 25 years after polychlorinated biphenyls (PCBs) were banned they may still be causing adverse effects on marine life in some parts of the OSPAR Maritime Area.
PCBs are found in all marine sediments. While concentrations are decreasing in the Greater North Sea and Gulf of Cadiz, they show no statistically significant change in the Celtic Seas. With the exception of the most toxic congener (CB118), concentrations of all PCB congeners in sediment are below the level at which they could present an unacceptable risk to the environment. Mean concentrations of CB118 in sediment are at or above this level in three of the six assessment areas assessed.
PCBs remain in the sediment for long periods and have the potential to accumulate in biota and biomagnify up food chains. Due to past industrial uses and the persistence of PCBs in the environment it will take several more decades before concentrations are close to zero, the ultimate aim of the OSPAR Hazardous Substances Strategy.
Historic contamination of the environment by polychlorinated biphenyls (PCBs) means there are limited possibilities for addressing the issue of PCB concentrations in sediment.
In parallel to reduced PCB emissions in areas of former use, studies have recorded surprisingly high concentrations of PCBs in areas far from the traditional source regions (Jaward et al., 2004; Gioia et al., 2008, 2011). There are indications that primary emission sources of PCBs are increasing from some African countries, where PCBs have not been commercially produced and used. Major sources of PCBs in African countries include transformers, continuing import of e-waste from other countries, shipwrecks, and biomass burning (Gioia et al., 2013).
Knowledge Gaps
There is a lack of monitoring data for some parts of the OSPAR Maritime Area, particularly in Arctic Waters, some parts of the Celtic Seas and the Iberian Coast and Bay of Biscay.
More research is needed to investigate how much of the reduction in polychlorinated biphenyl (PCB) concentrations in areas of former use is occurring at the expense of levels in areas where PCBs have not been commercially produced and used, such as Africa, which receive PCBs in the form of obsolete products and wastes.
Further research is required to define diffuse inputs from terrestrial sources. Modelling work to understand atmospheric transport from remaining sources could also be undertaken. Landfill and waste deposit sites may also still be leaking PCB contaminated material as they are unable to provide the very high temperatures needed to destroy PCBs. Demolition of buildings containing PCB sealants and redistribution of sediments via dredging may be remobilising PCBs which were locked away (Jepson and Law, 2016).
Bergman A, Rydén A, Law RJ, de Boer J, Covaci A, AlaeeM, Birnbaum L, PetreasM, RoseM, Sakai S, den Eede NV, van der Veen I (2012) A novel abbreviation standard for organobromine, organochlorine, and organophosphorus flame retardants and some characteristics of the chemicals. Environ Int 49:57–82.
Breivik, K., Sweetman, A., Pacyna, J. M. and Jones, K. C. (2007). Towards a global historical emission inventory for selected PCB congeners – A mass balance approach 3. An Update, Science of the Total Environment, 377: 296–307.
Eckhardt S, Breivik K, Mano S, Stohl A (2007) Record high peaks in PCB concentrations in the Arctic atmosphere due to long-range transport of biomass burning emissions. Atmos Chem Phys 7:4527–4536
European Commission (2001). Communication from the Commission to the Council, the European Parliament and the Economic and Social Committee Community – Strategy for Dioxins, Furans and Polychlorinated Biphenyls (COM/2001/0593 final)
Gioia R, Nizzetto L, Lohmann R, Dachs J, Jones KC (2008) Polychlorinated biphenyls (PCBs) in air and seawater of the Atlantic Ocean: sources, trends and processes. Environ Sci Technol 42:1416–1422
Gioia R, Eckhardt S, Breivik K, Jaward FM, Prieto A, Nizzetto L, Jones KC (2011) Evidence for major emissions of PCBs in the West African region. Environ Sci Technol 45:1349–1355
Gioia R, Akindele AJ, Adebusoye SA, Asante KA, Tanabe S, Buekens A, et al. (2013) Polychlorinated biphenyls (PCBs) in Africa: a review of environmental levels. Environ Sci Pollut Res 21(10):6278-89
Jaward FM, Barber JL, Booij K, Dachs J, Lohmann R, Jones KC (2004) Evidence for dynamic air-water coupling and cycling of persistent organic pollutants over open Atlantic Ocean. Environ Sci Technol 38:2617–2625
Jepson PD, Law RJ (2016). Persistent pollutants, persistent threats. Science, Vol. 352, Issue 6292, pp. 1388-1389. DOI: 10.1126/science.aaf9075, http://science.sciencemag.org/content/352/6292/1388
Lauby-Secretan B, Loomis D, Grosse Y, El Ghissassi F, Bouvard V, Benbrahim-Tallaa L, Guha N, Baan R, Mattock H, Straif K (2013) Carcinogenicity of polychlorinated biphenyls and polybrominated biphenyls. Lancet Oncol 14(4):287–288
Menad N, Björkman B, Allain EG (1998) Combustion of plastics contained in electric and electronic scrap. Resour Conserv Recycl 24:65–85
OSPAR (1997). Guidance note on the sampling and analysis of PCBs in air and precipitation. Agreement 1997-09.
OSPAR (2002). JAMP Guidelines for Monitoring Contaminants in Sediments. 2015 Update. Agreement 2002-16.
OSPAR (2007). OSPAR List of Chemicals for Priority Action (updated 2007). Agreement 2004-12.
OSPAR (2008). OSPAR Publication 2008-379 CEMP Assessment Manual: Co-ordinated Environmental Monitoring Programme Assessment Manual for contaminants in sediment and biota
OSPAR (2009a). Background Document on CEMP Assessment Criteria for QSR 2010. Monitoring and Assessment Series. Publication no. 461/2009. ISBN 978-1-907390-08-1
OSPAR (2009b). Agreement of OSPAR CEMP Assessment Criteria for the QSR 2010. OSPAR Agreement 2009-2
OSPAR (2016). OSPAR Coordinated Environmental Monitoring Programme (CEMP). Agreement 2016-01
PARCOM (1992). PARCOM Decision 92/3 on the Phasing out of PCBs and Hazardous PCB Substitutes
Pietrzak-Fiecko R, Smoczynska K, Smoczynski SS (2005) Polychlorinated biphenyls in human milk, UHT cow's milk, and infant formulas. Pol J Environ Stud 14(2):237–241
Sepulveda A, Schluep M, Renaud FG, Streicher M, Kuehr R, Hageluken C, Gerecke AC (2010) A review of the environmental fate and effects of hazardous substances released from electrical and electronic equipments during recycling: examples from China and India. Eur Env Imp Assess 30:28–e41
Stockholm Convention of Persistent Organic Pollutants (POPs) adopted to EU legislation in Regulation (EC) No 850/2004, amended 2009
| Sheet reference | HASEC17/D804 |
|---|---|
| Assessment type | Intermediate Assessment |
| Context (1) | Hazardous Substances |
| Context (2) | OSPAR Agreement 1997-09 Guidance note on the sampling and analysis of PCBs in air and precipitation |
| Context (3) | D8 - Concentrations of Contaminants |
| Context (4) | D8.1 - Concentration of contaminants |
| Point of contact | Thomas Maes |
secretariat@ospar.org | |
| Metadata date | 2017-09-15 |
| Title | Status and Trends of Polychlorinated Biphenyls (PCB) in Sediment |
| Resource abstract | Common indicator assessment of polychlorinated biphenyls (PCB) in sediment applicable to the Norwegian Trench, the Greater North Sea, Celtic Seas, Bay of Biscay and Iberian Coast |
| Linkage | https://www.ospar.org/convention/agreements?q=Agreement+1997-09&t=&a=&s= |
| Topic category | Environment |
| Indirect spatial reference | L3.2.2.1;L3.2.3.1;L3.2.8.1;L3.2.8.2;L3.2.8.3;L3.2.5.1;L3.2.5.2;L3.2.5.3;L3.2.5.4;L3.2.5.5;L3.2.5.6;L3.2.5.7;L3.2.5.8;L3.2.5.9;L3.2.5.10;L3.2.5.11;L3.2.5.12;L3.2.5.13;L3.2.5.14;L3.2.5.15; |
| N Lat | 62.0000008852327 |
| E Lon | 11.0587692133286 |
| S Lat | 36.0002573554926 |
| W Lon | -12.0250000001498 |
| Countries | BE, DE, DK, ES, FR, IE, IS, NL, NO, PT, SE, UK |
| Start date | 1979-01-01 |
| End date | 2015-12-31 |
| Date of publication | 2017-06-30 |
| Conditions applying to access and use | https://www.ospar.org/site/assets/files/1215/ospar_data_conditions_of_use.pdf |
| Data Snapshot | https://odims.ospar.org/documents/316/download |
| Data Results | http://dome.ices.dk/osparmime2016/regional_assessment_sediment_chlorobiphenyls.html |
| Data Results | https://odims.ospar.org/documents/291/download |
| Data Source | http://ices.dk/marine-data/data-portals/Pages/DOME.aspx |
| Data Source | http://dome.ices.dk/osparmime2016/main.html |
| Data Source | http://dome.ices.dk/views/ContaminantsSediment.aspx |
| Data Source | https://odims.ospar.org/search/?title__icontains=contaminants%20-%20sediment&limit=100&offset=0 |