

Winter Nutrient Concentrations in the Greater North Sea, Kattegat and Skagerrak
D5 - Eutrophication
D5.1 - Nutrients levels
Key message
Winter concentrations of dissolved inorganic nitrogen (DIN) and phosphorus (DIP) have decreased significantly in the southern North Sea and, for DIN, in the Kattegat, Sound and offshore areas of the Skagerrak since 1990. Since 2006, average winter concentrations of DIN and DIP in the area assessed have shown little change.
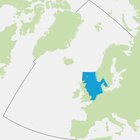
Area Assessed
Printable Summary
Background
OSPAR’s strategic objective with regard to eutrophication is to combat eutrophication in the OSPAR Maritime Area, with the ultimate aim to achieve and maintain a healthy marine environment where anthropogenic eutrophication does not occur. This indicator on winter nutrient concentrations is one of a suite of five eutrophication indicators. When assessed and considered together in the OSPAR Common Procedure in a multi-step method the suite of indicators can diagnose eutrophication.
Nutrients such as nitrogen, phosphorus and silicate enter the marine environment from the atmosphere, rivers, land runoff, or by direct discharges into the sea. Human activities can result in large quantities of nutrients entering the sea from sources that include agriculture, combustion processes (road traffic, shipping, power plants), municipal and industrial waste water treatment and aquaculture. Such nutrient discharges can lead to elevated nutrient concentrations in the marine environment, of which dissolved inorganic winter nutrient concentrations are a good indicator. Dissolved inorganic nitrogen, phosphorus and silicate concentrations are measured in winter when biological activity and uptake of nutrients by phytoplankton is low. Waters with high nutrient concentrations are not necessarily considered eutrophic because it is the characteristics of these waters (e.g. currents, turbidity) that affect whether those concentrations lead to eutrophication and associated effects.
The present assessment is an intermediate step towards a regionally coherent assessment of winter nutrient concentrations at the level of sub-areas used in this eutrophication assessment.
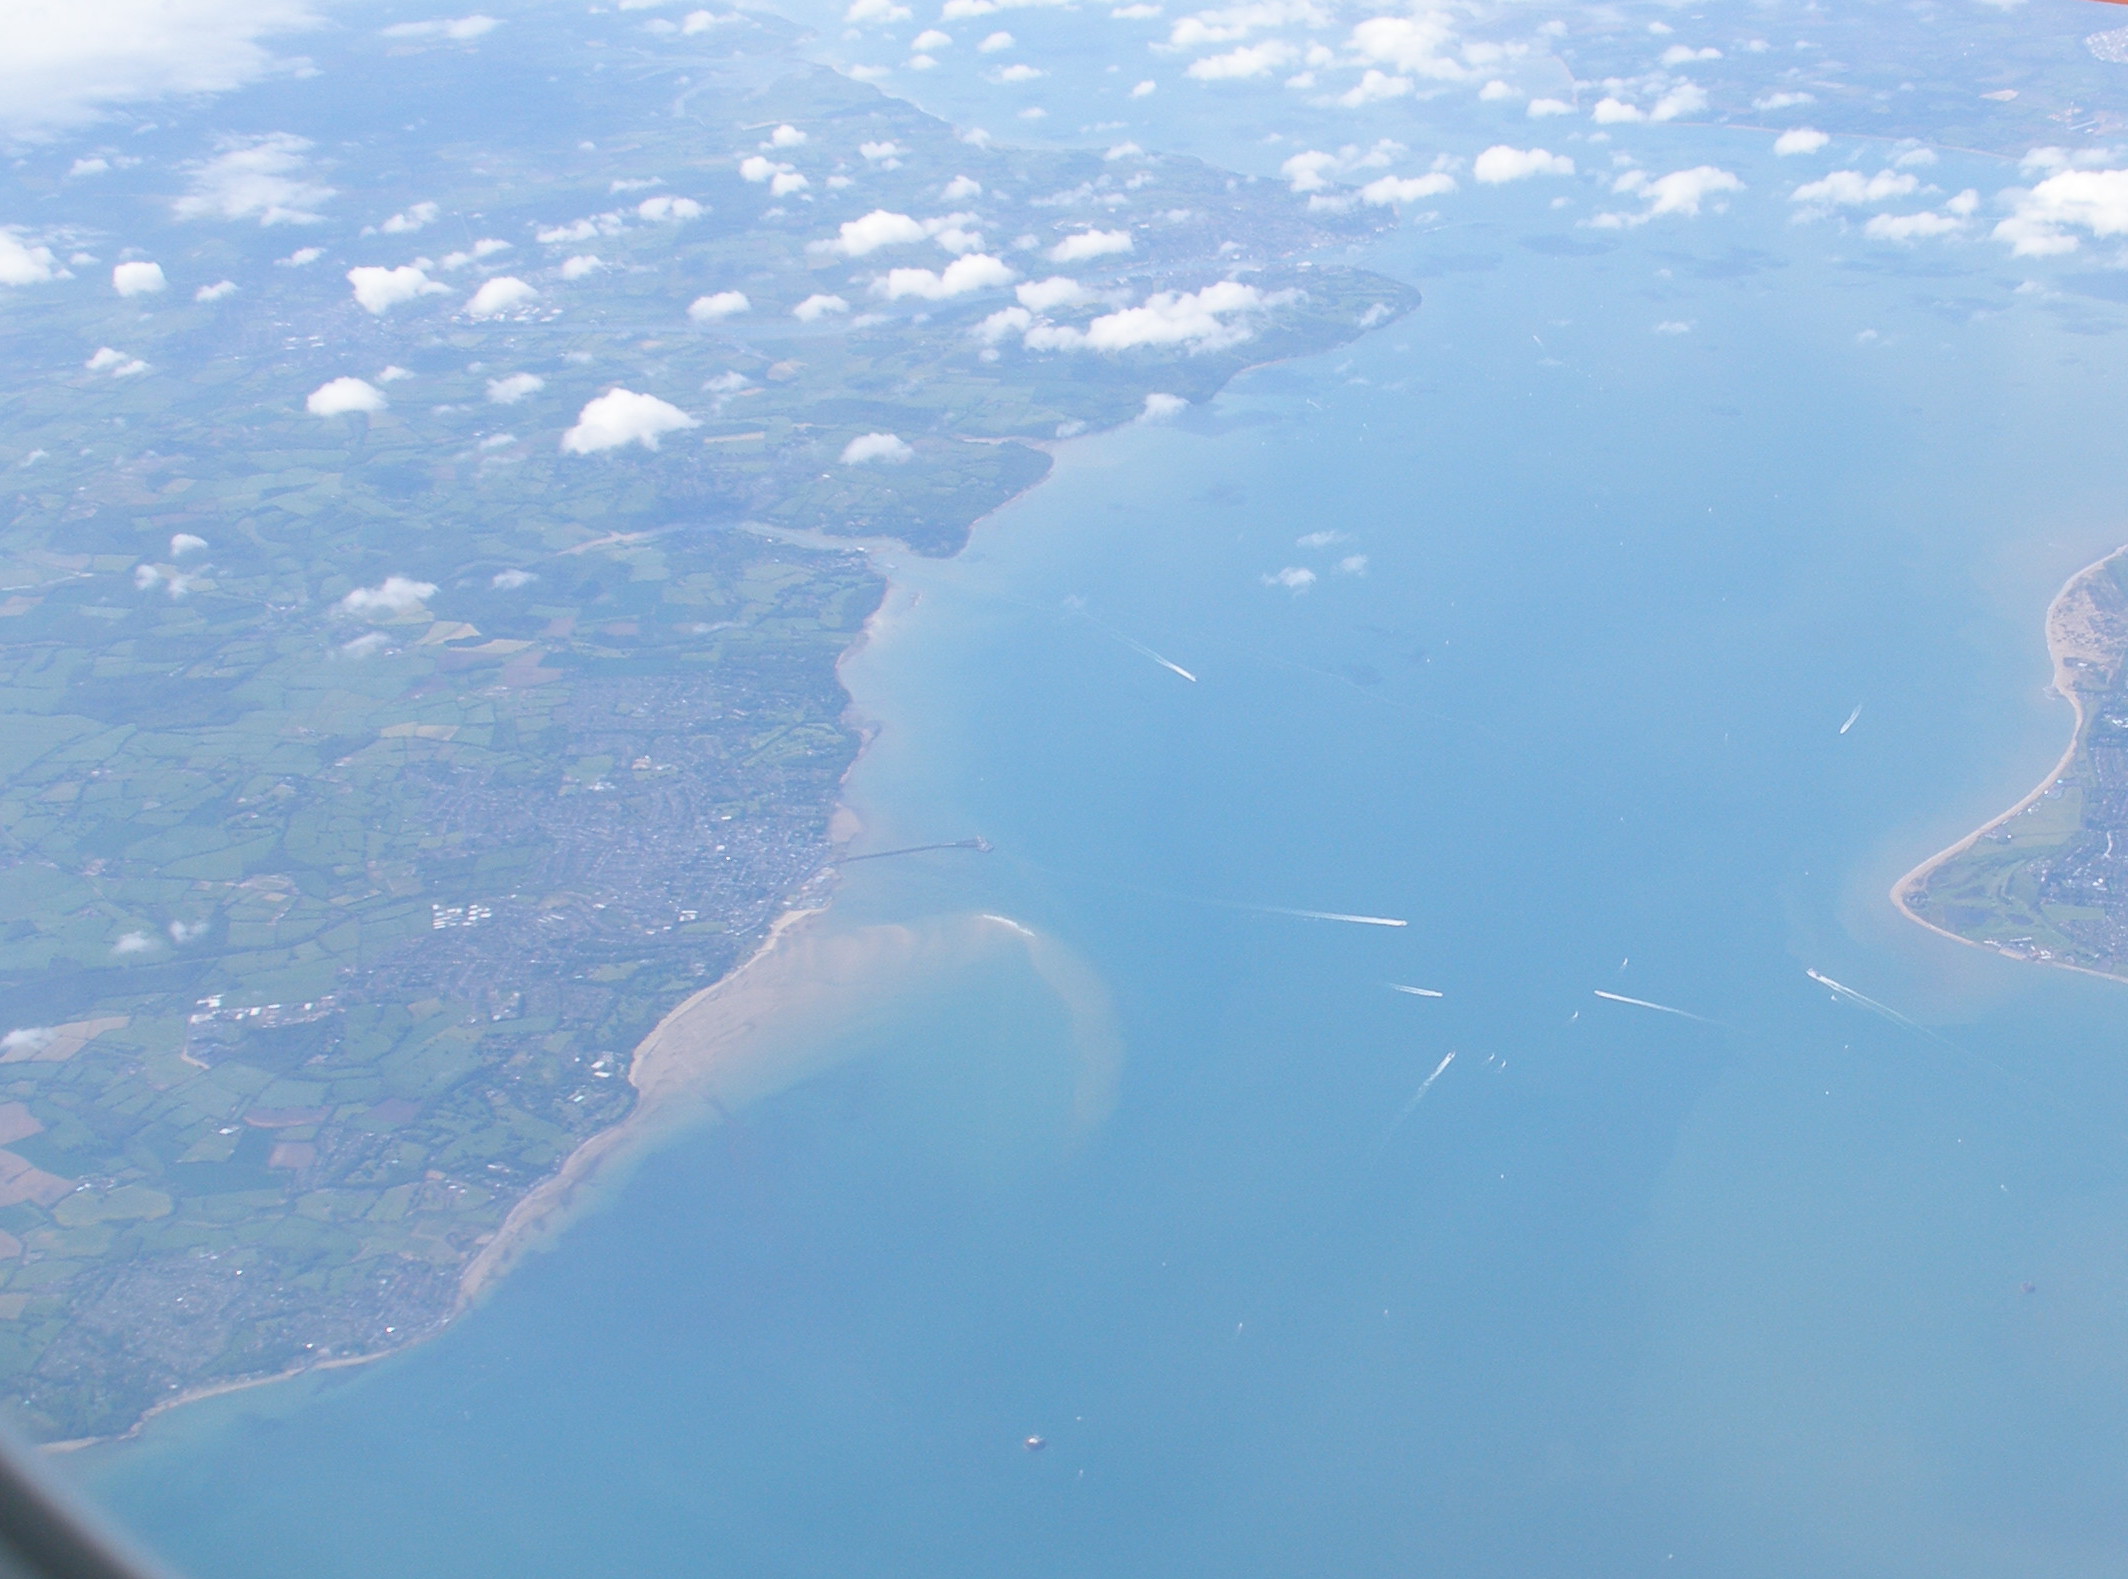
Land runoff into the sea can contain nutrients. © Mike Best
Eutrophication is the result of excessive enrichment of water with nutrients. This may cause accelerated growth of algae and / or higher forms of plant life. This may result in an undesirable disturbance to the balance of organisms present and thus to the overall water quality. Undesirable disturbances can include shifts in the composition and extent of flora and fauna and the depletion of oxygen due to decomposition of accumulated biomass. Such disturbances then have other effects, such as changes in habitats and biodiversity, blooms of nuisance algae or macroalgae, decrease in water clarity and behavioural changes or even death of fish and other species. Identifying causal links between these disturbances and nutrient enrichment can be complicated by other pressures. Cumulative effects, including climate change, may have similar effects on biological communities and dissolved oxygen, further complicating efforts to demonstrate causal links.
The OSPAR Commission’s strategic objective, with regard to eutrophication, is to combat eutrophication in the OSPAR Maritime Area, with the ultimate aim that by 2020 the OSPAR Maritime Area is a healthy marine environment where anthropogenic eutrophication does not occur (OSPAR Agreement 2010-3). The OSPAR Eutrophication Strategy requires assessment of eutrophication to be based on the ecological consequences of nutrient enrichment and not just on nutrient enrichment alone, i.e. finding reliable evidence for accelerated growth of algae and / or macrophytes caused by anthropogenic nutrient enrichment, leading to undesirable disturbance. Eutrophication is diagnosed using OSPAR’s harmonised criteria of nutrient inputs, concentrations and ratios, chlorophyll-a concentrations, phytoplankton indicator species, macrophytes, dissolved oxygen levels, incidence of fish kills and changes in zoobenthos (OSPAR Agreement 2010-3). As there is no single indicator of disturbance caused by marine eutrophication, OSPAR applies a multi-step method using the harmonised criteria. Eutrophication is considered to have occurred if there is evidence for all of the stages shown in Figure a and of causal links between them (ECJ, 2009).
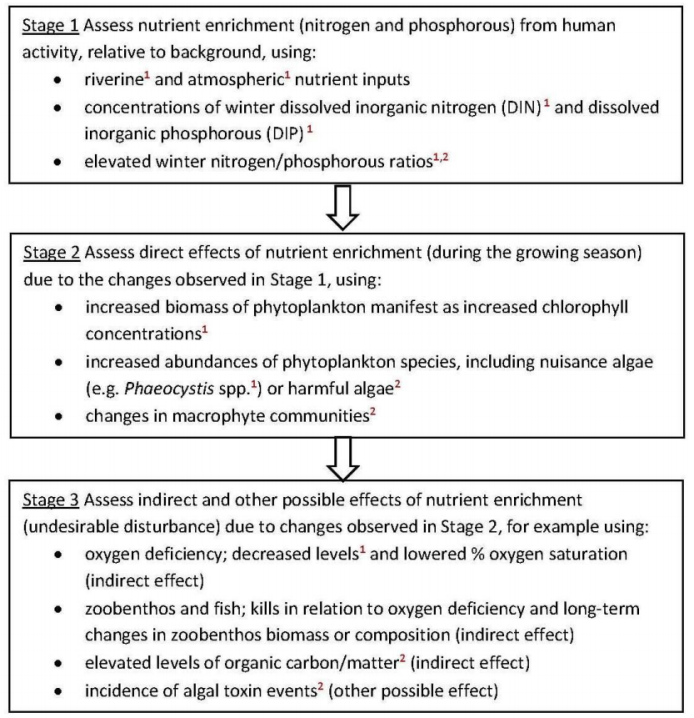
Figure a: Three stages in the identification of eutrophication. The criteria marked ¹ are common indicators for the OSPAR Intermediate Assessment 2017. The criteria marked ² are not relevant in all Contracting Parties’ waters. The common indicator assessed here (chlorophyll concentrations) is outlined in red
|
For OSPAR’s Intermediate Assessment 2017, five harmonised criteria have been assessed at a regional scale: nutrient inputs, nutrient concentrations and ratios, chlorophyll-a concentrations, concentrations of the nuisance algae Phaeocystis, and dissolved oxygen levels. These are highlighted in Figure a. The individual assessment results of any one of these five common indicators do not diagnose eutrophication by themselves. However, the assessments provide useful information about trends and are important for informing management measures.
Elevated nutrient concentrations promote the growth of phytoplankton and other plant life. Long-term winter dissolved inorganic nutrient concentrations and ratios, namely of nitrogen and phosphorus, act as indicators for quantifying the pressures of human activities and for evaluating the success of measures taken. For the interpretation of winter inorganic nutrient concentration gradients, sources and sinks, influx of nutrients from long distance transport and local upwelling events are important (e.g. Weston et al., 2004; Blauw et al., 2006; Bristow et al., 2013). Winter dissolved inorganic nutrient concentrations do not represent the total nitrogen and phosphorus pool available for winter primary production. The uptake of nutrients by benthic micro- and macroalgae and macrophytes could locally be important in coastal areas.
This indicator on nutrient concentrations covers the nutrient parameters dissolved inorganic nitrogen (DIN), dissolved inorganic phosphate (DIP) and silicate (Si). Oxidised nitrogen (nitrate (NO2-) + nitrite (NO3-)) (NOx) is used in lieu of DIN (nitrate + nitrite + ammonium (NH4+)) for the assessment of N (nitrogen) / P(phosphorus) ratios. Based on calculations from the data underlying this indicator assessment, NOx concentrations represent approximately 96% of DIN concentrations. The metrics used are spatial distribution, temporal trend, and ratio of nutrient concentrations.
Silicate concentrations are assessed for comparison as silicate is less influenced by anthropogenic activities. This nutrient compound can also have an important influence on the species composition of phytoplankton communities (a parameter used in diagnosing eutrophication status). Diatoms in particular need silicate to build their frustules (the silica-rich cell wall of a diatom).
The ratio between nitrogen (expressed as DIN or NOx depending on data availability) and phosphorus (expressed as DIP) is assessed because it can influence the phytoplankton community composition. A divergence of the N/P ratio from the Redfield Ratio (N/P = 16) can, in some circumstances, trigger the growth of harmful or toxic phytoplankton species. Reductions in inputs of one nutrient compound can alter nutrient ratios, which can affect phytoplankton composition, as recently demonstrated in the North Sea (Burson, et al., 2016).
Nutrient concentrations in coastal waters are mainly determined by riverine nutrient inputs and the mixing of these inputs with seawater. Riverine inputs are reflected by higher nutrient concentrations in shallow coastal areas with low salinity, such as on the continental coast of the southern North Sea, decreasing seaward with lower concentrations in the open sea with deeper and more saline offshore waters (i.e. exhibiting nutrient gradients). The influence of riverine inputs on nutrient concentrations is less visible in deeper coastal areas where they are diluted immediately by vertical and lateral mixing, such as on the east coast of the United Kingdom. The effect of these mixing processes on the assessment of nutrient concentrations needs to be taken into account. This is achieved by assessing nutrient concentrations within defined salinity bands.
Assessment areas
This indicator assessment is currently limited to the Greater North Sea (excluding the English Channel) due to issues with data in other areas.
For assessing this indicator, the Greater North Sea is sub-divided into the northern North Sea, the southern North Sea, the Skagerrak, the Kattegat and the Sound (Figure b). The southern North Sea contains most of the shallow continental coast. The northern North Sea contains two very different coastal area types: the mixed waters off the United Kingdom coast, and the Norwegian coastal areas which are affected by the Baltic Sea outflow. The Skagerrak and the Kattegat are assessed separately due to their unique hydrodynamic characteristics. The OSPAR Intermediate Assessment 2017 also includes an assessment of the Sound, which is part of the Baltic Sea and also covered by the Helsinki Convention on the Protection of the Marine Environment of the Baltic Sea Area.
Figure b also shows the distribution of salinity in the Greater North Sea. These data provide a comparison with the nutrient gradients presented in this indicator assessment and a visualisation of the different mixing regimes. Low salinities along the coasts of the southern North Sea indicate the effect of river outflows. Low salinities along the east coast of the northern North Sea and in the Skagerrak, the Kattegat and the Sound reflect the outflow of brackish waters from the Baltic Sea.
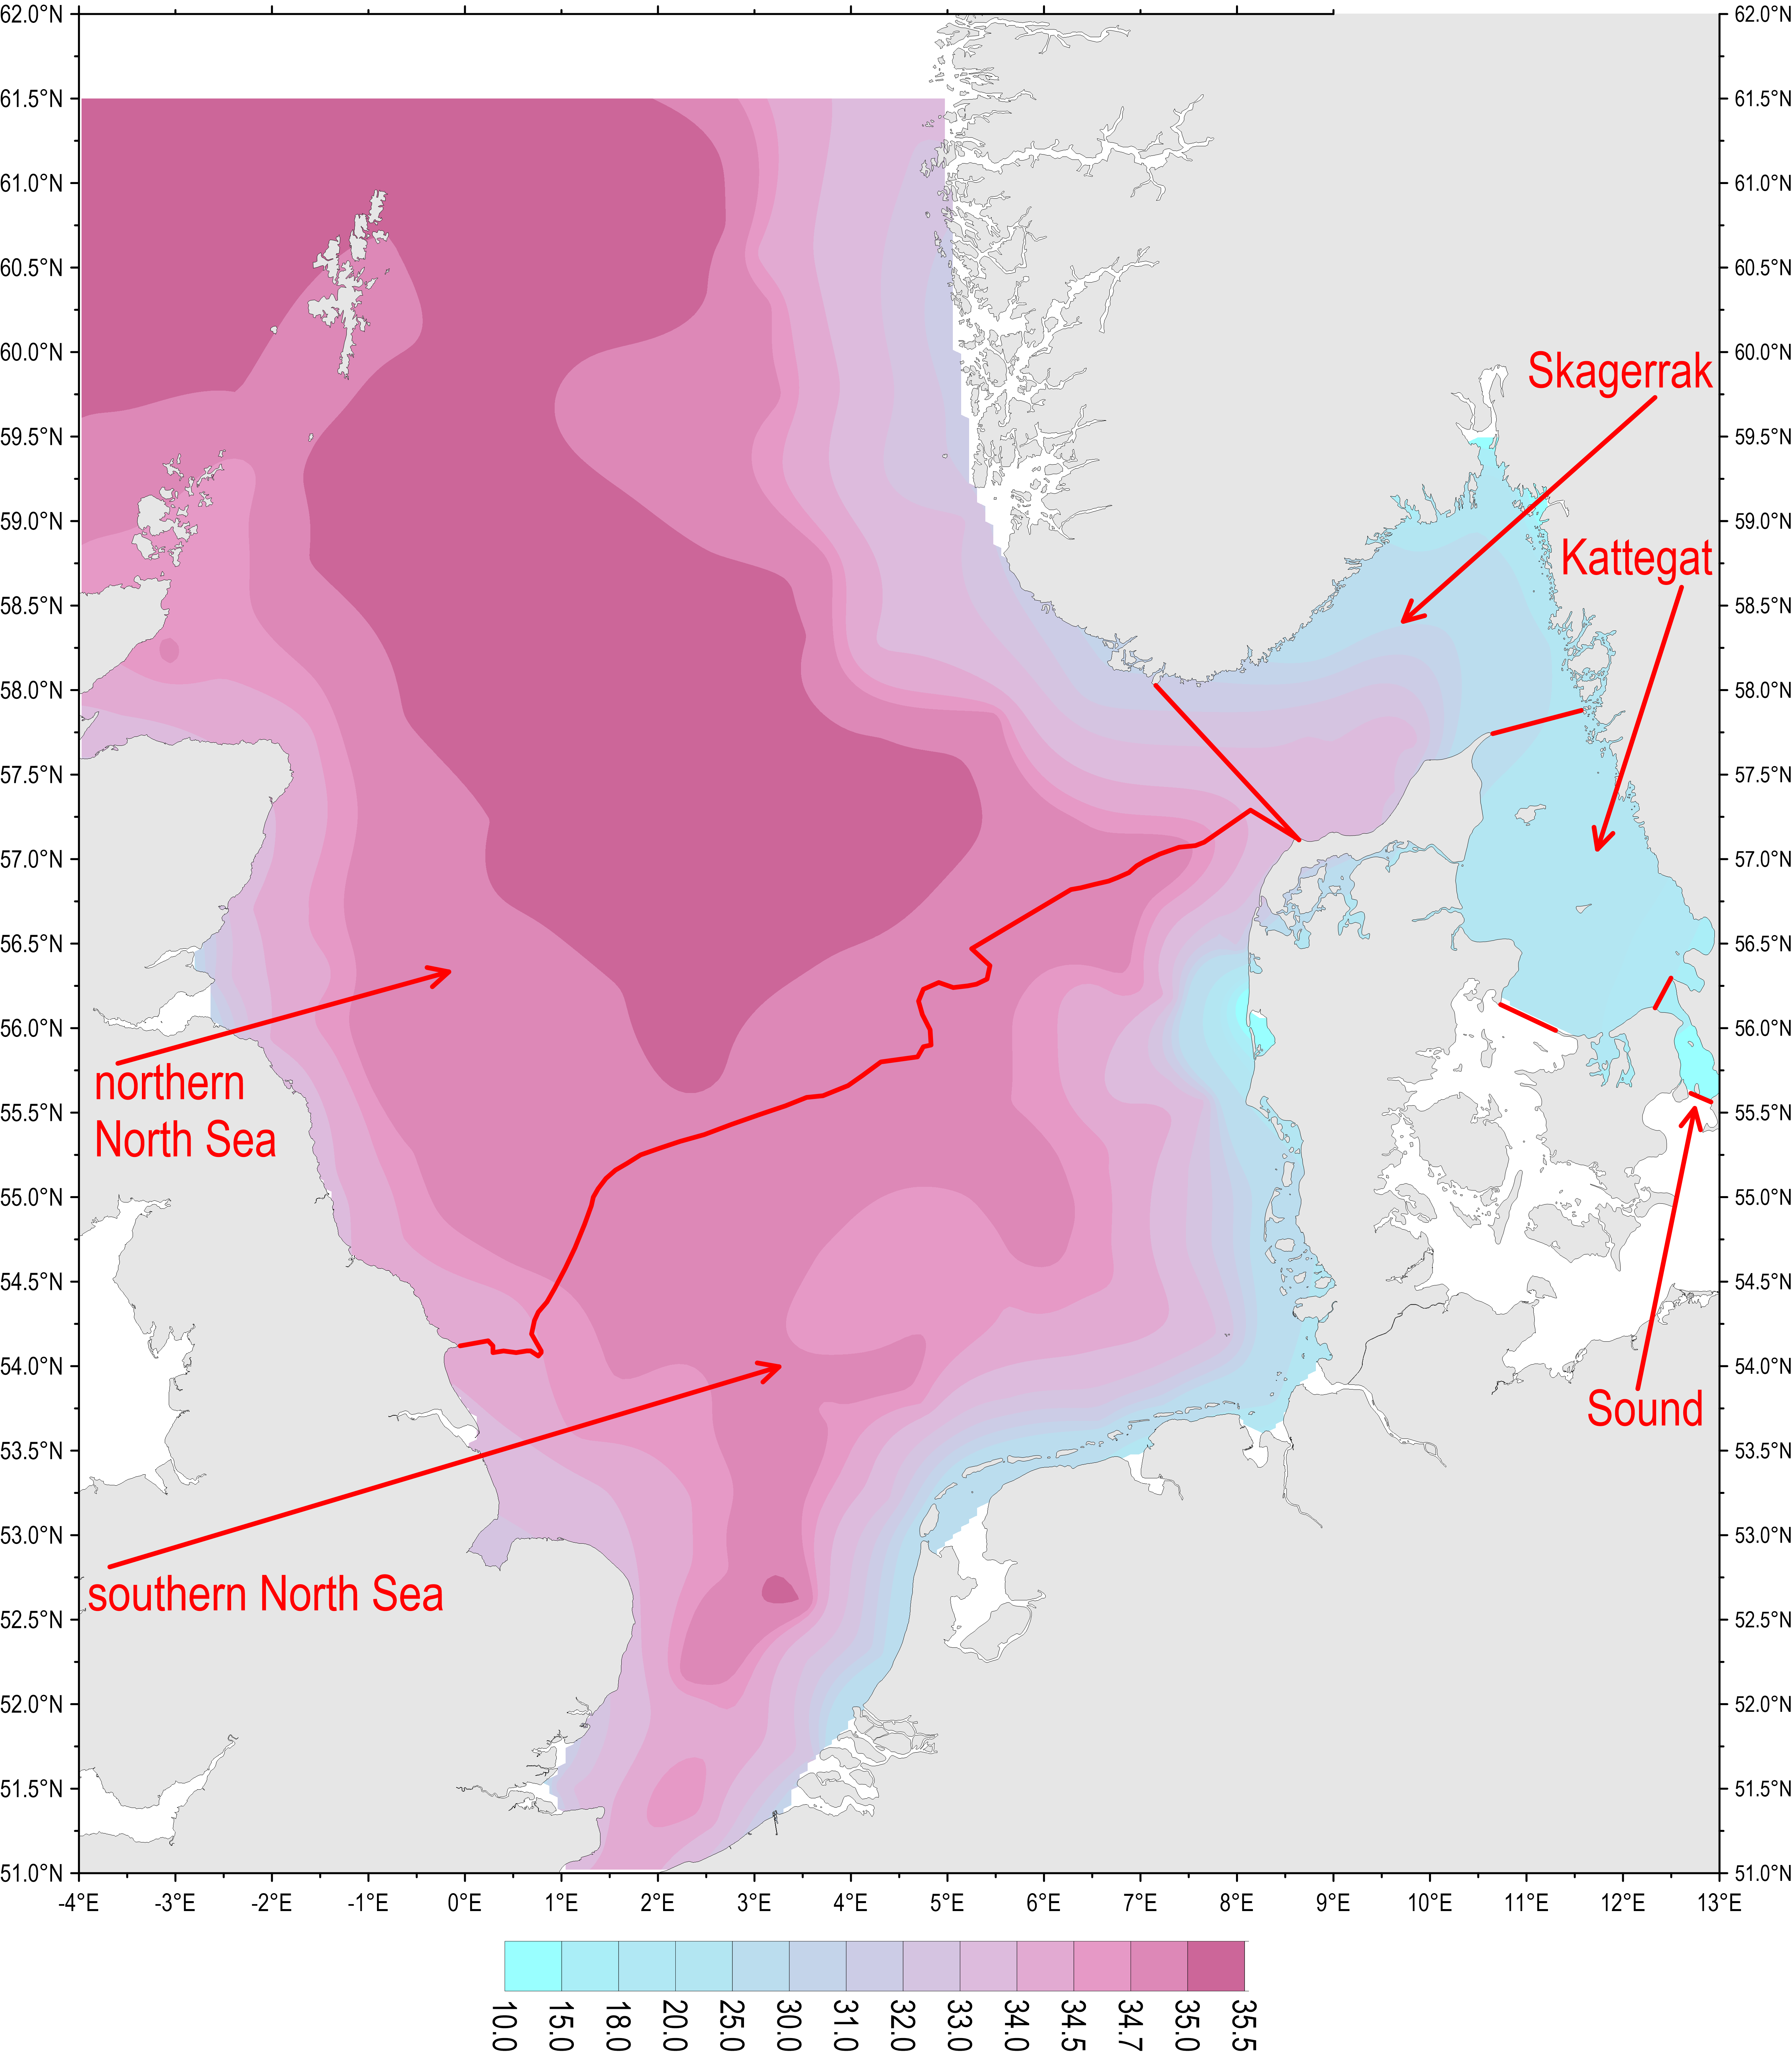
Figure b: Sub-divisions of the Greater North Sea for assessment purposes into southern North Sea, northern North Sea, the Skagerrak, the Kattegat and the Sound, and distribution of winter mean surface salinity (2006–2014).
For the purposes of trend assessments, assessment areas are defined on the basis of salinity regimes for coastal areas and offshore areas within the sub-divisions of the northern North Sea, the southern North Sea and the Skagerrak (Table a). Geographic distribution of salinity boundaries differs. In the southern North Sea for example, the boundary of salinity >30 can extend up to 20–50 km from the coast.
The waters of the southern North Sea are further sub-divided into smaller salinity bands for the assessment, in order to make the influence of riverine nutrient inputs more visible (0–5, 5–18, 18–30, 30–32, 32–34.5, >34.5).
In the Kattegat and the Sound, coastal areas and offshore areas are not differentiated. The spatial distribution of salinity in these sub-divisions is complex as a result of the exchange of waters between the saline North Sea and the brackish Baltic Sea and so is not suitable for distinguishing between coastal and offshore areas.
| OSPAR Region | Sub-divisions for assessment | Sub-area salinity zone |
|---|---|---|
| Greater North Sea | Northern North Sea | Offshore area: salinity >30 |
| Coastal area: salinity 18–30 | ||
| Southern North Sea | Offshore area: salinity >30 | |
| Coastal area: salinity 18–30 | ||
| Skagerrak | Offshore area: salinity >27 | |
| Coastal area: salinity 0–27 | ||
| Kattegat and Sound | No division into subregions | |
| Southern North Sea with finer salinity differentiation* | Estuaries: salinity 0-5 and 5-18 | |
| Inner coastal areas: salinity 18-30 | ||
| Outer coastal areas: salinity 30-32 and 32-34.5 | ||
| Offshore areas: salinity >34.5 |
Assessment period
For the spatial distribution of winter nutrient concentrations, the assessment of short-term trends in concentration and the assessment of concentration ratios, the assessment period is 2006–2014. For the assessment of long-term trends in concentration, the assessment period is 1990–2014.
Data sources
Data for all nutrient compounds used in the assessment have been compiled predominantly from the database of the International Council for the Exploration of the Sea (ICES), and supplemented by national data from Denmark, Germany and the Netherlands.
Data analysis
The Greater North Sea has been divided into regular squares of 3275 km2, for which mean concentrations were calculated. Time series have been divided into regular sections (annual winter seasons: January, February, November and December of the same calendar year) allowing the calculation of means and their standard deviations. The mean of a respective year is calculated from all data during the winter months of the same year (January / February and November / December). This method smooths short-time variability and data resolution and avoids the dominance of frequently sampled areas. Annual means for nutrient gradients and presentation of time series have been calculated with the same software (Surfer 10, Grapher 9, Golden Software).
For trend assessments, the Mann-Kendall non-parametric test for linear trends was used to calculate significance (as part of the R-Tool developed in OSPAR for trend assessments relating to eutrophication parameters). The Mann Kendall trend test is used to analyse data collected over time for consistently increasing or decreasing trends. Statistically significant trends are highlighted in the assessment results and are indicated by trend lines in the graphics of the results section. Due to the high variability of data, long-term data series are better suited for detecting statistically significant trends.
Data coverage
Spatial and temporal data coverage is generally adequate in the areas assessed (see confidence rating in ‘Results extended’). Limitations in the availability of annual data for 1990–2014 are apparent in the northern North Sea. Here data were particularly scarce in coastal waters (salinity 0–30) for the period 1990–2006 and in offshore waters (salinity >30) for the period 2006–2014 (Figure c). In the central North Sea, straddling the sub-divisions of the southern North Sea and the northern North Sea, data coverage is also limited (mostly only two observations per square); for some quadrants of 3275 km2 there are no DIN data available between 2006 and 2014 (Figure d). Data coverage in the Skagerrak, the Kattegat and the Sound is sufficient only at coastal sites. It is unclear whether the limited data availability in these areas is due to a lack of reporting to the ICES database or due to a lack of measurements.
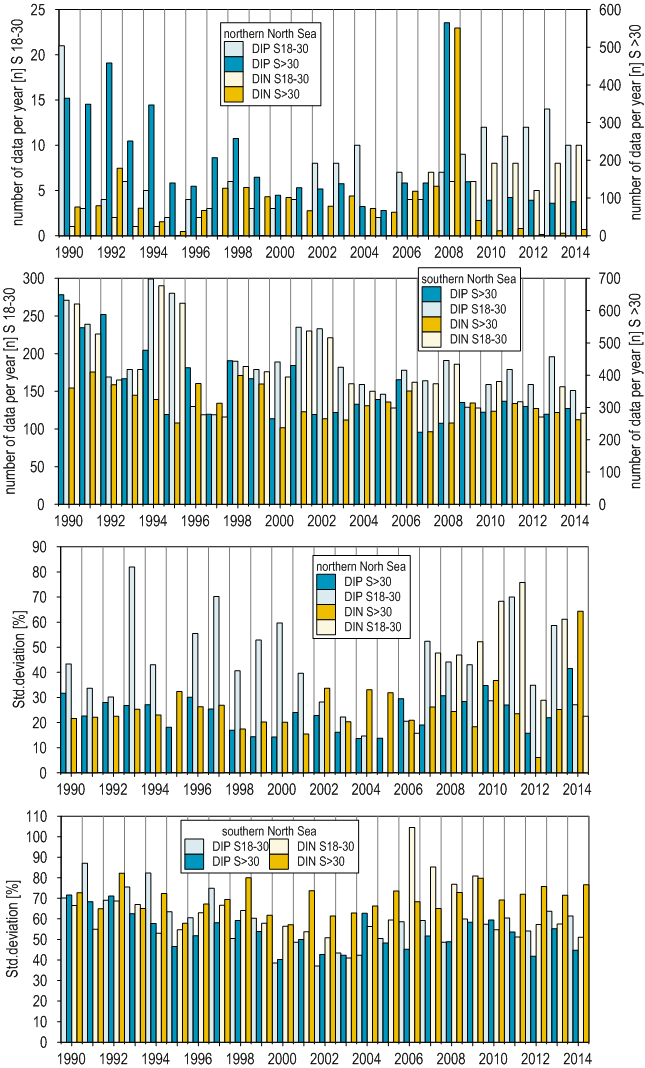
Figure c: Number of data per year and annual variability (as standard deviation in percent) of DIN and DIP between 1990 and 2014 in the northern North Sea and the southern North Sea for coastal areas (salinity 18–30) and offshore areas (salinity >30).
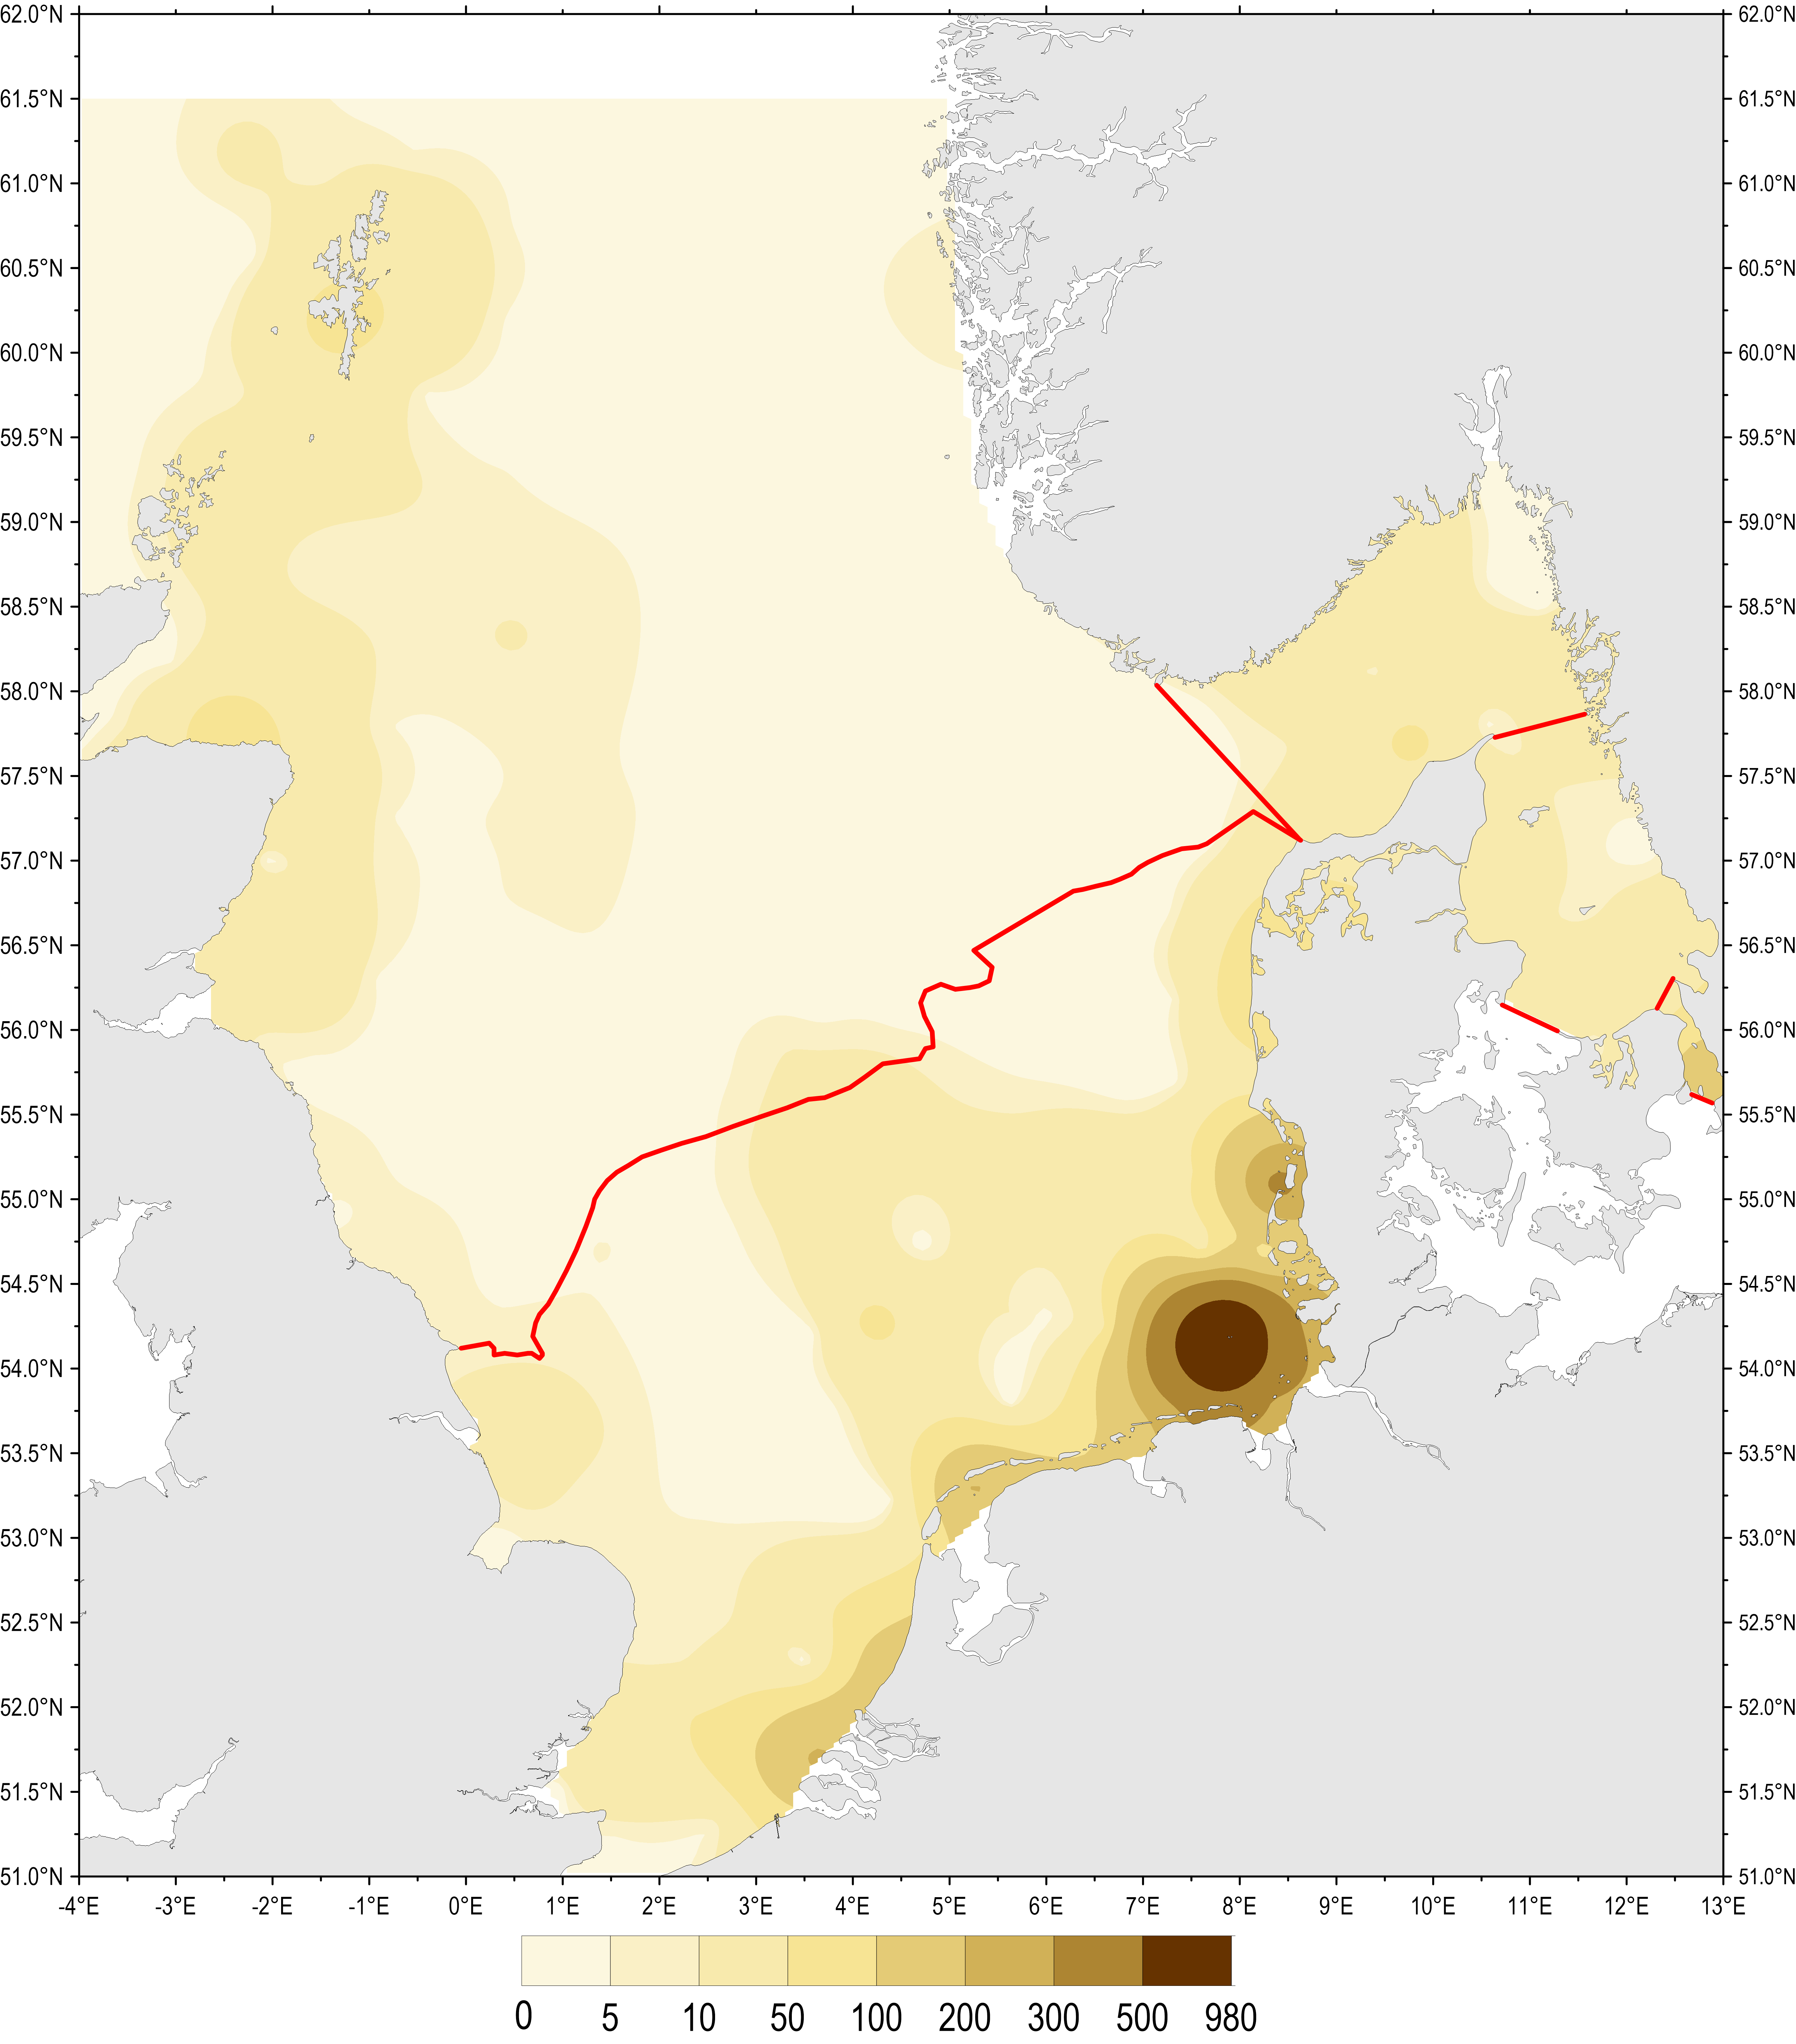
Figure d: Geographical coverage of winter DIN data by number of observations per square of 3275 km2 in the northern North Sea, the southern North Sea, the Skagerrak, the Kattegat and the Sound in the period 2006–2014.
Dealing with data gaps
For the Skagerrak, the Kattegat and the Sound, data gaps are filled by interpolation with adjacent quadrant means to achieve consistent gradients.
Data variability
Interannual variability (standard deviation) in offshore areas of the northern North Sea is generally below 40% for DIN and DIP while in the offshore southern North Sea it is below 60% for DIN and 50% for DIP (Figures e and f). Highest standard deviations are observed in frontal areas (e.g. northern tip of Denmark) or where there is strong salinity variability (the Sound, southern and eastern Kattegat; south-eastern German Bight). Fewer data in an assessment area often result in lower standard deviations compared to areas with more data. This probably indicates well-designed, risk-based monitoring programmes. Offshore areas with low variability can be sampled infrequently, while efforts are concentrated in regions where variability is greater and thus where more samples are needed to ensure confidence in the resulting assessment.
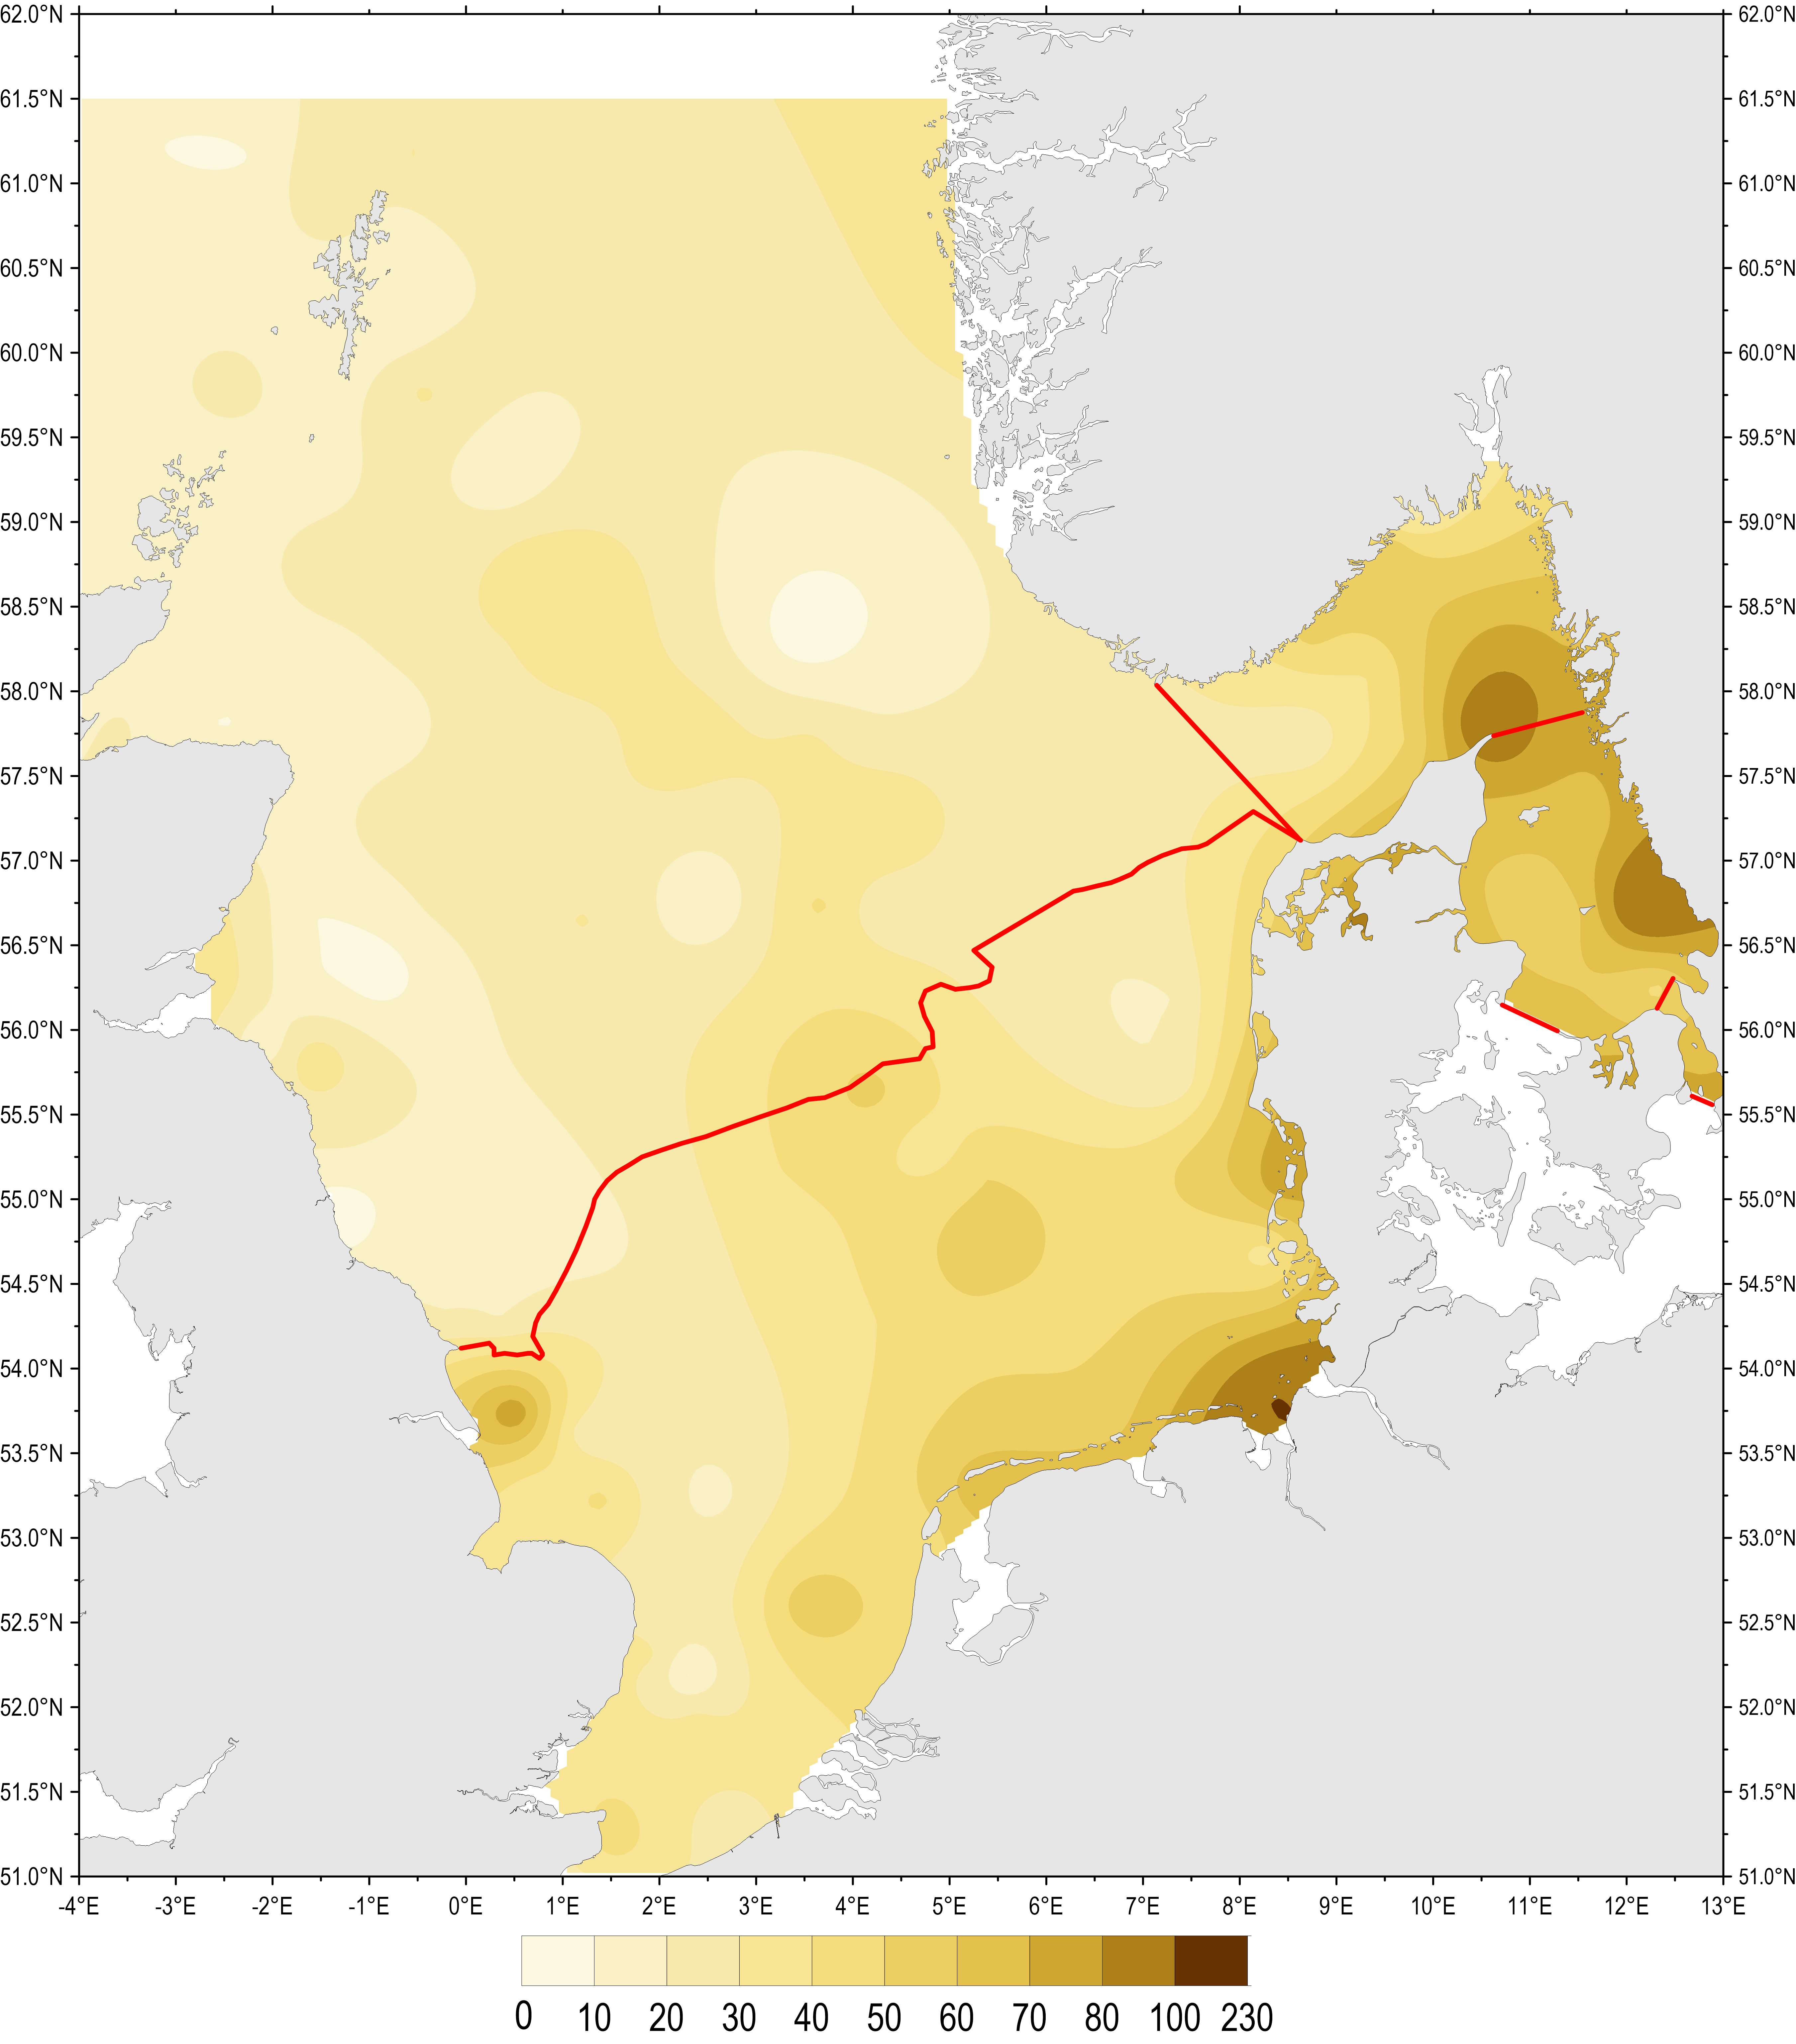
Figure e: Standard deviation of winter DIN concentrations in percent (%) in the northern North Sea, the southern North Sea, the Skagerrak, the Kattegat and the Sound in the period 2006–2014.
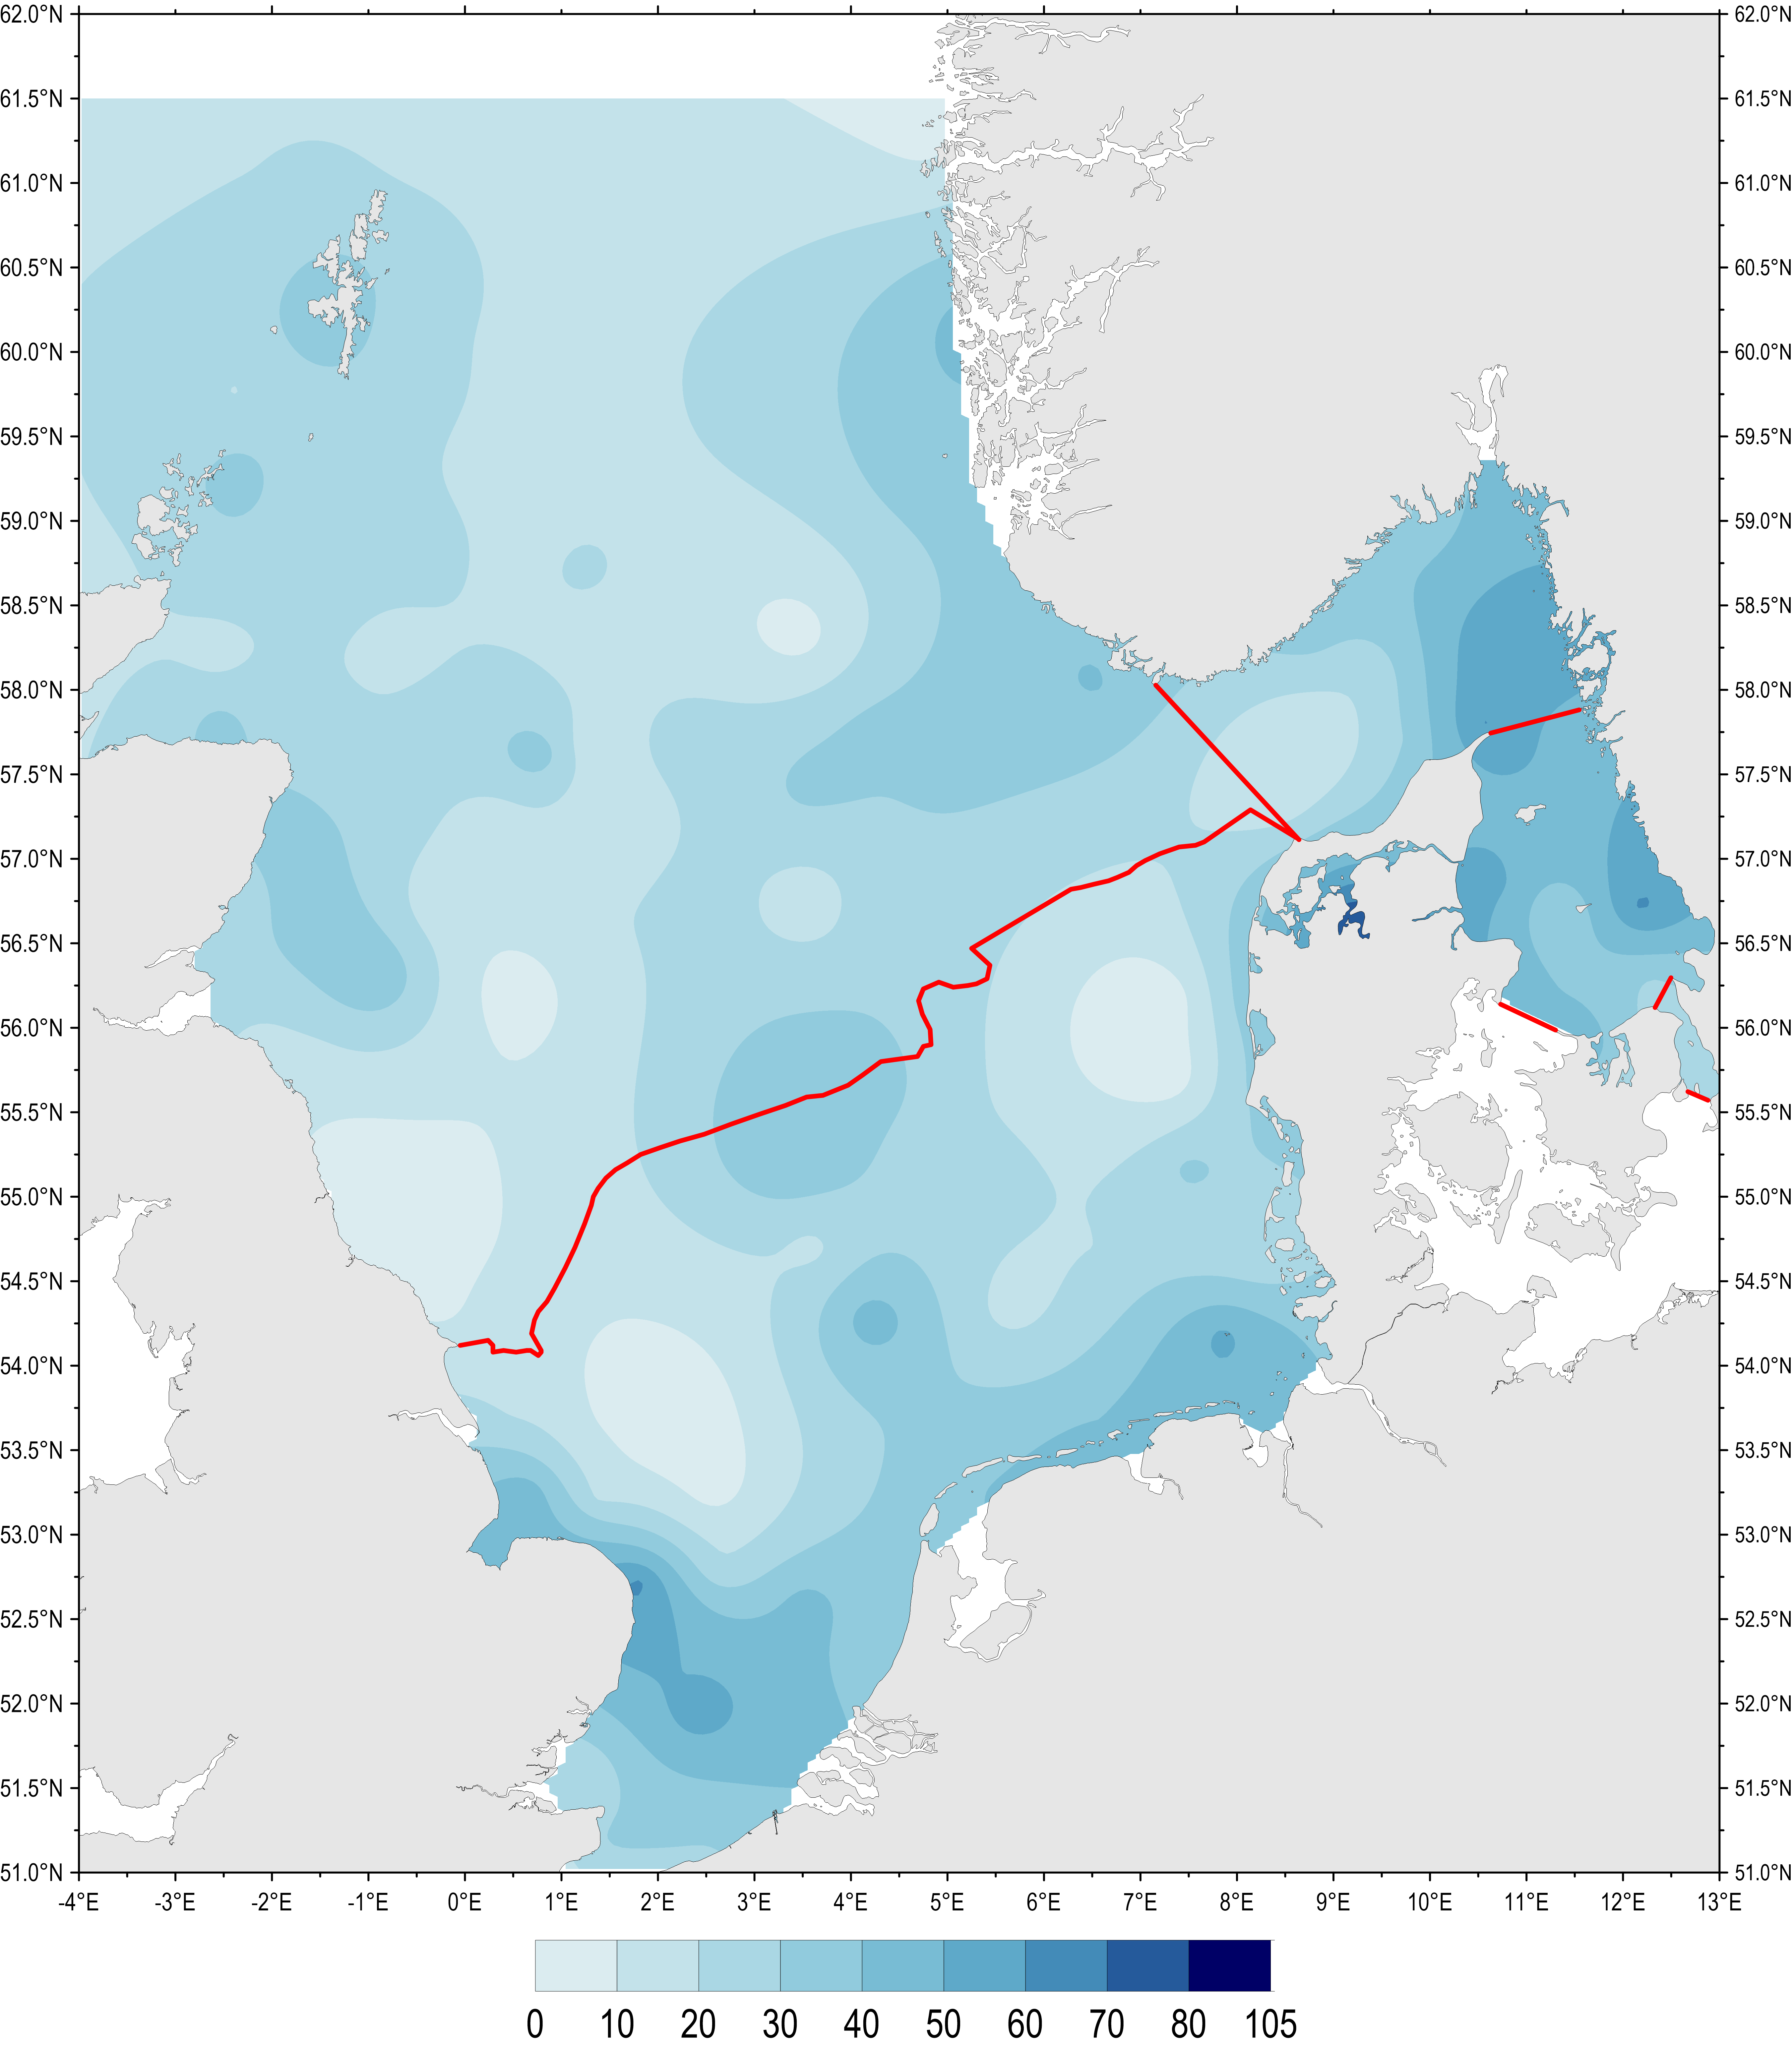
Figure f: Standard deviation of winter DIP concentrations in percent (%) in the northern North Sea, the southern North Sea, the Skagerrak, the Kattegat and the Sound in the period 2006– 2014.
Results
For the period 1990–2014, winter DIN and DIP concentrations decreased significantly in the southern North Sea and DIN concentrations decreased significantly in the Kattegat, the Sound and the offshore areas of the Skagerrak. For the shorter period 2006–2014, generally no trends could be detected, except for a limited, but significant increase in DIN concentrations in the coastal areas of the southern North Sea.
In the period 2006–2014, average offshore winter DIN concentrations in the northern North Sea are generally <8 µM except where the typically nutrient-rich inflow from the open Atlantic Ocean enters east of Shetland (Figure 1). Average winter DIN concentrations are generally <7 µM in the Sound and Kattegat, and <10 µM in the Skagerrak. The southern North Sea has the highest average DIN concentrations: exceeding 60 µM along the coasts in some eastern areas and 25 µM in some western areas. Concentrations in the central parts of the southern North Sea are 4–6 µM.
The distribution pattern for average winter DIP concentrations resembles that for DIN with highest concentrations along the southern North Sea coasts (Figure 2). Average annual winter concentrations are around 1.2 µM in coastal waters and around 0.8 µM in offshore waters of the southern North Sea. Average concentrations on the Northern North Sea coasts are mostly <0.5 µM and increase up to 0.6 µM offshore, where nutrient-rich waters flow in from the Atlantic. For the Kattegat, Skagerrak and Sound, average concentrations are mostly <0.7 µM. In the east of the Skagerrak average concentrations are around 0.1 µM.
Data coverage varied widely between years, areas and salinity bands assessed. In the southern North Sea for example, the standard deviation of both DIN and DIP was between 40% and 80% across the time series in coastal areas (salinity 18–30) and offshore areas (salinity >30).
The ratio of nitrogen to phosphorus follows the distribution pattern of DIN with the lowest ratios in the offshore areas of the southern North Sea, the eastern Skagerrak, the Kattegat and the Sound. High ratios in coastal areas, namely in the southern North Sea, may link to greater success in reducing phosphorus inputs compared to nitrogen. Ratios have mostly remained stable since 1990 with clear, decreasing trends only in the Kattegat and Skagerrak and increasing trends in estuaries of the southern North Sea.
The distribution pattern of average winter silicate concentrations is similar to winter DIN and DIP concentrations in the areas assessed. Except for an increase in silicate concentrations in the Kattegat and a decrease in the estuaries of the southern North Sea, there are no statistically significant trends in winter silicate concentrations over the period 1990–2014.
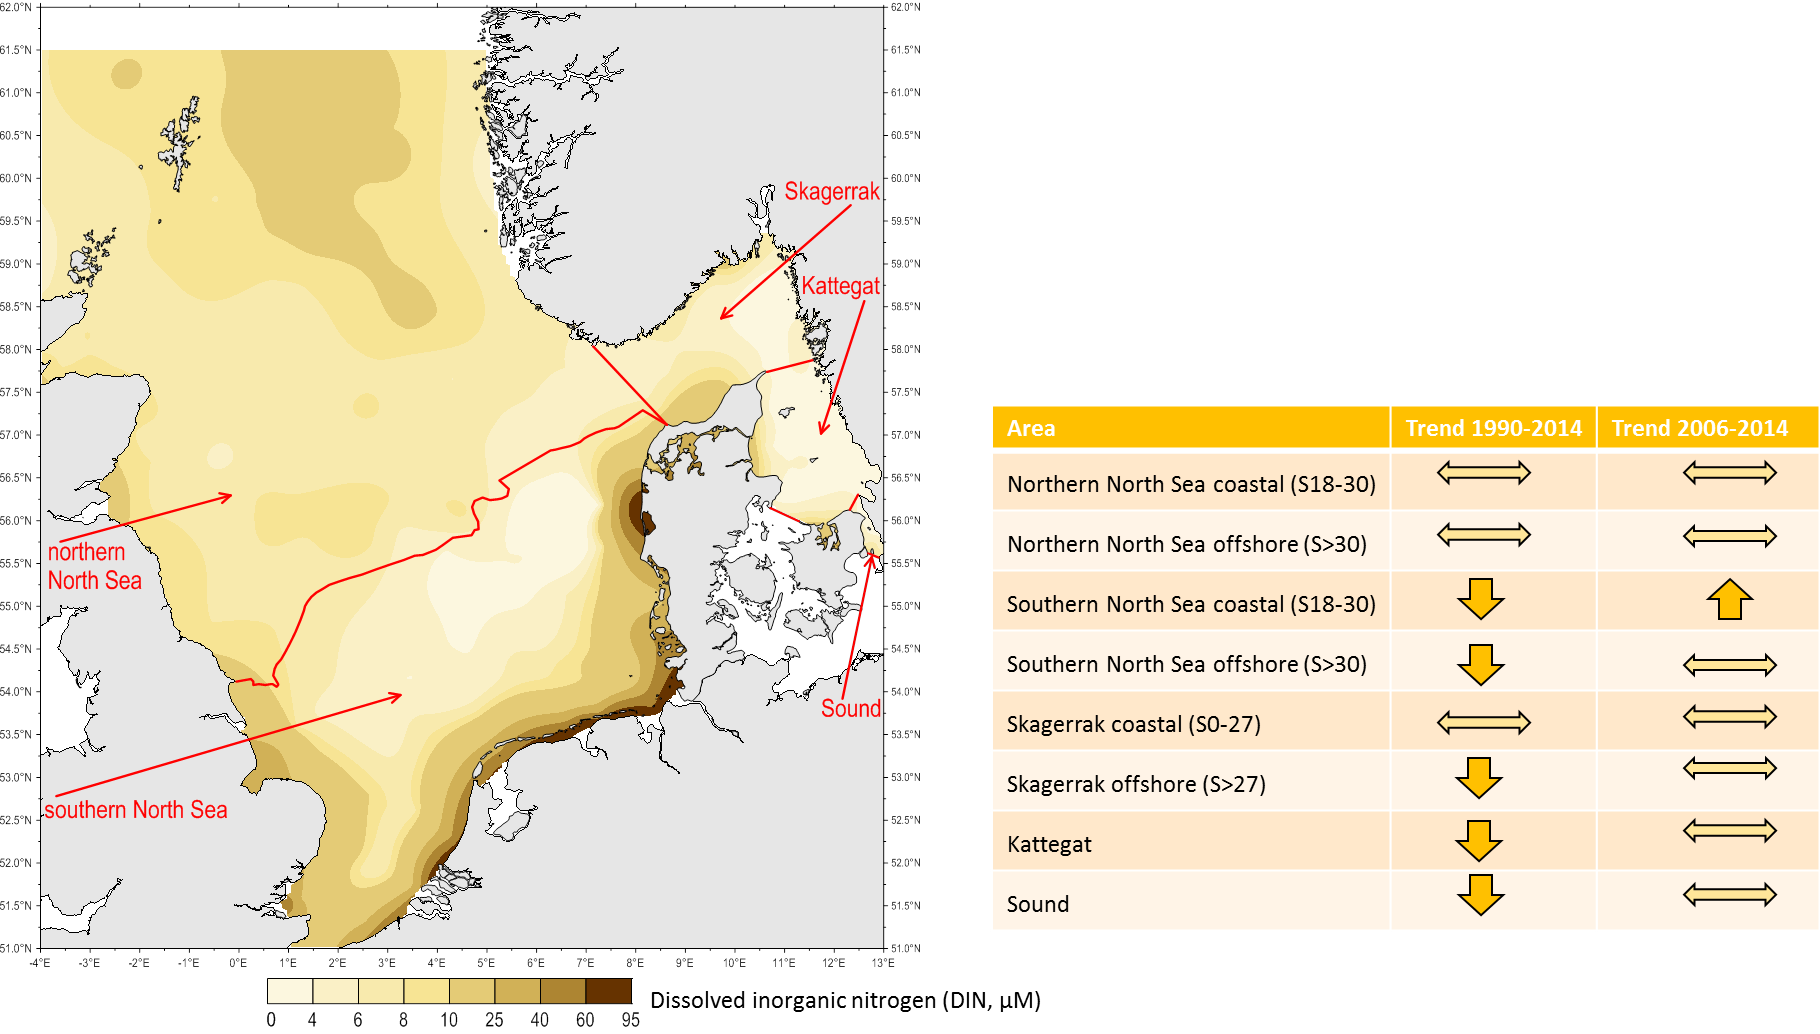
Figure 1: Distribution of average concentrations (2006–2014) of winter DIN (µM) in the northern North Sea, the southern North Sea, the Skagerrak, the Kattegat and the Sound
White areas (marine waters and estuaries) not part of this assessment, according to data availability. The accompanying table shows the results of the trend analysis for the periods 1990–2014 and 2006–2014. Downward arrows indicate a significant decreasing trend, upward arrows indicate a significant increasing trend, and horizontal arrows indicate no statistically significant trend
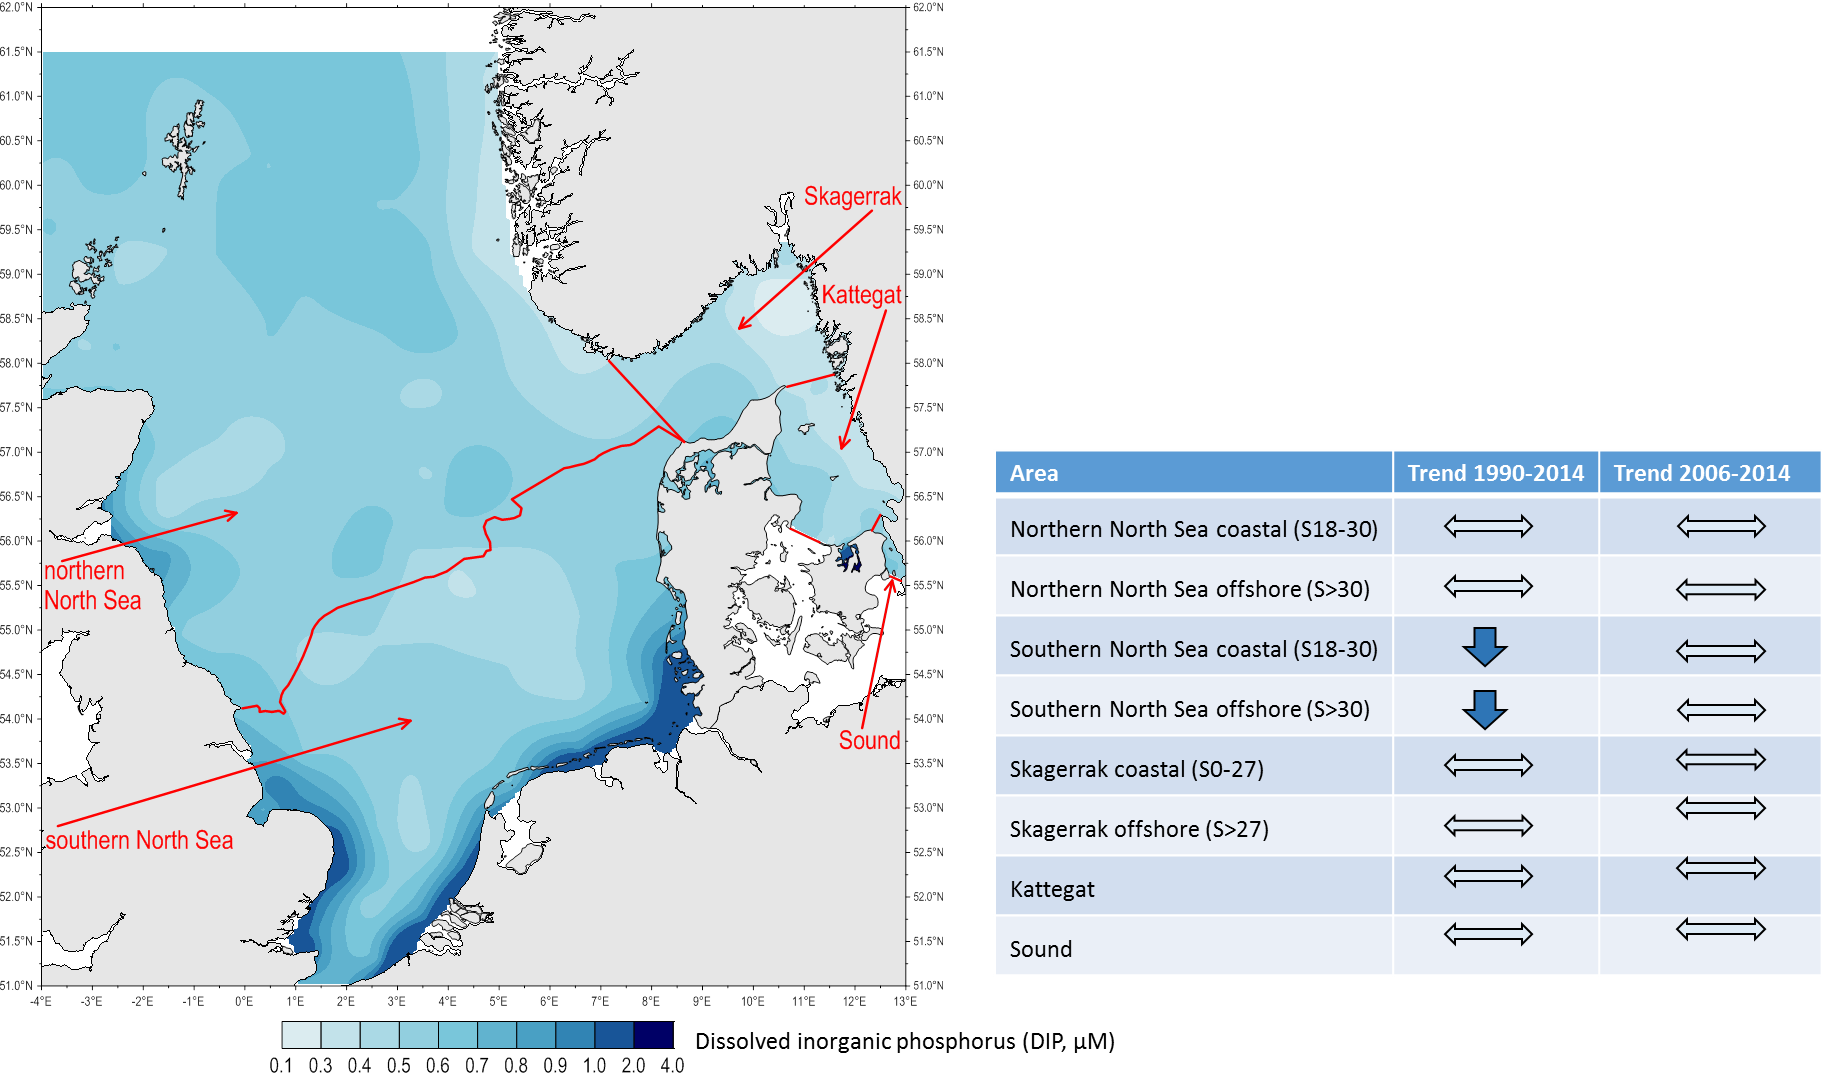
Figure 2: Distribution of average concentrations (2006–2014) of winter DIP (µM) in the northern North Sea, the southern North Sea, the Skagerrak, the Kattegat and the Sound
White areas (marine waters and estuaries) not part of this assessment, according to data availability. The accompanying table shows the results of the trend analysis for the periods 1990–2014 and 2006–2014. Downward arrows indicate a significant decreasing trend, upward arrows indicate a significant increasing trend, and horizontal arrows indicate no statistically significant trend
Linkage to sources
Nutrients such as nitrogen and phosphorus enter the marine environment from the atmosphere, via rivers and land runoff, or by direct discharges into the sea. Inputs carried into the Greater North Sea by main rivers, such as the Humber, Thames, Scheldt, Rhine, Weser and Elbe, are clearly visible in elevated DIN and DIP concentrations in coastal areas. These nutrients are transported by the residual current system (Otto et al., 1990) and form belts of nutrient-rich waters along the coasts, especially in the southern North Sea (Figure 1 and 2). Silicate concentrations are also higher along the coasts of the northern North Sea and southern North Sea and decrease towards offshore areas, indicating the influence of riverine inputs (Figure n).
Northern and southern North Sea
Winter DIN and DIP
The mean (2006–2014) winter DIN and DIP concentrations in the southern North Sea show gradients with higher concentrations at the coast which decrease towards the open sea (Figures 1 and 2). These gradients reflect the influence of riverine discharges in the coastal areas (Figure b).
DIN and DIP concentrations in the southern North Sea show statistically significant decreasing trends since 1990 in all specific salinity-ranges assessed, except for DIP in waters with salinity >34.5 (Figures h and i). In the period 2006–2014 there is a statistically significant increase in DIN concentrations in coastal waters (salinity 18–30) in the southern North Sea. Changes in DIN in offshore waters (salinity >30) and DIP in coastal and offshore waters in the period 2006–2014 reflect the variability of sampling and ecological processes, and are not statistically significant (Figure g).
In the northern North Sea there are no statistically significant trends in coastal and offshore areas for DIN or DIP, in either the long-term (since 1990; results not presented here) or the short term (2006–2014; Figure g).
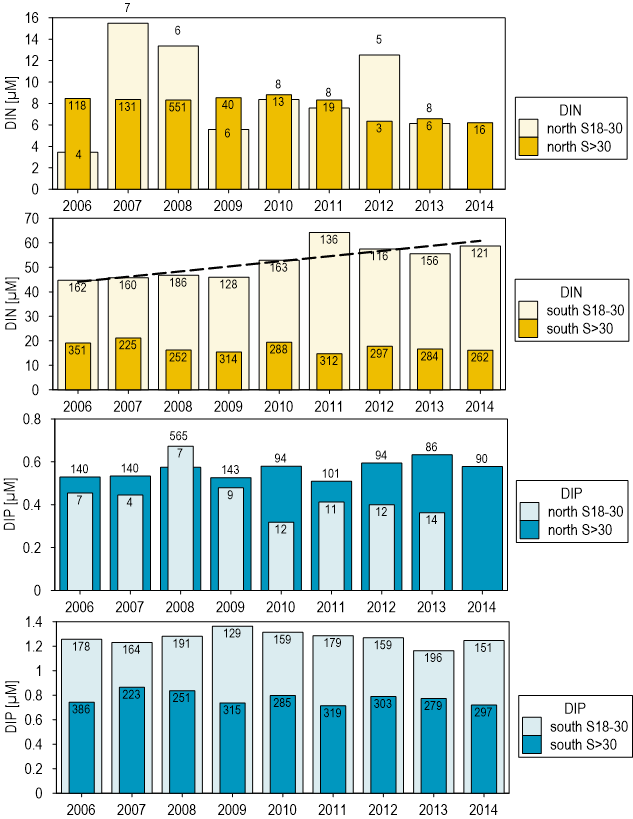
Figure g: Short-term time series (2006–2014) of winter DIN and DIP (µM) for coastal areas (salinity 18–30) and offshore areas (salinity >30) in the northern North Sea and southern North Sea.
Numbers at the top of the columns indicate the number of observations per year. There are no statistically significant trends except for increasing DIN concentrations in coastal waters (salinity 18–30) of the southern North Sea.
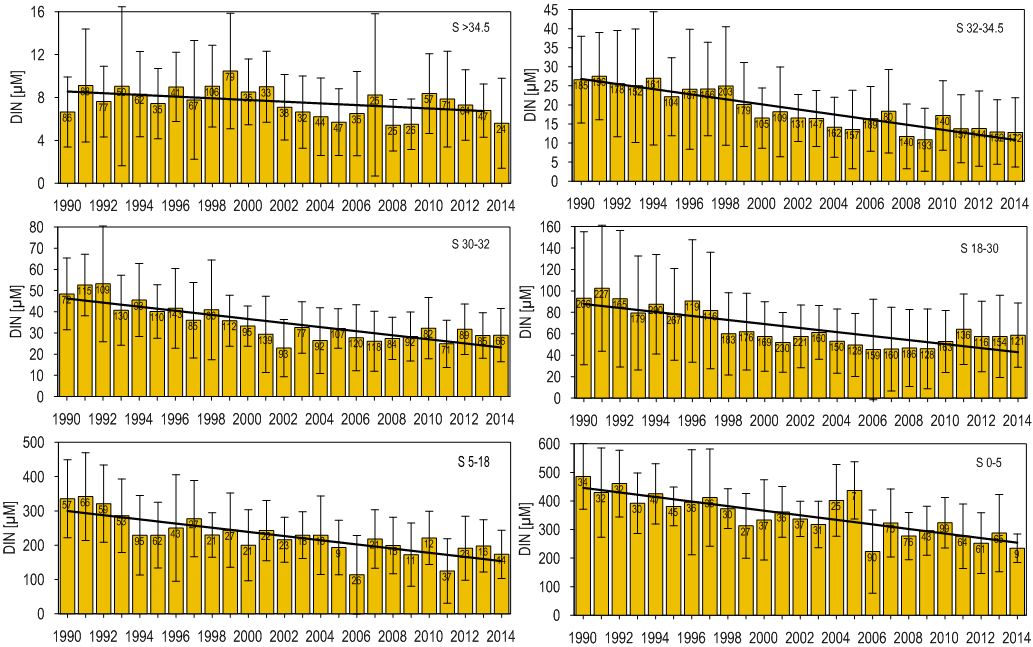
Figure h: Long-term time series (1990–2014) of winter DIN concentrations in µM in the specific salinity range areas of the southern North Sea.
Numbers at the top of the columns indicate the number of observations per year. There are statistically significant decreasing trends in all salinity-range areas.
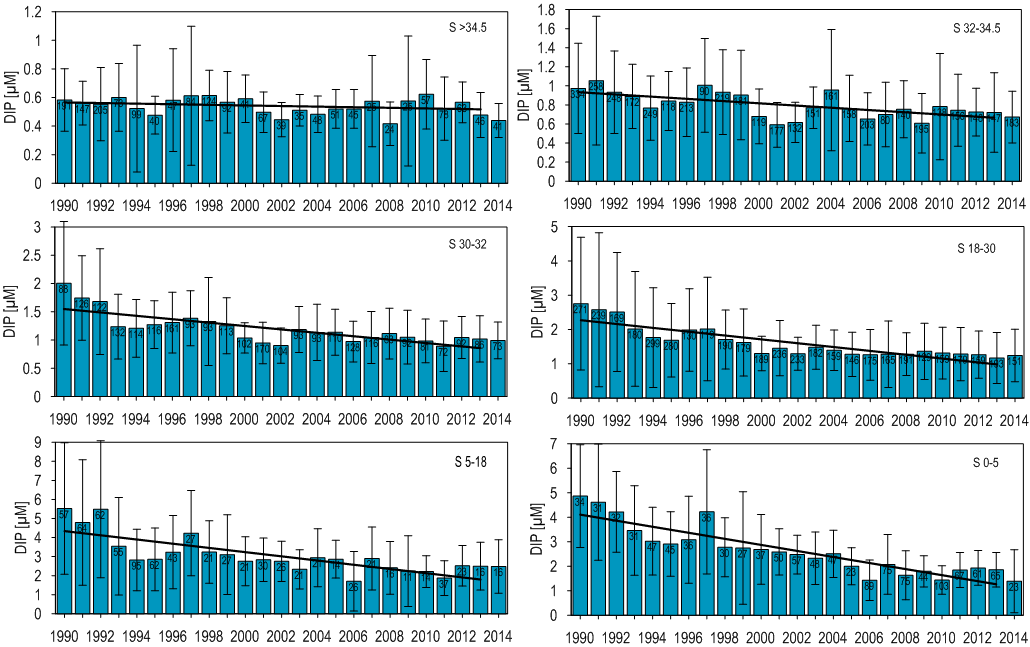
Figure i: Long-term time series (1990–2014) of winter DIP concentrations in µM in the specific salinity range areas of the southern North Sea.
Numbers at the top of the columns indicate the number of observations per year. There are statistically significant decreasing trends in all salinity-range areas except for waters with salinity >34.5 (no trend line shown).
N/P ratios
Mean (2006–2014) winter NOx/DIP ratios are around 14 in the northern North Sea and over 30 in the coastal waters of the southern North Sea (Figure j). Along the continental coast of the southern North Sea and in the estuaries of the Humber and the Thames, NOx/DIP ratios >18 have been observed. Locally, ratios exceed 70 in estuaries on the continental coast. Values around 160 are reached for example in the Ringköping fjord (west coast of Denmark) and the estuaries of the Elbe, Weser and Ems. High ratios in coastal areas may link to stronger past reductions in riverine inputs of phosphorus compared to nitrogen, as demonstrated by Burson et al. (2016).
In the northern North Sea there is no statistically significant trend in mean winter NOx/DIP ratios between 2006 and 2014 (Figure k). In coastal areas (salinity 18–30) mean winter NOx/DIP ratios have been variable since 1990 but show no statistically significant trend . Ratios have shown a slight statistically significant increase in offshore areas (salinity >30) (Figure l).
In the southern North Sea mean winter NOx/DIP ratios during 2006–2014 have been around 20 in the offshore areas (salinity >30), with no statistically significant trend (Figure K). In this period there is a statistically significant increase in coastal areas (salinity 18–30) (Figure k). There is no statistically significant trend of NOx/DIP ratios for the long-term (1990–2014) in either coastal or offshore areas (Figure l).
The assessment of the data for the specific salinity range areas of the southern North Sea resulted in a more differentiated picture (Figure m). In estuarine waters with salinities of 0–5 ratios increased significantly while there was a statistically significant decline in ratios in waters with salinities of 32–34.5 (Figure m).
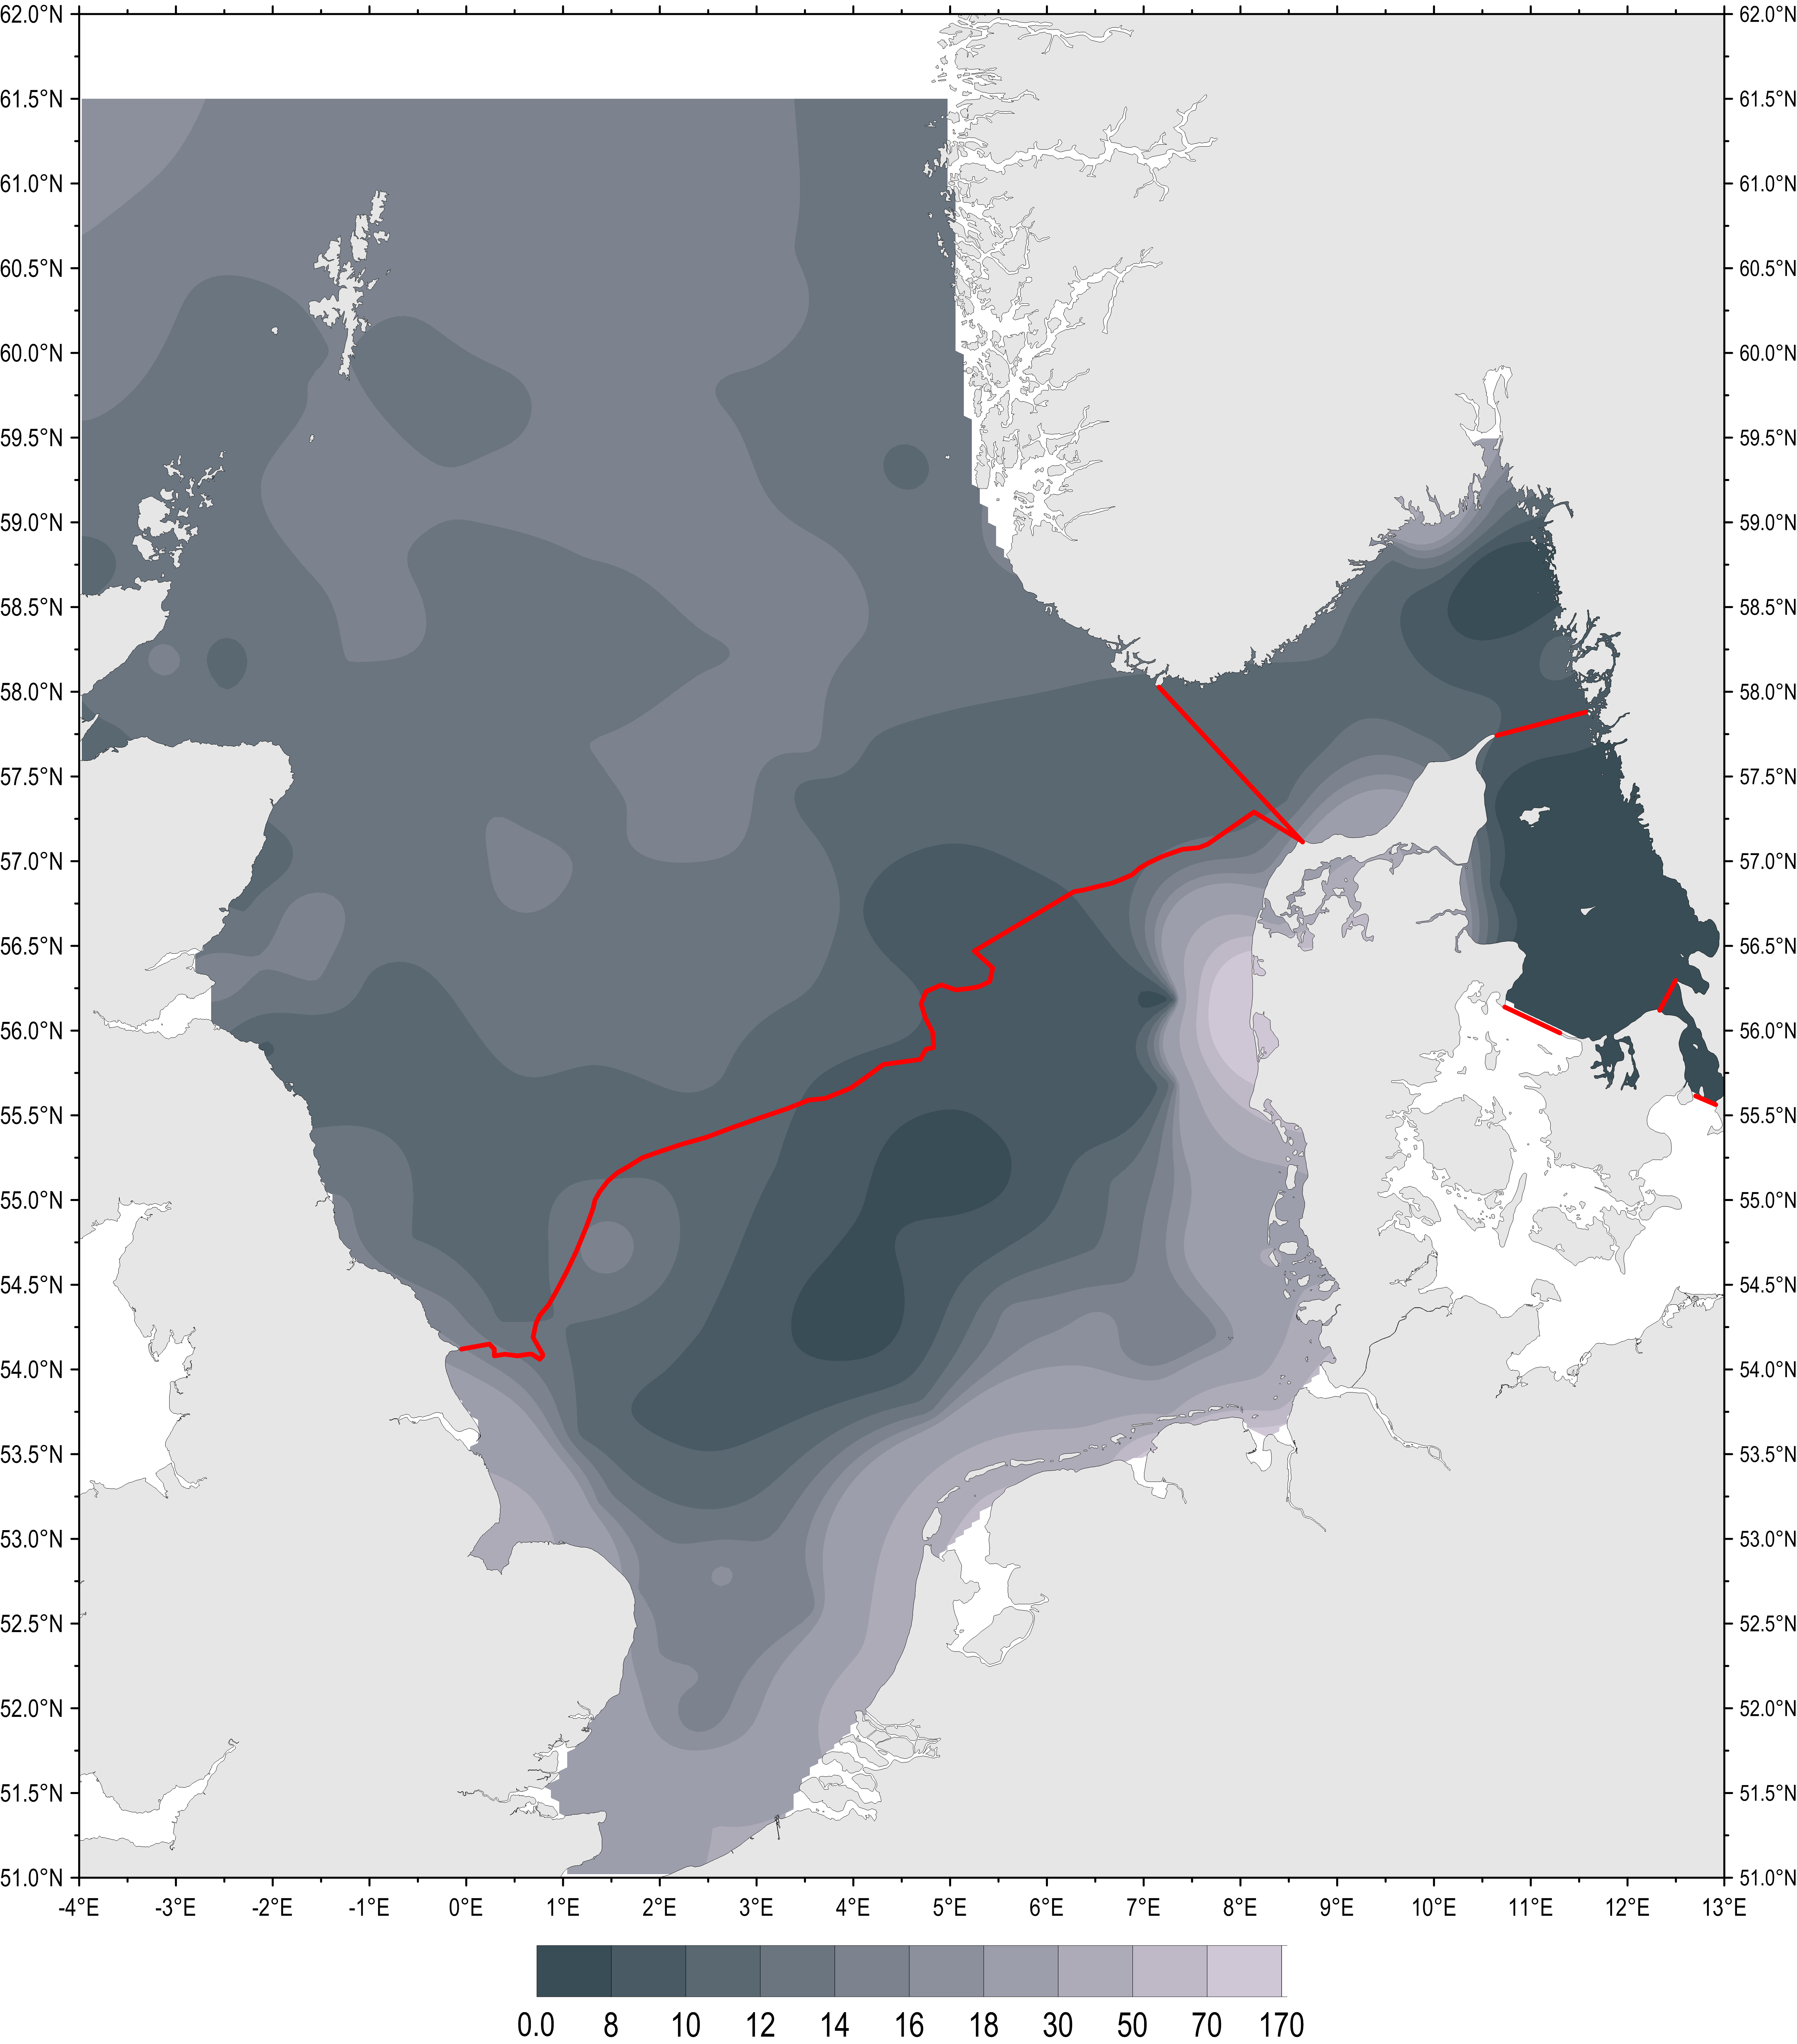
Figure j: Mean winter NOx/DIP ratios in the northern North Sea, the southern North Sea, the Skagerrak, the Kattegat and the Sound for the period 2006–2014.
The optimal N/P ratio for phytoplankton growth is 16:1 (i.e. the Redfield ratio).
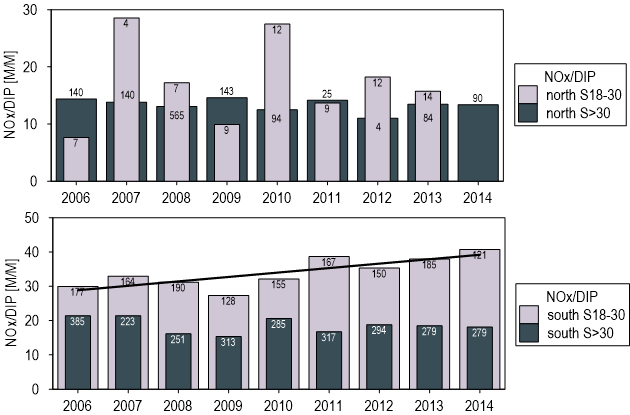
Figure k: Short-term trends of winter NOx/DIP ratios in the northern and southern North Sea coastal (S 18-30) and offshore areas (S>30) between 2006 and 2014.
Numbers at the top of the columns indicate the number of observations per year. Trends were not significant.
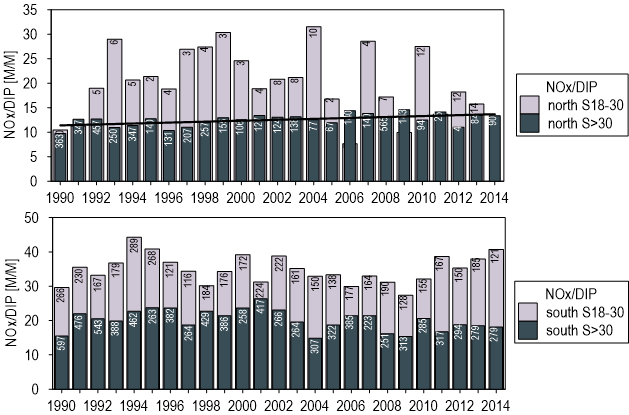
Figure l: Long-term trends (1990–2014) of winter NOx/DIP ratios in coastal areas (salinity 18–30) and offshore areas (salinity >30) of the northern North Sea and southern North Sea.
Numbers at the top of the columns indicate the number of observations per year. There is a statistically significant increase in offshore areas (salinity >30) of the northern North Sea.
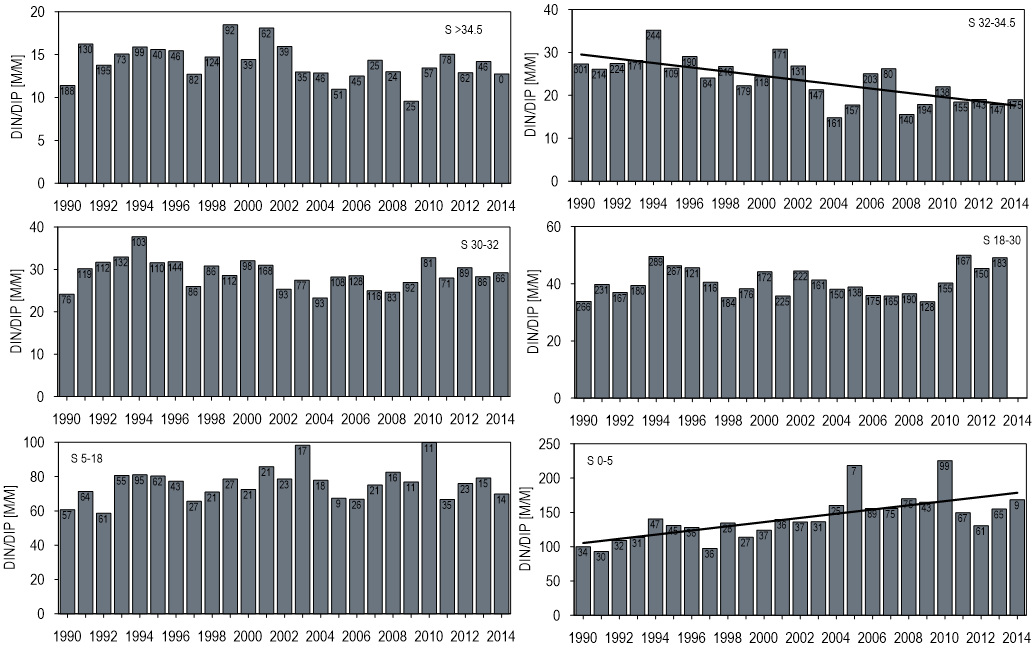
Figure m: Long-term trends (1990–2014) in winter DIN/DIP ratios in the specific salinity-range areas of the southern North Sea.
Numbers at the top of the columns indicate the number of observations per year. Trends are statistically significant in assessed areas with salinity 0–5 and salinity 32–34.5.
Winter silicate concentrations
Mean (2006–2014) winter silicate concentrations show similar gradients to winter DIN and DIP concentrations in the southern North Sea, with high levels (>40 µM) in coastal areas, which decrease towards offshore areas (<4 µM) (Figure n). Locally, concentrations exceed 80 µM in estuaries on the continental coast. In the inner Elbe estuary, for example, concentrations increase up to 185 µM. Long-term time series (1990–2014) for silicate show no statistically significant trends in coastal areas (salinity 18–30) or offshore areas (salinity >30) in the northern North Sea and southern North Sea (Figure o). Trend assessments for the specific salinity-range areas of the southern North Sea show no pronounced peaks or trends for silicate except for a statistically significant decrease in silicate concentrations in estuaries (salinity 0–5) (Figure p).
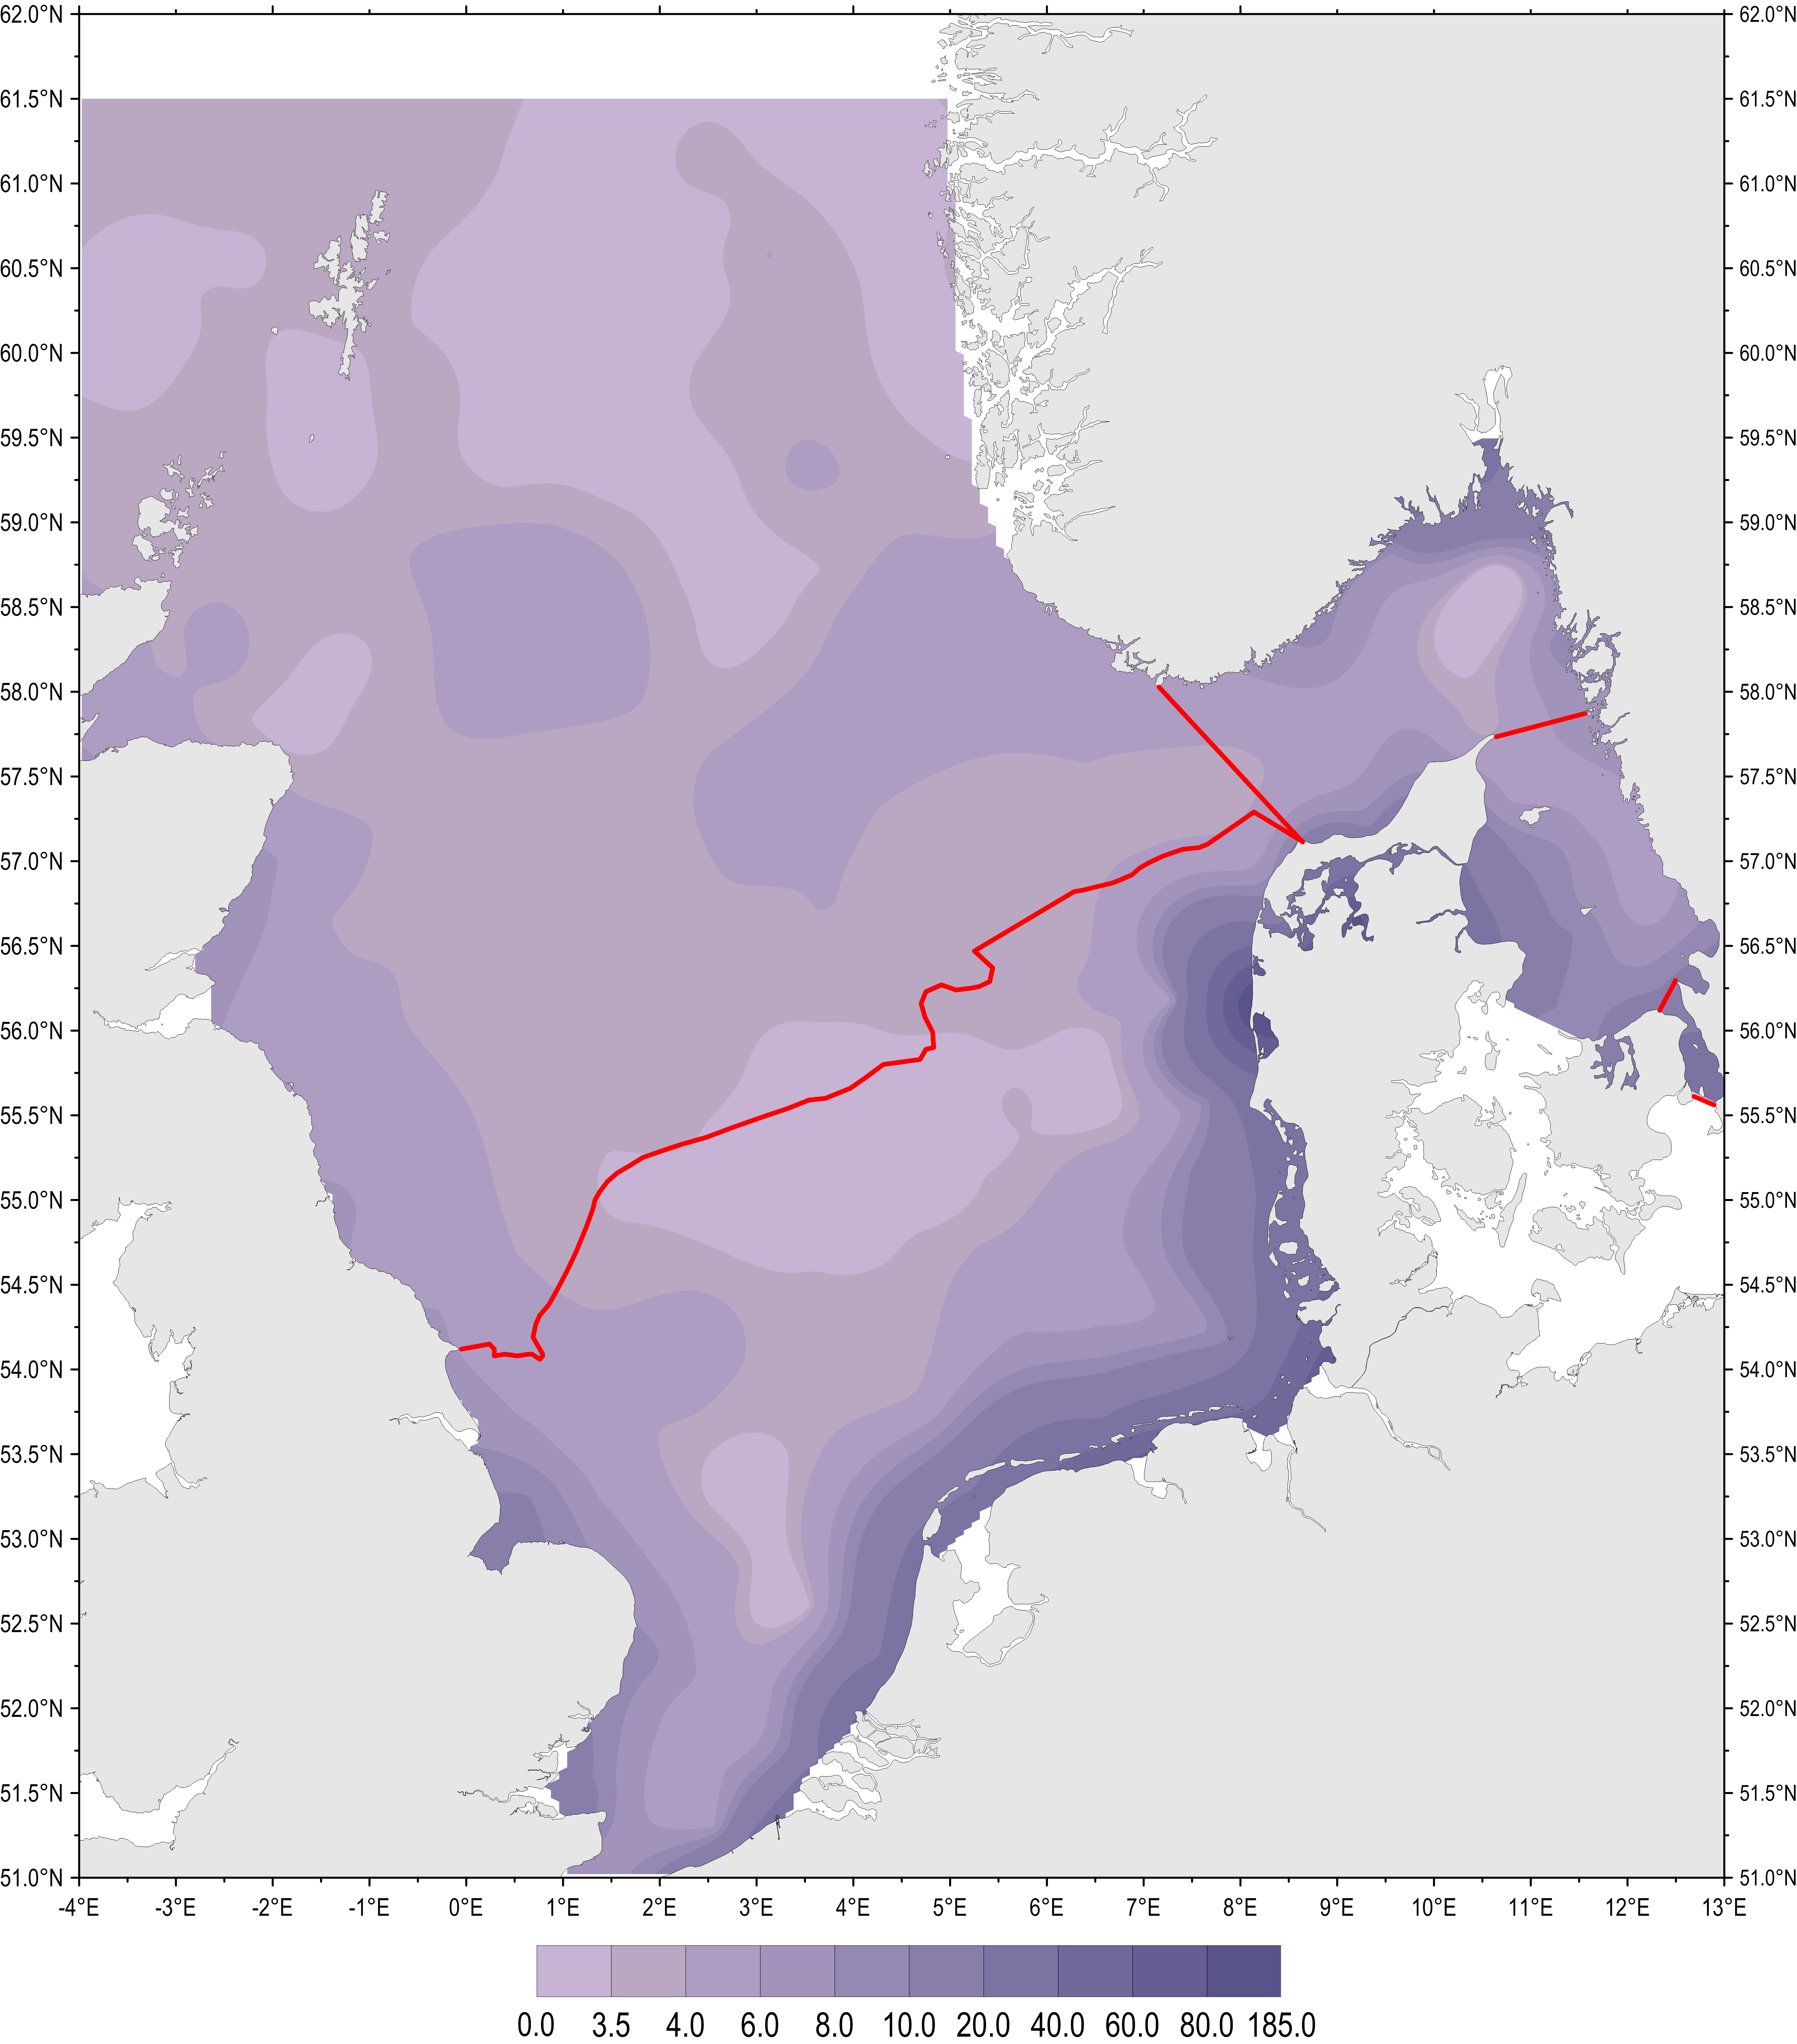
Figure n: Distribution of mean winter concentrations (2006–2014) of silicate in µM of the northern North Sea, the southern North Sea, the Skagerrak, the Kattegat and the Sound.
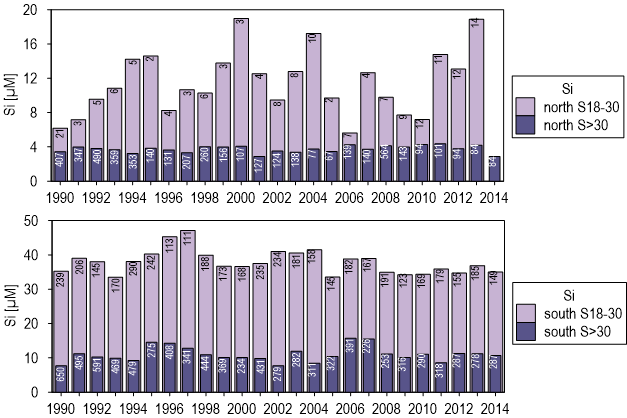
Figure o: Long-term time series (1990–2014) of winter silicate concentrations in µM in coastal areas (salinity 18–30) and offshore areas (salinity >30) of the northern North Sea and southern North Sea.
Numbers at the top of the columns indicate the number of observations per year. There are no statistically significant trends.
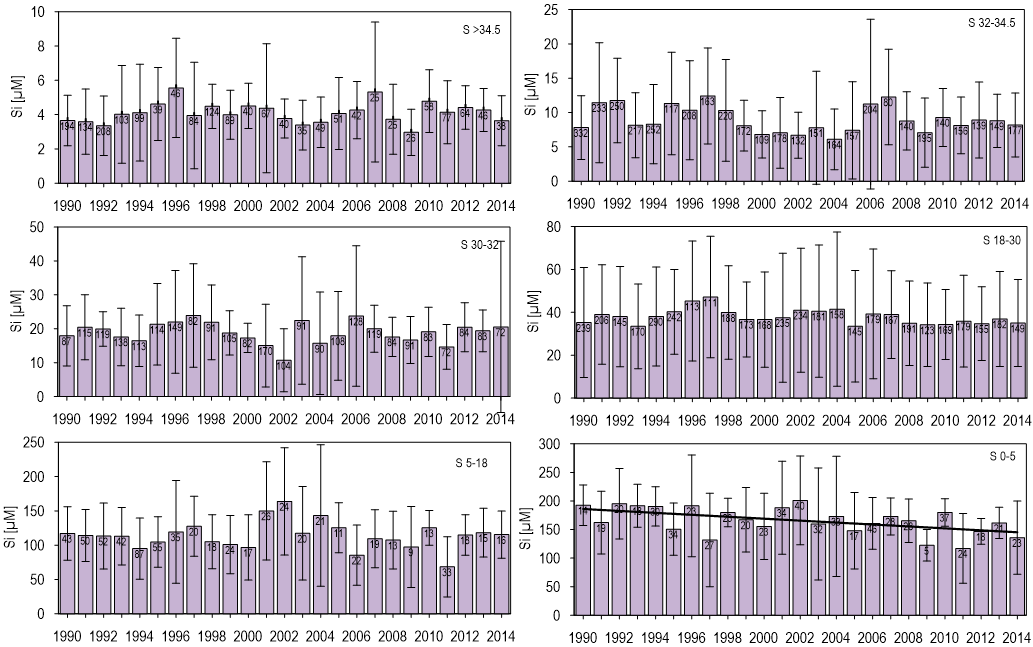
Figure p: Long-term time series (1990–2014) of winter silicate concentrations in µM in the specific salinity range areas of the southern North Sea.
. Numbers at the top of the columns indicate the number of observations per year. There are no statistically significant trends except for a decreasing trend in estuaries with salinity 0–5.
Kattegat, Skagerrak and the Sound
Winter DIN and DIP concentrations
Long-term time series (1990–2014) of DIN concentrations show a statistically significant decrease in offshore areas (salinity >27) of the Skagerrak, in the Kattegat and in the Sound (Figure q). For DIN concentrations in coastal areas (salinity 0–27) of the Skagerrak no trend was observed. There are no statistically significant trends in DIP concentrations in the Skagerrak, the Kattegat, and the Sound for the period since 1990 (Figure r).
Short-term time series of DIN (Figure s) and DIP (Figure t) concentrations showed no statistically significant trends in the Skagerrak for the period 2006–2014 and in the Kattegat and the Sound for the period 2006–2013.
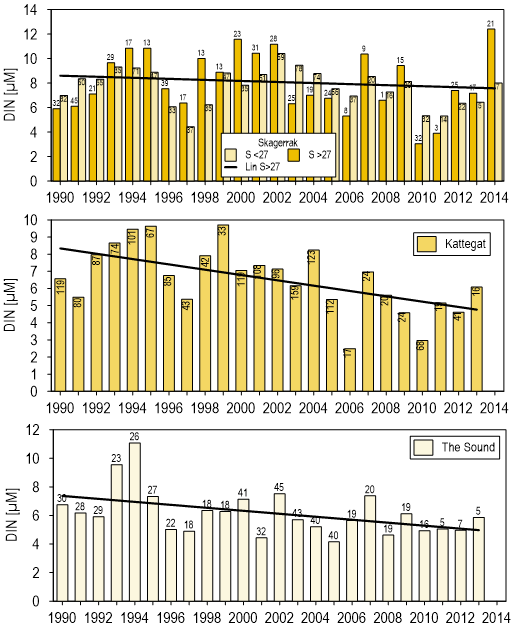
Figure q: Long-term time series (1990–2014) of winter DIN concentrations in µM in the coastal areas (salinity 0–27) and offshore areas (salinity >27) of the Skagerrak, in the Kattegat and in the Sound.
Numbers at the top of the columns indicate the number of observations per year. There is a statistically significant decrease in winter DIN concentrations in the offshore areas (salinity >27) of the Skagerrak, in the Kattegat and in the Sound. For the Kattegat and the Sound no data were available for 2014.
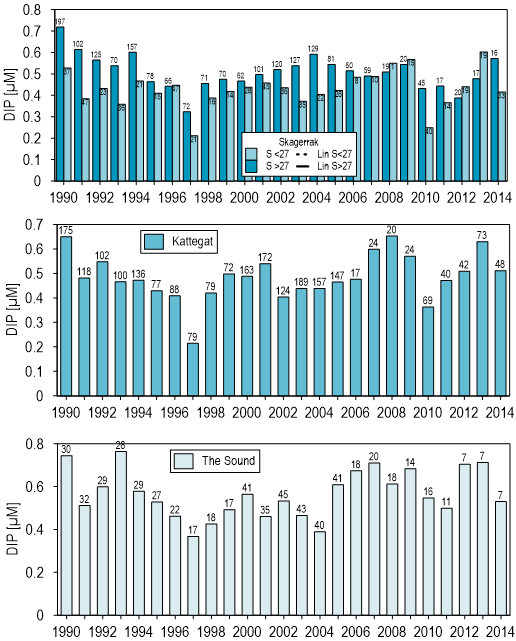
Long-term time series (1990–2014) of winter DIP concentrations in µM in the coastal areas (salinity 0–27) and offshore areas (salinity >27) of the Skagerrak, in the Kattegat and in the Sound.
Numbers at the top of the columns indicate the number of observations per year. There are no statistically significant trends.
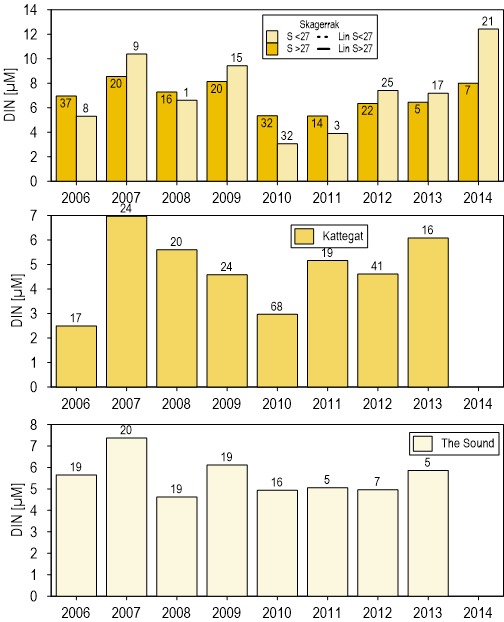
Figure s: Short-term time series (2006–2014) of winter DIN in µM in the coastal areas (salinity 0–27) and offshore areas (salinity >27) of the Skagerrak, in the Kattegat and in the Sound.
Numbers above the columns indicate the number of observations per year. For the Kattegat and the Sound no data were available for 2014. There are no statistically significant trends.
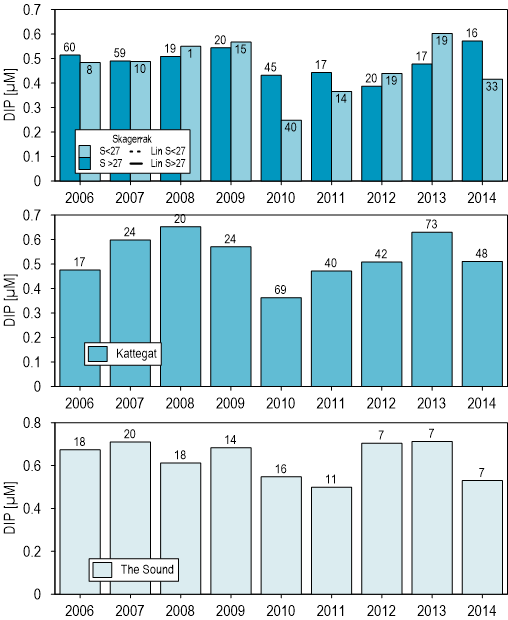
Figure t: Short-term time series (2006–2014) of winter DIP concentrations in µM in the coastal areas (salinity 0–27) and offshore areas (salinity >27) of the Skagerrak, in the Kattegat and in the Sound.
Numbers above the columns indicate the number of observations per year. There are no statistically significant trends.
N/P ratios
NOx/DIP ratios are mostly around 6 to 12 in the Skagerrak, the Kattegat and the Sound except for high ratios near the Danish coast and the northern part of the Skagerrak (>50) and on the Danish-Kattegat coast (>30) and the north Danish coast and the northern part of the Skagerrak (>50) (Figure j). Long-term time series (1990–2014) of NOx/DIP ratios show no statistically significant trends for the Skagerrak (Figure u). NOx/DIP ratios in the Kattegat and the Sound show a pronounced decline after 1994 and a statistically significant decrease for the period 1990–2013 (Figure u). The short-term time series (2006–2014) of NOx/DIP ratios show no significant trends (Figure v).
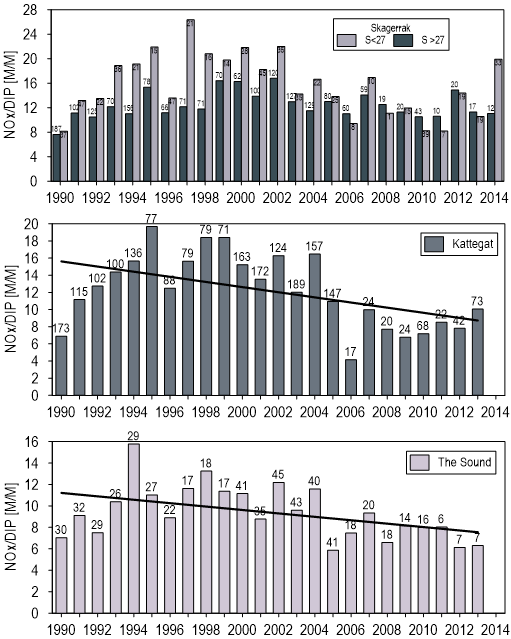
Figure u: Long-term time series (1990–2014) of winter NOx/DIP ratios (M/M, molar ratio) in the coastal areas (salinity 0–27) and offshore areas (salinity >27) of the Skagerrak, in the Kattegat and in the Sound.
Numbers above the columns indicate the number of observations per year. For the Kattegat and the Sound no NOx data were available for 2014. There are statistically significant decreases in winter NOx/DIP ratios in the Kattegat and the Sound.
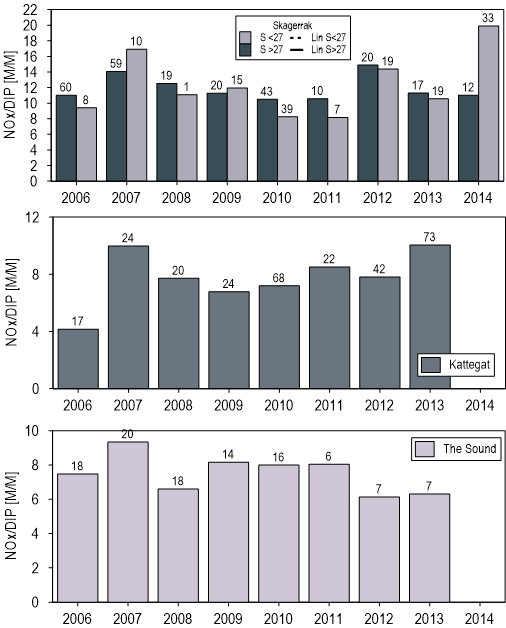
Figure v: Short-term time series (2006–2014) of winter NOx/DIP ratios (M/M, molar ratio) in the coastal areas (salinity 0–27) and offshore areas (salinity >27) of the Skagerrak, in the Kattegat and in the Sound.
Numbers above the columns indicate the number of observations per year. For the Kattegat and the Sound no NOx data were available for 2014. There are no statistically significant trends.
Winter silicate concentrations
Mean (2006–2014) winter silicate concentrations show similar patterns in the northern North Sea and southern North Sea. High concentrations (>10 µM) are observed in coastal areas (salinity 0–27) of the Skagerrak and in the Kattegat. Concentrations are lower in the offshore areas (salinity >27) of the Skagerrak (around 4 µM) (Figure n). Concentrations at the Danish Kattegat coast were much higher than for the Swedish coast; gradients were similar to those for DIN and DIP since silicate is also discharged by rivers. There were no statistically significant long-term trends (1990–2014) in silicate concentrations in the Skagerrak and the Sound (Figure w). In the Kattegat, a statistically significant increase in silicate was observed over the period 1990–2014. Short-term time series (2006–2014) did not show any significant trends (Figure x).
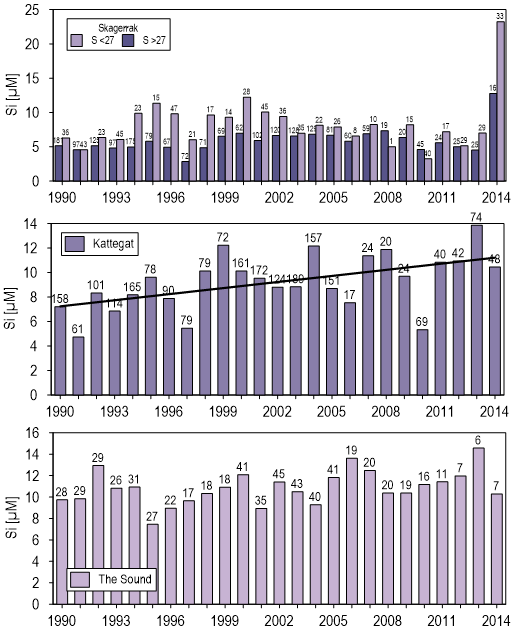
Figure w: Long-term time series (1990–2014) of winter silicate concentrations in µM in the coastal areas (salinity 0–27) and offshore areas (salinity >27) of the Skagerrak, in the Kattegat and in the Sound.
Numbers above the columns indicate the number of observations per year. There is a statistically significant increase in silicate concentrations in the Kattegat.
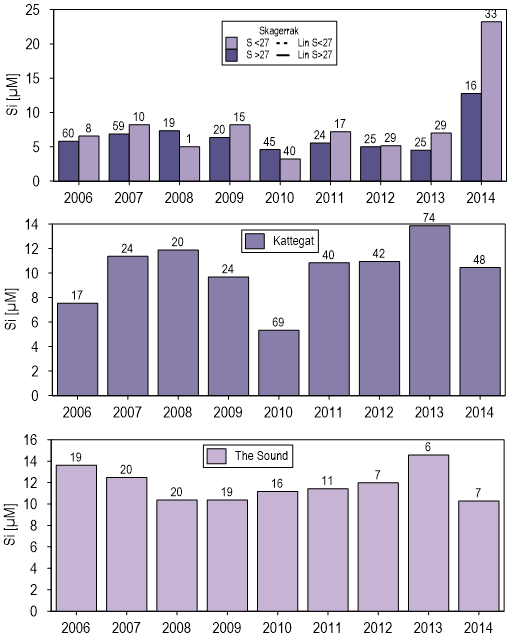
Figure x: Short-term time series (2006–2014) of winter silicate concentrations in µM in the coastal areas (salinity 0–27) and offshore areas (salinity >27) of the Skagerrak, in the Kattegat and in the Sound.
Numbers above the columns indicate the number of observations per year. There are no statistically significant trends.
Confidence rating
There is generally high confidence in the data, with mostly adequate spatial and temporal coverage of the data in the areas assessed, although some inadequacies remain. There are differences between assessed areas in the Greater North Sea. Data availability is high along the coasts of the areas assessed except along the Norwegian coast. There were fewer data available for the offshore waters of the southern North Sea. Spatial data coverage in the Skagerrak and the Kattegat was more scattered but broadly similar to North Sea coastal waters with 10–50 observations per square, for the period 2006–2014. In the Sound mainly one station was sampled. In the continental coastal areas (salinity 0–30), where data coverage is best, the standard deviation reaches 50–80% for DIN and DIP (Figures e and f). The standard deviation in the Skagerrak, the Kattegat and in coastal waters of the southern United Kingdom coast is also at 50–80%.
Compared to other OSPAR data series, data coverage for nutrient concentrations justifies the classification of confidence as ‘high’ for the purposes of the Intermediate Assessment 2017.
There is high confidence in the assessment methodology. The determination of winter nutrient concentrations has been used for many years in the OSPAR Common Procedure as well as in other assessments (such as the EU Water Framework Directive 2000/60/EC).
Conclusion
Nutrient concentrations in coastal waters are higher than in offshore areas. Concentrations in estuaries and coastal areas in the southern North Sea relate to riverine inputs, which link to human activities such as agriculture, combustion processes and municipal and industrial waste water treatment. The influence of atmospheric nitrogen deposition on the Greater North Sea is not visible due to its more even spatial distribution.
Coastal nutrient concentrations in the southern North Sea and, for dissolved inorganic nitrogen (DIN) only, in offshore areas of the Skagerrak, and in the Kattegat and Sound have declined significantly since 1990. There were generally no statistically significant trends in the areas assessed over the short term (2006–2014); with the exception of a limited but increasing trend in the southern North Sea coastal waters (salinity 18–30). The lack of short term trends may be due to the minor changes in nutrient inputs (especially nitrogen) in the past decade (nutrient inputs indicator assessment) or to variability in the data.
Given that eutrophication is still evident in certain areas (chlorophyll-a, Phaeocystis and oxygen indicator assessments) “a healthy marine environment where anthropogenic eutrophication does not occur” has not yet been achieved (Common Procedure integrated eutrophication report).
The ratio of nitrogen and phosphorus follows the distribution pattern of dissolved inorganic nitrogen (DIN) with lowest ratios in the offshore areas of the southern North Sea, the eastern Skagerrak, the Kattegat and the Sound. Ratios have remained similar since 1990 with clear trends only in the Kattegat and Skagerrak (decreasing) and in estuaries of the southern North Sea (increasing).
The distribution pattern of average winter silicate concentrations is similar to winter DIN and dissolved inorganic phosphorus (DIP) concentrations in all areas assessed. Except for an increase in silicate concentrations in the Kattegat and a decrease in estuaries of the southern North Sea, there are no statistically significant trends in the period 1990–2014.
Knowledge Gaps
To obtain an assessment that is not only based on trends but also on the actual status of nutrient concentrations, regionally harmonised assessment values are required in all areas. These could be achieved by applying a common approach. For example, based on historical data, and modelling based on hind-casting in selected areas such as the Greater North Sea. Better informed models are required to estimate long-distance transports of nutrients and their regional effects. There is also a need to better understand the implications of data variability in trend assessment.
To improve the robustness of future time series assessments, data gaps in the International Council for the Exploration of the Sea (ICES) database should be filled. To foster representative data distribution in time and space, monitoring of nutrient concentrations should be increased, especially in or near eutrophication problem areas.
To make the indicator more meaningful and robust, consideration should be given to generating complementary information that links nutrient concentrations in seawater with nutrient sources, pathways and cycling. Among others, such links would better inform the development of measures to reduce nutrient inputs. This includes consideration of:
- the relevance of atmospheric nitrogen deposition to concentrations in seawater;
- long-distance marine transport of nutrients and associated fluxes between assessment areas;
- total nitrogen and phosphorus, reflecting the full pool of nutrients within ecosystems; and
- links with climate change.
Blauw, A., K. van de Wolshaar & H. Meuwese (2006): Transboundary nutrient transports in the North Sea. RIKZ report,1-74
Bristow, L.A., T.D. Jickells, K. Weston, A. Marca-Bell, R. Parker, J.E. Andrews (2013): Tracing estuarine organic matter sources into the southern North Sea using C and N isotopic signatures. Biogeochemistry 113, 9-22
Burson, A., M. Stomp, L.Akil, C.P.D. Brussard, J. Huisman (2016): Unbalanced reduction of nutrients has created an offshore gradient from phosphorus to nitrogen limitation in the North Sea. Limn.Oceanogr. 2016, doi 10: 1002, Ino 10257, 20pp.
ECJ 2009. European Court of Justice Judgment of the Court (Third Chamber) of 10 December 2009. European Commission v United Kingdom of Great Britain and Northern Ireland. Failure of a Member State to fulfil obligations – Environment – Directive 91/271/EEC – Urban waste water treatment - Article 3(1) and (2), Article 5(1) to (3) and (5) and Annexes I and II – Initial failure to identify sensitive areas – Concept of ‘eutrophication’ – Criteria – Burden of proof – Relevant date when considering the evidence – Implementation of collection obligations – Implementation of more stringent treatment of discharges into sensitive areas. Case C-390/07 European Court Reports 2009 I-00214
OSPAR Agreement 2010-3. The North-East Atlantic Environment Strategy. Strategy of the OSPAR Commission for the Protection of the Marine Environment of the North-East Atlantic 2010–2020
OSPAR Agreement 2013-8. Common Procedure for the Identification of the Eutrophication Status of the OSPAR Maritime Area. Supersedes Agreements 1997-11, 2002-20 and 2005-3
Otto, L., Zimmerman, J. T. F., Furnes, G. K., Mork, M., Saetre, R., and Becker, G. (1990), Review of the physical oceanography of the North Sea. Netherlands Journal of Sea Research, 26: 161–238
Weston, K., T.D. Jickells, L. Fernand, E.R. Parker (2004): Nitrogen cycling in the southern North Sea: consequences for total nitrogen transport. Est.Coast.Shelf Sc.59, 559-573
| Sheet reference | BDC17/D104 |
|---|---|
| Assessment type | Intermediate Assessment |
| Context (1) | Eutrophication |
| Context (2) | OSPAR Publication 2003-189 OSPAR integrated report 2003 on the eutrophication status of the OSPAR maritime area based upon the first application of the Comprehensive Procedure; |
| Context (3) | D5 - Eutrophication |
| Context (4) | D5.1 - Nutrients levels |
| Point of contact | Wera Leujak, German Environment Agency |
secretariat@ospar.org | |
| Metadata date | 2017-09-15 |
| Title | Winter Nutrient Concentrations in the Greater North Sea, Kattegat and Skagerrak |
| Resource abstract | Common indicator winter nutrient concentrations in the Greater North Sea, Kattegat and Skagerrak |
| Linkage | https://www.ospar.org/documents?v=6962 |
| Topic category | Environment |
| Indirect spatial reference | L2.2.1;L2.2.3;L2.2.8;L2.2.5;L2.2.7;L2.2.4 |
| N Lat | 62.0000010210304 |
| E Lon | 13.0665752428532 |
| S Lat | 51.0898943348557 |
| W Lon | -4.99999999980008 |
| Countries | BE, DE, DK, NL, NO, SE, UK |
| Start date | 1990-01-01 |
| End date | 2014-12-31 |
| Date of publication | 2017-06-30 |
| Conditions applying to access and use | https://www.ospar.org/site/assets/files/1215/ospar_data_conditions_of_use.pdf |
| Data Snapshot | https://odims.ospar.org/documents/311/download |
| Data Results | https://odims.ospar.org/documents/287/download |
| Data Source | http://www.ices.dk/marine-data/data-portals/Pages/DOME.aspx |