

Abundance and Distribution of Cetaceans
Background
Cetaceans are distributed widely across the OSPAR Maritime Area, where thirty-six species have been recorded in recent history. As apex predators, cetaceans are an important component of marine biodiversity in the North-East Atlantic Ocean. Cetacean abundance and distribution are key indicators of environmental status, such as food web integrity. Many cetaceans are widely dispersed oceanic species that are rarely detected and very difficult to monitor. Consequently, this indicator is restricted to species with the most robust data. The information originates primarily from a few dedicated large-scale surveys.
Human activities affect the abundance and distribution of cetaceans. Historically, direct removal of individuals by hunting had severe effects on populations. Today, by-catch in fisheries is one of the major causes of mortality for small cetaceans (Marine Mammal By-catch (Harbour Porpoise, Common Dolphin, Grey Seal). Other pressures such as chemical and noise pollution affect individual animals, though the impact of these sub-lethal stress effects at the population level, independently and in combination, is not yet fully understood.
This assessment considers information on abundance and distribution and, where possible, assesses the status of the following species: minke whale, fin whale, harbour porpoise, coastal bottlenose dolphin, offshore bottlenose dolphin, white-beaked dolphin, short-beaked common dolphin, striped dolphin, long-finned pilot whale, sperm whale and beaked whales (the latter as a combined species group). All of these species are also assessed under Article 17 of the European Union Habitats Directive (https://nature-art17.eionet.europa.eu/article17/).
 in the Bay of Biscay in Autumn 2021 © Observatoire Pelagis")
Figure 1: Common dolphin (Delphinus delphis) in the Bay of Biscay in Autumn 2021 © Observatoire Pelagis
Cetaceans are an important component of marine biodiversity in the North-East Atlantic Ocean, as is clearly shown by their distribution and density (Figure a). Data from the systematic large-scale surveys (e.g., Small Cetaceans in the European Atlantic and North Sea SCANS in 1994; SCANS-II in 2005, SCANS-III in 2016; Cetacean Offshore Distribution and Abundance in the European Atlantic CODA in 2007; etc.) have been analysed using models that relate the density of species to features of their habitat to produce maps of predicted density distribution in the North-East Atlantic Ocean. Cetaceans are distributed widely across this area and the relatively small amount of overlap in predicted high-use areas highlights how the different species utilise the marine area in different ways, at least in summer. These and other similar data have been analysed to provide abundance estimates, and trends when possible.
Results of these analyses show that whales, dolphins, and porpoises are abundant throughout the North-East Atlantic Ocean. Although 36 species of cetacean have been recorded within the Greater North Sea, Celtic Seas, and the Bay of Biscay and Iberian Coast (Waring et al., 2009; Evans 2020; https://www.ascobans.org/), many are widely dispersed oceanic species that are rarely seen in these waters and, thus, very difficult to monitor systematically, regularly, and frequently. For instance, the current European Red List (as of spring 2022) has a majority of cetacean species classified as data deficient (https://ec.europa.eu/environment/nature/conservation/species/redlist/mammals/status.htm). Accordingly, this Indicator Assessment is mainly dedicated to assessing those species for which consistently robust information on abundance and distribution is available.

Figure a: Results from the OSPAR data call for cetacean sightings in 2016 from line-transect surveys in the North-East Atlantic.
The status of the following species is assessed: harbour porpoise (Phocoena phocoena). For this species an Indicator Assessment is possible because it hasdefined Assessment Units (AU) in the OSPAR Maritime Area and enough data to calculate at least three absolute abundance estimates. Coastal bottlenose dolphins (Tursiops truncatus) were assessed in five AUs, for which more than four estimates of abundance over a period of thirty years are available. No assessment could be made for the remaining AUs, because fewer than four abundance estimates during the last thirty years are available.
The status of the following species, for which AUs are defined but fewer than three estimates of abundance are available, is discussed: minke whale (Balaenoptera acutorostrata), fin whale (Balaenoptera physalus), offshore population of bottlenose dolphin , white-beaked dolphin (Lagenorhynchus albirostris), white-sided dolphin (Lagenorhynchus acutus), and short-beaked common dolphin (Delphinus delphis).
No assessment could be carried out on striped dolphin (Stenella coeruleoalba), Risso’s dolphin (Grampus griseus), long-finned pilot whale (Globicephala melas), sperm whale (Physeter macrocephalus), and beaked whales (as a combined species group, Ziphiidae) because there are no AUs defined for these species and fewer than three estimates of abundance are available. Their status with respect to distribution and abundance in the OSPAR Maritime Area is, however, discussed.
Killer whale (Orcinus orca) is not assessed, owing to a lack of additional data since the Pilot Assessment on Abundance and Distribution of killer whales in IA 2017. A review of killer whale populations in the North Atlantic identified three genetically distinguishable populations in the North-East Atlantic, each associated to a major fish stock (Jourdain et al., 2019). However, further photo-identification effort and genetic studies are required to delineate and define AUs.
Densities of killer whales are lower in OSPAR Regions II, III and IV where the indicator is common: few sightings of this species are registered as part of the large-scale surveys undertaken in these OSPAR Regions. In contrast, in Region I, the North Atlantic Sighting Surveys (NASS) estimated approximatively 15 000 killer whales (CV = 0,42) in 2001 (Jourdain et al., 2019). No abundance estimates for Regions II, III or IV are currently available, but small, localized populations have been identified (e.g. Gibraltar Strait, off the West Coast of the British Isles, Iberian Peninsula). Photographic capture-recapture studies are needed to obtain population size for these small, localized populations: large scale surveys have low coverage probability and are not designed to capture small-scale features in distribution and abundance, especially in areas of low abundance and / or patchy distribution (Hammond et al., 2014).
Human pressures
Cetaceans are subject to a range of human pressures, some of which have been shown to have negative impacts at the individual level, ranging from increased stress and higher energetic costs, through sub-lethal effects on reproduction and immune function, to mortality. Effects may manifest at population level (Hammond et al., 2008; MAGRAMA, 2012; JNCC, 2013; Pirotta et al., 2018; ICES 2019). An overview of drivers, pressures and activities impacting marine mammals is given in The Marine Mammals Thematic Assessment .
Historical data on abundance and distribution
There is very little information about historical distribution (pre-1980) for any species of cetacean in the area assessed and no information about historical abundance (save for catch statistics of whales; e.g., Brown 1976; Smith et al. 2012; https://iwc.int/whaling). Methods to estimate cetacean abundance were first developed in the 1980s (Hammond, 1986; Hiby and Hammond, 1989). Development in analytical and survey methods continues (e.g., Bravington et al., 2021). The most recent methods are developed during the SCANS surveys (Hammond et al., 2002, 2013, 2021).
Data on strandings have been recorded for more than 100 years, but these can provide only very limited information on the presence at sea of offshore species, and it is not possible to use these data to infer population trends without additional information on causes of death, search effort and drifting of dead animals (Authier et al., 2014; Ten Doeschate et al., 2018; ICES 2021). In some cases, strandings data can provide information about distribution and occurrence, such as with harbour porpoise, for which stranding numbers inclined steeply in the Southern North Sea due to a shift in distribution, with a relatively high level of strandings to date (IJsseldijk et al., 2020).
Quality Status Report 2010 and Intermediate Assessment 2017
No comparable quantitative assessment of the distribution and abundance of wide-ranging cetaceans was included in the Quality Status Report 2010. The report highlighted human pressures on marine mammals more generally, such as by-catch, increased shipping and bioaccumulation of persistent hazardous substances. The assessment is based on updated abundance estimates from the Intermediate Assessment 2017, and a modelling approach integrating the IA 2017 data with regional survey data for wide ranging species up to 2020. For coastal bottlenose dolphin populations, the IA 2017 data were updated to 2020. After IA 2017 a threshold value for M4 abundance was approved and applied in the current assessment.
Wide-ranging cetaceans are also assessed under the European Union Habitats Directive Article 17 reporting, latest in 2018 (https://www.eea.europa.eu/publications/state-of-nature-in-the-eu-2020/at_download/file; EEA, 2020).
Methods
The data used to infer distribution and to estimate abundance of wide-ranging species were mostly derived from dedicated aerial and shipboard surveys that used line-transect methodology to generate robust estimates of abundance: SCANS (Small Cetacean Abundance in the North Sea; Hammond et al., 2002), SCANS-II (Small Cetacean Abundance in the European Atlantic and North Sea; Hammond et al., 2013), CODA (Cetacean Offshore Distribution and Abundance in the European Atlantic; CODA, 2009) and SCANS-III (Hammond et al., 2021). Smaller-scale (mostly national) surveys have been conducted using the same or a similar methodology, such as in Belgium, Denmark, France, Germany, Ireland, the Netherlands, and Sweden (Scheidat et al., 2008; Viquerat et al., 2014; Gilles et al., 2016; Laran et al., 2017; Rogan et al., 2018). The large-scale surveys provide information on distribution and abundance over a large area but are infrequent, and only undertaken in summer. The smaller-scale surveys are undertaken more often, and sometimes reveal seasonal patterns at a local scale.
The international (SCANS, SCANS-II, SCANS-III and CODA) and national surveys (e.g., ObSERVE) were collated following a data call from OSPAR in 2021 (Figure a and Figure b). Data were collected on dedicated line-transect surveys (either aerial or ship-based) using a distance sampling protocol, that took place within the OSPAR Maritime Area between 2005 and 2020. The first SCANS survey in 1994 focused on the Greater North Sea subregion but also covering part of the Celtic Seas subregion (Figure b, leftmost panel). The second SCANS survey in 2005 extended into the Bay of Biscay and Iberian Coast subregion. In 2007, the CODA survey covered offshore waters of the Celtic Seas and Bay of Biscay and Iberian Coast subregion (Figure b, middle panel). SCANS-III in 2016 covered both inshore and offshore waters. The ObSERVE summer aerial survey covered waters around Ireland that same year (Figure b, rightmost panel). While the SCANS-II / CODA and SCANS-III / ObSERVE survey had a similar geographic coverage, the first SCANS 1994 survey was more limited in scope. The Greater North Sea subregion has been consistently surveyed by the three SCANS surveys.
The data used to assess abundance and distribution of coastal bottlenose dolphins are mostly derived from capture–recapture methods applied to photo-identification data available in each of the AUs for this species. In some AUs, data from ship-based surveys are available. Data are patchy, however, and in some AUs robust data are only available for a limited number of animals that use small (protected) areas within the AU. As a consequence, data derived from small-scale surveys that relate to a discrete group of animals may not always be a robust measure of abundance for the entire AU. In order to examine trends, only sites with at least four estimates calculated over a ten-year period were considered.
 showing geographic coverage in the North-East Atlantic. The ship-based survey CODA of 2007 is joined with SCANS-II 2005. The aerial survey ObSERVE in summer 2016 is joined to SCANS-III 2016.")
Figure b: Designs of the SCANS surveys (1994, 2005 and 2016) showing geographic coverage in the North-East Atlantic. The ship-based survey CODA of 2007 is joined with SCANS-II 2005. The aerial survey ObSERVE in summer 2016 is joined to SCANS-III 2016.
Species Distribution
Distribution maps were generated from a density surface model approach (Miller et al., 2013) fitted to the collated data by OSPAR. Environmental covariates used in modelling included physiographic predictors (e.g., bathymetry) and oceanographic variables (e.g., sea surface temperature; Table a). The model was used to predict the summer distribution between 2005 and 2020 for harbour porpoise, fin whale, minke whale and offshore bottlenose dolphin. Predicted distribution maps were averaged over the periods 2005 to 2009, and 2010 to 2020.
For other species, information on species distribution has been obtained from modelled density surfaces fitted to data collected during large-scale surveys (SCANS-II/CODA and SCANS-III): Lacey et al., (2021) fitted (i) a density surface model to the SCANS-II/CODA data and (ii) another model to the SCANS-III data to investigate the distribution and habitat of cetacean species (and change therein) in the North-East Atlantic. Sightings of these species during the SCANS-III surveys (summer 2016) are shown to illustrate recent distribution.
For coastal bottlenose dolphin, records of sightings and strandings were used to identify where populations existed historically.
Abundance
Abundance was estimated using line-transect distance sampling methods (conventional design-based (CDS) estimates; Hammond et al., 2013). Ship-based survey methods mostly used two observation teams on the same vessel so that animals missed on the transect line and any responsive movement could be accounted for in the analysis. However, for some species in some years, insufficient data were available for such extended analytical methods to be used. Several aerial surveys used tandem aircraft or the circle-back procedure for harbour porpoises to correct for animals missed on the transect line (Hiby and Lovell, 1998; Hiby, 1999); this was extended to dolphin species and minke whales in SCANS-III in 2016. For other species, conventional aerial survey methods were used, corrected for availability and observer bias where possible (Hammond et al., 2013, 2021).
The abundance of coastal bottlenose dolphin populations was estimated, where possible, using Photo-ID capture-recapture methods (Amstrup et al., 2010; e.g. Cheney et al. 2018) and ship-based surveys.
Metrics
Species Distribution
Density surface models have been used to predict the distribution of those species for which sufficient data are available from large-scale purpose-designed surveys.
A suite of physiographic and oceanographic covariates (Table a) was used to model, with data collated by OSPAR (Figure b), the distribution of cetaceans in a Density Surface Modelling framework (after Miller et al., 2013).
Table a: Assessment values for cetacean species. Source A: EMODnet DTM (https://www.emodnet-bathymetry.eu/). Slope, aspect and topography complexity index were derived from the bathymetry data. Source B: Copernicus database (https://resources.marine.copernicus.eu).
| Environmental variable | Original spatial resolution | Original temporal resolution | Spatial prediction resolution | Temporal prediction resolution | Source | Justification | |
|---|---|---|---|---|---|---|---|
| Physiographic | Bathymetry (m) | 1/16 arc minute | N/A | 10km | N/A | A | Generally a good predictor for cetaceans; Deep-divers feed on squid and fish in the deep water column |
| Slope (rad) | Associated with currents, high slopes induce enhanced primary production or prey aggregation | ||||||
| Aspect (rad) | Describe currents and prominent structures such as canyons, seamounts or moutain chains, used as proxies for predator hotspots and usefull in locations where access to biological data is limited | ||||||
| Oceanographic | Sea surface temperature (SST) mean (°C) and gradient (°C/m) | 0.083 degree | Monthly | 10km | Monthly | B | Variability over time and horizontal gradients of SST reveal front locations, mixing of water and is associated with enhanced primary production and prey aggregations |
| Eddy kinetic Energy (EKE ; m/s) | High EKE relates to the development of eddies, upwelling of nutrients and enhanced primary production, which induce prey aggregation | ||||||
| Net primary productivity (NPPV ; mg.m-3.day-1) | 0.25 degree | Net primary production is a proxy of zooplankton distribution, feeding cetacean preys | |||||
Source A: EMODnet DTM (https://www.emodnet-bathymetry.eu/). Slope, aspect and topography complexity index were derived from the bathymetry data.
Source B: Copernicus database (https://resources.marine.copernicus.eu).
The modelling framework uses generalised additive models to predict cetacean distribution from environmental covariates. This framework allowed to model non-linear relationships between cetacean habitat and the marine environment (Embling et al., 2010; Gilles et al., 2016; Formula a):

Formula a: Density Surface Modelling.
NB denotes the Negative Binomial distribution, ω is the overdispersion parameter, Effort is the prospected surface (including the effective strip width estimated by distance sampling) and µ is the linear predictor (Formula b):

Formula b: Generalized additive modelling with splines.
where f(.) are cubic Bezier splines (Marx and Eilers 2010).
An extrapolation analysis in environmental space was undertaken to assess the robustness of predictions from this model-based approach (Bouchet et al., 2019). Environmental variables (Table a) define a new topology, or environmental space, which can be studied with geometric tools such as distances and polygons. In particular, an extrapolation analysis can be carried out in this environmental space to assess how the data collected thus far covers the whole environmental space available in the North-East Atlantic. This analysis informs on how pervasive extrapolation may be when predicting cetacean distribution and habitat from a model. Technically, extrapolation analysis compares convex polygons in environmental space: a first polygon is obtained with the effort data by taking all segments of effort and their associated environmental covariates (the calibration data). A second polygon is obtained from environmental data collected in the whole area for which a distribution map is desired. It is important to note that this area is larger than the geographic area covered by surveys (e.g., Figure a and Figure b). These environmental data are to be used to predict cetacean distribution using both the environmental data and the model calibrated with the survey effort data. Each prediction is thus defined by a set of coordinates (values) that locates it in environmental space: it is possible to assess for each prediction whether it falls within the convex hull defined by the calibration data (King & Zeng 2007, Authier et al., 2017, Bouchet et al., 2019). Extrapolation analysis thus allows to assess the robustness of model predictions by quantifying how much the latter are informed by these data.
Abundance
Abundance of animals per species AU has mostly been estimated using data collected from large-scale purpose-designed aerial or shipboard surveys using line-transect distance sampling methods (Buckland et al., 2001); these are known as conventional design-based estimates CDS (e.g., Hammond et al., 2013; 2021). When abundance estimates come from models fitted to these data to generate a density surface (Miller et al., 2013) from which abundance is derived; these are known as model-based estimates (e.g., Gilles et al., 2016). All the reported estimates of population size for the Indicator Assessment are design-based estimates, which are less model-dependent, but do not allow to map densities at a fine spatial scale.
Abundance of coastal bottlenose dolphins per population in an AU was estimated using capture–recapture methods applied to photo-identification data, and ship-based surveys.
Baselines
Although the baseline should derive from historical data, these data are not available for the vast majority of cetacean species (Bearzi and Reeves 2021). To assess change, a recent (modern) baseline must be used (Kopf et al., 2015), which should then be assessed as a “reference” situation, and possibly one that is already known to be degraded. The most useful baselines for wide-ranging cetacean species derive from the results of large-scale surveys such as SCANS for coastal species and SCANS-II/CODA for wider ranging species (e.g., CODA, 2009; Hammond et al., 2002, 2013).
For most species, only two abundance estimates are currently available so a robust assessment of a trend involving change from a baseline is not possible. For harbour porpoise and white-beaked dolphin in the Greater North Sea there are three estimates available.
Spatial Scope
Assessment Units (AUs) for assessing abundance and distribution were defined for a number of species (ICES, 2014b) in separate regions, or in the OSPAR Maritime Area. For harbour porpoise, several AUs have been reviewed and defined (Figure c; NAMMCO/IRM 2019). OSPAR’s Marine Mammal Expert Group (OMMEG) further reviewed these AUs in 2021 and merged the Celtic Sea and Irish Sea AUs into a single Irish and Celtic Seas AU. For bottlenose dolphin, eleven AUs have been defined for the relatively small coastal populations on the basis of a combination of spatial separation, lack of photo-ID matches and genetic differences (Evans and Teilmann, 2009; ICES, 2013; ICES 2014; IAMMWG 2015). (Figure d) and a single offshore AU for the relatively large and wide-ranging population(s) of bottlenose dolphin living offshore (Figure e).
Currently, a single AU covering all European Atlantic waters has been defined for minke whale (Figure f), short-beaked common dolphin (Figure f), and white-beaked dolphin and white-sided dolphin (Figure g). For fin whales, three AUs defined by the International Whaling Commission overlap with the OSPAR Maritime Area (Figure h). No AUs have been defined for other species included in this assessment.

Figure c: Assessment units for the harbour porpoise. Modified from NAMMCO/IRM 2019. Only AUs that are partially or completely within the OSPAR Maritime Area are shown.

Figure d: Assessment units for coastal bottlenose dolphins.

Figure e: Assessment units for offshore bottlenose dolphins.

Figure f: Assessment unit for the minke whale and short-beaked common dolphin.

Figure g: Assessment unit for the white-beaked and white-sided dolphins.

Figure h: Assessment units for the fin whale.
Threshold Value
The assessment thresholds for populations of cetacean species are based on the generation criterion from the International Union for the Conservation of Nature (https://www.iucn.org/). In each AU, the (localized) population size of each species will be maintained at or above baseline levels (the first abundance estimate available or the closest to the date of the Habitats Directive (Council Directive 92 / 43 / EEC)), with (i) no absolute decrease of more than 30% and (ii) a rate of decrease no greater than 30% over three generations. The latter can be converted to threshold values that are an annual rate of decline in abundance that must not be exceeded without having to wait for three generations. The annual rates of decline, if sustained over three generations, will lead to 30% decline in abundance. Since generation time varies between species (Taylor et al., 2007), thresholds, which corresponds to average annual rate of decline in abundance that would result in an overall 30% decline if sustained over three generations, are species-specific and reported in Table b.
Table b: Threshold values for cetacean species
| Functional Group | Species name | Threshold 1 (absolute decline, %) | Threshold 2 (yearly decline, %) |
|---|---|---|---|
| Baleen whale | Minke whale | -30 | -0,5 |
| Fin whale | -30 | -0,5 | |
| Deep-divers | Sperm whale | -30 | -0,4 |
| Long-finned pilot whale | -30 | -0,5 | |
| Risso's dolphin | -30 | -0,6 | |
| Beaked whales | -30 | N/A | |
| Small toothed cetaceans | Killer whale | -30 | -0,5 |
| Bottlenose dolphin | -30 | -0,5 | |
| Striped dolphin | -30 | -0,5 | |
| White-sided dolphin | -30 | -0,7 | |
| White-beaked dolphin | -30 | -0,7 | |
| Common dolphin | -30 | -0,9 | |
| Harbour porpoise | -30 | -1,6 |
N/A: not available
Trend estimation
A trend is quantified as the percentage change (in abundance) over a specified time period (Link and Sauer 1997). To assess trends, at least three abundance estimates are required over a relevant time scale. Robust assessments will require additional abundance estimates. To assess trends, it is necessary to consider the statistical power to detect changes (Authier et al., 2020).
For coastal bottlenose dolphins, monitoring in several populations within AUs has been ongoing for long enough to enable an assessment of trends, while in others there are currently too few data available over a suitable time period. Current estimates of numbers of animals in a population are usually obtained by photo-ID, although in their absence, abundance estimates are derived from line-transect surveys. Where possible, annual data on the estimated number of animals per population are provided in this assessment. Consideration is also given to coastal bottlenose dolphin populations known to have disappeared from their former range.
Power Analysis
Prospective statistical power analyses (Hoenig and Heisey 2001) were performed for detecting a trend in short time series of abundance estimates for cetacean species using a statistical significance set to 0,2 (Authier et al., 2020). Power was increased (except type-I error rate; Authier et al., 2020) but remained low to detect a small decline. The power to detect trends could be improved by increasing the frequency of the large-scale surveys (Authier et al., 2020).
Results

Figure 2: By-caught small delphinid adrift in the Bay of Biscay © Observatoire Pelagis
The status of harbour porpoise was quantitatively assessed as stable for the Greater North Sea AU, between 1994 and 2016. Harbour porpoise distribution showed a southern shift in summer within the Greater North Sea between 1994 and 2005, which was confirmed in 2016. In the species’ other defined Assessment Units only two estimates of abundance are available and a qualitative assessment was made. Population size remained stable in the West Scotland and Ireland, and in the Iberian Peninsula AUs. A large decline in harbour porpoise abundance was apparent between the 2005 and 2016 estimates in the Celtic and Irish Seas AU.
For short-beaked common dolphin, white-beaked dolphin and minke whale the abundance estimate in 2016 is similar to the estimate in 2005 / 2007. For offshore bottlenose dolphins, a large increase in abundance is apparent between the 2005 / 2007 and 2016 estimates. The status of these species in a single defined North-East Atlantic AU is qualitatively assessed as one of no decline in abundance.
For fin whale, three AUs have been defined and white-sided dolphin has one single North-East Atlantic AU. Both species have only one abundance estimate in 2016 and therefore no assessment is possible. Without a defined AU, no assessment, qualitative or quantitative, is possible for striped dolphin, Risso’s dolphin, long-finned pilot whale, beaked whales and sperm whale.
Coastal bottlenose dolphins were quantitatively assessed against the threshold in five of the eleven species’ AUs. The Sado Estuary population in the Coastal Portugal AU was assessed as in decline. Estimates from the wider Cardigan Bay in the Irish Sea and Coastal Wales AU, the populations in the Coastal Ireland AU, the Coastal Normandy and Brittany AU and the East Coast Scotland AU indicate broadly stable populations. The population in the East Coast Scotland AU may be showing signs of increase and range expansion in recent years.
Data Call
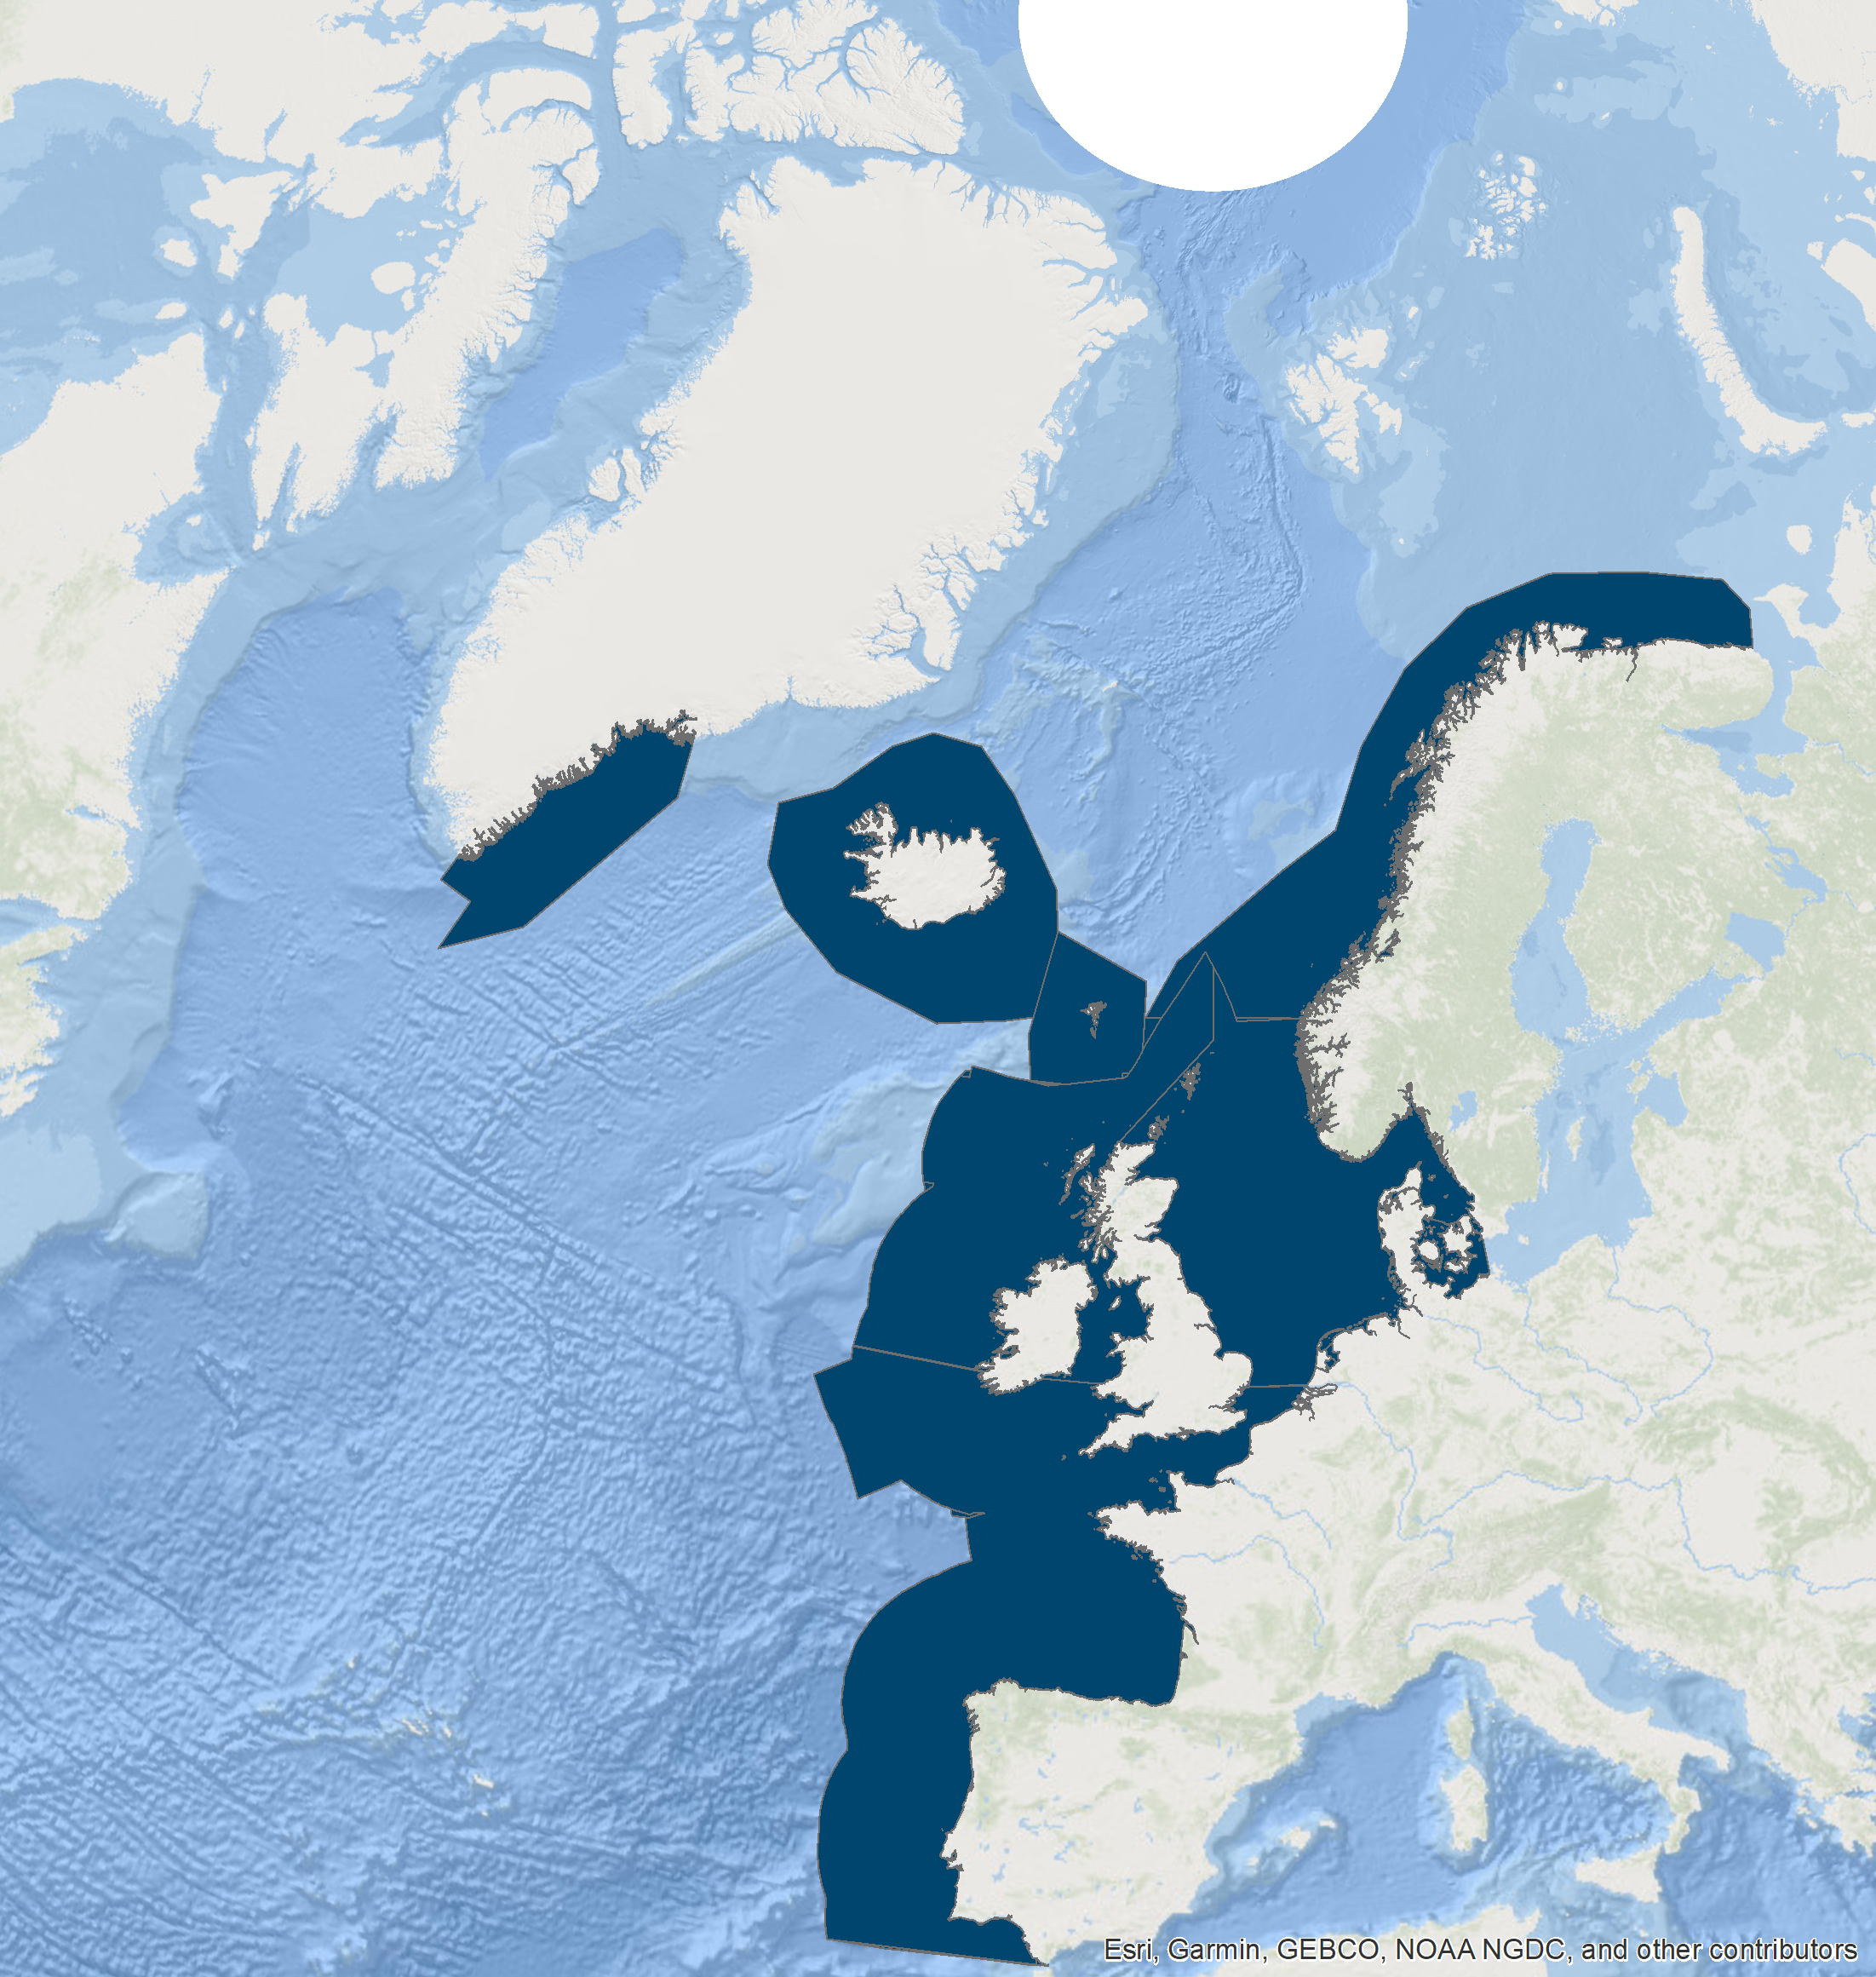
Approximately 698 500 km of survey effort were collated as part of the OSPAR data call for the Indicator Assessment. Both ship-based and aerial survey data were collated with approximatively 195 000 km of effort with ships and approximately 500 000 km with planes. These data span the period between 2005 and 2020, and cover a wide geographical range (Table c) but not evenly (Figure i): a lot of effort is concentrated in the Greater North Sea, and comparatively less effort is deployed in offshore areas of the Celtic Seas and Bay of Biscay and Iberian Coast. Geographic coverage is thus uneven across the OSPAR Maritime Area.
| Contracting Parties | Latitudinal range | Longitudinal range | Temporal range | Linear effort (km) | Platform | |||
|---|---|---|---|---|---|---|---|---|
| start | end | start | end | start | end | |||
| EU* | 35,88 | 62,16 | -17,79 | 14,2 | 2005 | 2016 | 41 540 | Ship |
| EU* | 35,97 | 68,44 | -10,84 | 16,49 | 2005 | 2016 | 113 264 | Plane |
| ES | 37,13 | 48,13 | -9,72 | -1,23 | 2007 | 2020 | 56 044 | Ship |
| FR | 43,39 | 51,85 | -9,75 | 3,33 | 2011 | 2020 | 107 336 | Plane |
| FR | 43,39 | 55,24 | -11,22 | 8,12 | 2005 | 2020 | 97 549 | Ship |
| IE | 49,06 | 56,36 | -15,54 | -5,34 | 2015 | 2017 | 43 245 | Plane |
| BE | 51,14 | 51,84 | 2,03 | 3,27 | 2008 | 2020 | 23 316 | Plane |
| NL | 51,38 | 55,77 | 2,55 | 6,8 | 2008 | 2019 | 64 226 | Plane |
| DE | 53,40 | 55,92 | 3,37 | 8,94 | 2005 | 2020 | 140 517 | Plane |
| DK | 55,05 | 58,25 | 6,82 | 10,87 | 2011 | 2020 | 11 514 | Plane |
| Summary | 35,88 | 68,44 | -17,79 | 16,49 | 2005 | 2020 | 698 551 | |
* includes several Contracting Parties (e.g., United Kingdom, Portugal, etc.)

Figure i: Results from the OSPAR data call for cetacean survey data collected between 2005 and 2020 in the North-East Atlantic. Note that in case of multiple overlapping transects, only the most recent one is shown.
Species Distribution
Extrapolation
The extrapolation analysis reveals that environmental coverage was uneven, with shelf areas being relatively well covered, but the Norwegian Trench, offshore areas off Portugal and in the central Bay of Biscay corresponded to extrapolations in environmental space (Figure j). In practice, model-based predictions that are extrapolations (both in environmental and geographical space) are intrinsically more fragile because less informed by data and more by assumptions embedded in modelling choices.
Harbour porpoise (small toothed-cetacean species group)
Harbour porpoises are distributed throughout the shelf waters of the Greater North Sea, Celtic Seas and the Bay of Biscay and Iberian Coast. The Iberian Peninsula constitutes a separate population / subspecies (Fontaine et al., 2007, NAMMCO/IRM 2019), while all other areas except the Kattegat / Belt Sea are sub-areas of the North-East Atlantic / Greater North Sea population. The area around the northern border of the Kattegat / Belt Sea probably contains a mix of two different populations (Sveegaard et al., 2015).
The presence of harbour porpoises is influenced by oceanographic and human pressure variables. Water depth, surface salinity, temperature differences within the water column, eddy activity, current speed, coarseness of surface sediments, seabed slope and ship density have been identified as relevant influencing factors, although the interactions depend on the area and habitat type (Pierpoint, 2008; Marubini et al., 2009; Embling et al., 2010; Isojunno et al., 2012; Booth et al., 2013; Heinänen and Skov, 2015). Oceanographic variables might indirectly influence the presence of porpoises through determining the presence and abundance of their prey (Gilles et al., 2016).
 in predictions for July (between 2005 and 2020) from a distribution model fitted to the collated cetacean survey data in the OSPAR area.")
Figure j: Extrapolation (on a probability scale) in predictions for July (between 2005 and 2020) from a distribution model fitted to the collated cetacean survey data in the OSPAR area.
A comparison of harbour porpoise distribution between the SCANS and SCANS-II data sets showed a marked difference in summer distribution within the Greater North Sea, with a southern shift in the main concentrations of animals between 1994 and 2005. This southward shift in distribution is supported by data from smaller scale surveys which show increasing numbers of porpoises occurring in French, Belgian, Dutch and German waters (e.g., Gilles et al., 2009, 2011; Haelters et al., 2011; Scheidat et al., 2012; Peschko et al., 2016, Nachtsheim et al. 2021) and decreasing numbers in the northern North Sea (Øien, 1999, 2005, 2010, Hammond et al., 2013, 2021). The shift in harbour porpoise distribution is believed to be related to changes in prey distribution or abundance (Hammond et al., 2013). Data from the SCANS-III survey in 2016 confirms that the shift has been maintained (Figure k). More sightings were made throughout the English Channel in 2016 than in previous surveys.
 Average map of predicted distribution of harbour porpoise in July between 2005 and 2020.")
Figure k: (A) Average map of predicted distribution of harbour porpoise in July between 2005 and 2020.
 Uncertainty map (coefficient of variation in %) of predicted distribution of harbour porpoise in July between 2005 and 2020.")
Figure k: (B) Uncertainty map (coefficient of variation in %) of predicted distribution of harbour porpoise in July between 2005 and 2020.
Short-beaked common dolphin (small toothed-cetacean species group)
Common dolphins in the North-East Atlantic are distributed widely in the Celtic Seas, the Bay of Biscay and Iberian Coast, and the Wider Atlantic (Reid et al., 2003; Murphy et al., 2013, Saavedra et al., 2018; Astarloa et al., 2021; Murphy et al., 2021). Sightings in the Greater North Sea are thought to be associated with the North Atlantic Oscillation and the incursion of warmer water into the Northern North Sea (Murphy et al., 2013). The SCANS-II and SCANS-III surveys revealed no sightings of common dolphin in the Greater North Sea but there were many sightings throughout the southern part of the Celtic Seas and throughout the Bay of Biscay and Iberian Coast (Figure l). Modelling the distribution of common dolphin was met with several problems (overdispersion etc.; Lacey et al., 2021) that resulted in predictions with large standard errors.
White-beaked dolphin (small toothed-cetacean species group)
White-beaked dolphins have been shown to prefer water temperatures of 13°C or less (MacLeod et al., 2008) and depths of 50–100 m (Reid et al., 2003). They are mainly found in the northern part of the Greater North Sea and Celtic Seas, and have only been recorded as vagrants in the Bay of Biscay and Iberian Coast (Figure m). From the pattern of sightings from the SCANS, SCANS-II and SCANS-III surveys, the distribution of white-beaked dolphin does not appear to have changed since 1994 (Hammond et al., 2002, 2013, 2021).

Figure l: Sightings of short-beaked common dolphin in 2016.

Figure m: Sightings of white-sided dolphin in 2016.
White-sided dolphin (small toothed-cetacean species group)
White-sided dolphins are found in temperate and sub-arctic waters, where they mainly occur along the slope of the continental shelf at depths of 100-500 m (Reid et al., 2003). They are distributed in the western part of the Celtic Sea and the northern part of the Greater North Sea (Figure n).
Coastal bottlenose dolphin (small toothed-cetacean species group)
Coastal bottlenose dolphins are observed along the Atlantic coast of Europe from Scotland in the north to Spain in the south. Populations of unknown size disappeared from the Severn Estuary (United Kingdom) and estuaries in the east of England (United Kingdom), as well as from the Elbe and Weser estuaries of Germany towards the end of the 19th century. More recently, a population in the southern North Sea, which ranged from the northern French coast to the north of the Dutch coast disappeared towards the end of the 1960s. Other discrete populations, such as those from Arcachon (France) and the Tagus Estuary (Portugal) have also disappeared in recent decades.
Offshore bottlenose dolphin (small toothed-cetacean species group)
Bottlenose dolphins are widely distributed in offshore waters of the North-East Atlantic (Reid et al., 2003; Hammond et al., 2002, 2013; Laran et al., 2017; Rogan et al., 2018; Figure o). In contrast to the situation for coastal populations of this species, less is known about the animals in offshore waters: the ObSERVE surveys in the summers of 2015 and 2016 revealed a large number of sightings south-west of Ireland.

Figure n: Sightings of white-beaked dolphin in 2016.
 Average map of predicted distribution of offshore bottlenose dolphins in July between 2005 and 2020.")
Figure o: (A) Average map of predicted distribution of offshore bottlenose dolphins in July between 2005 and 2020.
 Uncertainty map (coefficient of variation in %) of predicted distribution of offshore bottlenose dolphins in July between 2005 and 2020.")
Figure o: (B) Uncertainty map (coefficient of variation in %) of predicted distribution of offshore bottlenose dolphins in July between 2005 and 2020.
Striped dolphin (small toothed-cetacean species group)
Striped dolphins have been found to prefer specific water temperatures (such as 21–24°C within the Mediterranean Sea; Panigada et al., 2008). Within the OSPAR Maritime Area, they are generally found only within the southern part of the Celtic Seas and in the Bay of Biscay and Iberian Coast, primarily in waters off the continental shelf (CODA, 2009; Laran et al. 2017; Hammond et al. 2021; Figure p).
Minke whale (baleen whale species group)
Minke whales occur both on and off the shelf of the North-East Atlantic. The southern/central North Sea and Celtic Seas represent the southernmost limit of their summer range in the North-East Atlantic (Reid et al., 2003; Evans et al., 2003). There is some evidence that minke whale distribution shifted south between 1994 and 2005 (Hammond et al., 2013); the pattern of sightings from SCANS-III shows that this has been maintained (Hammond et al., 2021). Minke whales have rarely been recorded in the Bay of Biscay and Iberian Coast (Figure v).

Figure p: Sightings of striped dolphin in 2016.
 Average map of predicted distribution of minke whale in July between 2005 and 2020.")
Figure v: (A) Average map of predicted distribution of minke whale in July between 2005 and 2020.
 Uncertainty map (coefficient of variation in %) of predicted distribution of minke whale in July between 2005 and 2020.")
Figure v: (B) Uncertainty map (coefficient of variation in %) of predicted distribution of minke whale in July between 2005 and 2020.
Fin whale (baleen whale species group)
Fin whales primarily inhabit deeper waters (200–400 m) beyond the continental shelf edge (Reid et al., 2003). They are rarely seen in the Greater North Sea but are commonly sighted in the Celtic Seas and Bay of Biscay and Iberian Coast (Figure w). García-Barón et al., (2019) evidenced higher densities of fin whale in deep waters of the Bay of Biscay, associated with moderate sea surface temperature, a positive sea level anomaly and high chlorophyll a concentration. Data spanning the past 30 years do not indicate any changes in distribution (Hammond et al., 2011; Lacey et al., 2021).
 Average map of predicted distribution of fin whale in July between 2005 and 2020.")
Figure w: (A) Average map of predicted distribution of fin whale in July between 2005 and 2020.
 Uncertainty map (coefficient of variation in %) of predicted distribution of fin whale in July between 2005 and 2020.")
Figure w: (B) Uncertainty map (coefficient of variation in %) of predicted distribution of fin whale in July between 2005 and 2020.
Risso’s dolphin (deep-diver species group)
Risso’s dolphin is a deep-diving species mainly occurring along the edge of continental shelf waters and adjacent oceanic waters in the Celtic Seas and the Bay of Biscay, but also sighted in continental shelf waters (Laran et al., 2017, Rogan et al. 2018, Figure x). They are thought to prefer water temperatures of 12°C or more (Hartman 2018).
Long-finned pilot whale (deep-diver species group)
Long-finned pilot whales are deep divers and typically found only in waters around the continental slope and beyond the shelf. They occur throughout the Celtic Seas and the Bay of Biscay and Iberian Coast (Figure y). No pilot whales were seen in the SCANS, SCANS-II or SCANS-III surveys in the Greater North Sea (Hammond et al. 2002, 2013, 2021). Slope and distance to shelf edge are important predictors for the presence of this species (Rogan et al., 2017).

Figure x: Sightings of Risso’s dolphin in 2016.

Figure y: Sightings of long-finned pilot whales in 2016.
Beaked whales (all species) (deep-diver species group)
Beaked whales are deep-diving species found almost exclusively in deep waters. Sighting of beaked whales are relatively uncommon in most areas throughout the Celtic Seas and the Bay of Biscay and Iberian Coast (Rogan et al., 2017) and rare in the Greater North Sea. Deep divers are the most frequently sighted on continental slopes (Virgili et al. 2019). Sightings of northern bottlenose whale Hyperoodon ampullatus and Sowerby’s beaked whale Mesoplodon bidens have been made primarily in the northern part of the Celtic Seas, whilst Cuvier’s beaked whale has mostly been seen in the southern part of the Celtic Seas and the western part of the Bay of Biscay and Iberian Coast (Figure z).
Sperm whale (deep-diver species group)
The sperm whale is a deep-diving species found throughout deep waters of the Celtic Seas and the Bay of Biscay and Iberian Coast, and rarely in the Greater North Sea, except in the Faroes-Shetland channel between the Greater North Sea and Celtic Seas (Figure aa). Virgili et al., (2019) evidenced high densities of sperm whales in deep waters (>2 000 m) associated with high gradients of sea surface temperature and high primary productivity.

Figure z: Sightings of beaked whales in 2016.

Figure aa: Sightings of sperm whales in 2016.
Abundance
The most recent SCANS III and ObSERVE survey in summer 2016 provide the best available population abundance estimates for harbour porpoise, common dolphin, striped dolphin, white-beaked dolphin, white-sided dolphin offshore bottlenose dolphin, fin whale, minke whale, Risso’s dolphin, long-finned pilot whale, beaked whales and sperm whale (Table d).
| Species group | Species | Survey | Platform | Year | Season | Assessment Unit | Estimate type | Estimate | CV (%) | Assessment |
|---|---|---|---|---|---|---|---|---|---|---|
| Small toothed-cetaceans | Harbour porpoise | SCANS | Ship | 1994 | Summer | North Sea | Design-based | 289 200 | 14% | yes |
| Harbour porpoise | SCANS-II | Plane + ship | 2005 | Summer | North Sea | Design-based | 355 400 | 22% | ||
| Harbour porpoise | SCANS-III | Plane + ship | 2016 | Summer | North Sea | Design-based | 345 400 | 18% | ||
| Harbour porpoise | SCANS-II | Plane + ship | 2005 | Summer | Celtic and Irish Seas | Design-based | 80 600* | 30% | no | |
| Harbour porpoise | SCANS-III/ObSERVE | Plane + ship | 2016 | Summer | Celtic and Irish Seas | Design-based | 46 800* | 14% | ||
| Harbour porpoise | SCANS-II | Plane + ship | 2005 | Summer | W Scotland / N Ireland | Design-based | 50 100* | 31% | no | |
| Harbour porpoise | SCANS-III/ObSERVE | Plane + ship | 2016 | Summer | W Scotland / N Ireland | Design-based | 44 300* | 14% | ||
| Harbour porpoise | SCANS-II | Ship | 2005 | Summer | Iberian Peninsula | Design-based | 2 900 | 72% | no | |
| Harbour porpoise | SCANS-III | Plane | 2016 | Summer | Iberian Peninsula | Design-based | 2 900 | 32% | ||
| Common dolphin (w/o % unind.) | SCANS-II/CODA | Plane + ship | 2005 / 2007 | Summer | Single AU (partial coverage) | Design-based | 468 400 | 33% | no | |
| Common dolphin (w/o % unind.) | SCANS-III/ObSERVE | Plane + ship | 2016 | Summer | Single AU (partial coverage) | Design-based | 487 100 | 25% | ||
| Striped dolphin (w/o % unind.) | SCANS-II/CODA | Plane + ship | 2005/2007 | Summer | Single AU (partial coverage) | Design-based | 234 200 | 80% | no | |
| Striped dolphin (w/o % unind.) | SCANS-III/ObSERVE | Plane + ship | 2016 | Summer | Single AU (partial coverage) | Design-based | 455 100 | 30% | ||
| Offshore bottlenose dolphin | SCANS-II/CODA | Plane + ship | 2005 / 2007 | Summer | Single AU (partial coverage) | Design-based | 56 100 | 27% | no | |
| Offshore bottlenose dolphin | SCANS-III/ObSERVE | Plane + ship | 2016 | Summer | Single AU (partial coverage) | Design-based | 120 500 | 17% | ||
| White-beaked dolphin | SCANS-II | Plane + ship | 2005 | Summer | Single AU | Design-based | 37 700 | 36% | no | |
| White-beaked dolphin | SCANS-III/ObSERVE | Plane + ship | 2016 | Summer | Single AU | Design-based | 39 500 | 27% | ||
| White-sided dolphin | SCANS-III/ObSERVE | Plane + ship | 2016 | Summer | Single AU | Design-based | 17 400 | 64% | no | |
| Baleen whales | Minke whale | SCANS-II/CODA | Plane + ship | 2005 / 2007 | Summer | Single AU | Design-based | 22 000 | 37% | no |
| Minke whale | SCANS-III/ObSERVE | Plane + ship | 2016 | Summer | Single AU | Design-based | 21 200 | 27% | ||
| Fin whale | SCANS-III/ObSERVE | Plane + ship | 2016 | Summer | EI + F | Design-based | 900* | 47% | no | |
| Fin whale | SCANS-III/ObSERVE | Plane + ship | 2016 | Summer | NW | Design-based | 0* | 0% | no | |
| Fin whale | SCANS-III/ObSERVE | Plane + ship | 2016 | Summer | Sp (partial coverage) | Design-based | 25 700* | 14% | no | |
| Deep divers | Risso's dolphin | SCANS-III/ObSERVE | Plane + ship | 2016 | Summer | No specified AU | Design-based | 16 200 | 38% | no |
| Pilot whale | SCANS-II/CODA | Plane + ship | 2005 / 2007 | Summer | No specified AU | Design-based | 123 700 | 35% | no | |
| Pilot whale | SCANS-III/ObSERVE | Plane + ship | 2016 | Summer | No specified AU | Design-based | 36 100 | 28% | ||
| Beaked whales (all species) | SCANS-II/CODA | Plane + ship | 2005 / 2007 | Summer | No specified AU | Design-based | 12 900 | 31% | no | |
| Beaked whales (all species) | SCANS-III/ObSERVE | Plane + ship | 2016 | Summer | No specified AU | Design-based | 9 900 | 34% | ||
| Sperm whale | SCANS-III | Plane + ship | 2016 | Summer | No specified AU | Design-based | 17 300 | 40% | no |
Estimate figures rounded to the nearest hundreds.
* post-stratified to correspond exactly to the defined AU.
(Note: The 'Estimate' and 'CV %' for Offshore bottlenose dolphin (SCANS-II / CODA) and White-beaked dolphin (SCANS-III / ObSERVE); the 'CV %' for White-sided dolphin; and the 'Estimate' for Minke whale (SCANS-III / CODA) were amended following the publication of the SCANS-IV report, September 2023).
Harbour porpoise (small toothed-cetacean species group)
Indicator Assessment for this species of small toothed-cetacean was only possible for the North Sea AU (Figure c) which has been surveyed three times. The design-based abundance estimates show a slight increase between 1994 and 2016 (Table d), but the trend was not significant using the robust method for estimating trend on short time-series (Authier et al., 2020). The estimated yearly change (in %) was 0,00 (p-value = 0,93) which is larger than the threshold of -1,6%: the threshold was achieved and no decline in abundance was evidenced for harbour porpoise in the North Sea AU.
Only two abundance estimates were available for the West Scotland and Ireland AU: abundance slightly decreased between 2005 and 2016 (Table d) although no trend was computed and statistical significance was not assessed. The decrease seen between 2005 and 2016 is small, especially compared to the large coefficient of variation of the 2005 estimate (Table d). A qualitative assessment based on the robust evidence provided by the design-based estimates is thus one of no decline in abundance of harbour porpoise in the West Scotland and Ireland AU.
Only two abundance estimates were available for the Celtic and Irish Seas AU: abundance decreased between 2005 and 2016 (Table d) although no trend was computed and statistical significance was not assessed. The decrease seen between 2005 and 2016 is large, approximately 40% (Table d). A qualitative assessment based on the robust evidence provided by the design-based estimates is thus one of a decline in abundance of harbour porpoise in the Celtic and Irish Seas AU. A quantitative assessment against the threshold was not carried out as no trend was estimated on only two estimates. A possible explanation for the decrease may be excessive by-catch (Marine Mammal By-catch (Harbour Porpoise; Common Dolphin; Grey Seal)).
Only two abundance estimates were available for the Iberian Peninsula AU: abundance showed no change between 2005 and 2016 (Table d). The coefficient of variation of the 2005 estimate is, however, quite large and could mask an increase or decrease. A qualitative assessment based on the evidence provided by the design-based estimates is thus one of a decline in abundance of harbour porpoise in the Iberian Peninsula AU.
Short-beaked common dolphin (small toothed-cetacean species group)
One single AU has been defined for this species in the OSPAR Maritime Area (Figure f). The abundance estimate in 2016 is similar to the revised estimate in 2005 / 2007 (Table d). A qualitative assessment based on the robust evidence provided by the design-based estimates is thus one of no decline in abundance of common dolphin in the North-East Atlantic AU. A quantitative assessment against the threshold was not carried out as no trend was estimated on only two estimates.
White-beaked dolphin (small toothed-cetacean species group)
One single AU has been defined for this species in the OSPAR Maritime Area (Figure g). The abundance estimate in 2016 is similar to the estimate in 2005 / 2007 (Table d). An estimate in 1994 is available but only cover a fraction of the AU. A qualitative assessment based on the robust evidence provided by the design-based estimates is thus one of no decline in abundance of white-beaked dolphin in the AU. A quantitative assessment against the threshold was not carried out as no trend was estimated on only two estimates.
White-sided dolphin (small toothed-cetacean species group)
One single AU has been defined for this species in the OSPAR Maritime Area (Figure g). The abundance estimate in 2016 is the first estimate available at the scale of the AU (Table d). No assessment, qualitative or quantitative, is possible with a single estimate.
Coastal bottlenose dolphin (small toothed-cetacean species group)
Eleven AUs have been defined for coastal bottlenose dolphin in the OSPAR Maritime Area (Figure d). The overall population size of coastal bottlenose dolphins in the Greater North Sea, Celtic Seas and Bay of Biscay and Iberian Coast regions is between 3 000 and 4 000 animals. Few locations within the species AUs have been monitored annually. The most extensive assessment was undertaken on the Sado Estuary population in Coastal Portugal AU (Figure q since 1986). This assessment shows that the threshold with a decline of 30% relative to the baseline defined as the level at the start of the time-series, is exceeded. The population, however, has remained stable over the last ten years. Annual mark-recapture estimates for populations in East Coast Scotland since 1990 (Figure r), indicate that the population is stable and may be showing signs of increase and range expansion (Cheney et al. 2018). Estimates from the wider Cardigan Bay in the Irish Sea and Coastal Wales AU (Figure s since 2002), the Shannon Estuary in Coastal Ireland AU (Figure t since 1997), and the Gulf of St Malo including the Channel Islands (Figure u since 2010) and two smaller populations Ile de Sein (since 1992) and the Molene Archipelago (since 1999) in the Coastal Normandy and Brittany AU indicate broadly stable populations. However, a quantitative assessment against the threshold was not carried out as no trend was estimated in locations in other AUs, due to a lack of abundance estimates. A summary of available data and population trends is shown in Table e.
 in the Sado Estuary.")
Figure q: Estimates of bottlenose dolphin abundance (number of individuals) in the Sado Estuary.
 in the East Coast Scotland AU. Dashed lines indicate 95% HPDI.")
Figure r: Estimates of bottlenose dolphin abundance (number of individuals) in the East Coast Scotland AU. Dashed lines indicate 95% HPDI.
 in the Wider Cardigan Bay. Dashed lines indicate 95% confidence intervals.")
Figure s: Estimates of bottlenose dolphin abundance (number of individuals) in the Wider Cardigan Bay. Dashed lines indicate 95% confidence intervals.
 in the Shannon Estuary Special Area of Conservation. Dashed lines indicate 95% confidence intervals.")
Figure t: Estimates of bottlenose dolphin abundance (number of individuals) in the Shannon Estuary Special Area of Conservation. Dashed lines indicate 95% confidence intervals.
 in the Normano-Breton Gulf. Dashed lines indicate 95% confidence intervals.")
Figure u: Estimates of bottlenose dolphin abundance (number of individuals) in the Normano-Breton Gulf. Dashed lines indicate 95% confidence intervals.
| Assessment Unit | Quality of time series | Population trend | |
|---|---|---|---|
| ≥ 10 year | ≥4 abundance estimates | ||
| Coastal West Scotland and Hebrides | No | No | No assessment |
| Coastal East Scotland | Yes | Yes | Increase |
| Irish Sea and coastal Wales | Yes | Yes | Stable |
| West coast of Ireland | Yes | Yes | Stable |
| Coastal West Channel | No | No | No assessment |
| Coastal Normandy and Brittany | No | Yes | Indicative:stable |
| Northern Spain | No | No | No assessment |
| Southern Galician Rias (Spain) | No | No | No assessment |
| Coastal Portugal | No | No | No assessment |
| Coastal Portugal (Sado Estuary) | Yes | Yes | Decline |
| Gulf of Cadiz | No | No | No assessment |
Offshore bottlenose dolphin (small toothed-cetacean species group)
One single AU has been defined for this species in the OSPAR Maritime Area (Figure e). The North-East Atlantic AU has only been partially covered, the abundance estimate for this area in 2016 is higher than the estimate in 2005 / 2007 (Table d). This increase exceeds natural growth rates for a closed population, and is probably due to immigration from Atlantic waters outside the surveyed area. A quantitative assessment against the threshold was not carried out as no trend was estimated on only two estimates.
Striped dolphin (small toothed-cetacean species group)
There is no defined AU for this species. The abundance estimate in 2016 is larger than the revised estimate in 2005 / 2007 (Table d). The coefficient of variation associated with the latter is large. A qualitative assessment based on the evidence provided by the design-based estimates is thus one of no decline in abundance of striped dolphin in the North-East Atlantic AU. A quantitative assessment against the threshold was not carried out as there is no defined AU and no trend was estimated on only two estimates.
Minke whale (baleen whale species group)
One single AU has been defined for this species in the OSPAR Maritime Area (Figure f). The abundance estimate in 2016 is similar to the estimate in 2005 / 2007 (Table d). A qualitative assessment based on the robust evidence provided by the design-based estimates is thus one of no decline in abundance of minke whale in the North-East Atlantic AU. A quantitative assessment against the threshold was not carried out as no trend was estimated on only two estimates.
Fin whale (baleen whale species group)
Three AU has been defined by the International Whaling Commission for this species in the OSPAR Maritime Area (Figure h). The abundance estimate in 2016 for each AU is reported in Table d. The AU covering the Greater North Sea subregion is the one that has been covered by all SCANS surveys, but no sighting of fin whales was made. The vast majority sightings of fin whales were made in the southern most AU (AU ’Sp’, Figure h). In 2007, many sightings of fin whales were also made in this AU, along with sighting of unidentified large whales (Hammond et al., 2021). At the scale of the North-East Atlantic, and taking into account unidentified large whales (under the assumption that they correspond to fin whales), no change in abundance between 2007 and 2016 is evidenced (Hammond et al., 2021).
Risso’s dolphin (deep-diver species group)
There is no defined AU for this species. The abundance estimate in 2016 is reported in Table d. Without a defined AU and with only a single estimate, no assessment, qualitative or quantitative, is possible.
Long-finned pilot whale (deep-diver species group)
There is no defined AU for this species. The abundance estimates in 2005 / 2007 and 2016 are reported in Table d: the latter is considerably smaller than the former, and could be due to population movement across the wider North Atlantic. Without a defined AU, however, no assessment, qualitative or quantitative, is possible.
Beaked whales (all species; deep-diver species group)
There is no defined AU for this species. The abundance estimates in 2005 / 2007 and 2016 are similar (Table d) with the latter somewhat smaller than the former. The associated coefficient of variation of the two estimates are comparable and result in a large overlap once uncertainty is taken into account. Without a defined AU, no assessment, qualitative or quantitative, is possible.
Sperm whale (deep-diver species group)
There is no defined AU for this species. The abundance estimate in 2016 is reported in Table d. Without a defined AU and with only a single estimate, no assessment, qualitative or quantitative, is possible.
Conclusion
Cetaceans are widely distributed in a range of habitats and are overall abundant throughout the OSPAR Maritime Area. For most species there are less than two comparable estimates of abundance and a robust trend assessment is not possible. The longer time series of estimates for harbour porpoise in the Greater North Sea AU show no evidence of change in abundance since 1994. In that same AU, a substantial southward shift in harbour porpoise distribution occurred between 1994 and 2005, and was maintained in 2016. There is a continued need for large-scale surveys, ideally undertaken more frequently than to date and with a timing matching the next assessment cycle, to increase sample size and the power to detect trends for other species than harbour porpoise in the Greater North Sea.
Most populations of coastal bottlenose dolphins in the areas assessed are relatively small. In many coastal areas of the North-East Atlantic Ocean, populations declined or disappeared during the 19th and 20th centuries. Where trends can be assessed, the remaining populations show little long-term change with the exception of the declining population in the Sado Estuary in Portugal.
In the Greater North Sea subregion, only harbour porpoise, white-beaked dolphin and minke whale have more than two estimates of abundance, but there is no evidence that numbers have declined (or increased) since 1994. However, only for the harbour porpoise does this subregion maps to a species’ AU. For all other AU of harbour porpoise and all other species of cetaceans (excluding coastal bottlenose dolphins), no quantitative assessment could be carried out, either due to a shortage of abundance estimates or due to no defined AU. Given the limited number of estimates in the time series and the precision of the estimates, the power to detect trends is low.
Qualitative assessments were nevertheless provided when possible and with caveats. A possible decline in abundance of harbour porpoises in the Celtic and Irish Seas AU is suggested by the available evidence: if true, this decline would amount to an annual rate of approximatively -7%, exceeding the threshold of -1,6% for this species (Table b). This decline may be linked to excessive incidental by-catch (Marine Mammal By-catch (Harbour Porpoise, Common Dolphin, Grey Seal)). No change in abundance was evidenced for harbour porpoises in the West Scotland and Ireland AU or for the subspecies occurring in the Iberian Peninsula AU. For many species with defined AUs (short-beaked common dolphin, white-beaked dolphin, minke whales, fin whales) no evidence of change in abundance was found in the available data. In the case of offshore bottlenose dolphins, a large increase in abundance between 2005 / 2007 and 2016 is suggested by the available evidence, although the causes behind such a large increase are unknown but require immigration as the increase exceeds plausible natural rates of increase for a closed population. For species without defined AU, the abundance of long-finned pilot whales decreased in the surveyed OSPAR Maritime Area: this decrease could be due to emigration outside this area, possibly due to spatial variation in prey availability (Hammond et al., 2021).
Currently, bottlenose dolphins occupying coastal waters of western Europe are estimated to number at 3 000 to 4 000 individuals. In assessment units for which there are sufficient data, estimated trends show little change, with the exception of the Sado Estuary population within the Coastal Portugal AU, which continues to decline. Several estuaries and enclosed bays that were historically inhabited by bottlenose dolphin populations are no longer inhabited by this species. Some of these losses occurred over a century ago, while others are more recent. Coastal bottlenose dolphins disappeared from the Southern North Sea around the late 1960s.
Some local populations comprise 200 to 400 individuals, although some have less than 50. The Sado Estuary population is particularly vulnerable to local extinction given both its small population size and steady decline.
Confidence Statements
The assessment is undertaken using data on marine mammal abundance with a spatial coverage and temporal extent that is mostly sufficient for the area assessed. There remain substantial gaps in coverage resulting in a low data availability for offshore areas and in the winter season in particular. For these reasons, data availability is low to moderate.
The data availability for coastal bottlenose dolphins is low to moderate. Data on abundance are available for a limited number of coastal populations, and for a limited time period.
There is moderate / low confidence in the methodology used in this assessment. There is consensus within the scientific community regarding this methodology. However, as the method has been developed specifically for this assessment and not been more widely used it is considered moderate / low.
Knowledge Gaps
Historical data on abundance and distribution of cetaceans are scarce. For most species, fewer than three abundance estimates are available at the scale of AUs. Only one wide-ranging species was quantitatively assessed, and only in one AU. Large-scale surveys have, to date, been undertaken during summer, resulting in little seasonal information at AU scale.
The collation and regular update of data from other large-scale surveys, and their careful analysis with robust models, will help address knowledge gaps in the future.
More than half of the coastal bottlenose dolphin AUs could not be quantitatively assessed because of a lack of abundance estimates.
Time series of information to assess status
Many cetacean populations range over very large areas and, even though some species are very abundant, these large ranges mean that densities are typically very low. In addition, all cetaceans spend the large majority of their lives underwater and so are difficult to observe. Surveys to obtain robust information over the large scale are both logistically challenging and expensive to undertake and, as a result, there have been few in the region. The large-scale surveys covering a large proportion of North-East Atlantic waters have been organised only four times: SCANS in 1994, 2005 and 2016; CODA in 2007; A fourth SCANS survey is currently considered for the summer 2022. Although there have been some additional valuable and more frequent systematic aerial surveys generating robust information for the southern and central North Sea (Gilles et al., 2016, Nachtsheim et al. 2021), in general the time series of coordinated purpose-designed surveys for cetaceans is still too short to allow status to be assessed in relation to both indicators of abundance and distribution. The preferred option would be to establish a European Atlantic-wide framework to determine abundance and trends in cetacean populations to provide a mechanism for using appropriate available and newly commissioned data.
For species such as killer whales with small-scale features in distribution and abundance, additional studies are needed to estimate abundance using e.g. photographic capture-recapture (Jourdain et al., 2019).
For species with an offshore distribution that occur outside the Greater North Sea, Celtic Seas, and Bay of Biscay and Iberian Coast, coordination with other survey programmes such as the six-yearly NASS surveys in central North Atlantic waters and the Norwegian ‘mosaic’ NILS surveys that cover the North- East North Atlantic is desirable.
Another option is to further pursue a coordinated approach to collate and standardise effort-related cetacean sightings data across the OSPAR Maritime Area. This is currently being undertaken by the Joint Cetacean Data Protocol (JCDP; https://jncc.gov.uk/our-work/joint-cetacean-data-programme/) whose aims are to develop (i) an international platform to host cetacean survey datasets from the North-East Atlantic and (ii) a data standard. The JCDP aims to streamline the process of accessing and utilising cetacean survey data for a wide range of applications and its launching in 2022 will facilitate future data calls.
Lack of seasonal information at an appropriately large scale
For logistical reasons, large-scale surveys such as SCANS have been conducted during summer. Information is therefore lacking on large-scale seasonal changes in distribution. However, seasonal variation in distribution and abundance at a smaller spatial scale is available from some national survey programmes (e.g., Belgium, Denmark, France, Ireland, the Netherlands, Germany). In some cases, these surveys are coordinated. To obtain better information about seasonal variation in distribution and abundance, consideration needs to be given to the extension to wider areas and to the better coordination of smaller-scale surveys in time and space. The Joint Cetacean Protocol initiative could also be valuable in this respect. The data collated by OMMEG clearly illustrate this imbalance in sampling with respect to season (Figure ab).

Figure ab: Seasonal imbalance in line-transect surveys of cetaceans in the OSPAR maritime area.
Information on historical distribution and abundance of coastal bottlenose dolphins are scarce or lacking. There are some published accounts, but much of the information is anecdotal. Assessments can only be made for five AUs of coastal bottlenose dolphin as monitoring has not been undertaken for a sufficiently long period of time (i.e., at least ten years, with a minimum of four abundance estimates during that period; Table d).
Assessment Units
Several species have no defined AU which prevented Indicator Assessment. AU delineation is required to enable consistent monitoring and interpretation of variations in abundance over time. This is clearly challenging for wide-ranging and highly mobile species: for example, the decrease in long-finned pilot whales and the increase in offshore bottlenose dolphins between 2005 / 2007 and 2016 are too large in magnitude for closed populations. Migration in and out of the area are likely to contribute to the observed changes.
Defining AUs at an appropriate scale for bottlenose dolphin is challenging. While the bottlenose dolphin was subdivided into two groups (coastal and offshore) in future assessments the species could be divided into three groups related to their patterns of mobility and habitat use: truly resident in a small area; coastal - ranging over a larger area; and oceanic or offshore. The connectivity between the different groups is poorly understood, although they are considered to be distinct populations. As a result, within the AUs identified for coastal bottlenose dolphins, the smaller resident populations have often been included. In addition, where coastal and offshore populations mix, it is often difficult to identify which population has been surveyed.
Amstrup, S.C., McDonald, T.L., Manly, B.J.F. 2010. Handbook of Capture-Recapture Analysis. Princeton University Press. 1st Edition. 494 pages.
ASCOBANS, 2021. Mass Killing of the Atlantic White-sided Dolphin (Lagenorhynchus acutus) in the Faroe Islands in September 2021. ASCOBANS/AC26/Inf.4.2. 3 pages.
Astarloa, A., Louzao, M., Andrade, J., Berrow, S., Boisseau, O., Brereton, T., Dorémus, G., Evans, P., Babey, L., Hodgins, N., Lewis, M., Martinez-Cedeira J. Pinsky, M., Ridoux, V., Saavedra, C., Santos, B., Thorson, J.T., Waggitt, J., Wall, D. and Chust, G. 2021. The Role of Climate, Oceanography, and Prey in Driving Decadal Spatio-Temporal Patterns of a Highly Mobile Top Predator. Frontiers in Marine Science, 1463.
Authier, M., Galatius, A., Gilles, A. & Spitz, J. 2020. Of Power and Despair in Cetacean Conservation: Estimation and Detection of Trend in Abundance with Noisy and Short Time-Series. PeerJ, 8, e9436.
Authier, M., Saraux, C., & Péron, C. 2017. Variable selection and accurate predictions in habitat modelling: A shrinkage approach. Ecography, 40(4), 549–560.
Authier, M.; Peltier, H.; Dorémus, G.; Dabin, W.; Van Canneyt, O. and Ridoux, V. (2014) How Much Are Stranding Records Affected by Variation in Reporting Rates? A Case Study of Small Delphinids in the Bay of Biscay. Biodiversity and Conservation, 23, 2591-2612.
Bearzi, G. and Reeves, R. R. 2021. Shifting Baselines of Cetacean Conservation in Europe. ICES Journal of Marine Science, 78, 2337-2341.
Booth, C.G., Embling, C., Gordon, J., Calderan, S.V. and Hammond, P.S. 2013. Habitat preferences and distribution of harbour porpoise Phocoena phocoena west of Scotland. Marine Ecology Progress Series, 478, 273–285.
Bouchet, P.J., Miller, D.L., Roberts, J.J., Mannocci, L., Harris, C.M. and Thomas, L. 2019. From Here and Now to There and Then: Practical Recommendations for Extrapolating Cetacean Density Surface Models to Novel Conditions. University of Saint Andrews.
Bravington, M.V., Miller, D.L. and Hedley, S.L. 2021. Variance Propagation for Density Surface Models. Journal of Agricultural, Biological, and Environmental Statistics, 6, 306-323.
Brown, S.G. 1976. Modern whaling in Britain and the north-east Atlantic Ocean. Mammal Review, 6(1), 25-36. Available at: https://doi.org/10.1111/j.1365-2907.1976.tb00198.x.
Buckland, S.T., Anderson, D.R., Burnham, K.P., Laake, J.L., Borchers, D.L. and Thomas, L. 2001. Introduction to Distance Sampling: estimating abundance of biological populations. Oxford University Press. 432 pages.
Cheney, B., Graham, I. M., Barton, T. R., Hammond, P. S. and Thompson, P. M. 2018. Site Condition Monitoring of bottlenose dolphins within the Moray Firth Special Area of Conservation: 2014–2016. Scottish Natural Heritage Research Report No. 1021. Available at: https://www.nature.scot/sites/default/files/2018-04/Publication%202018%20-%20SNH%20Research%20Report%201021%20-%20Site%20Condition%20Monitoring%20of%20bottlenose%20dolphins%20within%20the %20Moray%20Firth%20Special%20Area%20of%20Conservation%202014-2016.pdf.
CODA, 2009. Cetacean Offshore Distribution and Abundance in the European Atlantic (CODA), 43pp.
EEA. 2020. State of nature in the EU - Results from reporting under the nature directives 2013-2018. EEA Report No 10/2020. 142 pages. Available at: https://doi.org/10.2800/088178
Eilers, P.H.C. and Marx, B.D. 2010. Splines, Knots, and Penalties. WIREs Computational Statistics, 2, 637-653.
Embling, C.B., Gillibrand, P.A., Gordon, J., Shrimpton, J., Stevick, P.T. and Hammond, P.S. 2010. Using habitat models to identify suitable sites for marine protected areas for harbour porpoise (Phocoena phocoena). Biological Conservation, 143, 267-279.
Evans, P.G.H. 2020. Systematic list of European cetacean species in European Whales, Dolphins, and Porpoises. pages 73-157. 10.1016/B978-0-12-819053-1.00004-1.
Evans, P.G.H. and Teilmann, J. (editors) 2009. Report of ASCOBANS/HELCOM Small Cetacean Population Structure Workshop. ASCOBANS/UNEP Secretariat, Bonn, Germany. 140 pp.
Evans, P.G.H., Anderwald, P., and Baines, M.E. 2003. UK Cetacean Status Review. Report to English Nature and the Countryside Council for Wales. Sea Watch Foundation, Oxford. 160 pages.
Fontaine, M.C., Tolley, K.A., Siebert, U., Gobert, S., Lepoint, G., Bouquegneau, J.-M. and Das, K. 2007. Long-term feeding ecology and habitat use in harbour porpoises Phocoena phocoena from Scandinavian waters inferred from trace elements and stable isotopes. BMC Ecology, 7, 1. Available at: https://doi.org/10.1186/1472-6785-7-1
García-Barón, I., Authier, M., Caballero, A., Vázquez Bonales, A.J., Santos, M.B., Murcia, J.L. and Louzao, M. 2019. Modelling the Spatial Abundance of a Migratory Predator: A Call for Transboundary Marine Protected Areas. Diversity and Distributions, 25, 346-360.
Gilles, A., Adler, S., Kashner, K., Scheidat, M. and Siebert, U. 2011. Modelling harbour porpoise seasonal density as a function of the German Bight Environment: implications for management. Endangered Species Research., 14, 157-169.
Gilles, A., Scheidat, M. and Siebert, U. 2009. Seasonal distribution of harbour porpoise and possible interference of offshore wind farms in the German North Sea. Marine Ecology Progress Series, 383, 295-307.
Gilles, A., Viquerat, S., Becker, E.A., Forney, K.A., Geelhoed, S.C.V., Haelters, J., Nabe-Nielsen, J., Scheidat, M., Siebert, U., Sveegaard, S., van Beest, F.M., van Bemmelen, R. and Aarts, G. 2016. Seasonal habitat-based density models for a marine top predator, the harbor porpoise, in a dynamic environment. Ecosphere, 7 (6), e01367. 10.1002/ecs2.1367.
Haelters, J., Kerckhof, F., Jacques, T.G. and Degraer, S. 2011. The harbour porpoise, Phocoena phocoena in the Belgian part of the North Sea: trends in abundance and distribution. Belgian Journal of Zoology, 141, 75-84.
Hammond, P., Macleod, K., Berggren, P., Borchers, D., Burt, L., Cañadas, A., Desportes, G., Donovan, G., Gilles, A., Gillespie, D., Gordon, J., Hiby, L., Kuklik, I., Leaper, R., Lehnert, K., Leopold, M., Lovell, P., Øien, N., Paxton, C., Ridoux, V., Rogan, E., Samarra, F., Scheidat, M., Sequeira, M., Siebert, U., Skov, H., Swift, R., Tasker, M., Teilmann, J., Van Canneyt, O. and Vázquez, J. 2014. Large Scale Survey for Cetaceans: Line Transect Assumptions, Reliability of Abundance Estimate and Improving Survey Efficiency - A Response to MacLeod. Biological Conservation 170, 1-2.
Hammond, P.S, Macleod, K., Berggren, P., Borchers, D., Burt, L., Cañadas, A., Desportes, G., Donovan, G. P. , Gilles, A., Gillespie, D., Gordon, J., Hiby, L., Kuklik, I., Leaper, R; Lehnert, K., Leopold, M., Lovell, P.; Øien, N., Paxton, C. G., Ridoux, V., Rogan, E., Samarra, F., Scheidat, M., Sequeira, M., Siebert, U., Skov, H., Swift, R., Tasker, M. L., Teilmann, J., Van Canneyt, O. and Vázquez, J. A. 2013. Cetacean abundance and distribution in European Atlantic shelf waters to inform conservation and management. Biological Conservation 164, 107–122.
Hammond, P.S. 1986. Estimating the size of naturally marked whale populations using capture-recapture techniques. Reports of the International Whaling Commission (Special Issue 8), 253-282.
Hammond, P.S., Berggren, P., Benke, H., Borchers, D.L., Collet, A., Heide-Jørgensen, M.P., Heimlich, S., Hiby,A.R., Leopold, M.F. and Øien, N. 2002. Abundance of harbour porpoises and other cetaceans in the North Sea and adjacent waters. Journal of Applied Ecology, 39, 361-376.
Hammond, P.S., Lacey, C., Gilles, A., Viquerat, S., Börjesson, P., Herr, H., Macleod, K., Ridoux, V., Santos, M.B., Scheidat, M., Teilmann, J., Vingada, J. and Øien, N. 2021. Estimates of cetacean abundance in European Atlantic waters in summer 2016 from the SCANS-III aerial and shipboard surveys. SCANS III final report. 41 pages.
Hammond, P.S., Macleod, K., Burt, L., Cañadas, A., Lens, S., Mikkelsen, B., Rogan, E., Santos, B., Uriarte, A., Van Canneyt, O. and Vazquez, J.A. 2011. Abundance of baleen whales in the European Atlantic. Paper SC/63/RMP24 presented to the Scientific Committee of the International Whaling Commission. Unpublished.
Hammond, P.S., Northridge, S.P., Thompson, D., Gordon, J.C.D., Hall, A.J., Murphy, S.N. and Embling, C.B. 2008. Background information on marine mammals for Strategic Environmental Assessment 8. Report to the Department for Business, Enterprise and Regulatory Reform. Sea Mammal Research Unit, St Andrews, Scotland, UK, 52 pp.
Hartman, K.L. 2018. Risso’s dolphin. Pp. 824-827. In: Encyclopedia of Marine Mammals (Editors Würsig, B., Thewissen, J.G.M. Kovacs, K.M.). 3nd edition. Academic Press, London.
Heinänen, S. and Skov, H. 2015. The identification of discrete and persistent areas of relatively high harbour porpoise density in the wider UK marine area, JNCC Report No.544 JNCC, Peterborough.
Hiby, A.R. and Hammond, P.S. 1989. Survey techniques for estimating abundance of cetaceans. Reports of the International Whaling Commission Special Issue 11, 47-80.
Hiby, A.R. and Lovell, P., 1998. Using aircraft in tandem formation to estimate abundance of harbour porpoise. Biometrics 54, 1280-1289.
Hiby, L., 1999. The objective identification of duplicate sightings in aerial survey for porpoise, in: Garner, G.W., Amstrup, S.C., Laake, J.L., Manly, B.F.J., McDonald, L.L. and Robertson, D.G. (Eds.), Marine Mammal Survey and Assessment Methods. Balkema, Rotterdam, pp. 179-189.
Hoenig, J. M. & Heisey, D. M. 2001. The Abuse of Power: the Pervasive Fallacy of Power Calculations for Data Analysis. The American Statistician, 55, 19-24.
IAMMWG. 2015. Management Units for cetaceans in UK waters (January 2015). JNCC Report No. 547, JNCC Peterborough. Available at: https://data.jncc.gov.uk/data/f07fe770-e9a3-418d-af2c-44002a3f2872/JNCC-Report-547-FINAL-WEB.pdf.
ICES, 2013. Report of the Working Group on Marine Mammal Ecology (WGMME), 4-7 February 2013, Paris, France. ICES CM 2013/ACOM:26. 117 pp.
ICES, 2014. OSPAR request on implementation of MSFD for marine mammals. Special request. In: Report of the ICES Advisory Committee, 2014. ICES Advice 2014, Book 1, Section 1.6.6.1.
ICES, 2019. Report of the Working Group on Marine Mammal Ecology (WGMME). 11--14 February 2019, Büsum, Germany. ICES Scientific Reports. 1:22. 131 pp.ICES. 2021. Working Group on Marine Mammal Ecology (WGMME). ICES Scientific Reports. 3:19. 155 pp. Available at: https://doi.org/10.17895/ices.pub.8141.
IJsseldijk, L L., ten Doeschate, M.T.I., Brownlow, A., Davison, N.J., Deaville, R., Galatius, A., Gilles, A., Haelters, J., Jepson, P.D., Keijl, G.O., Kinze, C.C., Olsen, M.T. Siebert, U., Thøstesen, C.B., van den Broek, J., Gröne, A. and Heesterbeek, H. 2020. Spatiotemporal mortality and demographic trends in a small cetacean: Strandings to inform conservation management. Biological Conservation 249, 108733.
Isojunno, S., Matthiopoulos, J. and Evans, P.G.H. 2012. Harbour porpoise habitat preferences: Robust spatio-temporal inferences from opportunistic data. Marine Ecology Progress Series, 448, 155-170.
JNCC (Joint Nature Conservation Committee), 2013. Third Report by the UK under Article 17 on the implementation of the Habitats Directive from January 2007 to December 2012. Peterborough: JNCC. Available at: www.jncc.gov.uk/article17.
Jourdain, E., Ugarte, F., Víkingsson, G. A., Samarra, F. I. P., Ferguson, S. H., Lawson, J., Vongraven, D. and Desportes, G. 2019 North Atlantic Killer Whale Orcinus orca Populations: a Review of Current Knowledge and Threats to Conservation. Mammal Review 49, 385-400.
King, G. and Zeng, L. 2007. When Can History Be Our Guide? The Pitfalls of Counterfactual Inference. International Studies Quarterly, 51(1), 183–210.
Kopf, R. K.; Finlayson, M.; Humphries, P.; Sims, N. C. and Hladyz, S. 2015. Anthropocene Baselines: Assessing Change and Managing Biodiversity in Human-Dominated Aquatic Ecosystems. BioScience, 65, 798-811.
Lacey, C., Hammond, P.S., Gilles, A., Börjesson, P., Herr, H., Macleod, K., Ridoux, V., Santos, M.B., Scheidat, M., Teilmann, J., Vingada, J., Viquerat, S. and Øien, N. 2021. Modelled density surfaces of cetaceans in European Atlantic waters in summer 2016 from the SCANS-III aerial and shipboard surveys. 30 pages.
Laran, S., Authier, M., Blanck, A., Doremus, G., Falchetto, H., Monestiez, P., Pettex, E., Stephan, E., Van Canneyt. O. and Ridoux, V. 2017. Seasonal distribution and abundance 1 of cetaceans within French waters: Part II: The Bay of Biscay and the English Channel. Deep Sea Research II, 141, 31-40.
Link, W. and Sauer, J. 1997. New Approaches to the Analysis of Population Trends in Land Birds: Comment. Ecology, 78, 2632-2634.
MacLeod, C.D. et al. 2008. Temperature-based summer habitat partitioning between white-beaked and common dolphins around the United Kingdom and Republic of Ireland. Journal of the Marine Biological Association of the United Kingdom, 88, 1193–1198.
MacLeod, K. 2004. Abundance of Atlantic white-sided dolphin (Lagenorhynchus acutus) during summer off northwest Scotland. Journal of Cetacean Research and Management, 6(1), 33-40.
MAGRAMA, 2012. Estrategias Marinas: Evaluación Inicial, Buen Estado Ambiental y Objetivos Ambientales. Ministerio de Agricultura, Alimentación y Medio Ambiente, 287 pp. Available at: http://www.magrama.gob.es/es/costas/temas/estrategias- marinas/0_documento_marco_estrategias_marinas_tcm7-204388.pdf.
Marubini, F., Gimona, A., Evans, P.G.H., Wright, P.J. and Pierce, G.J. 2009. Habitat preferences and interannual variability in occurrence of the harbour porpoise Phocoena phocoena in the north-west of Scotland. Marine Ecology Progress Series, 381, 297-310.
Miller, D., Burt, M., Rexstad, E. and Thomas, L. 2013. Spatial Models for Distance Sampling Data: Recent Developments and Future Directions. Methods in Ecology and Evolution, 4, 1001-1010.
Murphy, S., Evans, P.G.H., Pinn, E. and Pierce, G.J. 2021. Conservation Management of Common Dolphins: Lessons Learned from the North-East Atlantic. Aquatic Conservation, 31, 137-166.
Murphy, S., Pinn, E.H. and Jepson, P.D. 2013. The short-beaked common dolphin (Delphinus delphis) in the North-Eastern Atlantic: distribution, ecology, management and conservation status. Oceanography and Marine Biology: An Annual Review, 51, 193-280.
Nachtsheim, D. A., Viquerat, S., Unger, B., Ramírez-Martínez, N. C., Siebert, U. and Gilles, A. 2021. Small cetacean in a human high-use area: Trends in harbour porpoise abundance in the North Sea over two decades. Frontiers in Marine Science, 7, 1135.
North Atlantic Marine Mammal Commission and the Norwegian Institute of Marine Research 2019. Report of Joint IMR/NAMMCO International Workshop on the Status of Harbour Porpoises in the North Atlantic, Tromsø, 236 pages.
Panigada, S. et al., 2008. Modelling habitat preferences for fin whales and striped dolphins in the Pelagos Sanctuary (Western Mediterranean Sea) with physiographic and remote sensing variables. Remote Sensing of Environment, 112(8), 3400–3412.
Peschko, V., Ronnenberg, K., Siebert, U. and Gilles, A. 2016. Trends of Harbour Porpoise (Phocoena phocoena) Density in the Southern North Sea. Ecological Indicators, 60, 174-183.
Pierpoint, C. 2008. Harbour porpoise (Phocoena phocoena) foraging strategy at a high energy near-shore site in south-west Wales, UK. Journal of the Marine Biological Association of the United Kingdom, 88, 1167–1173.
Pirotta, E., Booth, C. G., Costa, D. P., Fleishman, E., Kraus, S. D., Lusseau, D., Moretti, D., New, L. F., Schick, R. S., Schwarz, L. K., Simmons, S. E., Thomas, L., Tyack, P. L., Weise, M. J., Wells, R. S. and Harwood, J. 2018. Understanding the Population Consequences of Disturbance. Ecology and Evolution 8, 9934-9946.
Reid, J.B., Evans, P.G.H. and Northridge, S.P. 2003. Atlas of Cetacean distribution in north-west European waters, Joint Nature Conservation Committee, Peterborough, ISBN 1 86107 550 2. 77 pages.
Rogan, E., Breen, P., Mackey, M., Cañadas, A., Scheidat, M., Geelhoed, S.C.V. and Jessopp, M. 2018. Aerial Surveys of Cetaceans and Seabirds in Irish waters: Occurrence, distribution and abundance in 2015-2017. Department of Communications, Climate Action & Environment and National Parks and Wildlife Service (NPWS), Department of Culture, Heritage and the Gaeltacht, Dublin, Ireland. 298 pages.
Rogan, E., Canadas, A., Macleod, K., Santos, B., Mikkelsen, B., Uriarte, A., Van Canneyt, O., Vazquez, J.A. and Hammond, P.S. 2017. Distribution, abundance and habitat use of deep diving cetaceans in the North East Atlantic. Deep Sea Research II, 141, 8-19.
Saavedra, C., Gerrodette, T., Louzao, M., Valeiras, J., García, S., Cerviñoa, S., Pierce, G.J. and Santos, M.B. 2018. Assessing the Environmental Status of the Short-Beaked Common Dolphin (Delphinus delphis) in North-western Spanish Waters using Abundance Trends and Safe Removal Limits. Progress in Oceanography, 166, 65-75.
Scheidat, M., Verdaat, H. and Aarts, G., 2012. Using aerial surveys to estimate density and distribution of harbour porpoises in Dutch waters. Journal of Sea Research, 69, 1-7.
Smith, T. D., Reeves, R. R., Josephson, E. A. and Lund, J. N. 2012. Spatial and Seasonal Distribution of American Whaling and Whales in the Age of Sail. PLoS One 7, e34905.
Sveegaard, S., Galatius, A., Dietz, R., Kyhn, L., Koblitz, J.C., Amundin, M., Nabe-Nielsen, J., Sinding, M.-H.S., Andersen, L.W. and Teilmann, J. 2015. Defining management units for cetaceans by combining genetics, morphology, acoustics and satellite tracking. Global Ecology and Conservation, 3, 839–850. Available at: https://doi.org/10.1016/j.gecco.2015.04.002
Taylor, B.L., Chivers, S.J., Larese, J. and Perrin, W.F. 2007. Generation length and percent mature estimates for IUCN assessments of cetaceans. IUCN report. 24 pages. Available at: http://aquaticcommons.org/27111/1/LJ-07-01.pdf.
Ten Doeschate, M., Brownlow, A., Davison, N. and Thompson, P. 2018. Dead useful; methods for quantifying baseline variability in stranding rates to improve the ecological value of the strandings record as a monitoring tool. Journal of the Marine Biological Association of the United Kingdom 98(5), 1205-1209. https://doi.org/10.1017/S0025315417000698
Viquerat, S., Herr, H., Gilles, A., Peschko, V., Siebert, U., Sveegaard, S., Teilmann, J. 2014. Abundance of harbour porpoises (Phocoena phocoena) in the western Baltic, Belt Seas and Kattegat. Marine Biology 161, 745-754. Available at: https://doi.org/10.1007/s00227-013-2374-6
Virgili, A., Authier, M., Boisseau, O., Cañadas, A., Claridge, D., Cole, T., Corkeron, P., Dorémus, G., David, L., Di-Méglio, N., Dunn, C., Dunn, T.E., García-Barón, I., Laran, S., Lauriano, G., Lewis, M., Louzao, M., Mannocci, L., Martínez-Cedeira, J., Palka, D., Panigada, S., Pettex, E., Roberts, J.J., Ruiz, L., Saavedra, C., Santos, M.B., Van Canneyt, O., Vázquez Bonales, A.J., Monestiez, P. and Ridoux, V. 2019. Combining Multiple Visual Surveys to Model the Habitat of Deep-Diving Cetaceans at the Basin Scale. Global Ecology and Biogeography, 23, 300-314.
Waring, G.T., Palka, D.L. and Evans, P.G.H. 2009. North Atlantic Marine Mammals. Pp. 763-771. In: Encyclopedia of Marine Mammals (Editors W.F. Perrin, B. Würsig and J.G.M. Thewissen). 2nd edition. Academic Press, San Diego.
Contributors
Lead Authors: Steve Geelhoed, Matthieu Authier.
Supporting Authors: Rémi Pigeault (data analyses), Anita Gilles. Julia Carlström, Peter Evans, Jan Haelters, Phil Hammond, Maite Louzao, Emer Rogan, Camilo Saavedra, Signe Sveegaard, António Teixeira.
Supported by: OSPAR Marine Mammal Expert Group (OMMEG), Intersessional Correspondence Group on the Coordination of Biodiversity Assessment and Monitoring (ICG-COBAM), OSPAR Biodiversity Committee (BDC)
Citation
Geelhoed, S.C.V., Authier, M., Pigeault, R., Gilles, A. 2022. Abundance and Distribution of Cetaceans. In: OSPAR, 2023: The 2023 Quality Status Report for the Northeast Atlantic. OSPAR Commission, London. Available at: https://oap.ospar.org/en/ospar-assessments/quality-status-reports/qsr-2023/indicator-assessments/abundance-distribution-cetaceans/
| Assessment type | Indicator Assessment |
|---|---|
| Summary Results | https://odims.ospar.org/en/submissions/ospar_abun_dist_msfd_2022_06/ |
| SDG Indicator | 14.2 By 2020, sustainably manage and protect marine and coastal ecosystems to avoid significant adverse impacts, including by strengthening their resilience, and take action for their restoration in order to achieve healthy and productive oceans |
| Thematic Activity | Biological Diversity and Ecosystems |
| Relevant OSPAR Documentation | OSPAR Agreement 2018-09 CEMP Guideline: M4 Common indicator: Abundance and distribution at the relevant spatio-temporal scale of cetacean species regularly present (M4). https://www.ospar.org/documents?v=39019 |
| Date of publication | 2022-06-30 |
| Conditions applying to access and use | https://oap.ospar.org/en/data-policy/ |
| Data Snapshot | https://github.com/osparcomm/Abundance-and-Distribution-of-Cetaceans |
| Data Results | https://github.com/osparcomm/Abundance-and-Distribution-of-Cetaceans/tree/main/data |
| Data Source | https://www.emodnet-bathymetry.eu/ |
| Data Source | https://resources.marine.copernicus.eu |