

Concentrations of Chlorophyll-a in the Greater North Sea, Celtic Seas and Bay of Biscay and Iberian Coast
Background
OSPAR’s strategic objective with regard to eutrophication in the OSPAR Maritime Area is to tackle eutrophication, through limiting inputs of nutrients and organic matter to levels that do not give rise to adverse effects on the marine environment. Chlorophyll a is one of a suite of four eutrophication indicators. When assessed and considered together in the OSPAR Common Procedure in a multi-step method, the suite can be used to diagnose eutrophication.
Elevated levels of phytoplankton biomass can be a direct effect of nutrient enrichment. Chlorophyll-a is measured as a proxy for the (carbon) biomass of phytoplankton. An image of the OSPAR Maritime Area based on satellite data shows the spatial distribution of chlorophyll-a during the phytoplankton spring bloom (monthly mean concentration for April 2020 (Figure 1)). The highest chlorophyll-a concentrations are found in coastal waters and river plumes.
 in April 2020 during the spring phytoplankton bloom in OSPAR Regions II and III. Source: https://ospar-eodatabee-viewer.brockmann-consult.de/")
Figure 1: Satellite image of chlorophyll-a concentrations (monthly mean) in April 2020 during the spring phytoplankton bloom in OSPAR Regions II and III. Source: https://ospar-eodatabee-viewer.brockmann-consult.de/
Eutrophication is the result of excessive enrichment with nutrients. This may cause accelerated growth of algae and / or higher forms of plant life (Council Directive 91/676/EEC). This may result in an undesirable disturbance to the balance of organisms present and thus to the overall water quality. Undesirable disturbances can include shifts in the composition and extent of flora and fauna and the depletion of oxygen due to decomposition of accumulated biomass. Such disturbances then have other effects, such as changes in habitats and biodiversity, blooms of nuisance algae or macroalgae, decrease in water clarity and behavioural changes or even death of fish and other species. Identifying causal links between these disturbances and nutrient enrichment can be complicated by other pressures. Cumulative effects, including climate change, may have similar effects on biological communities and dissolved oxygen, further complicating efforts to demonstrate causal links.
The North-East Atlantic Environment Strategy (NEAES) 2030 contains the OSPAR Commission’s strategic objective to achieve clean seas for the North-East Atlantic by 2030. This includes tackling eutrophication, ‘through limiting inputs of nutrients and organic matter to levels that do not give rise to adverse effects on the marine environment’ (OSPAR, 2021). This strategic objective requires assessment of eutrophication to be based on the ecological consequences of nutrient enrichment and not just on nutrient enrichment alone, i.e., finding reliable evidence for accelerated growth of algae and / or macrophytes caused by anthropogenic nutrient enrichment, leading to undesirable disturbance. Eutrophication is diagnosed using OSPAR’s harmonised criteria of nutrient inputs, concentrations and ratios, chlorophyll concentrations, phytoplankton indicator species, macrophytes, dissolved oxygen levels, incidence of fish kills and changes in zoobenthos (OSPAR, 2022). As there is no single indicator of disturbance caused by marine eutrophication, OSPAR applies a multi-step method using the harmonised criteria. Eutrophication is considered to have occurred if there is evidence for all of the stages shown in Figure a, and of causal links between them.
For the current assessment, four harmonised eutrophication criteria have been assessed: nutrient inputs, winter concentrations of dissolved inorganic phosphate and nitrogen, chlorophyll concentrations and dissolved oxygen levels. These are highlighted in Figure a. The individual assessment results of any one of these four Common Indicators do not diagnose eutrophication by themselves. However, the assessments provide useful information about trends and are important for informing management measures.
.")
Figure a: Generic conceptual framework to assess eutrophication in all categories of surface waters illustrating the main cause / effect linkages (OSPAR, 2022).
Chlorophyll was assessed in the OSPAR Quality Status Report (QSR) 2010 (OSPAR, 2010). As part of the Common Procedure for the identification of eutrophication and integrated reports on the eutrophication status of the OSPAR Maritime Area an assessment of chlorophyll has been carried out three times (OSPAR, 2003; 2008;2017). All of these assessments followed the methodology agreed in the Common Procedure. Nevertheless, assessments were based on nationally defined assessment areas and national threshold values which limited comparability between countries. The current (fourth) application of the COMP reflects the adaptive management of the ecosystem approach, incorporating a major revision in assessment areas and threshold values, based on the best available scientific knowledge from EU projects such as JMP EUNOSAT (Enserink et al., 2019), and further developed in OSPAR’s own Eutrophication Modelling group ICG-EMO.
The current assessment contributes to Operational Objective S1.O1 under the NEAES 2030: ‘By 2022 OSPAR will implement an automated eutrophication assessment tool to deliver harmonised and transparent assessments for OSPAR and the Marine Strategy Framework Directive and to provide support for the development of the SDG 14.1.1 Index of Coastal Eutrophication in 2025’.
Chlorophyll concentrations, used in this assessment as a proxy for phytoplankton biomass, are the net result of a number of processes: the production of phytoplankton biomass which is determined by nutrient concentrations but also by light and temperature, and the loss of phytoplankton biomass which is determined by mortality, sinking and grazing (Cloern et al., 2014). Consequently, the chlorophyll concentrations that are observed at monitoring sites are influenced by growth, mortality and transport processes. Physical factors such as turbidity, depth, vertical and horizontal mixing and stratification, and biological factors such as algal species composition, zooplankton grazing and competition with other primary producers have an impact on growth, mortality and transport. Due to these many interacting factors, the response of phytoplankton biomass to changes in nutrient input is complex and system specific (Cloern, 2001; Cloern et al., 2014). In addition, reduction in nutrient inputs has not always resulted in the expected declines in phytoplankton biomass (Duarte et al., 2009). On the other hand, there are examples of water systems within the OSPAR Maritime Area where reduced nutrient inputs have resulted in lowered phytoplankton biomass or production (e.g., Philippart et al., 2007; Van Beusekom et al., 2009; Lyngsgaard et al., 2014; Riemann et al., 2016; Staehr et al., 2017).
Chlorophyll-a concentrations are generally higher in coastal waters where nutrient concentrations are higher due to river discharges and direct inputs (Figure 1).
In this Indicator Assessment, chlorophyll-a concentration in OSPAR Region II (Greater North Sea), Region III (Celtic Seas) and Region IV (Bay of Biscay and Iberian Coast) have been assessed with the COMPEAT tool, using harmonised and coherent thresholds.
Chlorophyll-a determination
The Common Indicator chlorophyll-a is a proxy for phytoplankton biomass. Chlorophyll is traditionally measured in situ, either from discrete water samples analysed in the laboratory or through continuous observation (e.g., fluorimetry) by sensors mounted on fixed stations / buoys or in ships. Given the variability in space and time of this indicator, the resolution of in situ sampling is often insufficient to describe the spatial variation. Notably in offshore areas in situ sampling is very sparse. Furthermore, in some assessment areas (see below) the spatial distribution of in situ sampling stations is not representative for the area, i.e., may be biased towards the coast. On the other hand in situ sampling is more precise method for a specific sampling site. Systematic in situ data over time give a robust result for the trend over time for the area covered by the sampling.
By using ‘ocean colour’, satellites can also detect chlorophyll at a much higher temporal and spatial resolution and at relatively low costs per observation. Earlier OSPAR assessments only used national in situ chlorophyll monitoring, although satellite data were available since 1989. Collaboration between North Sea countries in the EU project JMP EUNOSAT (2017 - 2019) has resulted in the development of a tool to generate and validate satellite chlorophyll-a products for the purpose of coherent eutrophication assessments for the Greater North Sea (Lavigne et al., 2021). This tool uses (satellite) information on the optical characteristics of waters (water types such as clear oceanic, turbid coastal, with high dissolved organics or high chlorophyll content) to choose the appropriate ocean colour algorithm that translates the satellite signal into chlorophyll-a concentrations. In addition, information from different (overlapping) satellite missions is used to cover the entire assessment period. However, for some areas, particularly areas with high concentrations of coloured dissolved organic matter or high turbidity, systematic errors were detected for some satellite missions (Staehr et al.,2022). Much effort was spent in JMP-EUNOSAT and since to calibrate and test the tool with in situ chlorophyll-a data from North Sea countries. The tool delivers quality controlled high-resolution maps for chlorophyll, which are reported as daily maps to the ICES COMPEAT data system as a contribution to more coherent eutrophication assessments in Regions II and III. In Regions IV and V, the single algorithm ARGANS Telechlor satellite product provides estimates of chlorophyll concentration and has been used. The two products compare well in clear and medium turbidity waters, although differences occur in high turbidity (SPM and / or chlorophyll) waters, e.g., in some river plumes.
Even though Earth Observation (EO) provides a much better coverage in time and space, compared to in situ data, the combined use must be done with caution as the two techniques sometimes give different results (Staehr et al., 2022). Satellites measure the light absorbed by pigments in the phytoplankton cells whereas laboratory analyses of water samples measure the chlorophyll concentration. The ratio of light absorption to chlorophyll varies, depending on the self-shading inside the cells as well as other factors. Several of these factors vary systematically with the nutrient regime experienced by the cells and hence eutrophication. This is also the case for the ratio of carbon to chlorophyll (Jacobsen and Markager, 2016).
Another source of variation is the use of different analytical techniques to determine chlorophyll-a in water samples. Application of the JAMP Eutrophication Monitoring Guidelines: Chlorophyll-a in Water (OSPAR Agreement, 2012-11) by OSPAR Contracting Parties enhances comparability, but factors such as phytoplankton species composition are not yet fully taken into account.
Chlorophyll concentrations were assessed in all COMP4 assessment areas in OSPAR Regions II, III and IV (Greater North Sea, Celtic Seas, Bay of Biscay and Iberian Coast). For the first time, the assessment was based not only on in situ data but also on Earth Observation (satellite) data that were available from 1998 onwards. In the assessment a combination of in situ data and satellite data is used following the methods described in the revision of the Common Procedure (OSPAR, 2022).
For this Indicator Assessment mean chlorophyll concentrations measured during the area-specific growing season, mostly 1 March to 30 September, are calculated. The threshold values for chlorophyll-a are based on a justified area-specific % deviation from historic background (OSPAR, 2022).
Data are stored in the International Council for the Exploration of the Sea (ICES) DOME ( https://www.ices.dk/data/data-portals/Pages/DOME.aspx ). The data were retrieved from the database in June 2022.
Assessment areas
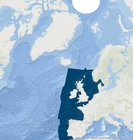
For the 4th application of the Common Procedure, new harmonised assessment areas have been defined that represent ecologically relevant areas in OSPAR Regions II, III and IV (Figure b). These assessment areas can be categorised in four different types with distinct characteristics: river plumes, coastal waters, shelf areas and oceanic areas. River plumes are areas near and downstream from the mouths of large rivers, with generally relatively low and variable salinity and strongly influenced by river discharges. Coastal waters are areas other than river plumes, with average salinity ≤34,5. Shelf areas are areas with average salinity >34,5 and depths <200m, while oceanic waters are the areas off the continental shelf with a depth of >200 m.
As the characteristics of the assessment areas have an impact on the response of the Common Indicator chlorophyll to changes in nutrient loads, the results of the assessments and analyses of trends are grouped for the four assessment area types, where relevant.
Figure b: Overview of ecologically relevant assessment areas based on duration of stratification, mean surface salinity, depth, suspended particulate matter and primary production. Assessment area codes and names are listed in Table 1. Available at: https://odims.ospar.org/en/submissions/ospar_comp_au_2023_01/
Assessment period
For the assessment of chlorophyll concentrations, in situ and satellite data are combined for the COMP4 assessment period 2015–2020. For the assessment of long-term trends in chlorophyll concentrations, the assessment period is 1990 to 2020 (using in situ data) and 1998 to 2020 using satellite data. As in situ data and satellite data cover different periods and differ in spatial coverage, the data were not combined in the assessment of long-term trends.
The assessment for COMP4 was done with the COMPEAT tool, for the most recent period (2015-2020). In addition, the assessment was done again for the three previous assessment periods (COMP1: 1990-2000; COMP2: 2001-2006; COMP3: 2006-2014) applying the new thresholds and assessment areas that have been defined for the application of the COMP4.
Assessment tools
The assessment is carried out with the recently developed COMPEAT tool.
The temporal trends in chlorophyll concentrations were tested for statistical significance using the Mann-Kendall test. The statistical test of trends was done for the years 1990 to 2020 for in situ data and 1998-2020 for EO data. This test was carried out in R version 4.2.1 with R package TTAinterfaceTrendAnalysis v.1.5.8 for temporal trend analysis.
Where trends were significant (p<0,05), this is included in the description of the results.
Results
For the most recent period 2015-2020, 11 assessment areas, all in OSPAR Region II (Greater North Sea) are in Moderate, Poor or Bad status (i.e., concentrations above the threshold). Those areas are river plumes and coastal waters along the continental coast from France to Denmark / Sweden (Coastal French Channel, Scheldt plume, Meuse plume, Rhine plume, Ems plume, Elbe plume, German Bight Central, Outer Coastal DEDK and Kattegat Coastal and Kattegat Deep (Figure 2).
Assessments in all those areas give comparable results if they are based only on either in situ or satellite data. The only exception is the assessment area Scottish Sea, that has Moderate status based on in situ data and Good status based on satellite data and in the combined assessment.
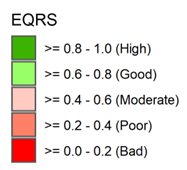
Figure 2: Results of the COMP4 assessment of chlorophyll growing season mean, based on the combination of in situ and satellite data, for OSPAR Regions II, III and IV. The results of each assessment area are shown in Table 1 as well. Available at: https://odims.ospar.org/en/submissions/ospar_chlorophyll_eqrs_2020_01_001/
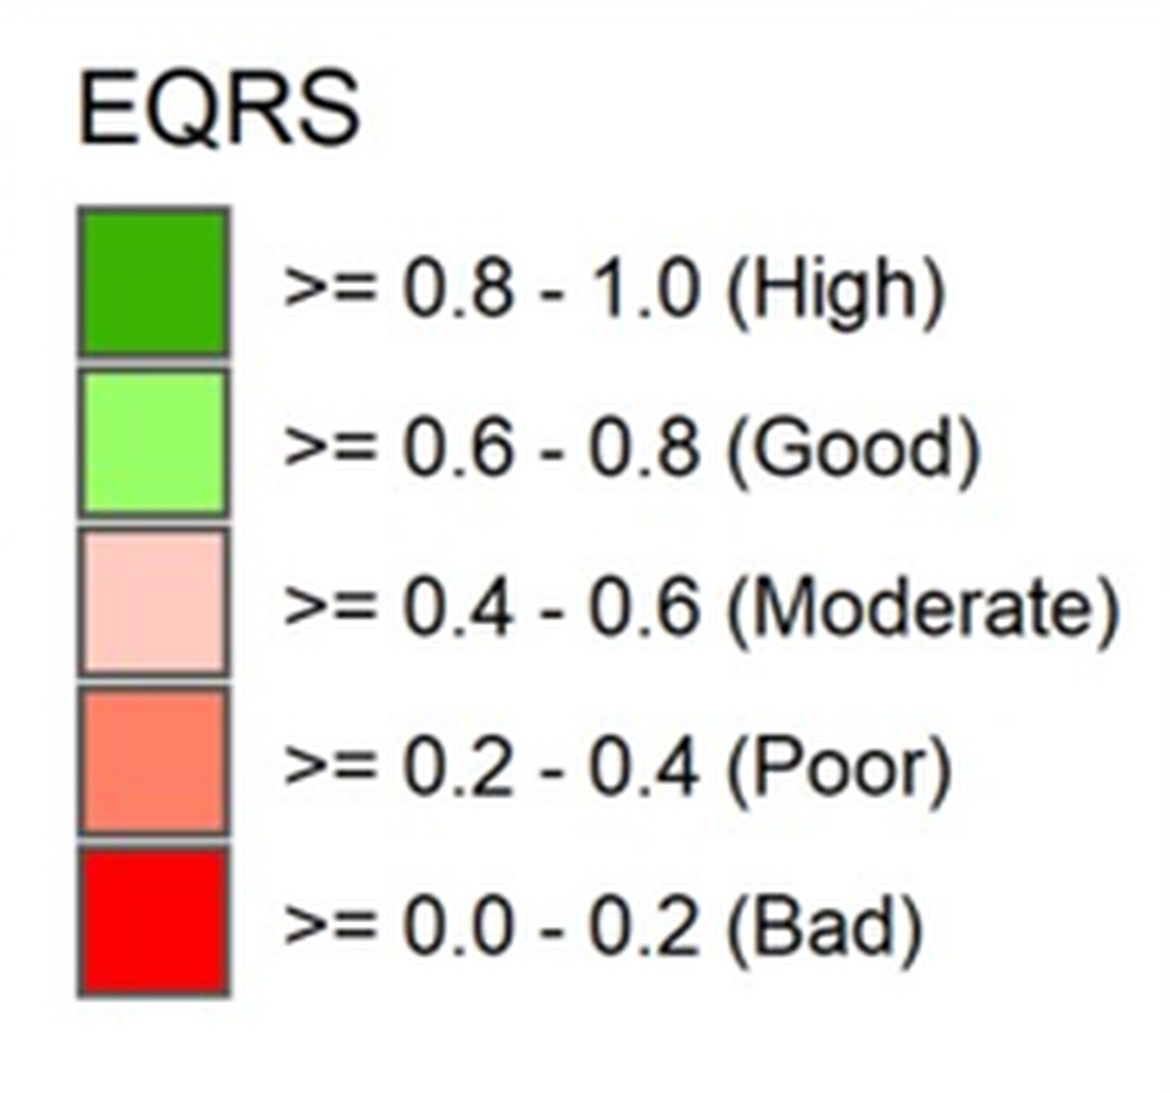
Table 1: Assessment areas of the North-East Atlantic grouped into categories of river plumes, coastal, shelf and oceanic areas including allocation to OSPAR Regions (based on the largest share when region boundaries split assessment areas) and the EQRS value (with colour coding showing the status) of the COMP4 assessment.
Categories of COMP 4 assessment areas | Area code | Area name | OSPAR Region | Ecological Quality Ratio Scaled (EQRS) |
|---|---|---|---|---|
| River plumes | ADPM | Adour plume | IV | 0,75 |
| ELPM | Elbe plume | II | 0,35 | |
| EMPM | Ems plume | II | 0,42 | |
| GDPM | Gironde plume | IV | 0,99 | |
| HPM | Humber plume | II | 0,97 | |
| LBPM | Liverpool Bay plume | III | 0,83 | |
| LPM | Loire plume | IV | 0,80 | |
| MPM | Meuse plume | II | 0,32 | |
| RHPM | Rhine plume | II | 0,53 | |
SCHPM1 | Scheldt plume 1 | II | 0,15 | |
| SCHPM2 | Scheldt plume 2 | II | 0,43 | |
| SHPM | Shannon plume | III | 0,89 | |
| SPM | Seine plume | II | 0,91 | |
| THPM | Thames plume | II | 0,90 | |
| Coastal areas | CFR | Coastal FR Channel | II | 0,49 |
| CIRL | Coastal IRL 3 | III | 0,74 | |
| CNOR1 | Coastal NOR 1 | II | 1,00 | |
| CNOR2 | Coastal NOR 2 | II | 1,00 | |
| CNOR3 | Coastal NOR 3 | II | 0,94 | |
| CUK1 | Coastal UK 1 | III | 0,85 | |
| CUKC | Coastal UK Channel | II | 0,93 | |
| CWAC | Coastal Waters AC (D5) | IV | 1,00 | |
| CWBC | Coastal Waters BC (D5) | IV | 1,00 | |
| CWCC | Coastal Waters CC (D5) | IV | 1,00 | |
| ECPM1 | East Coast (permanently mixed) 1 | II | 0,99 | |
| ECPM2 | East Coast (permanently mixed) 2 | II | 1,00 | |
| GBC | German Bight Central | II | 0,56 | |
| IRS | Irish Sea | III | 0,90 | |
| KC | Kattegat Coastal | II | 0,25 | |
| KD | Kattegat Deep | II | 0,48 | |
| NAAC1A | Noratlantic Area NOR-NorC1(D5)A | IV | 1,00 | |
| NAAC1B | Noratlantic Area NOR-NorC1(D5)B | IV | 1,00 | |
| NAAC1C | Noratlantic Area NOR-NorC1(D5)C | IV | 1,00 | |
| NAAC1D | Noratlantic Area NOR-NorC1(D5)D | IV | 1,00 | |
| NAAC2 | Noratlantic Area NOR-NorC2(D5) | IV | 1,00 | |
| NAAC3 | Noratlantic Area NOR-NorC3(D5) | IV | 1,00 | |
| OC | Outer Coastal DEDK | II | 0,43 | |
| SAAC1 | Sudatlantic Area SUD-C1(D5) | IV | 1,00 | |
| SAAC2 | Sudatlantic Area SUD-C2(D5) | IV | 1,00 | |
| SAAP2 | Sudatlantic Area SUD-P2(D5) | IV | 1,00 | |
| SNS | Southern North Sea | II | 0,74 | |
| Shelf areas | ASS | Atlantic Seasonally Stratified | III, IV | 1,00 |
| CCTI | Channel coastal shelf tidal influenced | II | 0,88 | |
| CWM | Channel well mixed | II, III | 0,92 | |
| CWMTI | Channel well mixed tidal influenced | II | 1,00 | |
| DB | Dogger Bank | II | 0,90 | |
| ENS | Eastern North Sea | II | 0,73 | |
| GBCW | Gulf of Biscay coastal waters | IV | 0,99 | |
| GBSW | Gulf of Biscay shelf waters | IV | 1,00 | |
| IS1 | Intermittently Stratified 1 | II, III | 0,91 | |
| IS2 | Intermittently Stratified 2 | II | 0,80 | |
| NAAP2 | Noratlantic Area NOR-NorP2(D5) | IV | 1,00 | |
| NAAPF | Noratlantic Area NOR-Plataforma | IV | 1,00 | |
| NNS | Northern North Sea | II | 0,97 | |
| NT | Norwegian Trench | II | 0,90 | |
| SAAP1 | Sudatlantic Area SUD-P1(D5) | IV | 1,00 | |
| SK | Skagerrak | II | 0,69 | |
| SS | Scottish Sea | II, III | 0,75 | |
| Oceanic / beyond shelf | ATL | Atlantic | II, IV, V | 1,00 |
| NAAO1 | Noratlantic Area NOR-NorO1(D5) | IV | 1,00 | |
| OWAO | Ocean Waters AO (D5) | IV | 1,00 | |
| OWBO | Ocean Waters BO (D5) | IV | 1,00 | |
| OWCO | Ocean Waters CO (D5) | IV | 1,00 | |
| SAAOC | Sudatlantic Area SUD-OCEAN(D5) | IV | 1,00 |
A comparison between the four COMP assessment periods, of the number and total surface area of assessment areas with chlorophyll concentrations exceeding thresholds, is not straightforward. The confidence in assessment results is determined based on a combination of spatial and temporal confidence and accuracy. For in situ data, there are only few assessment areas that have assessment results with high confidence for all four COMP periods. For satellite data, there are more assessment areas with high confidence assessments for all four COMP periods. Using only the assessments based on satellite data, there is still 40% of the surface area excluded from a comparison between the four COMP assessment periods, due to the fact that satellite data are missing for assessment areas in Spanish and Portuguese waters and in the southern part of the Bay of Biscay for the COMP1 and COMP2 periods. For the period 2015-2020, the total surface area that is not in Good / High Status is 57 304km2 which is 2,2% of the total surface area that was assessed. However, this result reflects the vast open oceanic areas and does not reflect the situation in near shore areas where nutrient inputs for land cause eutrophication. Of the total surface area of river plumes, 46% (12 444km2) and 22% of the coastal areas (44 860km2) are not in Good / High Status.
Comparison of the four COMP assessment periods shows that in coastal and shelf waters the status has improved since COMP1, but there are only minor changes in river plumes (Figure 3).
Figure 3: Percentage of the surface area of river plumes, coastal waters, shelf areas and oceanic waters in Bad, Poor or Moderate Status (red) or Good or High status (green) in the COMP1, COMP2, COMP3 and COMP4 assessment periods. Grey bars indicate assessment areas with missing data.
A trend analysis was done for the growing season means of each assessment area. Because of the fact that satellite data were only available from 1998 onwards, the trend analysis was done separately for the in situ data (1990 to 2020, depending on data availability) and the satellite data (1998 to 2020). No trend analysis was done on the combination of in situ and satellite data.
Trends showing a significant increase in chlorophyll concentrations were found for Loire plume (in situ data, years 1996 to 2019), Liverpool Bay plume (EO data, years 1998 to 2020), Gulf of Biscay coastal waters and shelf waters (EO data, years 2009 to 2020). In all these assessment areas chlorophyll concentrations were below the threshold (i.e. no eutrophication) in 2015 to 2020 (Table 2 and Table 3).
Assessment areas that were classified as Moderate, Poor or Bad status (i.e. concentrations above the threshold) for chlorophyll and show significant decreasing trends in concentrations (i.e. improving conditions) either based on EO data or in situ data are all in coastal waters (Table 2 and Table 3): Coastal FR Channel, Outer Coastal DEDK, German Bight Central, Kattegat Coastal and Kattegat Deep.
| Area category | COMP4 classification | Increasing trend | No trend | Decreasing trend | No data |
|---|---|---|---|---|---|
| River plumes | M / P / B status | 0 | 5 | 0 | 1 |
| H / G status | 1 | 6 | 0 | 1 | |
| Coastal areas | M / P / B status | 0 | 2 | 3 | 0 |
| H / G status | 0 | 10 | 2 | 10 | |
| Shelf areas | M / P / B status | 0 | 0 | 0 | 0 |
| H / G status | 0 | 12 | 4 | 1 | |
| Oceanic areas | M / P / B status | 0 | 0 | 0 | 0 |
| H / G status | 0 | 2 | 0 | 4 |
| Area category | COMP4 classification | Increasing trend | No trend | Decreasing trend | No data |
|---|---|---|---|---|---|
| River plumes | M / P / B status | 0 | 6 | 0 | 0 |
| H / G status | 1 | 6 | 1 | 0 | |
| Coastal areas | M / P / B status | 0 | 2 | 3 | 0 |
| H / G status | 0 | 21 | 1 | 0 | |
| Shelf areas | M / P / B status | 0 | 0 | 0 | 0 |
| H / G status | 2 | 14 | 1 | 0 | |
| Oceanic areas | M / P / B status | 0 | 0 | 0 | 0 |
| H / G status | 0 | 5 | 1 | 0 |
The assessment for COMP4 was done with the COMPEAT tool, for the most recent period (2015 - 2020). In addition, the assessment was done again for the three previous assessment periods (COMP1: 1990 - 2000; COMP2: 2001 - 2006; COMP3: 2006 - 2014) applying the thresholds and assessment areas that have been defined for the application of the COMP4. With this approach, it is possible to see the change in assessment results solely caused by changes in the state of the marine environment. Previously, comparisons between the results of COMP1, COMP2 and COMP3 were confounded by changes in assessment methods and thresholds between the various periods.
Assessments are now based on a combination of in situ measurements and Earth Observation / satellite (EO) data. EO data are now available for the period 1998 - 2020. The previously published COMP1, COMP2 and COMP3 assessments were mainly based on in situ data, as only few Contracting Parties partly used satellite data in COMP3.
COMP4 assessment results
The COMP4 assessment (Figure 2) shows that 11 assessment areas, all in OSPAR Region II (Greater North Sea) are in Moderate, Poor or Bad status (i.e., concentrations above the threshold). Those areas are found along the continental coast from France to Denmark / Sweden (Coastal French Channel, Scheldt plume, Meuse plume, Rhine plume, Ems plume, Elbe plume, German Bight Central, Outer Coastal DEDK and Kattegat Coastal and Kattegat Deep).
Assessments in all those areas give comparable results if they are based only on either in situ or satellite data. The only exception is the assessment area Scottish Sea, that has Moderate status based on in situ data and Good status based on satellite data and in the combined assessment.
COMP assessment periods compared
The assessment results for the previous COMP periods, applying the COMP4 thresholds, are shown in Figure c.
In the COMP1 period (1990 - 2000), 19 assessment areas were classified in Moderate, Poor or Bad status. It should be noted however, that the assessment for this period is mainly determined by in situ data, as satellite data were only available for the last three years (1998 - 2000). When only the satellite data are considered, the number of assessment areas with chlorophyll concentrations above the threshold is nine for COMP1. The assessment areas with eutrophication problems are mainly found in OSPAR region II (Greater North Sea). The poor status in the large area called Northern North Sea is mainly due to a relatively high influence of in situ data, as for only three out of 11 years satellite data were available. In this area, satellite data do not show exceedance of the thresholds in any of the COMP periods, while many in situ growing season means exceed the threshold during COMP1, with a lower frequency of exceedance of thresholds in COMP2 and COMP3 and no exceedance in COMP4. Spatial confidence is low for in situ chlorophyll in the Northern North Sea and there is some indication of a spatial bias towards coastal waters, which would imply that the in situ means overestimate the mean concentrations for the entire assessment area. In addition to the areas in the Greater North Sea, there are two areas with eutrophication problems in OSPAR Region III (Irish Sea) and one small area in OSPAR Region IV near the Spanish southern Atlantic coast. However, for the latter area the spatial and temporal confidence of the assessment is classified as Low.
In the COMP2 period (2001 - 2006) 13 assessment areas were in Moderate, Poor or Bad Status and in the COMP3 period (2006 - 2014) this was the case for nine assessment areas. The areas were all found in OSPAR Region II.
The confidence of the assessment results is also shown in Figure c, based on a classification of the accuracy and temporal and spatial confidence, which is described in more detail in the Common Procedure (OSPAR, 2022), including the class boundaries used for the confidence rating. In particular in the COMP1 period, the assessments of many areas have a moderate or low confidence.
The number of not assessed areas was nine, 20, one and one in the assessment periods of COMP1, 2, 3, and 4, respectively. The total surface area of not assessed areas was 1%, 23%, <1% and <1% of the total area, respectively, in the assessment periods of COMP1, 2, 3, and 4.
In summary, the recurrent pattern over the entire period from 1990 to 2020 is, that in OSPAR Region II, Greater North Sea, a number of assessment areas are classified as Moderate, Poor or Bad Status over the entire period. Some areas were only classified as such in the COMP1 period, like the two areas in Region III (Irish Sea), one area in Region IV, and Dogger Bank and Northern North Sea in Region II.
COMP1
Eutrophication Status 1990 - 2000. Chlorophyll-a (in-situ and satellite). Months 3 - 9. Depths 0 - 10. Metric: Mean. Available at: https://odims.ospar.org/en/submissions/ospar_chlorophyll_eqrs_2000_01/
Eutrophication Confidence 1990 - 2000. Chlorophyll-a (in-situ and satellite). Months 3 - 9. Depths 0 - 10. Metric: Mean. Available at: https://odims.ospar.org/en/submissions/ospar_chl_confidence_2000_01/
COMP2
Eutrophication Status 2001 - 2006. Chlorophyll-a (in-situ and satellite). Months 3 - 9. Depths 0 - 10. Metric: Mean. Available at: https://odims.ospar.org/en/submissions/ospar_chlorophyll_eqrs_2006_01/
Eutrophication Confidence 2001 - 2006. Chlorophyll-a (in-situ and satellite). Months 3 - 9. Depths 0 - 10. Metric: Mean. Available at: https://odims.ospar.org/en/submissions/ospar_chl_confidence_2006_01/
COMP3
Eutrophication Status 2006 - 2014. Chlorophyll-a (in-situ and satellite). Months 3 - 9. Depths 0 - 10. Metric: Mean. Available at: https://odims.ospar.org/en/submissions/ospar_chlorophyll_eqrs_2014_01/
Eutrophication Confidence 2006 - 2014. Chlorophyll-a (in-situ and satellite). Months 3 - 9. Depths 0 - 10. Metric: Mean. Available via: https://odims.ospar.org/en/submissions/ospar_chl_confidence_2014_01/
COMP4
Eutrophication Status 2015 - 2020. Chlorophyll-a (in-situ and satellite). Months 3 - 9. Depths 0 - 10. Metric: Mean. Available via: https://odims.ospar.org/en/submissions/ospar_chlorophyll_eqrs_2020_01/
Eutrophication Confidence 2015 - 2020. Chlorophyll-a (in-situ and satellite). Months 3 - 9. Depths 0 - 10. Metric: Mean. Available via: https://odims.ospar.org/en/submissions/ospar_chl_confidence_2020_01/
Figure c: Eutrophication status assessment (left) and confidence of the assessment (right) of chlorophyll growing season mean, based on the combination of in situ and satellite data, for the assessment periods 1990 to 2000 (COMP1), 2001 to 2006 (COMP2), 2006 to 2014 (COMP3) and 2015 to 2020 (COMP4).
Trends 1990 to 2020 per assessment area
A trend analysis was done for the growing season means over 1990 to 2020 of each assessment area. Because of the fact that satellite data were only available from 1998 onwards, the trend analysis was done separately for the in situ data and the satellite data, and no trend analysis was done on the combination of in situ and satellite data.
There is a relatively small number of assessment areas that show significant trends. Results of the trend analysis are summarised in Table 2 and Table 3.
Trends showing a significant increase in chlorophyll concentrations were found for Loire plume (in situ data, years 1996 - 2019), Liverpool Bay plume (EO data, years 1998 - 2020), Gulf of Biscay coastal waters and shelf waters (EO data, years 2009 - 2020). In all these assessment areas chlorophyll concentrations were below the threshold in 2015 to 2020.
Assessment areas that were classified as Moderate, Poor or Bad status for chlorophyll and show significant decreasing trends in concentrations (either EO data or in situ data) are all in coastal waters: Coastal FR Channel, Outer Coastal DEDK, German Bight Central, Kattegat Coastal and Kattegat Deep. Figure d, Figure e, Figure f, Figure g and Figure h show concentrations and trends for those five areas. For the two assessment units in Kattegat, the EO data also show decreasing trends for the entire period (1998 to 2020) if corrected for changes in sensitivity between satellites over time (Staehr et al., 2022). For approximately the last ten years, there is a tendency to an increase in concentrations following higher inputs of nitrogen from land and increasing winter concentrations of inorganic nitrogen. Five assessment areas classified as Moderate, Poor or Bad status for chlorophyll showed no significant trend: Elbe plume, Ems plume, Meuse plume, Rhine plume, Scheldt plume.
Figure d: Concentrations, trends and thresholds in the Coastal FR Channel Assessment Area with concentrations above the threshold and a significant decreasing trend (EO data).
Figure e: Concentrations, trends and thresholds in the Outer Coastal DEDK Assessment Area with concentrations above the threshold and a significant decreasing trend (in situ and EO data)
Figure f: Concentrations, trends and thresholds in the German Bight Central Assessment Area with concentrations above the threshold and a significant decreasing trend (EO data).
Figure g: Concentrations, trends and thresholds in the Kattegat Coastal Assessment Area with concentrations above the threshold and a significant decreasing trend (in situ data).
Figure h: Concentrations, trends and thresholds in the Kattegat Deep Assessment Area with concentrations above the threshold and a significant decreasing trend (in situ data).
Conclusion
Chlorophyll concentrations exceeding the thresholds are found in 11 assessment areas in river plumes and coastal waters in the Greater North Sea, along the continental coast from France to Denmark and Sweden. From COMP3 to COMP4 there has been little change in the number of assessment areas and surface area with elevated concentrations.
A trend analysis, either based on in situ data or on satellite data, showed that significant increases in chlorophyll concentrations were found in four assessment areas. Those assessment areas are all in Good or High status (i.e., concentrations below the threshold). Out of the 11 assessment areas with concentrations exceeding the threshold in 2015 to 2020, indicating eutrophication, five areas show decreasing concentrations of chlorophyll (i.e. improving conditions). The other assessment areas showed no significant trend.
Chlorophyll concentrations exceeding the thresholds are found in 11 assessment areas in river plumes and coastal waters in the Greater North Sea, along the continental coast from France to Denmark and Sweden. From COMP3 to COMP4 there has been little change in the number of assessment areas and surface area with elevated concentrations.
A trend analysis, either based on in situ data or on satellite data, showed that significant increases in chlorophyll concentrations were found in four assessment areas. Those assessment areas are all in Good or High status (i.e., concentrations below the threshold). Out of the ten assessment areas with concentrations exceeding the threshold in 2015 to 2020, indicating eutrophication, five areas show decreasing concentrations of chlorophyll (i.e., improving conditions). The other five assessment areas showed no significant trend.
Knowledge Gaps
Earlier identified knowledge gaps, referring to analytical methods and the spatial scale of assessment areas, were addressed by defining new, ecologically relevant, assessment areas. The availability of data from the new Sentinel satellites and new methods for calculating chlorophyll concentration based on their high spectral resolution data, will provide better quality of EO data from 2018 onwards.
The combination of in situ and satellite data needs to be worked out further, given the differences in sampling strategies between Contracting Parties.
The approach to derive thresholds from a reference needs further elaboration to reflect differences in responses of the different assessment parameters.
Knowledge gaps that were identified earlier, referring to analytical methods and the spatial scale of assessment areas, have been addressed by the definition of new, ecologically relevant, assessment areas.
A full-scale use of satellite data was introduced in COMP4. Since 2018 data with a higher spectral resolution has been available from the Sentinel III satellites. This allows more advanced methods to be used for calculation of chlorophyll concentrations. This might eliminate some of the uncertainties associated with the estimates based on older satellite missions. Currently (2022) new methods for estimation of chlorophyll from satellite data are tested. These methods make use of in situ sampling and data for a dynamic validation of satellite data over time. This approach should be further developed and used in the future. It means that some of the problems with changes in optical properties of phytoplankton over time, in relation to nutrient status, can be overcome. This also opens up for assimilating EO data into dynamic ecosystem models, so future estimates are based on both in situ and EO data that are interpolated in space and time with dynamic ecosystem models.
The approach to combine in situ and satellite data needs further elaboration given the differences in sampling strategies between Contracting Parties.
This is the first COMP assessment that uses common threshold values based on a harmonised approach, but adjustments were made in selected assessment areas, undermining full harmonisation. The approach to derive thresholds from a reference needs further elaboration to better reflect the difference in responses of different parameters and better reflect spatial gradients in anthropogenic pressures.
Cloern, J.E. (2001). Our evolving conceptual model of the coastal eutrophication problem. Marine Ecology Progress Series 210: 223-253.
Cloern, J.E., S.Q. Foster & A.E. Kleckner (2014). Phytoplankton primary production in the world's estuarine-coastal ecosystems. Biogeosciences 11: 2477-2501.
Duarte, C.M., D.J. Conley, J. Carstensen & M. Sánchez-Camacho (2009). Return to Neverland: Shifting baselines affect eutrophication restoration targets. Estuaries and Coasts 32: 29-36.
Enserink, L., Blauw, A., van der Zande, D., Markager S. (2019). Summary report of the EU project ‘Joint monitoring programme of the eutrophication of the North Sea with satellite data’ (Ref: DG ENV/MSFD Second Cycle/2016). 21 pp
Jakobsen, H.H. & S. Markager (2016). Carbon-to-chlorophyll ratio for phytoplankton in temperate coastal waters: Seasonal patterns and relationship to nutrients. Limnology and Oceanography 61: 1853-1868.
Lavigne H. & Van der Zande D. & Ruddick K. & Cardoso Dos Santos J. & Gohin F. & Brotas V. & Kratzer S. Quality-control tests for OC4, OC5 and NIR-red satellite chlorophyll-a algorithms applied to coastal waters (2021) Remote Sensing of Environment, Vol. 255 p. 112237.
Lyngsgaard, M.M., S. Markager & K. Richardson (2014). Changes in the vertical distribution of primary production in response to land-based nitrogen loading. Limnology and Oceanography 59: 1679-1690.
OSPAR (2010). Quality Status Report 2010. OSPAR commission. London. 176 pp.
OSPAR (2003). OSPAR integrated report 2003 on the eutrophication status of the OSPAR maritime area based upon the first application of the Comprehensive Procedure. OSPAR Commission, London, Eutrophication Series Publication No 189/2003, 59 pp.
OSPAR (2008). Second OSPAR Integrated Report on the Eutrophication Status of the OSPAR Maritime Area OSPAR Commission, London, Eutrophication Series Publication Number: 372/2008 107 pp.
OSPAR (2012). JAMP Eutrophication Monitoring Guidelines: Chlorophyll-a in Water. OSPAR Agreement 2012-11
OSPAR (2017). Third Integrated Report on the Eutrophication Status of the OSPAR Maritime Area. OSPAR Commission, London, Publication No 694/2017, 164 pp.
OSPAR (2021) Strategy of the OSPAR Commission for the Protection of the Marine Environment of the North-East Atlantic 2030. Agreement 2021-01: North-East Atlantic Environment Strategy.
OSPAR (2022). Revision of the Common Procedure for the Identification of the Eutrophication Status of the OSPAR Maritime Area. OSPAR Agreement 2022-07.
Philippart, C.J.M., J.J. Beukema, G.C. Cadée, R. Dekker, P.W. Goedhart, J.M. Iperen, M.F. Leopold & P.M.J. Herman (2007). Impacts of Nutrient Reduction on Coastal Communities. Ecosystems 10: 96-119.
Riemann, B., J. Carstensen, K. Dahl, H. Fossing, J.W. Hansen, H.H. Jakobsen, A.B. Josefson, D. Krause-Jensen, S. Markager, P.A. Stæhr, K. Timmermann, J. Windolf & J.H. Andersen (2016). Recovery of Danish Coastal Ecosystems After Reductions in Nutrient Loading: A Holistic Ecosystem Approach. Estuaries and Coasts 39: 82-97.
Staehr, P.A., J. Testa & J. Carstensen (2017). Decadal Changes in Water Quality and Net Productivity of a Shallow Danish Estuary Following Significant Nutrient Reductions. Estuaries and Coasts: 40: 63-79.
Staehr, S.U., D. Van der Zande, P.A.U. Staehr & S. Markager (2022). Suitability of multisensory satellites for long-term chlorophyll assessment in coastal waters: A case study in optically-complex waters of the temperate region. Ecological Indicators 134: 108479.
Van Beusekom, J.E.E., M. Loebl & P. Martens (2009). Distant riverine nutrient supply and local temperature drive the long-term phytoplankton development in a temperate coastal basin. Journal of Sea Research 61: 26-33.
Contributors
Lead Authors: Theo Prins and Lisette Enserink
Supported by: Intersessional Correspondence Group on Eutrophication (ICG-EUT), Technical Group for the revision and application of the Common Procedure and the Hazardous Substances and Eutrophication Committee (HASEC).
Citation
Prins, T. and Enserink, L. 2022. Concentrations of Chlorophyll-a in the Greater North Sea, Celtic Seas and Bay of Biscay and Iberian Coast. In: OSPAR, 2023: The 2023 Quality Status Report for the Northeast Atlantic. OSPAR Commission, London. Available at: https://oap.ospar.org/en/ospar-assessments/quality-status-reports/qsr-2023/indicator-assessments/chl-a-concentrations
| Assessment type | Indicator Assessment |
|---|---|
| Summary Results | https://odims.ospar.org/en/submissions/ospar_chlorophyll_msfd_2022_06/ |
| SDG Indicator | 14.1 By 2025, prevent and significantly reduce marine pollution of all kinds, in particular from land-based activities, including marine debris and nutrient pollution |
| Thematic Activity | Eutrophication |
| Relevant OSPAR Documentation | OSPAR Agreement 2010-03 The North-East Atlantic Environment Strategy. Strategy of the OSPAR Commission for the Protection of the Marine Environment of the North-East Atlantic 2010–2020 |
| Date of publication | 2022-06-30 |
| Conditions applying to access and use | https://oap.ospar.org/en/data-policy/ |
| Data Snapshot | https://odims.ospar.org/en/submissions/ospar_chlorophyll_snapshot_2022_06/ |
| Data Results | https://odims.ospar.org/en/submissions/ospar_chlorophyll_results_2022_06/ |
| Data Source | https://www.ices.dk/data/data-portals/Pages/DOME.aspx |