

Feeder Report 2021 - Shipping and Ports
Distribution and intensity
2.1 Shipping occurs throughout the OSPAR Maritime Area. The Greater North Sea, the Celtic Seas, and the Bay of Biscay and Iberian Coast (and parts of Arctic Waters and the Wider Atlantic) continue to have a high density of shipping, with the highest densities in the English Channel, southern and eastern North Sea, and the entrance to the Mediterranean. The OSPAR region included three of the twenty leading container ports globally in 2017 (Rotterdam, Antwerp and Hamburg), and ten of the twenty largest ports in Europe, with a particular concentration in the southern North Sea (UNCTAD, 2019; Eurostat; 2019). Figure 1 and Figure 2 show route density maps for cargo shipping and for tankers, and the locations of larger ports in the OSPAR region.
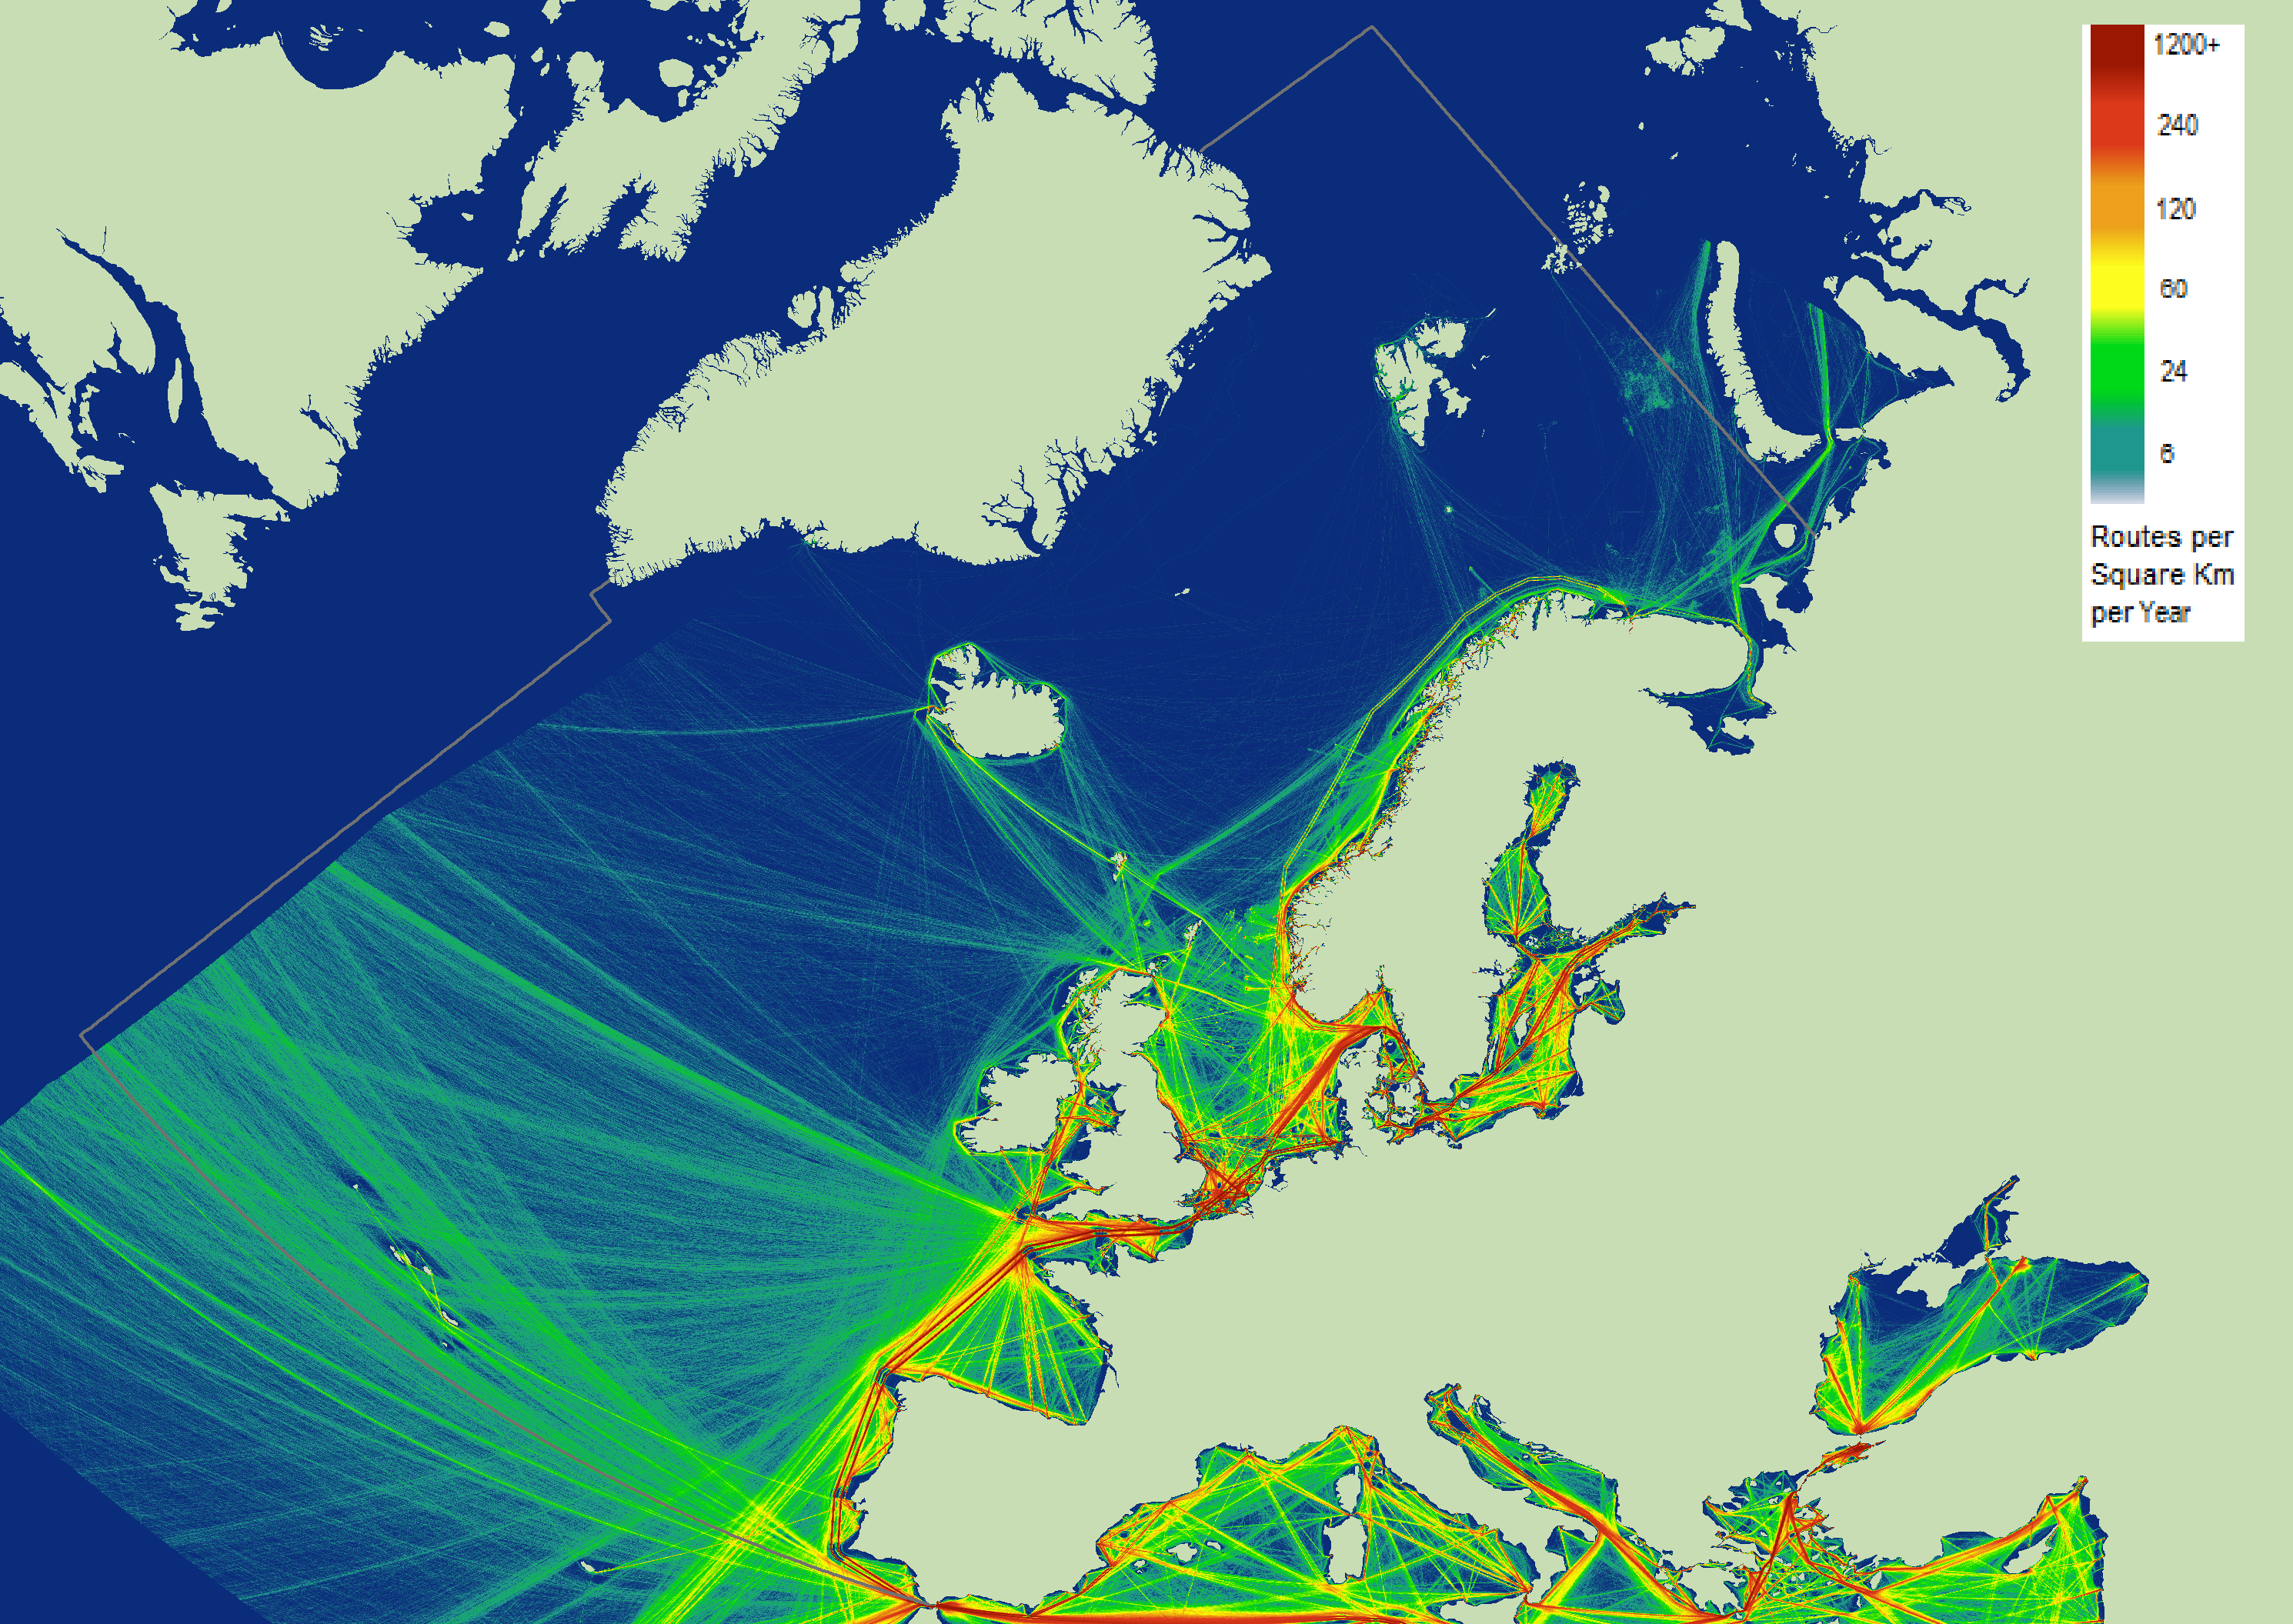
Figure 1: Route density map of cargo shipping in the OSPAR area 2019 (Source EMODnet 2020)
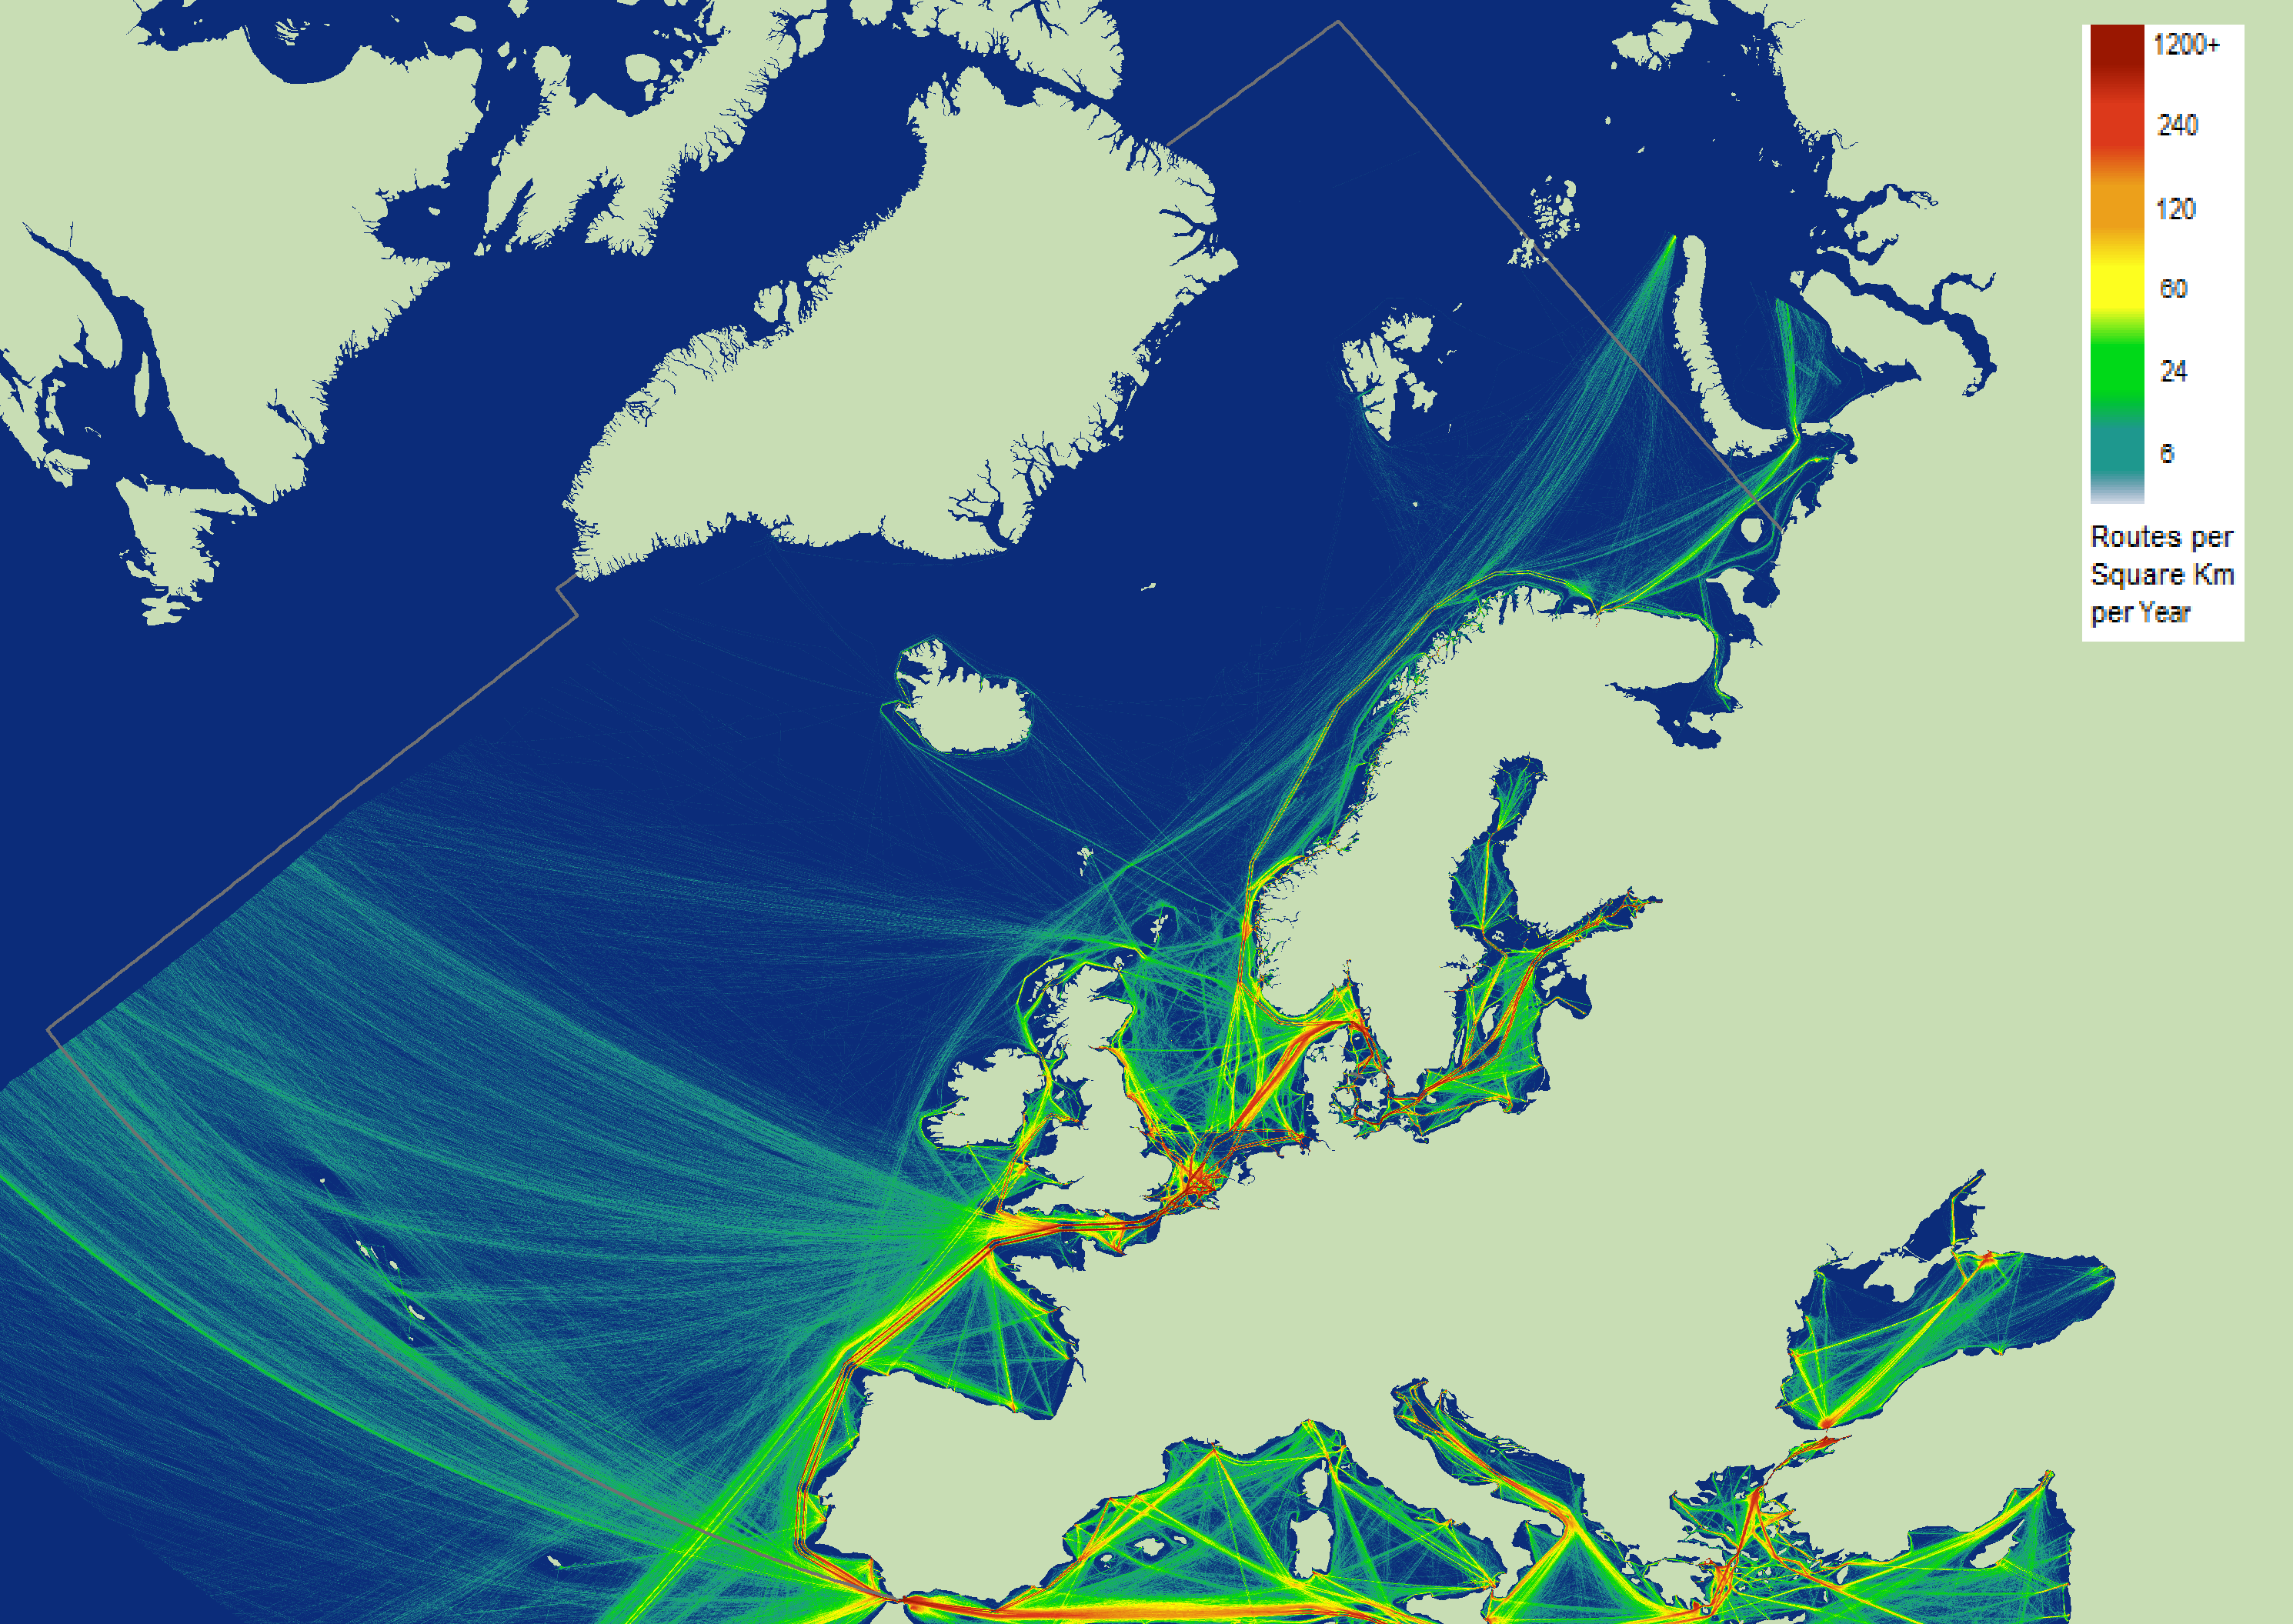
Figure 2: Route density map of tanker shipping in the OSPAR area 2019 (Source EMODnet 2020)
Figure 3: Major ports in the OSPAR region (Source Eurostat 2019) https://odims.ospar.org/maps/1802/
2.2 The assessment of shipping for QSR 2010 noted that maritime transport had been rapidly increasing and was expected to grow. In the event, maritime transport growth in the subsequent decade was affected by the economic downturn of 2008 onwards.
2.3 In 2018, the gross weight of goods handled in OSPAR ports was around 2,4 billion tonnes, almost identical to 2008. Around 1,45 billion tonnes was inwards transport to the ports and 0,95 billion tonnes was outwards transport. The Netherlands had the largest volume of sea-borne freight in Europe in 2018, 605 million tonnes (Eurostat, 2020a). Rates of change over the decade varied between countries and ports – for example, increases in freight handling in the Netherlands and Portugal, and decreases in the United Kingdom, Sweden, Denmark and France1 .
2.4 For some OSPAR countries, transport of goods to and from countries outside the European Union (EU) was the largest proportion of freight movements in 2018 (e.g. Belgium, the Netherlands, Germany, Spain), in others, transport between European ports was the larger proportion (e.g. Ireland, United Kingdom, Norway, Sweden) (Eurostat, 2020b). In some of the larger ports (e.g. Rotterdam, Antwerp, Hamburg) slightly more than half was from deep-sea transport; in others, short sea shipping predominates (Eurostat, 2020c).
2.5 The largest element of freight transport to/from OSPAR countries in 2018 was liquid bulk goods (such as liquified gas, crude oil and oil products), followed by containers, dry bulk goods (such as coal, ores and agricultural products) and Ro-Ro traffic. The relative proportion of containers was slightly higher in 2018 than ten years previously (Eurostat, 2020d)2 . Numbers of shipping movements decreased, while the tonnage of shipping and the numbers of larger ships increased3 . In 2008, Eurostat reported only 35 vessels above 200 k gross tonnage using OSPAR ports, almost all of them in one port, La Rochelle. In 2018, there were over 500, all container ships, predominantly in the ports of Bremerhaven, Hamburg, Wilhelmshaven, Felixstowe, Southampton, Rotterdam and Le Havre. The number of ships between 100 k and 200 k tonnage also increased (Eurostat, 2020e).
2.6 Passenger numbers embarking and disembarking in ports of OSPAR countries in 2018 were little changed from 2008 (Eurostat, 2020f). Routes and numbers are shown in the figures below.
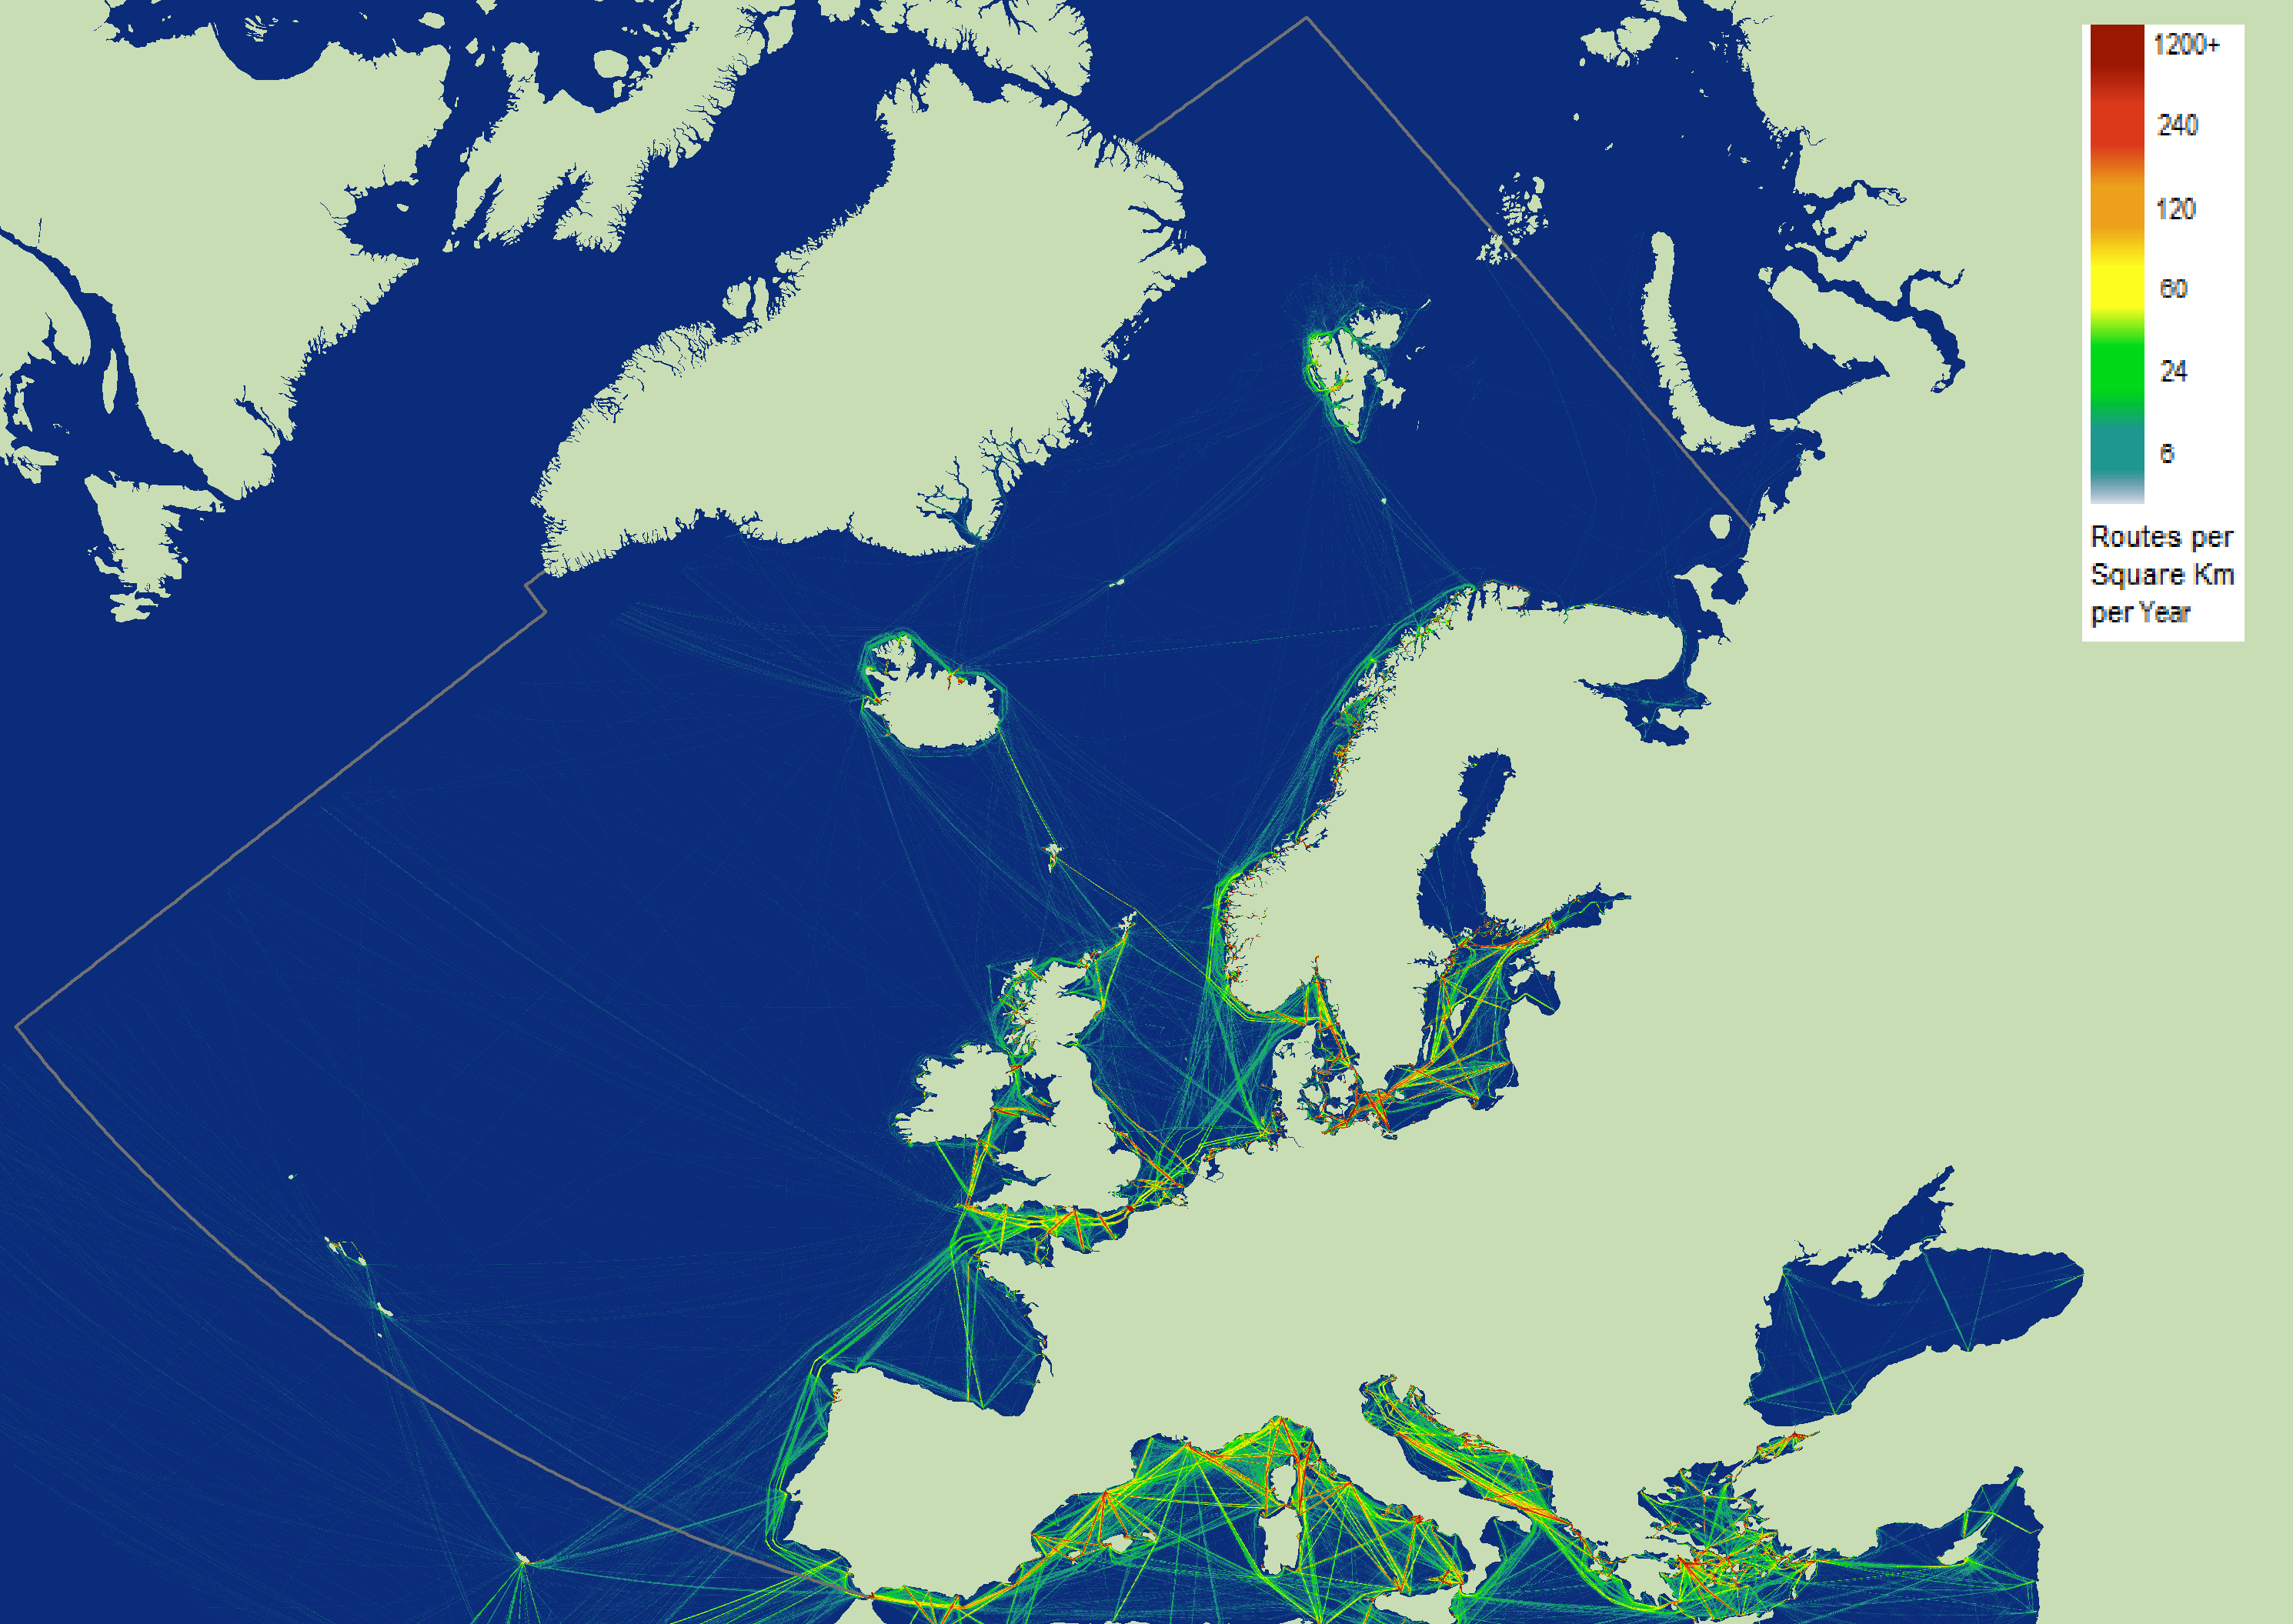
Figure 7: Route density map of passengers shipping in the OSPAR area (from EMODnet 2020). (The EMODnet shipping density maps do not distinguish between passenger traffic and cruise ship traffic)
2.7 Arctic shipping is a special case. The Arctic Council has reported that ship traffic in the overall Arctic region is increasing, due to factors such as increased resource extraction, tourism, and ice sheet thinning. Between 2013 and 2019, the number of ships entering the Arctic Polar Code area grew by 25% to 1628; the distance sailed grew by 75% to 9,5 million nautical miles. While fishing vessels were the largest contributors, bulk carrier transport increased substantially over the period (PAME, 2019).
Economic value
3.1 Maritime transport is critical to Europe’s economy, estimated to represent between 75% and 90% (depending on the sources) of the EU’s external trade and one third of intra-EU trade (European Commission, 2020a).
| 2009 | 2010 | 2011 | 2012 | 2013 | 2014 | 2015 | 2016 | 2017 | ||
|---|---|---|---|---|---|---|---|---|---|---|
| Atlantic Ocean | Maritime transport | 4.5 | 6.1 | 4.6 | 5.5 | 5.3 | 6.2 | 7.2 | 5.1 | 6.1 |
| Port activities | 10.2 | 9.6 | 12.3 | 9.9 | 10.2 | 10.5 | 12.7 | 11.8 | 11.7 | |
| Shipbuilding and repair | 3.4 | 4.2 | 4.1 | 5.0 | 4.4 | 5.1 | 5.3 | 5.0 | 5.9 | |
| North Sea | Maritime transport | 13.6 | 14.0 | 13.2 | 13.6 | 14.3 | 13.4 | 15.3 | 12.6 | 15.5 |
| Port activities | 10.9 | 11.1 | 11.4 | 11.7 | 11.8 | 13.1 | 14.7 | 14.7 | 15.4 | |
| Shipbuilding and repair | 3.8 | 4.5 | 4.3 | 4.6 | 4.6 | 4.9 | 4.7 | 4.9 | 5.6 | |
| None | 2009 | 2010 | 2011 | 2012 | 2013 | 2014 | 2015 | 2016 | 2017 | |
|---|---|---|---|---|---|---|---|---|---|---|
| Atlantic Ocean | Maritime transport | 53.1 | 51.8 | 49.4 | 50.6 | 49.5 | 52.0 | 54.8 | 45.1 | 53.3 |
| Port activities | 141.2 | 143.5 | 137.1 | 163.2 | 164.0 | 160.7 | 173.3 | 218.7 | 184.5 | |
| Shipbuilding and repair | 83.3 | 76.5 | 73.3 | 77.8 | 76.3 | 80.4 | 78.6 | 85.8 | 80.0 | |
| North Sea | Maritime transport | 142.2 | 143.6 | 150.9 | 149.9 | 150.5 | 145.6 | 150.9 | 145.8 | 152.8 |
| Port activities | 134.9 | 137.9 | 125.6 | 142.6 | 147.2 | 170.0 | 179.5 | 209.4 | 204.2 | |
| Shipbuilding and repair | 77.0 | 70.6 | 69.6 | 71.3 | 73.8 | 75.9 | 75.5 | 80.3 | 75.8 | |
Future trends
Volume and distribution of shipping
4.1 Recent reviews of future trends in shipping have generally anticipated growth in global volumes in the short and longer terms, but with uncertainties about the extent of that growth. For example, UNCTAD (2019) anticipated international maritime trade expanding at an average annual growth rate of 3,4% from 2019 to 2024, driven in particular by growth in containerized, dry bulk and gas cargoes. However, it noted that uncertainty about future growth remained, with risks that trade would be limited by slower overall economic growth and related factors such as trade tensions, shifts towards more regionalised trade flows, economic transitions (e.g. in China), supply side disruptions, and climate-change related impacts. Similar conclusions about overall growth are reached in other analyses (e.g. EMSA/EEA, 2021). The OECD’s International Transport Forum (ITF) forecast that the current demand pathway would see a tripling of maritime transport by 2050, but also noted some of the uncertainties (ITF, 2019). The impact of COVID-19 on global and regional trade flows remains to be seen, but could depress previous projections of shipping demand (EMSA/EEA, 2021). UNCTAD’s 2020 Review of Maritime Transport suggests that the COVID-19 pandemic will have a lasting impact on shipping and trade, such as through changes in globalisation patterns, supply chain designs, production models, technology uptake and consumer spending habits. Trends to lower trade-to-gross domestic product ratios and the regionalization of trade are likely to accelerate, with diversification in sourcing, routing and distribution channels growing in importance (UNCTAD, 2020).
4.2 There will be area-specific influences on the precise relationship between global trends and shipping in the OSPAR Maritime Area. For example, the ITF predicted that the North Atlantic Ocean will remain the third busiest maritime corridor by 2050, with 15% of global maritime freight routes. It also notes that new free-trade agreements, such as between the EU and Japan and the EU and Canada, are likely to lead to increased trade volumes (ITF, 2019). But there are a range of other factors affecting trade - for example, a report for the United Kingdom Government noted that countries with aging populations tend to spend a lower proportion of income on clothing or durable goods, which could dilute demand for shipping somewhat in those countries (UK Department of Transport, 2019).
4.3 The routes taken by ships in OSPAR waters may also change somewhat – for example, through re-routing as a result of windfarm construction, which could increase the length of shipping routes and, potentially, the risk of accidents. Navigational risk assessments will need to take these risks into account (Mehdi et al, 2018).
4.4 For Arctic waters, the Arctic Council has previously expected further increases in shipping activity (e.g. Arctic Council, 2017). How significant this will be remains uncertain - the ITF noted that there will be a trade-off between gains from shorter distance and the higher costs of Arctic shipping, so that the market potential for most types of shipments remains uncertain, although this could change if the Arctic became reliably ice-free (ITF, 2019). Similarly, a 2017 Foresight study for the UK Government noted that the Arctic shipping season is projected to triple in length by mid-century, potentially saving 10-12 days in routes from East Asia to Europe. Trans-Arctic routes may provide a useful supplement to traditional routes via the Suez Canal, though will likely not replace them, and whether trans-Arctic routes will become economically viable is unclear. However Arctic transport is also likely to grow due to increased destination shipping to serve natural resource extraction projects and cruise tourism (UK Government Office for Science, 2017).
Fleet composition
4.5 Changes in the nature of the fleet are also expected to take place over the next 30 years. UNCTAD reported that in 2019, bulk carriers, oil tankers and container ships represented the three largest sectors of global shipping by weight. More than half of those were ships less than ten years old. A younger fleet can assist moves towards the sustainability of shipping, as they tend to be more efficient and less liable to break or cause environmental damage. Scrapping of less fuel-efficient ships may also accelerate this transition (UNCTAD, 2019).
4.6 The last decade has also seen increases in the size of ships. As noted in paragraph 2.5, the gross tonnage of ships entering ports in OSPAR countries increased over the decade, while the number of movements either fell or did not increase by the same proportion. A study for the ITF in 2018 reported that the average and maximum size of container ships had doubled in the previous ten years, and that the proportion of larger ships will continue to grow to 2025. The average size of container ships on Far East – Europe routes was expected to grow from under 11 000 TEUs (twenty-foot equivalent units) in 2015 to over 16 000 TEUs by 2025 (Merk, 2018). International Maritime Organization (IMO) analysis of global trends does not consider the emergence of significantly larger ships very likely (e.g. 30 000 TEU), because the large investment in terminals would only be possible for a few ports, but does consider that an increased number of larger ships is likely (IMO, 2020a).
4.7 Changes in ship size can have several consequences. These include the need for more intense and deeper dredging, relocation or redesign of ports, and more environmental impact or losses of cargo if a serious accident were to occur. There has also been a move towards slower steaming associated with the introduction of larger ships (ITF, 2015). Speed reductions have been observed in vessels travelling to and from ports in the European Economic Area over the period from 2008 to 2018, with an average speed reduction of around 18%, but with higher reductions in some sectors (e.g. some container ship sizes, oil tankers) (European Commission, 2020).
4.8 The composition of the fleet and design of ships will also be influenced by initiatives to reduce greenhouse gas emissions and air pollution. IMO’s 2020 regulation on sulphur (see 6.22 below) is an important driver of change towards more efficient ships. On greenhouse gases, IMO’s 2018 strategy on reduction of greenhouse gases from shipping includes improvement of the existing energy efficiency framework, and work on development of low-carbon fuels and innovative technologies (IMO, 2018a). It envisages reductions in the carbon intensity of international shipping of at least 40% by 2030 and efforts to reduce by 70% by 2050. IMO work continues, for example to strengthen energy efficiency requirements for new ships, and the strategy will be reviewed in 2023. Energy efficiency can be improved through operational improvements and design features such as better hull design or propulsion aids such as sails or kites. Potential alternative fuels include liquified natural gas; electrofuels such as hydrogen or methanol; battery power; ammonia; and biodiesel or biogas (UNCTAD, 2019). The EU is funding research and innovation projects to promote the decarbonisation of water-borne transport, including projects concerned with electric ferries and novel materials to reduce ship weight (European Commission, 2020b). It is possible that fully autonomous unmanned ships could be in operation by 2035, particularly on short sea and coastal routes, allowing smaller and more efficient ships (UK Government Office of Science, 2018). The precise pace and details of fleet change remain uncertain and depends on factors which influence the shipping industry in general, as well as the viability of different alternative fuels. The recent European Maritime Transport Environmental Report outlines some of the advantages and disadvantages of different fuel systems (EMSA/EEA, 2021).
4.9 There may be some impact from the growth of schemes which seek to reward more sustainable shipping. Ships which meet defined criteria can qualify for incentives such as discounts for port fees. These include:
- The Environmental Ship Index ( https://www.environmentalshipindex.org/ ), overseen by the International Association of Ports and Harbours. It was designed by the ports of Le Havre, Bremen, Hamburg, Amsterdam and Rotterdam. Over 9 000 ships have a valid ESI score, based on assessments by the ship owner. It covers air pollutants and carbon dioxide, and also considers noise emissions. Incentives for ESI ships are offered by over 30 ports in the OSPAR area;
- The Clean Shipping Index ( https://www.cleanshippingindex.com/ ), which includes air emissions, chemicals (including antifouling coatings), waste and water and involves third party verification. It is used by the Swedish Maritime Administration as a tool for differentiating fairway dues;
- The Green Award ( https://www.greenaward.org/ ), which targets the highest performing ships through a certification procedure taking into account 50 different criteria. Incentives are available from some ports in Portugal, Germany, the Netherlands and Belgium.
4.10 A study by the ITF in 2018 reported that evidence on the impact of these schemes is limited, but that development of the schemes and more substantial incentives could help to nudge shipping towards further decarbonisation (ITF, 2018).
4.11 In Arctic Waters, a cross-cutting environmental provision is the IMO’s Polar Code (IMO, 2015), which entered into force in January 2017. It is mandatory for operational safety matters under SOLAS (the International Convention for the Safety of Life at Sea), and for environmental issues under the MARPOL Convention (the International Convention for Prevention of Pollution from Ships). Environmental matters include provisions on prevention of pollution by oil, sewage and garbage, and other guidance on pollution prevention. The environmental part of the Polar Code applies to all ships certified under the MARPOL Convention’s Annexes I, II, IV and V. Its implementation is supported by an Arctic Shipping Best Practice Information Forum under the auspices of the Arctic Council. IMO has also produced a draft regulation which will prohibit the use and carriage for use as fuel of heavy fuel oil in the Arctic, starting in 2024. The draft regulation will be put forward for adoption by the IMO Marine Environmental Protection Committee.
Quality Status Report 2010 and Intermediate Assessment 2017
5.1 QSR 2010 and its background paper on shipping (OSPAR, 2009) highlighted the substantial growth in shipping movements globally and in the OSPAR region over the previous 20 years. It summarised the main threats from shipping as:
- pollution by oil and hazardous or toxic substances;
- air pollution through emissions and particulate matters;
- discharge of operational wastes from ships, including raw sewage and litter;
- toxic chemicals used in antifouling paints and leaching of heavy metals from anodes;
- introduction of non-indigenous organisms through ballast water and hull fouling;
- pollution and physical impact through loss of ships and cargo;
- physical and other impacts including noise and collision with marine mammals.
5.2 QSR 2010 noted the development of measures to address some of these pressures, notably the MARPOL Convention’s Annexes 1 to VI. It urged OSPAR to promote strict implementation of measures, and to assess their effectiveness through better monitoring. It recommended OSPAR countries to promote action, within the IMO and amongst themselves, in various areas: for example, to implement the clean ship approach of the Gothenburg Declaration; to reduce air-borne emissions; to reduce waste; to eliminate organotin compounds from antifouling systems; to co-operate on oil spill prevention and counter-pollution measures; to apply measures on ballast water; and to improve assessment and data on the impacts of shipping, including the effects of ship noise and ship strikes on marine mammals.
5.3 IA 2017 noted developments in several of these areas: for example, major reductions in organotin compounds; and monitoring and measures relating to non-indigenous species. It reported that most OSPAR countries expect a future increase in shipping, but that due to measures such as regulation and marine planning, the environmental impacts of the sector were not expected to grow in proportion to the increase.
Analysis of specific pressures, impacts and measures
6.1 This section summarises key environmental impacts from shipping. Further information for the EU as a whole is available in the recent European Maritime Transport Environmental Report (EMSA//EEA, 2021).
Introduction of non-indigenous species – ballast water and hull fouling
What is the issue
6.2 Shipping is potentially a significant vector for non-indigenous species to enter the marine environment in the OSPAR area. Invasive non-indigenous species can threaten native biodiversity, with associated social, economic or environmental costs. Removal of non-indigenous species once established is virtually impossible, so prevention of their introduction is key. Shipping primarily transfers marine non-indigenous species in two ways:
- through exchange of ballast water;
- through organisms transported on ships’ hulls (biofouling).
6.3 Ballast water is used to maintain safe operating conditions for ships during voyages, but its intake and subsequent discharge can pose serious problems due to its role as a pathway for the transfer of species, potentially over great distances. Examples of non-indigenous species in the OSPAR area thought to have been introduced via ballast water include the ‘comb jellyfish’, Mnemiopsis leidyi, which caused large blooms in Dutch estuaries in 2006 and was subsequently found more widely in the North Sea; a diatom, Coscinodiscus wailesii, which first appeared in European shelf seas in 1977 and has now become a dominant member of the plankton community; and the habitat-destroying Chinese mitten crab Eriocheir sinensis (Reid et al, 2009).
6.4 A report from the International Council for the Exploration of the Sea (ICES) in 2019 looked at the issue of biofouling. Most commercial vessels represent some degree of biosecurity risk; recreational vessels are considered a particularly high-risk vector for secondary spread of non-indigenous species within the region. Some of the most widespread non-indigenous species with significant impacts have been transported by vessel fouling, such as the colonial sea squirt Didemnum vexillum. In the UK, this was initially confined to a small marina but, despite eradication attempts, ultimately spread all around the UK coastline. If global shipping trade does increase in the coming years, the risk of introduction of non-indigenous species through biofouling could rise. Other factors such as changing shipping routes, slower shipping speeds, environmental disturbance due to port development, and the impacts of climate change could also increase the risk (Galil et al, 2019).
Measures
6.5 At the time of QSR 2010, the IMO Convention for the Control and Management of Ships’ Ballast Water and Sediments (2004), had not yet come into force. OSPAR and HELCOM had developed voluntary interim guidelines for managing ballast water, based on those of the IMO, to be used on a voluntary basis, pending the ratification and entry into force of the Convention. However, QSR 2010 concluded that the risk of introduction of new species via this route continued to increase, due to higher numbers of ship movements and faster journey times favouring survival. It recommended that OSPAR countries should take measures to counter this, by applying ballast water exchange standards, ratifying the IMO Ballast Water Convention and promoting its entry into force, and assessing the risks of introducing non-indigenous species.
6.6 Subsequently, OSPAR, HELCOM and the Barcelona Conventions developed voluntary guidelines on ballast water exchange, which entered into force in 2012 (OSPAR, 2012). In 2015, in preparation for the entry into force of the Ballast Water Management Convention, OSPAR and HELCOM adopted a joint harmonised procedure for granting exemptions under the Convention in certain low-risk situations (OSPAR, 2015). This included an online decision support tool administered by OSPAR and HELCOM (recently updated).
6.7 The Ballast Water Management Convention entered into force in 2017. It requires ships to manage their ballast water to meet standards referred to as D-1 and D-2. The D-2 standard establishes quality requirements for the discharge of ballast water. It allows a specified maximum number of viable organisms and microbes to be discharged in order to prevent, minimize and ultimately eliminate the transfer of harmful aquatic organisms and pathogens. The standard is usually achieved by the installation of ballast water management systems (BWMS).
6.8 New ships must meet the D-2 standard; existing ships must initially meet the D-1 standard but, by 2024, all must meet the D2 standard. Every ship is required to have a Ballast Water Management Plan and International Ballast Water Management Certificate, and to keep a Ballast Water Record Book. The IMO has also issued guidelines on aspects of implementation, and continues to review the operation of the Convention during the current experience-building phase. Several amendments to the Convention and the Code for Approval of Ballast Water Management Systems (BWMS Code), replacing the former G8 Guidelines, came into force in October 2019; amendments and revised guidance were also adopted in 2020 (IMO, 2020b). In the EU, the European Maritime Safety Agency (EMSA) has produced material such as 2019 guidelines on best practices on sampling (EMSA, 2019).
6.9 As of 15 September 2020, 88 states and IMO associate members had ratified the Convention (IMO, 2020c), including all OSPAR Contracting Parties other than the United Kingdom, although the latter is drafting legislation and operates in accordance with the Convention’s guidelines.
6.10 For biofouling, IMO guidelines for the control and management of ships’ biofouling were adopted in 2011. There is also IMO guidance on minimising transfer of invasive aquatic species as biofouling (hull fouling) for recreational craft (MEP.1/Circ.792). In 2018, IMO agreed a process to review the guidelines. Globally, a proposal to the Joint Group of Experts on the Scientific Aspects of Marine Environmental Protection (GESAMP) highlighted that the application of the IMO Biofouling Guidelines has been inconsistent, and mentioned challenges such as dealing with irregular surfaces and cavities, and assessing the efficacy of new in-water cleaning technologies (GESAMP, 2019). ICES also highlighted improvements that could be made such as targeted guidelines dependent on vessel type and operational profiles, hull form optimisation, and better assessment of compliance (Galil et al, 2019).
6.11 OSPAR continues to consider management of ballast water and biofouling through a joint task group with HELCOM.
Assessment of impacts of measures
6.12 Since 2003, OSPAR Contracting Parties have tracked and reported the number of new introductions of non-indigenous species into the Greater North Sea, Celtic Seas, and Bay of Biscay and Iberian Coast. IA 2017 reported a relatively consistent growth in the North Sea over the previous decade, with more uneven trends elsewhere. Confidence in the data was, however, fairly low.
6.13 A study on non-indigenous species published by the European Environment Agency (EEA) in 2019 reported that, between 1949 and 2017, 256 non-indigenous species were recorded in the North-East Atlantic Ocean (EEA, 2019). The highest proportion was of invertebrates, such as crustaceans and molluscs; followed by primary producers (marine plants and algae), and vertebrates (mainly fish). The number of new recorded non-indigenous species dropped from 49 in the period from 2006 to 2011 to 23 in the period from 2012 to 2017. For the Icelandic Shelf, no new species were recorded in the latter period. There were also decreases in other European seas. However, the EEA report does not comment on the reasons for this recent decrease or whether this is a long term trend resulting from implementation of better practices, in shipping or in other sources of non-indigenous species. New reports of the spread of harmful non-indigenous species are still being received – for example, ICES noted recent new occurrences of the invasive tunicate Didemnum vexillum (ICES, 2019a). The OSPAR/HELCOM task group on ballast water has developed a robust monitoring system for port areas. At the same time, monitoring of non-indigenous species is considered to be one of the particular gaps in knowledge for implementation of the Marine Strategy Framework Directive (European Commission, 2020).
Shipping Noise
What is the issue
6.14 Shipping is the major source of anthropogenic underwater noise. The effects of underwater noise are not fully understood; only a few species of marine mammals and fish have been tested for their hearing range and sensitivity. Potential impacts could include damage to hearing, or disruption to behaviour such as foraging, migration and reproduction, at an individual or population level (European Commission, 2019a; OSPAR 2020). Most of the underwater noise is caused by propeller cavitation – the formation and implosion of water vapour cavities as water moves across a propeller blade - but onboard machinery and operational modification issues are also relevant (IMO, 2014), as well as ship sonar. A policy brief from the JOMOPANS (Joint Monitoring Programme for Ambient Noise North Sea) project noted that the influence of various parameters, such as propeller, speed and draught, on shipping noise remains largely unknown (JOMOPANS, 2019).
 versus Frequency (measured in Hertz or \"cycles per second\") (Source OSPAR, 2020)")
Figure 9: Levels and frequencies of anthropogenic and naturally occurring sound sources in the marine environment. Spectrum Noise Level ("Acoustic intensity per Hertz") versus Frequency (measured in Hertz or "cycles per second") (Source OSPAR, 2020)
6.15 At the time of QSR 2010, it was estimated that there had been an approximate doubling (3 dB increase) of background noise per decade since the 1950s in some ocean areas, with commercial shipping being the most probable source of that impact (OSPAR, 2009).
Measures
6.16 Because of the uncertainties surrounding the scale and impact of noise, a better understanding of the level of ambient noise, including the contribution of shipping, in the OSPAR area is a key to better management of the issue. In 2015, OSPAR adopted an ambient noise monitoring strategy, based on sound maps generated primarily by modelling, supported with measurements for validation. On the basis of this, monitoring programmes for specific regions could be developed.
6.17 Work on monitoring in the North Sea is being carried out under the JOMOPANS project, using a combination of modelling and measurement. This is a three year project running from 2018. By combining sound maps with distribution maps of sensitive species it will improve understanding of whether noise is compromising good environmental status of the sea, including high risk areas and times of year. In the North Atlantic, the JONAS (Joint Framework for Ocean Noise in the Atlantic Seas) project, launched in May 2019, is carrying out similar tasks.
6.18 Specific measures targeting shipping noise have been taken through the IMO. In 2014, IMO approved non-mandatory guidelines on reducing noise from commercial shipping, focusing mainly on propellers, the design of the hull, on-board machinery and operational and maintenance recommendations. The guidelines also include definitions and measurement standards. The largest opportunities to reduce noise are in the design phase for new ships (IMO, 2014). In Europe, the AQUO project (Achieve Quieter Oceans by shipping noise footprint reduction) produced guidelines covering ship design, including for propellers, and traffic management. A cost-benefit analysis of technical options and incentives for reducing shipping noise can be found on the Netherlands government portal on the North Sea (Strietman et al, 2018), including incentives such as inclusion of noise in green shipping indices and voluntary or mandatory measures to promote slow shipping speeds. The World Organisation of Dredging Associations has also published guidance on underwater noise associated with dredging (WODA, 2013).
Assessment of impacts of measures
6.19 To date, it is thought that these guidelines have not yet had an effect on overall shipping noise, and some modelling suggests that underwater noise has increased in EU waters since 2014 (EMSA/EEA, 2021). The terms of reference for OSPAR’s expert group on noise (ICG Noise) include work on a regional action plan with proposals for measures.
Air pollution and exhaust gas cleaning systems
What is the issue
6.20 The European Environment Agency’s TERM report on the environmental impacts of aviation and shipping summarised evidence on air pollution from shipping (EEA, 2018). It reported that, in the European Union, international shipping contributed 16% of NOx, 4% of particulate matter with a diameter of 10 μm or less (PM10), 7% of PM2.5 and 16% of SOx emissions. According to a more recent report by EMSA/EEA, in 2018, air pollutant emissions produced by the maritime transport sector in the EU, including international, domestic and inland waters navigation, represented 24% for NOx, 24% for SOx and 9% of PM2.5 as a proportion of national EU emissions from all sectors (EMSA/EEA, 2021).
6.21 Most air pollutant emissions occur close to the shore: on average, 70 % of emissions are released within 400 km of the coast; in the North Sea, 97% of emissions are released within 100 nautical miles of the shore, due to increased shipping near ports and the nature of shipping activities in those areas. Shipping emissions can therefore have a significant contribution to air pollution on land with negative impacts on human health, as well as deposition at sea leading to acidification and eutrophication effects. For Black Carbon, a component of PM which is an air pollutant and a climate forcer, there is also an impact from releases in Arctic shipping routes, as deposition on snow and ice reduces the reflection of sunlight and increases the rate of melting.
6.22 The EEA report suggested that emissions would increase over the period from 2006 to 2020, with PM2.5 emissions increasing by up to 15% in the North Sea, the Baltic Sea and surrounding coastal areas. QSR 2010 also anticipated increases in shipping emissions. Shipping emission trends up to 2050 are outlined by recent studies funded by the European Commission looking into the feasibility to extend Emission Control Areas in all EU seas (IIASA, 2018).
Measures
6.23 Measures under the MARPOL Convention (Annex VI) and/or EU Directives have been implemented to target air pollution from shipping. For sulphur emissions:
- a global cap of 4,5% on the sulphur content of marine fuels came into force in 2006; this was reduced to 3,5% in 2012;
- passenger ships on journeys to or from any European Community port had a maximum sulphur limit of 1,5% since 2006;
- a 0,1% maximum sulphur requirement for fuels used by ships at berth in EU ports was introduced from 1 January 2010;
- the North Sea and English Channel is a SOx Emission Control Area (SECA) under the MARPOL Convention. From November 2007, sulphur limits were 1,5%; reduced to 1% from July 2010; and to 0,1% from January 2015. (There is also a control area in the Baltic Sea.);
- from the start of 2020, the MARPOL Convention requires ships in waters other than SECAs to use fuels with a sulphur content of no more than 0,5%.
6.24 Higher sulphur contents are still possible, but only if exhaust gas cleaning systems (EGCS) are installed on board. IMO guidelines on EGCS, including some requirements on water discharge, are periodically revised (see below). The EU introduced mechanisms primarily to promote and support compliance with low sulphur and alternatives fuels and on EGCS technology ahead of the entering into force of the SECA requirement due to the concerns raised by the negative impacts of their discharges into the water (detailed in European Commission, 2018).
6.25 For nitrogen oxides, Annex VI of the MARPOL Convention has a system of tiers setting emission limits. Tier I applies to ships constructed from 1 January 2000, Tier II to ships constructed from 1 January 2011, and Tier III to ships operating in NOx Emission Control Areas (NOx ECAs) from 1 January 2016. In October 2016 IMO introduced new NOxECAs for the North Sea (including the English Channel and Skaggerak) and Baltic Sea. From 1 January 2021, all ships in those EU waters constructed after that date and passing through these areas must use Tier III standards. National measures are also being considered – for example for world heritage fjords in Norway , with tighter regulations up to Tier III standards for all ships by 2025 (Norwegian Maritime Authority, 2019). While for inland shipping strict NOx engine standards already exist in EU legislation, consideration is being given under the Green Deal to establish stricter NOx requirement for sea-going ships.
6.26 The Bonn Agreement agreed in 2019 to include cooperation on surveillance in respect of the requirements of Annex VI to the MARPOL Convention within its scope. Once the decision is ratified by all Contracting Parties, a common MARPOL Annex VI monitoring strategy will be developed in the Bonn Agreement area.
Assessment of impacts of measures
6.27 Eurostat’s time series of emissions from shipping, by country, show reductions in emissions of almost all air pollutants, in most OSPAR countries, from international and national navigation over the decade to 2017 (Eurostat, 2020h).
6.28 The 2018 report from the European Commission on the initial implementation of sulphur controls in SECAs reported that the measures were having an impact. Over 93% of inspected ships had complied with the measures, and SOx concentrations in regions bordering SECAs had been observed (e.g. 50% reduction at the German North Sea island 'Neuwerk' and over 20% reduction in the Rotterdam-Rijnmond region) (European Commission, 2018). Early evidence of reductions was also summarised in a 2016 report by the ITF (ITF 2016). Considering the positive experience with existing SOx ECAs, the EU is considering a SOx ECA also in the Mediterranean Sea in the context of the Barcelona Convention as well as in all other EU waters (including the Black Sea).
6.29 A recent report from EMSA and the EEA reported that between 2014 and 2019, air pollutant emissions from the maritime transport sector have generally stabilized in all regions of Europe. SOx emissions had largely decreased from 2015 in the North and the Baltic Sea. NOx emissions had remained stable in all regions except in the Baltic Sea (EMSA/EEA EMTER due for publication in 2021).
Water Discharges from exhaust gas cleaning systems
6.30 Reports by ICES and EMSA/EEA have highlighted that the increased restrictions on sulphur emissions have resulted in an increased number of ships installing exhaust gas cleaning systems, as an equivalent compliance means, also known as scrubbers. These allow ships to use high sulphur heavy fuel oil, while reducing emissions of sulphur oxides. The process results in discharges of large volumes of acidified water containing contaminants such as heavy metals, polycyclic aromatic hydrocarbons, oil residues and nitrates. The most common type of scrubber, open loop, discharges these waters directly to the sea. This can be particularly concerning in areas of high traffic density, and in ports close to environmentally sensitive areas (e.g. Hassellöv et al, 2020; ICES, 2020; EMSA/EEA, 2021) as well as in high seas. The ICES work concluded that if scrubbers continue to used, then there is an urgent need for investment in technological advances and port reception facilities to allow zero discharge closed loop scrubber systems; improved measurement, monitoring and reporting of discharges, and regulations on scrubber water discharge limits considering the full range of contaminants.
6.31 In order to address the impact on human health and the marine environment of exhaust gas cleaning systems operations on the environment, the IMO Marine Environment Protection Committee launched in 2019 a new work strand based on an initiative of the EU member states. This work is being carried out by the IMO’s sub-committee on pollution prevention and response, with the aim to conclude on the required risk and impact assessment framework and on the possible development of guidelines and regulations restricting discharges from EGCS.
Litter
What is the issue
6.32 IA 2017 reported that marine litter, in particular plastic, is abundant on beaches, in the water column and on the seafloor. OSPAR’s strategic objective to substantially reduce marine litter to levels where it does not cause harm to the environment had not been met. Over 80% of items found in beach litter monitoring are plastics, and items from sea-based sources (fishing and shipping) make up a significant proportion: 44% of items in Arctic Waters between 2011 and 2017; 34% in the North Sea; 18% in the Bay of Biscay and Iberian Coast; and 12% in the Celtic Seas (OSPAR, 2018a).
6.33 Measures restricting discharge of litter from shipping have long been in place. Annex V of the MARPOL Convention, which seeks to eliminate and reduce the amount of garbage being discharged into the sea from ships, came into force at the end of 1988. These have been supplemented by subsequent amendments and guidelines (e.g. IMO, 2017). Designation of the North Sea as a Special Area, with tighter restrictions, came into force in 1991. In 2000, the European Community adopted Directive 2000/59/EC on port reception facilities, with the aim of substantially reducing discharges of ship-generated waste and cargo residues into the sea, through improving availability and use of port reception facilities. Nonetheless, the evidence from the OSPAR Intermediate Assessment 2017 suggested that more needed to be done to address litter from shipping.
6.34 Losses of goods being transported, such as from container ships, also contribute to marine litter. According to the World Shipping Council, over 1 500 containers are lost globally each year (European Commission, 2019b). Individual incidents can be substantial: for example, in early January 2019, the MSC ZOE lost 342 containers north of the Wadden Islands while en route to Bremerhaven. Most of the containers were destroyed and some of the cargo residues washed ashore on the Wadden Islands and Dutch coast, while other litter from the Zoe remains in the marine environment. It was estimated that 3 257 tonnes of material (containers and contents) entered the sea, mainly consumables and packaging, but also raw material for the plastics industry. One container lost 22,5 tonnes of tiny polymeric beads. By mid-November 2019, 87% of containers and 75% of the cargo had been recovered; it is expected that most of the rest will be irrecoverable (BSU, 2020). There were also losses from Trans Carrier in February 2020 (Norwegian Coastal Administration, 2020a).
6.35 Petroleum waxes and vegetable oils can be discharged legally (under certain conditions regulated by Annex II of the MARPOL Convention) as a result of washing of cargo tanks, as well as through accidental releases. These can have detrimental impacts on birds and marine species; around 3% of all beach litter retrieved in 2016 in the EU was paraffin waxes (Addamo et al, 2017).
Measures
6.36 In 2014, OSPAR agreed a Regional Action Plan for Marine Litter, which includes actions to address litter from shipping, including collective actions as well as national measures (OSPAR, 2014). Actions included:
- coordination on implementation of Directive 2000/59/EC, including on a cost recovery system, analysing the implementation of compulsory discharge of waste in EU ports for ships leaving the OSPAR Maritime Area for non-EU ports; and informing the revision of the Directive;
- identifying best practice in relation to inspections for ship generated waste covered by the MARPOL Convention’s Annex V;
- actions on awareness raising, including a recommendation on sustainability education programmes for fishers (OSPAR Recommendation 2019/01;
- improving implementation of ISO standard 201070:2013 in relation to port reception facilities;
- analysing penalties and fines issued by Contracting Parties for waste disposal offences.
6.37 Issues addressed by OSPAR Contracting Parties during revision of the Directive on port reception facilities included the need for a cost recovery system providing a sufficient incentive for ships not to discharge garbage at sea. The revised Directive (Directive (EU) 2019/883) has now entered into force and will require a 100% indirect fee system for waste covered by the MARPOL Convention’s Annex V (other than cargo residues) so that there are no additional charges based on the volume of waste delivered.
6.38 OSPAR has also reviewed best practice policies to encourage advanced shipboard waste management in line with legislation and guidelines, including the revised ISO 21070 standard. It showed that several ports and governments facilitate and reward advanced onboard waste management, but suggested a more coordinated approach in the OSPAR region, including encouraging voluntary facilitation and reward for advanced waste management on board ships, and for OSPAR Parties to report on progress.
6.39 OSPAR’s Intersessional Correspondence Group on Marine Litter (ICG-ML) provides a forum where the implementation of OSPAR’s Regional Action Plan can be considered. A 2018 meeting on illegal waste disposal from ships looked at ways to strengthen the implementation of measures, including through better access to data, improved training and imposition of fines addressed by the North Sea Network of Investigators and Prosecutors among others (OSPAR, 2019).
6.40 Globally, in 2018, IMO adopted a new action plan to address plastic litter from ships (IMO, 2018b). This addresses issues such as better record keeping and enforcement; the availability and adequacy of port reception facilities; enhancing public awareness, and consideration of a compulsory mechanism to declare loss of containers at sea. Losses of containers have also been looked at in work by the European Commission (European Commission, 2019b); recommendations on issues such as technical standards for container ships and on route-specific risks were also made in reports on the loss of containers from MSC ZOE (BSU, 2020; DSB, 2020).
6.41 The effectiveness of these measures, many of which are recent or still being developed, is not yet clear, particularly as there is no reliable baseline of litter inputs from commercial shipping.
Physical disturbance of the sea bed – navigational dredging
What is the issue
6.42 Dredging to maintain, create or deepen navigation access to ports and harbours can have multiple environmental effects. These could include:
- the release of contaminants to the water column (such as heavy metals and TBT);
- turbidity through suspended sediments;
- local changes in benthic habitats and biological communities, in particular because of smothering when sediments are dumped
- effects on sensitive communities when channels are deepened or new facilities created, for example through changes in tidal characteristics.
6.43 Most of the material dredged within the OSPAR maritime area is either uncontaminated or only slightly contaminated by human activities, but a smaller proportion is contaminated so that major environmental constraints need to be applied when developing management options (OSPAR, 2014).
Measures
6.44 Control of dredging and disposal is managed in accordance with several European directives (e.g. the Birds and Habitats Directives; Environmental Impact Asssessment Directive; Water Framework Directive; Marine Strategy Framework Directive; Waste Framework Directive) and national legislation. OSPAR itself has produced guidelines for the management of dredged material (OSPAR, 2014b). These set out a Best Environmental Practice approach for minimising both the amount of material dredged and the impacts of dredging and disposal.
6.45 The Central Dredging Association has also recently published guidance on assessing and evaluating environmental turbidity limits (CEDA, 2020).
Impact of measures
6.46 A report on the use of OSPAR guidelines was presented to EIHA (OSPAR Environmental Impacts of Human Activities Committee) in 2020. Returns from Contracting Parties reported that 2014 dredging guidelines were being fully implemented in the majority of the OSPAR Maritime Area4 .
Physical disturbance of the sea bed – other disturbance
6.47 The wakes produced by ships can result in suspended sediment in shallow areas, increasing turbidity and affecting organisms which depend on light. This can have an impact on the productivity of habitats, such as rivers and estuaries near harbours, or in the vicinity of shipping lanes. Analysis shows that, within European seas, the North Sea has the highest proportion of its area potentially disturbed by ship wakes. This may affect some protected species and habitats, but there is no available information demonstrating this impact. The North Sea also has the highest extent of protected areas potentially affected by anchoring (EMSA/EEA, 2021).
Pollution by oil or other noxious substances
What is the issue
6.48 Pollution from oil or other noxious substances can occur through accidents or deliberate operational discharges. A 2016 review from the European Commission’s Joint Research Centre summarised information on pollution of the sea by sea-based sources of chemical contaminants, including from shipping. Operational discharges can include releases from procedures such as tank cleaning, deballasting, or release of bilge water from machinery. While such discharges are subject to environmental regulations, discharges do sometimes occur. As well as oil, other contaminants may be released: work has been done to identify and prioritise such contaminants according to their environmental toxicity. For non-oil pollutants, between 1978 and 2013, the most released substances in European waters were styrene, sulphuric acid, benzene, and phosphoric acid (Tornero & Hanke, 2016). Ships also discharge grey water and sewage; nitrogen from sewage can have a significant impact in eutrophic environments (EMSA/EEA, 2021).
6.49 The number of oil spills in European waters has dropped in recent years. The European Maritime Safety Agency (EMSA) reported that the numbers of oil spills detected by its CleanSeaNet, the European satellite-based oil spill monitoring and vessel detection service, had dropped by half between 2007 and 2017, and there were no incidents of the scale of previous oil spills from the Erika in 1999 and Prestige in 2002 (EMSA, 2017). In 2019, although the number of spills detected by CleanSeaNet had risen since 2017, this was due to greater coverage, and the average number per unit of sea area was the same as in 2019 (EMSA/EEA, 2021). For the area covered by the Bonn Agreement, Contracting Parties detected by aerial surveillance a total of 65 mineral oil slicks in 2019, and no spills over 100 m3 were observed. The source of the pollution was identified for only 30% of the detections, coming from shipping and offshore installations in the same proportion. There were also 100 detections of other substances and 114 detections of unknown substances. The number of slicks detected has fallen over the past decade (Bonn Agreement, 2019a).
6.50 While the number of incidents has reduced, there may nevertheless be emerging risks to consider. The Bonn Agreement’s BE-AWARE II project noted that increasing competition for space, including from renewable energy installations, may increase the risk of collisions (Bonn Agreement, 2015). The ICES ecosystem review of the Barents Sea reported that transport of oil and other petroleum products from northwestern Russia has increased in the last decade, and that the capacity from Russian Arctic oil export terminals will increase in future. ICES notes that risk of oil tanker accidents will increase unless measures are taken to reduce such risk (ICES, 2019b). Oil transportation to and from the Baltic Sea has also increased (e.g. analysis by Brunila & Storgård, 2014).
6.51 Another emerging issue is the new low sulphur fuels, also called hybrid fuels, and sold as Ultra Low Sulphur Fuel Oil (ULSFO, with a maximum of 0,1% sulphur) and Very Low Sulphur Fuel Oil (VLSFO, with a maximum of 0,5%). These came to the market in the wake of the IMO sulphur emission restrictions for the North Sea and Baltic Sea Emission Control Areas. Studies have shown that these fuels have physical properties that make conventional clean-up methods difficult and are more toxic to marine life than traditional fuels, although more research is needed (e.g. Jönander & Dahllöf, 2020). The EU-funded IMAROS project running from 2020 to 2021 and coordinated by the Norwegian Coastal Administration aims to improve response capacities and understand the environmental Impacts of new generation low sulphur MARine fuel Oil Spills (IMAROS) (Norwegian Coastal Administration, 2020b).
6.52 Petroleum waxes and vegetable oils can be discharged legally (under certain conditions regulated by Annex II of the MARPOL Convention – see paragraph 6.53 below) as a result of washing of cargo tanks, as well as through accidental releases. These can have detrimental impacts on birds and marine species; around 3% of all beach litter retrieved in 2016 in the EU was paraffin waxes (Addamo et al, 2017).
Measures
6.53 Since 1983, the MARPOL Convention and subsequent amendments to it have mandated measures to limit the risk of pollution. Annex I covers prevention of pollution from operational measures as well as accidental discharges, including requirements on tanker construction. The North West European Waters are a special area under the Annex, in which particularly stringent measures governing discharges apply.
6.54 Annex II covers the control of pollution by noxious liquid substances in bulk: discharge of residues is allowed only to reception facilities until certain concentrations and conditions are complied with, and no discharge of residues containing noxious substances is permitted within 12 miles of the nearest land. An amendment adopted in 2019 strengthens the discharge requirements for cargo residues and tank washings containing persistent floating products with a high-viscosity and/or a high melting point that can solidify (e.g. certain vegetable oils and paraffin-like cargoes). This applies in specified areas including North West European waters, Baltic Sea area, Western European Waters and Norwegian Sea). It entered into force on 1 January 2021.
6.55 In order to establish effective cooperation to ensure that discharges of polluting substances from ships are detected in time and that the offenders are identified, EMSA has developed CleanSeaNet. EMSA also has a network of stand-by oil response vessels, as well as mechanisms for provision of rapid advice to support coastal states responding to incidents involving chemicals or hazardous and noxious substances.
6.56 The Wadden Sea (2002) and Western European Waters (the Western coasts of the United Kingdom Ireland, Belgium, France, Spain and Portugal, 2004) have been designated as Particularly Sensitive Sea Areas by the IMO in light of the risks posed by the carriage of goods. Area-specific routeing and reporting schemes are in place to reduce the risks to these PSSAs. Moving of shipping lanes further out from the coast to reduce the risk of harm from factors such as oil spillage has also taken place in Icelandic waters (ICES, 2019c).
6.57 For part of the OSPAR Maritime Area – the Greater North Sea and its wider approaches including the Irish Sea, Celtic Seas, part of the Norwegian Sea and parts of the North-East Atlantic, the Bonn Agreement provides a mechanism for cooperation in monitoring the implementation of the MARPOL Convention’s Annexes. Over the past decade, its strategic action plans have included actions on matters such as collaboration on enforcement, emergency preparedness and effective response to incidents (e.g. in Bonn Agreement, 2016). Its strategic plan for 2019-2025 includes operational objectives in matters such as surveillance and reporting of shipping, compliance monitoring, and common understanding of emergency response approaches (Bonn Agreement, 2019b).
6.58 As well as operating CleanSeaNet, EMSA has a European-wide network of stand-by oil response vessels and equipment, as well as mechanisms for provision of rapid advice to support coastal states responding to incidents involving chemicals or hazardous and noxious substances. The EU Emergency Response Coordination Centre (ERCC) ensures the rapid deployment of emergency support.
6.59 The North Sea Network of Investigators and Prosecutors promotes enforcement of pollution in relation to Annexes I and II of the MARPOL Convention helping to deter further offences.
Impact of measures
6.60 The EMSA and Bonn Agreement reports mentioned above show a decline in incidents over the past decade. EMSA’s report on the first decade of CleanSeaNet concluded that there had been significant progress by coastal states in addressing illegal discharges of oil and other substances through measures such as monitoring, inspection, enforcement, and pollution response plans (EMSA, 2017). EMSA also suggests that there has been a clear deterrent effect of the CleanSeaNet satellite-based oil monitoring service. Although the number of CleanSeaNet detections in the Bonn Agreement area actually rose between 2017 and 2018, this is potentially due to better resolution of images as well as increased volume of services (Bonn Agreement, 2019b).
6.61 According to the Bonn Agreement BE AWARE Trend Analysis 2019 the risk-reducing measures introduced over the last decade and the recent levels of emergency intervention capacities have had a positive effect either with respect to navigational safety or in mitigating the extent of oil spills, more or less stabilising the risk situation despite growing ship sizes and ship passage numbers (Bonn Agreement, 2019c).
Antifouling coatings
What is the issue
6.62 Environmental problems from past use of organotin compounds in antifouling treatments have reduced since the use of tributyltin (TBT) was prohibited in 2008 under the International Convention on the Control of Harmful Antifouling Systems on Ships (the AFS Convention). IA 2017 reported that concentrations detected in marine sediments have fallen considerably and are often below the limit of detection. In the Dutch part of the southern North Sea, the only area with sufficient monitoring data, data showed a decreasing trend in sediment concentrations.
6.63 Biocides used since the ban may still have environmental impacts, if less severe than TBT. Copper is a major component of antifouling paints, and increasing concentrations of copper are now found in sediments near harbours and shipping lanes. Other booster biocides can be toxic and persistent.
Measures and impact of measures
6.64 In 2016, an OSPAR report on copper in the marine environment considered that further legislation and research into antifouling systems is probably needed to reduce concentrations in coastal waters with high shipping intensity (OSPAR 2016).
6.65 Measures have been taken to restrict the use of some booster biocides. For example, in the UK, Denmark and Sweden, national measures were taken to restrict the use of cybutryne and, in 2017, the European Commission adopted a decision that effectively prohibits the marketing and use of antifouling paints containing cybutryne in all EU Member States. Following an EU submission, the IMO’s responsible Marine Environment Protection Committee (MEPC) approved draft amendments to the AFS Convention to include controls on the biocide cybutryne at its November 2020 meeting. They will now be circulated with a view to adoption at MEPC 76.
6.66 The ruling to prohibit antifouling systems containing cybutryne (also known under its industry name Irgarol-1051) would apply to ships from 1 January 2023 or, for ships already bearing such an antifouling system, at the next scheduled renewal of the antifouling system after 1 January 2023, but no later than 60 months following the last application to the ship of such an antifouling system.
6.67 Research has been carried out on the possibility of more sustainable antifouling solutions – e.g. the European FP7 collaborative project on low emission antifouling (LEAF). The IMO has also funded research on the likelihood of microplastic release from marine paints, in particular antifouling systems, although this is at an early stage (IMO 2019b). The scoring for the Clean Shipping Index (see para 4.9 above) reflects the type of biocide used, and non-toxic fouling release coatings get the highest scores.
Collisions with marine mammals
6.68 Ship strikes can cause death or injury to cetaceans, but the lack of good data on populations and on animals affected means that the impact is difficult to assess (OSPAR, 2018; EMSA/EEA, 2021). National reports under ACSOBANS (Agreement on the Conservation of Small Cetaceans of the Baltic, North East Atlantic, Irish and North Seas) include deaths from possible ship strikes.
6.69 The International Whaling Commission (IWC) has developed a strategic plan for work on mitigating the impacts of ship strikes on cetacean populations. The plan covers measures such as re-routing and speed reduction; better reporting of incidents; development and use of avoidance technologies; and identifying high risk areas where high volumes of shipping overlap with high numbers of whales. None of the high risk areas so far identified in the plan are within the OSPAR region, although the Strait of Gibraltar is identified as a high risk area within the Mediterranean for fin and sperm whales (Cates et al 2017). IWC also maintains a global database on ship strikes.
Conclusions
7.1 Key messages5
- While global shipping is projected to expand in future years, the extent to which volumes of shipping in OSPAR waters will change remains uncertain;
- As well as the volume of shipping, changes in the fleet composition need to be taken account of in understanding impacts and risks. These include environmental improvements (for example, due to greenhouse gas or air pollution measures) but also changes in ship size (e.g. towards larger ships) or moves to alternative fuels. OSPAR may want to better understand potential future trends;
- While measures for the management of some impacts have developed significantly over the past decade (e.g. on ballast water, air pollution, litter) OSPAR could keep a close watch on how they are implemented and evidence of their success (or not);
- Continuous noise from shipping remains an area which is poorly understood, both on scale/environmental impact and on the effect of measures to try and incentivise less noisy ships. This may be an important area for continued OSPAR work;
- The impact of ship strikes on cetaceans remains an area of concern given weaknesses in data;
- Effective development and enforcement of the Polar Code is important for OSPAR Arctic Waters;
- OSPAR may want to consider the significance of newly emerging or poorly understood issues and risks and any potential OSPAR involvement (e.g. discharges from scrubbers, microplastics in ship paints; potential increase in risks or impact from collision/accident due to expansion of wind farms or larger ships; better understanding of the impact of ship wakes);
- Assessments in other parts of the QSR on the state of the seas need to consider the overall impacts of shipping on state indicators.
Distribution and intensity of activity
7.2 The Greater North Sea, the Celtic Seas, and the Bay of Biscay and Iberian Coast (and parts of Arctic Waters and the Wider Atlantic) continue to have a high density of shipping, with the highest densities in the English Channel, southern and eastern North Sea, and the entrance to the Mediterranean. The OSPAR region includes three of the twenty leading container ports globally, and ten of the twenty largest ports in Europe, with a particular concentration in the southern North Sea. (Paragraph 2.1)
Trends
7.3 In 2018, the gross weight of goods handled in OSPAR ports and the passenger numbers embarking and disembarking in OSPAR ports were little changed from 2008. (Paragraphs 2.3, 2.6)
7.4 Scenario analyses anticipate an increase in the amount of shipping in future, but this is subject to uncertainty. The composition of the fleet is likely to change over time, for example in response to measures to limit greenhouse gas emissions. (Paragraphs 4.1 – 4.8)
Economic value
7.5 Maritime transport is critical to Europe’s economy, representing between 75% and 90% of the EU’s external trade and one third of intra-EU trade. (Paragraph 3.1)
Pressures and impacts
7.6 Shipping has multiple environmental impacts, including air pollution, greenhouse gas emissions, introduction of non-indigenous species, marine litter, underwater noise, oil spills, input of nutrients and of hazardous substances from waste water, cargo residues, antifouling paints, and collisions with marine mammals. The incidence of some of these has reduced as a result of measures taken (e.g. air pollution, oil spills) but some remain poorly understood (e.g. noise, collisions). (Paragraphs 6.1 – 6.61)
Measures
7.7 A range of measures have been taken, including by OSPAR, the IMO, the European Union, and national authorities, to address the impacts of shipping, such as controls on sulphur and nitrogen emissions; regulations on ballast water; measures to limit litter; measures concerning port reception facilities and actions to reduce the risk of oil pollution. Voluntary guidance or codes have also been developed to encourage improved environmental performance of the shipping fleet. Some of these measures are reducing environmental impacts but the effect of others remains limited. (Paragraphs 6.1 – 6.61)
Summary table
7.8 (Assessment is of total cargo and passenger shipping)
| OSPAR Regions6 | |||||
|---|---|---|---|---|---|
| I | II | III | IV | V | |
| Relative intensity7 | M | H | H | H | L |
| Trend | ↔ | ↔ | ↔ | ↔ | ↔ |
| Forecast Trend to 2030 | ? | ? | ? | ? | ? |
Footnotes
1 Eurostat total figures for Denmark include the Baltic. For France, Spain, Germany and Sweden, Eurostat total figures separate out OSPAR area.
2 Dataset Eurostat (2020d) does not separate Baltic/Mediterranean ports from OSPAR ports; does not include Iceland/Faroe Islands
3 Total of liquid bulk carriers, dry bulk carriers, container ships, specialised carriers, and general non-specialised carriers
4 The guidelines were being fully implemented by Denmark, Germany, Greenland, Faroe Islands, France, the Netherlands, Spain, Sweden and the United Kingdom. Reporting by contracting parties did not allow assessment of implementation elsewhere.
5 The views expressed on key messages are those of the assessor and do not necessarily represent the views of the OSPAR Commission
6 For the delineation of OSPAR regions see https://www.ospar.org/convention/the-north-east-atlantic
7 High/medium/low
References
Addamo, A. M., Laroche, P. & Hanke, G. (2017). Top Marine Beach Litter Items in Europe, EUR 29249 EN. Joint Research Centre. Luxembourg: Publications Office of the European Union. Available at: doi:10.2760/496717
Arctic Council (2017). Status on implementation of the AMSA 2009 report recommendations. Available at: https://oaarchive.arctic-council.org/bitstream/handle/11374/1957/PAME_4th-AMSA_Implementation_Progress_Report_for_the_period_2015-2017.pdf?sequence=1&isAllowed=y
Bonn Agreement (2015). Be-Aware II – Summary Report. Available at: https://www.bonnagreement.org/site/assets/files/17082/be-aware_ii_summary_report.pdf
Bonn Agreement (2016). Bonn Agreement Action Plan 2016-2019. Available at: https://www.bonnagreement.org/about/policies
Bonn Agreement (2019a). Annual report on Aerial Surveillance for 2019. Available at: https://www.bonnagreement.org/site/assets/files/3949/2019_report_on_aerial_surveillance.pdf
Bonn Agreement (2019b). Bonn Agreement Strategy Action Plan 2019 – 2025. Available at: https://www.bonnagreement.org/about/policies
Bonn Agreement (2019c). Be-Aware Trend Analysis: Final Report. Available at: https://www.bonnagreement.org/activities/projects/be-aware-trend-analysis
Brunila O-P. & Storgård J. (2014). Changes in oil transportation in the years 2020 and 2030 – the case of the Gulf of Finland. TransNav Vol 8 No.3. Available at: https://www.transnav.eu/Article_Changes_in_Oil_Transportation_in_Brunila,31,523.html
BSU (2020). Loss of containers overboard from MSC ZOE. Joint investigation report of the Federal Bureau (BSU), Dutch Safety Board (DSB) and Panama Maritime Authority. Available at: https://www.bsu-bund.de/EN/Publications/Unfallberichte/Unfallberichte_node.html
Cates K., DeMaster D.P., Brownell R.L. Jr, Silber G., Gende S., Leaper R., Ritter F. & Panigada S. (2017). IWC Strategic Plan to Mitigate the Impacts of Ship Strikes on Cetacean Populations: 2017-2020. Available at: https://iwc.int/ship-strikes
CEDA (2020). Assessing and Evaluating Environmental Turbidity Limits for Dredging. Available at: http://www.dredging.org/media/ceda/org/documents/ resources/cedaonline/2020-05-AETL.pdf
DSB (2020). Safe container transport north of the Wadden Islands - Lessons learned following the loss of containers from MSC ZOE. Available at: https://www.onderzoeksraad.nl/en/page/13223/safe-container-transport-north-of-the-wadden-islands.-lessons-learned
European Commission (2018). Report from the Commission to the European Parliament and the Council on implementation and compliance with the sulphur standards for marine fuels set out in Directive (EU) 2016/802 relating to a reduction in the sulphur content of certain liquid fuels Brussels, 16.4.2018 COM(2018) 188 final. Available at: https://ec.europa.eu/environment/air/pdf/report_sulphur_directive.pdf
European Commission (2019a). Descriptor 11 Energy incl., Underwater Noise Webpage updated 07/08/2019. Available at: https://ec.europa.eu/environment/marine/good-environmental-status/descriptor-11/index_en.htm
European Commission 2019b. Report of Stakeholders’ Workshop on Lost Shipping Containers Brussels 04/07/2019. https://webgate.ec.europa.eu/maritimeforum/en/node/4405
European Commission (2020a). The EU Blue Economy Report. 2020. Publications Office of the European Union. Luxembourg. Available at: https://ec.europa.eu/maritimeaffairs/sites/maritimeaffairs/files/2020_06_blueeconomy-2020-ld_final.pdf
European Commission (2020b). Commission Staff Working Document SWD(2020) 82 final. Full-length report accompanying the document Report from the Commission 2019 Annual Report on CO2 Emissions from Maritime Transport. Available at: https://ec.europa.eu/clima/sites/clima/files/transport/shipping/docs/swd_2020_82_en.pdf
European Commission (2020c). Commission Staff Working Document. Key stages and progress up to 2019. Accompanying the Report from the Commission to the European Parliament and the Council on the implementation of the Marine Strategy Framework Directive (Directive 2008/56/EC) SWD(2020) 60 final. Available at: https://ec.europa.eu/info/sites/info/files/swd202060final.pdf
European Environment Agency (2018). Aviation and shipping – impacts on Europe’s environment. Luxembourg: Publications Office of the European Union ISBN 978-92-9213-931-5 ISSN 1977-8449. Available at: doi:10.2800/4907 https://www.eea.europa.eu/publications/term-report-2017
European Environment Agency (2019). Trends in marine non-indigenous species. Available at: https://www.eea.europa.eu/data-and-maps/indicators/trends-in-marine-alien-species-mas-3/assessment
EMODnet (2020). Human activities – making use of our oceans. Available at: https://www.emodnet-humanactivities.eu/view-data.php
European Maritime Safety Agency (2017). Celebrating the CleanSeaNet service – a ten year anniversary publication. Available at: http://www.emsa.europa.eu/news-a-press-centre/external-news/item/3150-celebrating-the-cleanseanet-service-a-ten-year-anniversary-publication.html
European Maritime Safety Agency (2019). BWM - guidance on best practices for sampling. Available at: http://www.emsa.europa.eu/implementation-tasks/environment/151-ballast-water/3472-ballast-water-management-guidance-for-best-practices-on-sampling.html
European Maritime Safety Agency/European Environment Agency (2021). European Maritime Transport Environmental Report. (In preparation).
Eurostat (2019). Energy, transport and environment statistics 2019. Available at: https://ec.europa.eu/eurostat/documents/3217494/10165279/KS-DK-19-001-EN-N.pdf/76651a29-b817-eed4-f9f2-92bf692e1ed9
Eurostat (2020a). Gross weight of goods handled in all ports by direction – annual data. Available at: https://appsso.eurostat.ec.europa.eu/nui/show.do?dataset=mar_go_aa&lang=en
Eurostat (2020b). Gross weight of goods transported to/from main ports by direction and type of traffic (national and international) - quarterly data. Available at: http://appsso.eurostat.ec.europa.eu/nui/show.do?dataset=mar_go_qm&lang=en
Eurostat (2020c). Short sea shipping - top 20 ports - gross weight of goods transported to/from main ports. Available at: http://appsso.eurostat.ec.europa.eu/nui/show.do?dataset=mar_sg_am_pw
Eurostat (2020d). Country level – gross weight of goods handled in main ports by type of cargo. Available at: https://appsso.eurostat.ec.europa.eu/nui/show.do?dataset=mar_mg_am_cwhc&lang=en
Eurostat (2020e). Vessels in main ports by type and size of vessels (based on inwards declarations) - quarterly data. Available at: http://appsso.eurostat.ec.europa.eu/nui/show.do?dataset=mar_tf_qm&lang=en
Eurostat (2020f). Passengers embarked and disembarked in all ports by direction. Available at: http://appsso.eurostat.ec.europa.eu/nui/show.do?dataset=mar_pa_aa&lang=en
Eurostat (2020g). Maritime ports freight and passenger statistics. Available at: https://ec.europa.eu/eurostat/statistics-explained/index.php/Maritime_ports_freight_and_passenger_statistics
Eurostat (2020h). Air pollution by source sector. Available at: https://appsso.eurostat.ec.europa.eu/nui/show.do?dataset=env_air_emis&lang=en
Galil, B.S., McKenzie, C., Bailey, S., Campbell M., Davidson, I., Drake, L., Hewitt, C., Occhipinti-Ambrogi, A. & Piola, R. (2019). ICES Viewpoint background document: Evaluating and mitigating introduction of marine non-native species via vessel biofouling. ICES Ad Hoc Report 2019. 17 pp. Available at: http://doi.org/10.17895/ices.pub.4680
GESAMP (2019). Proposal to establish a GESAMP Biofouling Management Working Group. Available at: http://www.gesamp.org/site/assets/files/2044/46_7_1.pdf
Hassellöv, I.M., Koski, M., Broeg, K., Marin-Enriquez, O., Tronczynski, J., Dulière, V., Murray, C., Bailey, S., Redfern, J., de Jong, K., Ponzevera, E., Belzunce-Segarra, M.J., Mason, C., Iacarella, J.C., Lyons, B., Fernandes, J.A. & Parmentier, K. (2020). ICES Viewpoint background document: Impact from exhaust gas cleaning systems (scrubbers) on the marine environment (Ad hoc). ICES Scientific Reports. 2:86. 40 pp. Available at: http://doi.org/10.17895/ices.pub.7487
IIASA (2018). The potential for cost effective air emission reductions from international shipping through designation of further Emission Control Areas in EU waters with focus on the Mediterranean Sea. Available at: https://www.iiasa.ac.at/web/home/research/researchPrograms/air/Shipping_emissions_reductions_main.pdf
ICES (2019a). Working Group on Introductions and Transfers of Marine Organisms (WGITMO). ICES Scientific Reports 1:53. 27 pp. Available at: http://doi.org/10.17895/ices.pub.5569
ICES (2019b). Barents Sea Ecoregion – Ecosystem overview. In Report of the ICES Advisory Committee, 2019. ICES Advice 2019, Section 5.1. Available at: https://doi.org/10.17895/ices.advice.5747
ICES (2019c). Icelandic Waters ecoregion –Ecosystem overview. In Report of the ICES Advisory Committee, 2019. ICES Advice 2019, Section 11.1. Available at: https://doi.org/10.17895/ices.advice.5746
ICES (2020). Working Group on Shipping Impacts in the Marine Environment (WGSHIP). ICES Scientific Reports 2:86. 39 pp. Available at: http://doi.org/10.17895/ices.pub.7484
IMO (2011). Guidelines for the control and management of ships’ biofouling to minimize the transfer of invasive aquatic species. Resolution MEPC.207(62). Available at: https://www.imo.org/en/OurWork/Environment/Pages/Biofouling.aspx
IMO (2014). Guidelines for the reduction of underwater noise from commercial shipping to address adverse impacts on marine life. Available at: http://www.imo.org/en/MediaCentre/HotTopics/Documents/833%20Guidance%20on%20reducing%20underwater%20noise%20from%20commercial%20shipping%2C.pdf
IMO (2015). International Code for Ships Operating in Polar Waters (Polar Code). Resolution MEPC.264(68) Available at: http://www.imo.org/en/MediaCentre/HotTopics/polar/Documents/POLAR%20CODE%20TEXT%20AS%20ADOPTED.pdf
IMO (2017). Resolution MEPC 295(71) 2017 Guidelines for the Implementation of MARPOL Annex V Available at: http://www.imo.org/en/KnowledgeCentre/IndexofIMOResolutions/Marine-Environment-Protection-Committee-%28MEPC%29/Documents/MEPC.295%2871%29.pdf
IMO (2018a). Initial IMO Strategy on Reduction of GHG Emissions from Ships. Resolution MEPC.304(72). Available at: https://wwwcdn.imo.org/localresources/en/OurWork/Environment/Documents/Resolution%20MEPC.304(72)_E.pdf
IMO (2018b). Action Plan to address marine plastic litter from ships. Resolution MEPC.310(73). Available at: http://www.imo.org/en/MediaCentre/HotTopics/marinelitter/Documents/IMO%20marine%20litter%20action%20plan%20
IMO (2019a). Marine Environment Protection Committee (MEPC), 74th Session 13-17 May 2019. Available at; https://www.imo.org/en/MediaCentre/MeetingSummaries/Pages/MEPC-74th-session.aspx
IMO (2019b). Hull Scrapings and Marine Coatings as a Source of Microplastics. Available at: http://www.imo.org/en/OurWork/Environment/LCLP/newandemergingissues/Documents/Hull%20Scrapings%20final%20report.pdf
IMO (2020a). Reduction of GHG Emissions from Ships. Fourth IMO GHG Study 2020 – Final report. Available at: https://safety4sea.com/wp-content/uploads/2020/08/MEPC-75-7-15-Fourth-IMO-GHG-Study-2020-Final-report-Secretariat.pdf
IMO (2020b). Marine Environment Protection Committee (MEPC) 75 16-20 November. Available at: h https://www.imo.org/en/MediaCentre/MeetingSummaries/Pages/MEPC-75th-session.aspx
IMO (2020c). Status of Conventions. Data as at 15/09/2020. Available at: https://www.imo.org/en/About/Conventions/Pages/StatusOfConventions.aspx
International Transport Forum (2015). The Impact of Megaships. Available at: https://www.itf-oecd.org/sites/default/files/docs/15cspa_mega-ships.pdf
International Transport Forum (2016). Reducing Sulphur Emissions from Ships: The Impact of International Regulation. Available at: https://www.itf-oecd.org/sites/default/files/docs/sulphur-emissions-shipping.pdf
International Transport Forum (2018). Reducing Shipping Greenhouse Gas Emissions: Lessons from Port-based Incentives. Available at: https://www.itf-oecd.org/sites/default/files/docs/reducing-shipping-greenhouse-gas-emissions.pdf
International Transport Forum (2019). ITF Transport Outlook 2019. Available at: https://www.itf-oecd.org/itf-transport-outlook-2019
JOMOPANS (2019). Soundscaping the North Sea – toward an implementation plan for ambient noise monitoring. Available at: https://northsearegion.eu/jomopans/news/policy-brief/
Jönander, C. & Dahllöf, I. (2020). Short and long-term effects of low-sulphur fuels on marine zooplankton communities. Aquatic Toxicology 227, October 2020, 105592. Available at: https://doi.org/10.1016/j.aquatox.2020.105592
Mehdi, R.A., Schröder-Hinrichs, J-U., van Overloop, J., Nilsson, H. & Pålsson, J. (2018). Improving the coexistence of offshore wind farms and shipping: an international comparison of navigational risk assessment processes. WMU Journal of Maritime Affairs 17:397–434 Available at: https://doi.org/10.1007/s13437-018-0149-0
Merk, O. (2018). Container ship size and port relocation. Discussion Paper, International Transport Forum, Paris. Available at: https://www.itf-oecd.org/sites/default/files/docs/container-ship-size-and-port-relocation.pdf
Norwegian Maritime Authority (2019). Circular RSV 09-2019 Guidance on documentation that the NOx requirements in the Norwegian world heritage fjords are met. Available at: https://www.sdir.no/en/shipping/legislation/directives/guidance-on-documentation-that-the-nox-requirements-in-the-norwegian-world-heritage-fjords-are-met/
Norwegian Coastal Administration (2020a). Government Environmental Response to Accidental Release of Plastic Pellets. Webpage dated 16/06/2020. Available at: https://www.kystverket.no/en/EN_System/plastic-pellets-clean-up/
Norwegian Coastal Administration (2020b). IMAROS. Available at: https://www.kystverket.no/en/EN_Preparedness-against-acute-pollution/imaros/
OSPAR (2009). Assessment of the impact of shipping on the marine environment. Available at: https://www.ospar.org/documents?v=7156
OSPAR (2012) (jointly with Helcom and Barcelona Convention). General Guidance on the Voluntary Interim Application of the D1 Ballast Water Exchange Standard by Vessels Operating between the Mediterranean Sea and the North-East Atlantic and/or the Baltic Sea. Agreement 2012-04. Available at: https://www.ospar.org/convention/agreements
OSPAR (2014a). Marine Litter Regional Action Plan. OSPAR Agreement 2014/1. Available at: https://www.ospar.org/documents?v=34422
OSPAR (2014b). OSPAR Guidelines for the Management of Dredged Material at Sea. OSPAR Agreement 2014/06. Available at: via https://www.ospar.org/work-areas/eiha/dredging-dumping
OSPAR (2015). Joint Harmonised Procedure for the Contracting Parties of HELCOM and OSPAR on the granting of exemptions under International Convention for the Control and Management of Ships’ Ballast Water and Sediments, Regulation A-4. OSPAR Agreement 2015-01. Available at: https://www.ospar.org/convention/agreements
OSPAR (2016). Background document on Improving the implementation of ISO standard 21070:2013 in relation to port reception facilities. Available at: https://www.ospar.org/work-areas/eiha/marine-litter/regional-action-plan
OSPAR (2016b). Metals in sediment and biota: status and trend of copper burden. OSPAR publication 677. Available at: https://www.ospar.org/about/publications/
OSPAR 2018a. Briefing note on OSPAR actions in relation to marine litter and their overlap with the revision of the Directive on port reception facilities for the delivery of waste from ships. Available at: https://www.ospar.org/site/assets/files/41501/port_reception_facilities.pdf
OSPAR (2018b). OSPAR Intermediate Assessment 2017 – Abundance and Distribution of Cetaceans (updated 2018). Available at: https://oap.ospar.org/en/ospar-assessments/intermediate-assessment-2017/biodiversity-status/marine-mammals/abundance-distribution-cetaceans/abundance-and-distribution-cetaceans/
OSPAR (2019). Seminar on prevention of and sanctions on illegal waste disposal from ships at sea and draft recommendations. ICG-ML(1) 19/06/02
OSPAR (2020). Webpage on Underwater Noise. Available at: https://www.ospar.org/work-areas/eiha/noise
PAME (2019). Arctic Shipping Status Report No. 1. Available at: https://www.pame.is/projects/arctic-marine-shipping/arctic-shipping-status-reports
Reid, P.C., Cook, E.J., Edwards, M., McQuatters-Gollop, A., Minchin, D. & McCollin, T. (2009). Marine non-native species. In Marine Climate Change Ecosystem Linkages Report Card 2009 (Eds. Baxter J.M., Buckley P.J. and Frost M.T.), Online science reviews, 29pp. Available at: www.mccip.org.uk/elr/non-natives
Strietman, W.J., Michels, R. & Leemans, E., (2018). Measures to reduce underwater noise and beach litter; an assessment of potential additional measures for the Netherlands. Wageningen, Wageningen Economic Research, Report 2018-087. Available at: https://www.noordzeeloket.nl/publish/pages/153829/measures_to_reduce_underwater_noise_and_beach_litter_an_assessment_of_potential_additional_measures_.pdf
Tornero, V. & Hanke, G. (2016). Chemical contaminants entering the marine environment from sea-based sources: a review with a focus on European seas. Marine Pollution Bulletin 112 17-38. Available at: https://doi.org/10.1016/j.marpolbul.2016.06.091
UK Department of Transport (2019). Maritime 2050 – Navigating the Future. Available at: https://www.gov.uk/government/publications/maritime-2050-navigating-the-future
UK Government Office for Science (2017). Foresight, Future of the Sea: Implications of Opening Arctic Shipping Routes. Available at: https://assets.publishing.service.gov.uk/government/uploads/system/uploads/attachment_data/file/634437/Future_of_the_sea_-_implications_from_opening_arctic_sea_routes_final.pdf
UK Government Office for Science (2018). Foresight, Future of the Sea. A report from the Government Chief Scientific Adviser. Available at: https://assets.publishing.service.gov.uk/government/uploads/system/uploads/attachment_data/file/706956/foresight-future-of-the-sea-report.pdf
UNCTAD (2019). Review of Maritime Transport 2019. Available at: https://unctad.org/en/PublicationsLibrary/rmt2019_en.pdf
UNCTAD (2020). Review of Maritime Transport 2020. Available at: https://unctad.org/system/files/official-document/rmt2020_en.pdf
World Organisation of Dredging Associations (2013). Technical Guidance on Underwater Sound in Relation to Dredging. Available at: https://dredging.org/media/ceda/org/documents/resources/cedaonline/2013-06-woda-technicalguidance-underwatersound_lr.pdf