

Trends in New Records of Non-indigenous Species Introduced by Human Activities
Background
Non-indigenous marine species (NIS) introduced by human activities are organisms moved into new areas outside their natural range of distribution and dispersal potential by, for example, transfer of ships’ ballast water, biofouling (accumulation of organisms on ships’ hulls) and aquaculture trade. Species that naturally increase their range are not taken into consideration, however, NIS that spread to neighbouring areas by natural means or human-mediated transports (secondary dispersal) following their primary introduction, are still considered to be NIS. Through competition for resources and space, as well as hybridisation with native species, the presence of NIS, in particular the invasive ones, can alter population and species composition, species adaptive potential to environmental changes, food webs, biogeochemical cycles and water quality. These pressures on the marine environment can have economic and health impacts and pose significant threat to marine biodiversity. Given knowledge gaps around which NIS are, or will become, invasive, and the difficulty in controlling NIS spread in the marine environment, the focus is on prevention of NIS introduction and their early detection. This common indicator assessment provides an update on trends in new records of NIS introductions into the OSPAR Maritime Area, to determine the effectiveness of measures aimed at preventing NIS introductions. Data have been provided by 11 OSPAR Contracting Parties for the period 2003 to 2020, covering three six-year reporting periods. Data originate from a range of national monitoring approaches, combined with documented reports by national experts. Data have undergone a series of quality control steps to ensure that results are comparable among Contracting Parties and OSPAR Regions. To support future management of NIS, ancillary information such as taxonomic grouping, knowledge of the pathways of introduction, evidence of breeding in the wild, documentation of geographical spread, were obtained to the extent possible.
 is a globally distributed invasive macroalga reported in 8 of the 11 OSPAR Contracting Parties.")
Figure 1: Agarophyton vermiculophyllum (formerly Gracilaria vermiculophylla) is a globally distributed invasive macroalga reported in 8 of the 11 OSPAR Contracting Parties.
It can form dense mats in shallow coastal waters with low wave exposure. It is often found entangled with other macroalgae. The photographs are from Hog Island Bay, Virginia and Horsens Fjord, Denmark (insert - competing with Fucus vesiculosus). Courtesy of Mads S. Thomsen.
The NIS indicator assessment is based on the “New Introductions” parameter to assess the effectiveness of a programme of measures designed to reduce the number of new non-indigenous species (NIS) introductions:
The “New Introductions” parameter (P1): This examines the number of new introductions of NIS into geographical areas per six-year period, enabling assessments of trends in introduction over time. Results are reported as (a) absolute changes in number of new NIS per six-year period, and (b) the annual average rate of new NIS introductions per six-year reporting period.
Despite global recognition of the threat of invasive NIS, there has been limited coordinated and sustained regional monitoring of new NIS introductions in the OSPAR Maritime Area. While some OSPAR Contracting Parties do monitor for NIS, others do not, and of those monitoring programmes that do exist none have been in place long enough to facilitate assessment of long-term temporal trends. However, all OSPAR Contracting Parties record NIS detected, though in some cases, these records may not accurately reflect the time and location of the introduction. This may be due to lack of monitoring effort or the reporting process.
New records of NIS introductions have been used for this assessment, being the only reliable data available. These records come from many different sources including monitoring programmes (some of which are specifically tasked to look for NIS), but the majority originate from secondary sources, such as scientific studies, citizen science or chance observations. These sources mostly lack the necessary geographic and temporal consistency in the methodology used for detection and recording needed to ensure data suitable for trend analysis. Using historical data from such a wide range of sources for this assessment may limit interpretation of results.
With various political drivers, such as the International Convention for the Control and Management of Ships' Ballast Water and Sediments (The International Maritime Organization Ballast Water Management Convention), the European Union Marine Strategy Framework Directive (EU 2008/56/EC) (MSFD) and the European Union Regulation on Invasive Alien Species (1143/2014), monitoring programmes focused on detecting NIS are starting to be developed following standardised protocols. Given time, these should provide baselines and datasets that can be used to assess all four indicator parameters. It is essential however that there is consistency in approach, coordination and harmonisation of monitoring methods and quality assurance, recording processes, data flow and assessment at an OSPAR regional scale. Thus, while the NIS trend indicator is simple and robust, limitations in the available data, such as discrepancies between the first observation and the reported dates of introduction, and the lack of coordination and standards between Contracting Parties, reduces the confidence of the overall assessment.
Data
Data were provided by Belgium, Denmark, France, Germany, Ireland, Portugal, Spain, Sweden, the Netherlands, Norway and the United Kingdom (Figure 2). Each OSPAR Contracting Party was requested ( link to CEMP Guideline where data call is annexed ) to provide data on new records of non-indigenous species (NIS) within their waters between 1 January 2003 and 31 December 2020 for each Region assessed (Greater North Sea, Celtic Seas, and Bay of Biscay and Iberian Coast (excluding archipelago of Macaronesia)). The period assessed was selected to represent three six-year periods (2003 to 2008, 2009 to 2014 and 2015 to 2020), from which Contracting Parties are most likely to have complete data sets. The compiled dataset, therefore, enables the comparison of new NIS records between three six-year reporting periods. Data were requested on the date that NIS were first reported within each of the Regions and the location of the observation. Additional data on higher-level taxonomic grouping were requested to characterise the NIS. Knowledge of the pathway of introduction, ability to breed in the wild, documentation of dispersal and monitoring approach was obtained to inform future NIS management. The data received were checked for taxonomic discrepancies and formatting issues, which were then addressed. Importantly, information on the habitats where the species had been observed was not available, making it impossible to easily assess the importance of introduction hotspots, such as ports or aquaculture facilities, in new introduction NIS trends. This feature is planned to be requested for future analysis.
Analysis
This analysis was used to identify trends in new NIS arrivals, within three of the OSPAR Regions (II, III, and IV). The analysis only considered the first new record of a NIS within a Region. Duplicate records for any given species were therefore removed to avoid over-estimates in new NIS records at the regional level. Care was taken to ensure that it was the first record (i.e., earliest) for a given species in a given Region that was used for this analysis, following the CEMP guideline . The analysis of the trends in introduction (graphs and statistics) was conducted using the R programming language (R-Core-Team, 2019), SigmaPlot and MS Excel.
The “New Introductions” parameter (P1) was chosen because (a) preventing NIS introductions is the most cost-effective management approach, assessing (rates of) new introductions themselves has a higher priority than assessing their subsequent total numbers and secondary spread, and (b) the other suggested parameters (described in CEMP) require more detailed data on NIS which are currently not widely available, mainly owing to the lack of repeated and comparable monitoring of NIS.
For the analysis of “New Introductions” parameter (P1) a trend-based threshold was applied, with a downward trend reflecting good/improving status. Lack of information on monitoring effort, unfortunately disabled standardisation for this in the analysis.
Given that a “New Introductions” quantitative threshold value has not yet been defined at the OSPAR regional sea level, Contracting Parties may choose to adopt their own quantitative threshold. While it was originally suggested to apply a threshold of zero new NIS introductions per six-year period, most Contracting Parties and EU Member States (JRC) support a trend-based approach. Different formulations and parameterisations of such a trend-based threshold for the indicator is currently being investigated.
Results
A total of 479 records of new NIS, over the three OSPAR Regions (II, III, and IV) were provided by the 11 OSPAR Contracting Parties for the 18-year period 2003 to 2020 inclusive. Excluding cryptogenic species, phytoplankton species and parasitic species reduced this to 426 records (Figure 2). Removing duplicate records for each species within each OSPAR Region, resulted in a total of 250 NIS ( Appendix 1 ), as several NIS appeared more than once in the three OSPAR Regions over the study period.
For all Contracting Parties, many new NIS were recorded for all three assessment periods, with highest total numbers (2003 to 2020) in Spanish waters (92) and lowest in Belgium waters (12) (Figure 3). Note that these results are not relativised by the respective length of coastlines, the intensity and frequencies of vectors and pathways, or the number of high-risk areas for NIS introduction as recently recommended by Castro et al., (2022). This should be considered for future assessments.
Figure 3: Number of new NIS per Contracting Party per reporting period and for the entire 2003 to 2020 period.
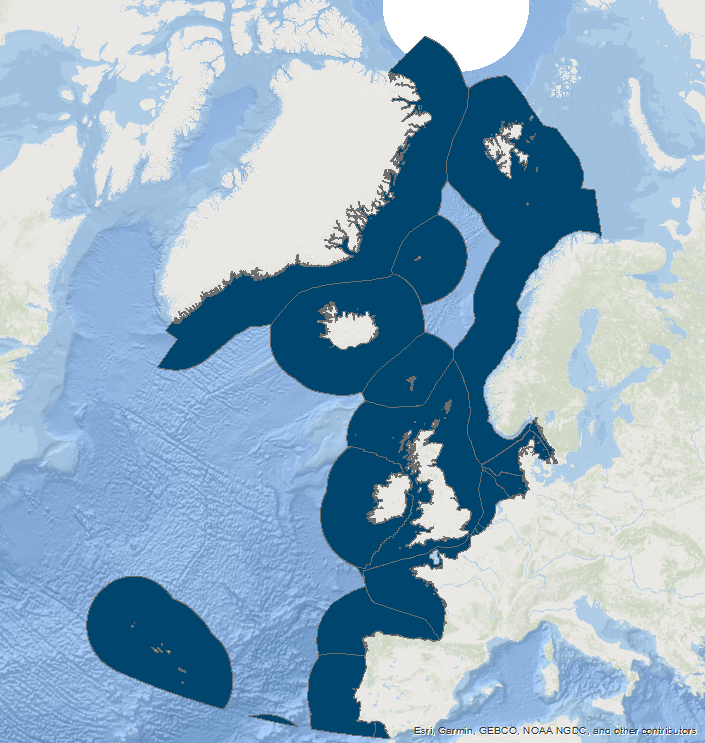
Figure 2: The locations of new NIS records during 2003 to 2020 with OSPAR Region boundaries. Note that these locations may reflect the location of monitoring rather than the location into which the species was first introduced. Of the 426 NIS records included in the assessment, Geo references were provided for 381 records. Available via: ODIMS.
Merging national data within each OSPAR Region, and removing duplicates, also provided new information at this scale. Still, many new NIS were recorded in each assessed OSPAR Region and for each of the whole assessment periods (Figure 4). Although most new NIS introductions were observed in Contracting Parties belonging to Region IV, several of the same species were observed in bordering Contracting Parties. Accordingly, Region IV had the most unique new NIS records. Region III had by far the lowest number of new NIS records. In all three Regions, there was a decrease in the number of new NIS records over time, and particularly for the last period, which could reflect time lag between observations and their publication rather than a true decrease in recent years (Zenetos et al., 2019). Considering the entire 2003 to 2020 period, most NIS records were observed in Region IV (136) followed by Region II (131), and Region III (45). Of the 426 NIS records provided by the 11 Contracting Parties there was a total of 250 non-duplicated NIS records within the three OSPAR Regions ( Appendix 1 ). However, several new NIS records occurred in more than one Region; 48 were shared between at least two Regions, but only 14 were shared between all Regions (Figure 5; Appendix 1 ). Interestingly, bordering Regions did not share more NIS than non-bordering Regions (i.e., III and IV share only 4 NIS; II and IV share 22).
Figure 4: The total number of new NIS records in each Region and period assessed
Two explanations seem relevant for the low number of common NIS between bordering Regions: 1) NIS spread across Regions through human-mediated dispersal that facilitates long-distance spread (e.g., many boats are connecting the North Sea and the Bay of Biscay); 2) incomplete datasets and insufficient monitoring, accompanied by biases across Regions (e.g., biases in the habitat surveyed or according to the regional taxonomic expertise).
Considering only the latest reporting period (2015 to 2020), quite large differences occurred in new NIS introductions between neighbouring Contracting Parties (Figure 6). At the regional level, most new NIS were observed in Contracting Parties belonging to Region IV, followed by Region II and far fewer NIS in Region III (Figure 7).

Figure 5: Venn diagram to illustrate the number of new NIS records common between OSPAR Regions
 for each Contracting Party.")
Figure 6: The number of new NIS records for the assessment period (2015 to 2020) for each Contracting Party.
 for each of the three OSPAR Regions.")
Figure 7: The number of new NIS records for the assessment period (2015 to 2020) for each of the three OSPAR Regions.
Another way to display the trends in new NIS records is to show the number of new NIS records per year and the cumulative number of new NIS records (Figure a).
 for each OSPAR Region (II, III, and IV and all Regions) and the trends (coloured curves) in cumulated (Acc.) new NIS records. Numbers above curves are slopes (#NIS per year = rates of introduction) of the cumulated curves from linear regression models. The overall trends in annual new NIS records (dotted line) were assessed with linear regression models, and the slope, coefficient of determination (R2) and significance level (p) are shown.")
Figure a: Annual new NIS records (bars) for each OSPAR Region (II, III, and IV and all Regions) and the trends (coloured curves) in cumulated (Acc.) new NIS records. Numbers above curves are slopes (#NIS per year = rates of introduction) of the cumulated curves from linear regression models. The overall trends in annual new NIS records (dotted line) were assessed with linear regression models, and the slope, coefficient of determination (R2) and significance level (p) are shown.
, 2 (2009–2014) and 3 (2015-2020). Numbers and dashed lines are means. Letters represent a statistical test (t-test of pairwise comparison) of difference between periods (i.e., a, is different (p<0.05) from b).")
Figure b: Box plots comparing the number of new NIS records between reporting periods 1 (2003–2008), 2 (2009–2014) and 3 (2015-2020). Numbers and dashed lines are means. Letters represent a statistical test (t-test of pairwise comparison) of difference between periods (i.e., a, is different (p<0.05) from b).
The cumulative number of NIS for the 2003 to 2020 period was 136 in Region IV, followed by Region II (131), and Region III (45). While the cumulative number of NIS is increasing in all three Regions, and for OSPAR as a whole, there has been a slight overall reduction in the number of new NIS records reported per year between 2003 and 2020 (e.g. see slope coefficients in Figure a). Another simple way to determine rates of NIS introductions is the mean of the annual new NIS records (Figure b).
The mean rates were very similar to the rates (slopes) in Figure a (Table a).
| Region | Period | NIS introduction rate (#NIS/year) | NIS introduction rate (#NIS/year) |
|---|---|---|---|
| From mean annual | From slope | ||
| II | 1 | 8.0 | 7.7 |
| 2 | 7.7 | 8.0 | |
| 3 | 6.4 | 6.4 | |
| III | 1 | 3.7 | 4.3 |
| 2 | 3.3 | 4.0 | |
| 3 | 0.5 | 0.6 | |
| IV | 1 | 9.3 | 9.0 |
| 2 | 7.8 | 7.7 | |
| 3 | 5.5 | 5.3 | |
| All | 1 | 17.7 | 17.7 |
| 2 | 13.5 | 14.0 | |
| 3 | 10.3 | 9.8 |
However, there is considerable variability around the mean rates per period. These variations may reflect differences in monitoring intensity (in space and time), as well as the heterogeneity and limitation of the data collected. Overall, a 2-way ANOVA analysis showed that the rate of new NIS introductions was significantly lower in Region III, and rates were lower in the last period compared to the first and second. This was also supported by a simple t-test for each of the Regions (Figure b). However, it was not possible to quantify well-known bias (UNEP/MED, 2021) in monitoring effort and the effect of delay in reporting for the most recent new NIS.
Regardless of the analysis method, the total numbers of NIS, as well as the annual rate of new NIS records, were two to three fold lower in Region III than in the other two Regions, which appear to have similar numbers of new NIS records. For each of the three Regions assessed, the rate of new NIS records slightly declined from reporting 1 to 3, thus supporting findings from the previous Intermediate Assessment 2017 (IA2017) assessment.
While there was a slight declining trend in new NIS records over time, the number of new NIS records varied considerably between years (Figure a). These variations may reflect differences in rates of introductions, but also variability in monitoring intensity (in space and time), delays between introduction and reporting, as well as the ad hoc nature of most of the data collected. Only 14% of the NIS data were recorded as part of regular Government monitoring; 43% of records were obtained through academic surveys and 6% through citizen science observations. The remaining were other (17%) or unknown (19%). Also, only 50% of the data appeared to be obtained using a data quality assurance system. Taxonomic certainty was high as only 3% of NIS records were reported as uncertain. Given that only 14 NIS were in common for all three OSPAR Regions, and 48 shared by two or three Regions, this suggests that NIS are quite region specific.

Figure c: Distribution among higher-level taxonomic groups for the 250 OSPAR NIS recorded during 2003-2020. Colours represent the three periods.
Interestingly NIS shared among Regions are not necessarily shared between bordering Regions suggesting long-distance dispersal (i.e., human-mediated) rather than natural spread. In addition, for 39% of the NIS records provided by the 11 Contracting Parties, there is documentation of geographical spread within an OSPAR Region. Most of the observed NIS is adapted to fully marine conditions (75%), with 14% as oligohaline (below ca. 3 psu salinity), the remaining 11% are unknown. Most species were reported as nationally qualified NIS (83%) while 7% were listed as cryptogenic (of unknown origin), and for the remaining 10%, there was no information provided. While most NIS occur within crustaceans, macroalgae and polychaetes, NIS have been observed within most taxonomic groups (Figure c). This taxonomic diversity represents a diversity of traits, habitat requirements, trophic levels, and functions, highlighting that the invaded locations cover a large range of habitats and environmental conditions.
Regarding effects of responses (management), it is of interest to identify the most important pathways of NIS introductions. For the records provided by the 11 Contracting Parties, the pathway remains uncertain/unknown for 56% of the species. Given that many NIS have been introduced with multiple pathways and from multiple sources (e.g., Rius et al., 2015), this could partly explain large unknown group. Of the known pathways, introduction via ships as either hull fouling (14%) and ballast water (13%) are most important, followed by introductions via aquaculture/mariculture and associated epibionts (12%). Secondary introductions (~spread) only accounted for 5% of the NIS introductions, but as that spread may result from a combination of natural dispersal and human-mediated dispersal, it could be argued that this vector should not be specified. The remaining (1,6%) pathways are related to game fishing, intentional release, and bait escape and nursery material (Figure d). Given the absence of a standardised method with quantifiable quality assessment for determining pathways of introduction, it is currently very difficult to assess their importance.

Figure d: Reported pathways of introduction for the 426 OSPAR NIS records during 2003-2020.
An example of a well-known marine invasion is Rugulopterix okamurae, a brown macroalgal species, native in the north-east Pacific Ocean occurring along temperate zones of the coasts of the Philippines, Taiwan, China, Korea, and Japan. This alga was introduced in 2002 into European seas (Thau lagoon, Mediterranean Sea) (Verlaque et al., 2009; Boudouresque et al., 2011) from which it did not spread until last year when it suddenly appeared in the Calanque Parc (Marseille, Marine Protected Area) where it showed very invasive behaviour (Ruitton et al., 2021). It is a new NIS in OSPAR Region IV first reported in 2015, and becoming invasive in 2018. It is believed to have been introduced by ballast water transport, as well as introduction by aquaculture seed contamination, and then spread by pathways such as fishing transport and movements of discards. It has impacts on tourism and fishing. Recently it has occurred with several episodes of huge amounts of buds in the beaches around the Strait of Gibraltar.
Confidence Assessment
The confidence in the methodology for the assessment of NIS introductions is high. There is a common consensus for using the method among the regional seas commissions, with OSPAR, the Baltic Marine Environment Protection Commission (HELCOM) and the Barcelona Convention using similar assessment methodology. However, further work is required to develop the indicator, especially in relation to determining and standardising monitoring effort (both in space and time), NIS community abundance and NIS dispersal.
There is a moderate confidence in the data availability for NIS. Only 14% of records came through dedicated government NIS monitoring and the rest via academic reports, citizen science or unknown origin. Also, only 50% of the data appeared to be obtained using a data quality assurance system. It is therefore likely that the NIS reports are associated with large spatial and temporal uncertainty. In addition, it is now well-established that there are severe time lags between the date of introduction, the date of first observation/report and the publication of the report. This increases the uncertainty around the data obtained for the third period, and may limit the accuracy of the trend observed comparing period 2 and period 3 (i.e., decrease in the number of new NIS).
Conclusion
The assessment shows an overall reduction in the rate of introduction, which indicates that the applied threshold (a decreasing trend) is generally achieved. For all three Regions, there was a statistically significant decrease in introduction rates over time, in particular comparing the period 1 (2003 to 2008) and period 3 (2015 to 2020). Thus, while the rate of new NIS introduction is high (range 0,5 to 9,3 new NIS per year, Table a), the provided data indicate a decreasing trend towards the most recent assessment period, which might suggest an effect of the current measures to reduce the introduction and spread of NIS in the OSPAR Maritime Area. Despite the decreasing trends several new NIS were introduced in each OSPAR Region and Contracting Parties during the latest assessment period. This shows that continued effort is required to reduce and prevent new NIS introductions. It should be noted that there is substantial uncertainty around whether the observed decline is due to an actual reduction in integration or a change in the monitoring effort, which it was not possible to account for. Also, the current assessment is potentially biased from a delay in reporting new NIS for the most recent years, and gaps in monitoring in general (Tsiamis et al., 2019, 2021). These conditions weaken the interpretation of decreasing trends, which should be investigated further in future assessments.
Newly introduced NIS are extremely difficult to detect. Assessment of new NIS is therefore ideally based on efficient monitoring approaches to reduce potential bias among Contracting Parties related to differences in applied methodologies, as these may affect the quality and quantity of collected NIS data. Such harmonisation will thus enhance the quality of future regional assessments of trends in new arrivals of NIS. To optimise monitoring effort and reduce cost, the implementation of a harmonised monitoring programme should apply a cost-efficient and risk-based approach, emphasising high-risk areas such as harbours and marine aquaculture sites. For this, existing monitoring may, where needed, be complemented and supplemented with efficient new techniques, acknowledging the importance of adapting sampling effort to regional needs and current data gaps. Although monitoring per se does not reduce the risk or rate of new NIS introductions, early detection in risk areas and up-to-date information of NIS introductions and spread are also essential for future better assessment and management of NIS spread and NIS impact. Cost-efficient monitoring is furthermore important for assessment of the effectiveness of NIS management efforts aiming to reduce NIS impact. These primarily relate to the International Maritime Organization Convention (ballast water) and hull fouling.
Differences in the rates of introduction are considerable between Regions and Contracting Parties, with much lower rates in Region III (Celtic Seas). As the NIS monitoring effort (e.g., # samples per year) for each Contracting Party is not known, it is possible that observed trends in new NIS introductions partly depend on changes in monitoring activity. It is furthermore not possible to determine the reasons of observed differences between Contracting Parties there was no control for the length of the coast that was monitored or the type of habitats that were surveyed. Part of the discrepancies might be explained for example by the number of high-risk areas that were surveyed.
Continued implementation of the European Union MSFD, Invasive Alien Species Regulation, and Water Framework Directive, and the International Maritime Organization Ballast Water Management Convention, should ensure that some of the identified gaps in monitoring will be addressed.
Several issues have been identified in relation to the data used for this assessment:
- A lack of information on the monitoring effort applied to detect new NIS. The number of new NIS introductions reported may be positively correlated with monitoring effort, so years or areas with high numbers of new NIS records may be the result of increased monitoring effort; equally a year or an area with few new NIS records may be the result of little or no monitoring effort.
- A lack of information concerning the methods used for NIS detection, in particular their sensitivity and / or suitability for detecting NIS. Without an understanding of the methodology applied it is difficult to determine the effectiveness of the methods used for detecting NIS;
- Limited monitoring at locations considered to be at particular risk of new NIS being introduced, such as ports, marinas, and aquaculture sites, therefore species will be missed at the point of introduction;
- Likely time lags between when a NIS is first recorded and when the introduction actually occurred. This also raises issues with linking introduction events to specific pathways of introduction and management measures;
- Potential discrepancy between where an NIS is first recorded and where it was actually first introduced. This may result from multiple NIS introduction events, where subsequent introductions are detected before the initial introduction, or where a secondary population resulting from spread is detected prior to the original founder population. Such multiple introductions (primary or secondary) are commonplace in marine systems;
- Data accessibility varies between Contracting Parties, depending on internal processes for collating and storing data. This may result in missing data, resulting in an incomplete view of the number of new NIS introductions in a given year; and
- Reliable data are not available for a long enough period to effectively examine trends in new NIS introductions over time.
Despite data limitations, this assessment does demonstrate how this indicator can be used to determine changes in the number of new NIS being introduced into the three Regions assessed (and has synergy with other Regional Seas Conventions in Europe), with the provision of appropriate data. Development and implementation of coordinated and harmonised monitoring is required to address the issues listed above and to provide accurate datasets for future assessments. Any such monitoring will need to be integrated with other requirements such as those for the European Union Marine Strategy Framework Directive, the European Union Invasive Alien Species Regulation, and the International Maritime Organization Ballast Water Management Convention.
Knowledge Gaps
Strengthening of non-indigenous species (NIS) monitoring would improve the confidence of this indicator, and importantly make it possible to investigate changes in NIS dispersal and ecological impact for future assessments. Efforts need to focus on a cost-effective approach to:
- Improve the baseline dataset, from available knowledge, for comparison against future assessment periods, as well as the description of the observation (notably the type of habitats where the observation was made) to determine the contribution of high risk of introduction areas;
- Perform a sensitivity test of different proposed indicators for assessing spread and impact of NIS;
- Consider approaches and methodology used by other organisations and for other regulatory requirements for a better appraisal of the monitoring effort;
- Coordinate and harmonise monitoring and response at the OSPAR regional level, in association with other Regional Seas Conventions;
- Improve data flow and management processes;
- Develop methods to improve the speed and probability of early NIS detection;
- Develop and test methods for documenting the importance of different vectors to the introduction of NIS;
- Test complementary NIS indicators to assess NIS dispersal and impact.
Although huge effort has been made to provide high quality NIS data, there are still several limitations with the available data which reduce the accuracy and reliability of the current assessment of NIS introductions and thus the possibility to assess the effectiveness of management measures.
Development and implementation of a coordinated and harmonised monitoring approach, and longer-term datasets, are therefore required to provide accurate interpretations for future assessments of trends in NIS introductions. Such monitoring is furthermore essential to assess the geographical spread and impact of invasive NIS, which also address the requirements under the European Regulation 1143/2014: on the prevention and management of the introduction and spread of invasive alien species, in particular with respect to species of Union concern.
In relation to future assessment of NIS introductions, consideration could be given to the following: 1) development of baselines; 2) improve speed of early detection and response; and 3) improve data flow and management.
Develop Baseline Dataset:
- A baseline is required from which future trends can be assessed. This could be achieved using secondary data (i.e., information collected from sources other than established monitoring programmes, such as academic surveys and citizen science) and validated against data collected from monitoring programmes as they are developed;
- Provide contextual data to the observation, such as if the NIS was reported in high-risk areas (ports, marinas, aquaculture sites) or in natural habitats;
- The development of a baseline and the validation process would ideally be conducted at the OSPAR regional scale, but could also be coordinated between Regional Seas Conventions.
Improve Speed and Probability of Early Detection and Response to NIS, Notably in Areas at High Risk of Introduction:
- Increase the quality and quantity (both in space and time) of monitoring conducted for NIS;
- Conduct vector-related monitoring at locations at high risk from the introduction of NIS, such as ports, marinas and aquaculture sites;
- Promote the use of new detection methods, such as molecular-based tools (e.g., targeted PCR or metabarcoding from environmental DNA);
- Develop methods whereby monitoring effort can be quantified and compared between Contracting Parties;
- Collaborate with other Regional Seas Conventions in the development of standardised monitoring protocols specific to each survey method/tool to optimise detection of NIS;
- Develop methods by which assessment results can be compared with effort undertaken in relation to the programme of measures to determine its effectiveness and how the programme of measures may need to be modified in the future;
- Contribute further to implementation of the HELCOM/OSPAR joint project on developing an early warning system to alert Contracting Parties, especially on the occurrence of potentially invasive NIS to enable joint consideration of possible eradication efforts as a rapid response action;
- Improve the quality assurance of taxonomic identification.
- Coordinate and harmonise monitoring at the OSPAR regional level, as well as at the level of other Regional Seas Conventions;
- Ensure expertise and experience is shared between and within Regional Seas Conventions;
- Develop standardised monitoring guidelines and procedures to ensure consistency;
- Investigate and define optimised monitoring design for the European Union Marine Strategy Framework Directive, with potential applicability to other policy drivers, such as the International Maritime Organization Ballast Water Convention, the European Union Water Framework Directive and the European Union Invasive Alien Species Regulation; and
- Identify a central body / group of representatives to coordinate monitoring and quality assurance, within and between Regional Seas Conventions.
Improve Data Flow and Management Processes:
- Develop data management and data flow guidelines;
- Identify a common repository for data management processes and storage; and
- Standardise reporting format and procedure to the common repository.
BOUDOURESQUE C. F., KLEIN J., RUITTON S., VERLAQUE M., 2011. Biological Invasion: The Thau Lagoon, a Japanese biological island in the Mediterranean Sea. In Global change : mankind-marine environment interactions. CECCALDI H.J., DEKEYSER I., GIRAULT M., STORA G. (eds), Springer publ., Netherlands : 151-156.
Castro, N. et al. (2022). Diversity and patterns of marine non‐native species in the archipelagos of Macaronesia. Diversity and Distributions. Available at: https://doi.org/10.1111/ddi.13465
Rius, M. et al. (2015). Marine invasion genetics: from spatial and temporal patterns to evolutionary outcomes. Biological Invasions, 17(3), 869-885. Available at: https://doi.org/s10530-014-0792-0
Ruitton, S. et al. (2021). Rapid Spread of the Invasive Brown Alga Rugulopteryx okamurae in a National Park in Provence (France, Mediterranean Sea). Water, 13(16). Available at: https://doi.org/10.3390/w13162306
UNEP/MED, (2021). Monitoring and Assessment Scales, Assessment Criteria and Thresholds Values for the IMAP Common Indicator 6 related to non-indigenous species. Meeting of the Ecosystem Approach Correspondence Group on Monitoring (CORMON) Biodiversity and Fisheries. 10 May 2021. WG.500/7. 28 p.
Verlaque, M.; Steen, F.; De Clerck, O. (2009). Rugulopteryx (Dictyotales, Phaeophyceae), a genus recently introduced to the Mediterranean. Phycologia 48(6): 536-542. Available at: https://doi.org/10.2216/08-103.1
In: Phycologia. International Phycological Society: Odense. ISSN 0031-8884; e-ISSN 2330-2968
Tsiamis, K., Palialexis, A., Stefanova, K., Gladan, Ž. N., Skejić, S., Despalatović, M., ... & Cardoso, A. C. (2019). Non-indigenous species refined national baseline inventories: A synthesis in the context of the European Union's Marine Strategy Framework Directive. Marine Pollution Bulletin, 145, 429-435.
Tsiamis, K., Palialexis, A., Connor, D., Antoniadis, S., Bartilotti, C., Bartolo, G. A., ... & Cardoso, A. C. (2021). Marine Strategy Framework Directive-Descriptor 2, Non-Indigenous Species.
Zenetos, A., et al. (2019). Time lags in reporting of biological invasions: the case of Mediterranean Sea. Mediterranean Marine Science, 20(2).
Contributors
Lead authors: Peter A.U. Stæhr
Supporting authors: Aina Carbonell, Laurent Guerin, Saa Henry Kabuta, Hannah Tidbury and Frédérique Viard
Supported by: Non Indigenous Species Expert Group (NIS-EG), Biodiversity Committee (BDC) and the OSPAR Secretariat
Citation
Stæhr, P.A.U., Carbonell, A., Guerin, L., Kabuta, S.H., Tidbury, H. and Viard, F. 2022. Trends in New Records of Non-Indigenous Species (NIS) Introduced by Human Activities. In: OSPAR, 2023: The 2023 Quality Status Report for the Northeast Atlantic. OSPAR Commission, London. Available via: https://oap.ospar.org/en/ospar-assessments/quality-status-reports/qsr-2023/indicator-assessments/trends-new-records-nis
| Assessment type | Indicator Assessment |
|---|---|
| Summary Results | https://odims.ospar.org/en/submissions/ospar_nis_msfd_2022_06/ |
| SDG Indicator | 14.2 By 2020, sustainably manage and protect marine and coastal ecosystems to avoid significant adverse impacts, including by strengthening their resilience, and take action for their restoration in order to achieve healthy and productive oceans |
| Thematic Activity | Biological Diversity and Ecosystems |
| Relevant OSPAR Documentation | OSPAR Agreement 2018-04 CEMP Guideline: Common Indicator - Changes to non-indigenous species communities (NIS3) |
| Date of publication | 2022-06-30 |
| Linkage | https://www.ospar.org/documents?v=38992 |
| Conditions applying to access and use | https://oap.ospar.org/en/data-policy/ |
| Data Snapshot | https://odims.ospar.org/en/submissions/ospar_nis_snapshot_2022_06/ |
| Data Results | https://odims.ospar.org/en/submissions/ospar_nis_results_2022_06/ |