

Waterborne and Atmospheric Inputs of Nutrients and Metals to the Sea
1. Introduction and Methodology
1.1 Scope and context
This report is the third comprehensive scientific assessment of trends in data collected under OSPAR’s Comprehensive Study of Riverine Inputs and Direct Discharges (Agreement 1998-05) that was later replaced by the Riverine Inputs and Direct Discharges Monitoring Programme (RID) (Agreement 2014-04) applicable from 1 January 2015. A first assessment of input trends in the OSPAR Regions and sub-regions of the Greater North Sea was undertaken in 2005 for the period 1990 - 2002 (OSPAR, 2005) followed by a contribution to the Quality Status Report 2010 which describes the results of the trend analysis of data collected under RID in the period 1990 – 2006 (OSPAR, QSR 2010). This report describes results of the trend analysis of data collected under RID, under national and European assessments by Contracting Parties and under the Co-operative programme for monitoring and evaluation of the long-range transmission of air pollutants in Europe (EMEP). It shows annual actual and normalised inputs and trends for nutrients and contaminants for the period 1990 – 2019 (30 years). This assessment is a contribution to the Quality Status Report 2023 and provides supporting evidence for conclusions on progress towards the specific targets of the OSPAR Hazardous Substances Strategy and Eutrophication Strategy 2010-2020 to reduce discharges and associated riverine inputs of pollutants to the North-East Atlantic.
The RID Programme forms one element within OSPAR’s wider Joint Assessment and Monitoring Programme. The purpose of RID is to assess, as accurately as possible, all riverine and direct inputs of selected pollutants to the OSPAR Maritime Area on an annual basis. The RID Monitoring Programme defines the monitoring regime to be employed for generating and reporting input data. It describes, for example, the relevant substances and river systems covered, the sampling approach locations and frequency, detection limits calculation methodologies and quality assurance to be applied.
Under the RID Programme, Contracting Parties should aim to monitor at least 90% of the inputs of each selected pollutant on a regular basis. A number of determinants are to be monitored on a mandatory basis and this assessment considers nine of these determinants and a ratio of two of these determinants:
- total cadmium (Cd)
- total copper (Cu)
- total mercury (Hg)
- total lead (Pb)
- total zinc (Zn)
- total nitrogen (N, or tot-N)
- total phosphorus (P, or tot-P)
- N:P ratio
- phosphate (PO4-P-)
- ammonium (NH4-N)
Water discharge (Q) was included in the assessment.
Sources for monitoring and reporting of direct discharges under the RID Programme include sewage and industrial effluents downstream river monitoring points and aquaculture. As far as practicable, estimate inputs from unmonitored areas (including diffuse sources and minor direct sources and rivers) should complement the percentage monitored to 100%. Information on source apportionment of nutrients for some of the selected river catchments originates from various national modelling work that is referred to in the respective section.
The Comprehensive Atmospheric Monitoring Programme (CAMP) aims to assess the input of selected contaminants and nutrients to the OSPAR Maritime Area and its Regions via atmospheric deposition. This is based on annual monitoring and reporting of concentrations of components in precipitation and air. Modelling and assessment products are produced externally through EMEP. Four EMEP Centres are involved in this work:
- The Meteorological Synthesizing Centre – West (MSC-W): Carries out the modelling for the nutrients
- The Meteorological Synthesizing Centre – East (MSC-E): Carries out the modelling for the contaminants
- Centre on Emissions Inventories and Projections (CEIP): Emission data are official submitted by OSPAR-Contracting Parties to CEIP
- Chemical Coordination Centre (CCC): Measurement data are official submitted by OSPAR-Contracting Parties to CCC
1.2 Objectives
The objectives of the work were:
a. To demonstrate how input data support identifying input pathways, trend in and early warning of changes in inputs and give an indication of effectiveness of measures to reduce inputs from 21 catchments in the OSPAR Maritime Area Regions I-IV (Figure 1.3.1, Figure 1.3.2 and Figure 1.3.3) with the above referred to determinants and ratios;
b. To produce a case study of main pathways (atmospheric, direct, riverine);
c. To illustrate the effectiveness of remedial measures.
1.3 General information on the OSPAR Regions
1.3.1 Region I: Arctic Waters
Region 1 includes inputs from Norway (excluding the Svalbard archipelago) and Iceland to the Norwegian and Barents Seas. Inputs from Greenland, the Faroe Islands and north western Russia are not included. The drainage area of the Arctic Sea Waters is about 187 000 km2.

Figure 1.3.1: OSPAR Region I: Arctic Waters

Figure 1.3.2: OSPAR Region II: Greater North Sea and Region III: Celtic Seas
1.3.2 Region II: Greater North Sea
The Greater North Sea covers the following sea areas and countries: North Sea (Belgium, the Netherlands, Germany, Denmark, Norway and UK), Skagerrak (Denmark, Sweden and Norway), Kattegat (Sweden and Denmark), and the Channel (UK and France). The drainage area of Region II covers approximately 959 000 km2.
1.3.3 Region III: Celtic Seas
Region III includes the Irish Sea and the whole of Ireland and the western part of the UK. It extends between 60° N and 48° N and between 5° W and the west coast of Great Britain to the 200 m depth contour to the west of 6° W. The drainage area of the Celtic Seas is about 176 000 km2.
1.3.4 Region IV: Bay of Biscay and Iberian Coast
The Bay of Biscay and Iberian Coast Region extends from 48° N to 36° N and from 11° W to the coastline of France, Spain and Portugal. The drainage area of Region IV covers approximately 655 000 km2.

Figure 1.3.3: OSPAR Region IV: Bay of Biscay and Iberian Coast
1.4 Monitoring data
One of the main objectives of the RID Programme (Agreement 2014-04), is “to monitor on a regular basis at least 90% of the inputs of each selected pollutant”. Both riverine and direct discharges are being monitored. A monitored river is defined as “all rivers that have RID water quality monitoring stations, irrespective of sampling frequency”. Direct discharges are defined as “point sources discharging directly to coastal or transitional waters” and include discharges from industry, sewage treatment plants and aquaculture.
In addition to the monitoring of rivers and direct discharges it is desirable to “as far as possible, estimate inputs from unmonitored areas complementing the percentage monitored towards 100%”.
1.5 Statistical methodology
1.5.1 Data used
Data were used from 20 selected catchments representing the OSPAR Regions I-IV (Table 1.5.1).
Table 1.5.1 – Overview of selected river catchments
| Region | River | Catchment area | Length | Discharge | Population | Population density | Area specific load | Population specific load | Mean concentration | |||
| kg / km2 | kg / inhabitants | mg/l | ||||||||||
| (flow normalised) | (flow normalised) | (flow normalised) | ||||||||||
| km2 | km | m3/s | km-2 | Nitrogen | Phosphorus | Nitrogen | Phosphorus | Nitrogen | Phosphorus | |||
| IV | Guadalquivir | 56 978 | 657 | 164 | 4 437 242 | 75 | 43,5 | 6,5 | 0,56 | 0,08 | 0,48 | 0,07 |
| IV | Guadiana | 67 733 | 818 | 79 | 1 658 908 | 24,7 | 35 | 7,4 | 1,43 | 0,30 | 0,95 | 0,20 |
| IV | Tajo / Tejo | 80 100 | 1 007 | 500 | 12 003 020 | 148,5 | 924 | 29,3 | 6,17 | 0,20 | 4,69 | 0,15 |
| IV | Douro / Duero | 98 400 | 897 | 442 | 3 960 264 | 40,6 | 137 | 5,7 | 3,40 | 0,14 | 0,97 | 0,04 |
| IV | Miño / Minho | 16 985 | 340 | 420 | 1 069 223 | 62,6 | 625 | 17,1 | 9,93 | 0,27 | 0,80 | 0,02 |
| IV | Garonne / Garona - Dordogne | 79 870 | 1 012 | 1 100 | 5 500 000 | 67 | 999 | 55,5 | 14,5073 | 0,81 | 2,30 | 0,13 |
| (Garonne: | (Garonne: | (Garonne: | ||||||||||
| 56 000 | 529 | 650 | ||||||||||
| Dordogne: 23 870) | Dordogne: 483) | Dordogne: 450) | ||||||||||
| IV | Loire | 117 000 | 1 006 | 835 | 11 500 000 | 70 | 842 | 21 | 8,57 | 0,21 | 3,74 | 0,09 |
| II | Suir | 3542 | 184 | 77 | 184 860 | 52 | 217 | 55 | 4,16 | 1,05 | 0,32 | 0,08 |
| II | Seine | 79 000 | 775 | 560 | 18 000 000 | 225 | 1690 | 30,6 | 7,42 | 0,13 | 7,56 | 0,14 |
| II | Scheldt / Schelde/ Escaut | 24 432 | 384 | 138 | 11 008 000 | 458 | 798 | 62,7 | 1,77 | 0,14 | 4,48 | 0,35 |
| II | Meuse / Maas | 34 548 | 925 | 350 | 8 800 000 | 251 | 1450 | 60 | 5,69 | 0,24 | 4,54 | 0,19 |
| II | Rhein / Rhin / Rijn | 200000 | 1 230 | 2 900 | 60 600 000 | 316 | 1360 | 83 | 4,49 | 0,27 | 2,97 | 0,18 |
| II | Weser incl. Jade | 48800 | 427 | 327 | 9 000 000 | 193 | 865 | 34 | 4,69 | 0,18 | 4,09 | 0,16 |
| II | Elbe | 148 268 | 1 094 | 698 | 25 000 000 | 169 | 613 | 25 | 3,64 | 0,15 | 4,13 | 0,17 |
| II | Skjern | 2 885 | 93 | 40 | 133 000 | 135 | 1253 | 30 | 27 | 0,65 | 1,72 | 0,04 |
| II | Humber | 25 168 | 1 677 | 250 | 10 800 000 | 429 | 2262 | 63 | 5,27 | 0,15 | 7,22 | 0,20 |
| II | Göta älv | 50 230 | 720 | 575 | 1 110 000 | 21 | 211 | 5,8 | 9,55 | 0,26 | 0,58 | 0,02 |
| II | Glomma | 42 000 | 621 | 720 | Ca. 600 000 | 15 | 364 | 8,3 | 25,48 | 0,58 | 0,67 | 0,02 |
| I | Alta | 7 390 | 240 | 90 | Ca. 2450 | 0,3 | 88 | 2,7 | 265,44 | 8,14 | 0,23 | 0,01 |
| I | Hvítá-Ölfusá | 5 760 | 65 | 423 | 16 400 | 2,8 | 224 | 71 | 78,67 | 24,94 | 0,10 | 0,03 |
")
Figure 1.5.1: Selected catchments (Philip Axe, 2022)
The data have been validated by Contracting Parties. After an initial screening it became apparent that there were possible errors in some of the data. Contracting Parties re-checked the reported data from 1990 to 2019 and re-submitted erroneous data where possible.
1.5.2 Preparation of datasets
The assessment of the 21 catchments was carried out only on consistent time series, i.e., it should be guaranteed that there are no missing data for the entire time period considered. For each of the 21 catchments and parameters with missing data it had to be decided whether the gaps can be filled with estimated data or whether the whole series could not be taken into account.
1.5.3 Flow normalisation
To reduce the impact on actual weather conditions, i.e., wet and dry years, the annual riverine nutrient and metal inputs where flow-normalised using the reported annual water flow. In this assessment, the HELCOM flow normalisation approach has been implemented using the relationship between water flow and inputs (HELCOM, 2019). Riverine nutrient inputs were flow-normalised at the smallest geographical scale possible before aggregating to national totals to each region. The flow normalisation increased the confidence in trend analyses and improved data quality as spurious results were easier to identify, giving Contracting Parties the opportunity to re-report data where necessary.
1.5.4 Software
The analyses were carried out with the programming language Python (Python Software Foundation, Version 2.7). The following analyses were performed with Numeric Python Numpy 1.12.0, Matplotlib 1.4.3 and the Scipy.stats toolbox 0.15.1:
- Flow normalisation
- p-value and significance
- Plotting the figures
Maps were created using QGIS 3.10
2. Region I
2.1 Alta

Figure 2.1.1: Map showing the extent and land use in the Alta river basin

Figure 2.1.5: Time series of Total Nitrogen loads

Figure 2.1.2: Time series of Cadmium loads

Figure 2.1.3: Time series of Lead loads

Figure 2.1.4: Time series of Mercury loads

Figure 2.1.6: Time series of Total Phosphorus loads
2.1.1 Size and geography
River Alta’s catchment area is 7 390 km2. The river is also named Alta-Kautokeino, since the upper part, upstream of the Alta dam, is called Kautokeino River. The dam was built in the 1980s, and was ready for hydropower development in 1987, after many protests. Downstream of the dam the river runs through Sautso, which is Northern Europe’s largest canyon. The river starts at the border to Finland and runs southwards to the Alta Fjord.
2.1.2 Population density
Population density is about 0,3 per km2. The river was chosen as a ‘reference’ river in the Norwegian RID Programme since there are few inhabitants. It runs through the township of Alta (ca. 15 000 inhabitants in 2020) in the very lower parts; but not all of these live within the catchment area.
2.1.3 Land use
Some agriculture in the lower areas, mainly grass production and animal husbandry (cows, sheep, horses). The Sami people have reindeer, the protests against the dam were partly linked to the fact that the dam hindered the migration of the reindeer.
2.1.4 Use of the river
Hydropower in the Alta reservoir, with an average annual production of 655 GWh. Salmon fishing in the river downstream of the dam, and other recreation in the Sautso canyon.
2.1.5 Point and diffuse sources
Some diffuse runoff from agricultural lands in the lower reaches (grass production and animal husbandry), illegal garbage dumping, households not connected to sewage treatment plants.
")
Figure 2.1.7: Alta Hydro Power dam in 2003 (Bair175, Wikipedia 2003 CC BY-SA 3.0)
 by source in the County of Finnmark, 1990-2020. (Source: TEOTIL, www.niva.no)")
Figure 2.1.8: Direct discharges of total phosphorus (TP) by source in the County of Finnmark, 1990-2020. (Source: TEOTIL, www.niva.no)
 by source in the County of Finnmark, 1990-2020. (Source: TEOTIL, www.niva.no)")
Figure 2.1.9: Direct discharges of total nitrogen (TN) by source in the County of Finnmark, 1990-2020. (Source: TEOTIL, www.niva.no)
2.1.6 Trends in the export
For nutrients, the only significant trend (not flow normalised) in River Alta is a decline in ammonia. Metal loads are decreasing, but the concentrations are low, so some of the apparent trend can be linked to detection limits.
For direct discharges, data are not available for the Alta River, but for the entire county of Finnmark there are data for total phosphorus TP) and total nitrogen (TN) since 1990. These are produced by the Norwegian TEOTIL Programme, which feeds into the RID Programme; methods are described in annual reports from RID. Since this is a scarcely populated region, it can be assumed that the figures for the entire country reflect well the conditions in the River Alta. The figures below show TP and TN from different sources of direct discharges in Finnmark County. The increase of both nutrients is due to fish farming, that has escalated in the period. The farming is carried out along the coast, and not inland.
2.1.7 Measures
A forthcoming Plan of Measures (2022-2027) highlights the following tasks to be dealt with in the future: Treating sewage from households not connected to sewage treatment plants; reducing illegal garbage dumping; balancing fertilisation/use of manure in agriculture; dealing with manure from horses and leakage and plastic from round bales.
2.1.8 What next?
In this region, 96% of the surface freshwaters have good or very good status according to the monitoring related to the EU WFD. The new River Basin Management Plan for 2022-27 highlights the following pressures that need to be considered for the Alta River and its neighbouring catchments: Alien species and introduced diseases, hydropower, fisheries and aquaculture, sewage and industry. In addition, plastics in the environment and climate change (increased precipitation) are future focus areas for the region.
2.2 Hvítá-Ölfusá

Figure 2.2.1: Map showing the extent and land use in the Ölfusá river basin

Figure 2.2.4: Time series of Mercury loads

Figure 2.2.6: Time series of Total Nitrogen loads

Figure 2.2.2: Time series of Cadmium loads

Figure 2.2.3: Time series of Lead loads

Figure 2.2.5: Time series of Total Phosphorus loads
2.2.1 Size and geography
The Ölfusá-Hvítá basin is an Icelandic watershed spreading from the Langjökull and Hofsjökull highland ice-caps down to the Atlantic Ocean. It drains an area of 5 760 km2, whose orogenic and hydrologic configuration is mainly influenced by the glaciers and the rifting of the Eurasian and American tectonic plates (Sigmundsson, 2006; Thordarson & Höskuldsson, 2008). Fissural and central volcanoes related to this rifting form a NE-SW natural barrier that ensures an important orographic forcing on oceanic air masses circulation above Iceland (Crochet et al., 2007). Mean annual precipitation above the basin is thus important, ranging from 1 350 mm by the Atlantic coast up to 3 800 mm above the two ice caps (Jóhannesson et al., 2007), and forms a significant seasonal snowpack in the highlands. The study area, which covers roughly 800 km2, embraces the lower reaches of the Ölfusá basin along with neighbouring wetlands from adjacent basins where those reaches occasionally drain out. This area concentrates most of the South Iceland urban areas and population and can be therefore considered as a risk management district regarding floods.
2.2.2 Population density
The population of Iceland is about 300 000. Most of the inhabitants, approximately 90%, live by the coast. Around 70% of the population lives in the southwest part of the country, in the Faxaflói bay area. Only about 6% of the population lives in rural areas and fewer than 1 000 people live above 200 m altitude. The rivers are thus generally free from sewage and industrial discharges. The riverine inputs with Icelandic rivers are thus mostly natural background values. Anthropogenic inputs with rivers are low due to low population density.
")
Figure 2.2.7: Selfoss at the River Ölfusá, South Iceland (Peter Prokosch, Grida.no CC BY-SA 3.0)
")
Figure 2.2.8: Lagoons aside the Ölfusá River Mouth, South Iceland (Peter Prokosch, Grida.no CC BY-SA 3.0)
2.2.3 Land use
The catchment is sparsely populated, especially in the highlands. The total size of cultivated grass fields is estimated as 114 km2 (grain fields are 0,2 km2) or 2% of the catchment area. The area is a popular tourist attraction with the National Park Thingvellir in the catchment area.
2.2.4 Use of the river
Due to the small number of inhabitants in the area there is low pressure from anthropogenic sources but there is still few effluent sites from small villages and diffused sources from agricultural land (2% of the total area). The usual use of fertilizers for grass fields is 100 kg N/ha and 30 kg P / ha. The catchment area is a popular tourist attraction, with white water rafting and diving being amongst the biggest attractions.
2.2.5 Point and diffuse sources
The largest part of nutrient flux comes from natural sources. However, there are several point sources in connection with small villages and from agriculture (which is only around 2% of the total area). The main anthropogenic point source into the river is downstream of the sampling site.
2.2.6 Trends in the export
Total N and P measured are total dissolved (measured in filtered samples). Anthropogenic inputs are expected to be low compared to natural background.
The low number of samples each year increase variations in calculation.
2.2.7 Measures
A waste water treatment plant was built for the second largest town in the area a few years ago and now there is a plan for building a waste water treatment plant for the largest town located in the river catchment. That project has undergone environmental impact assessment (Skipulagsstofnun 2020).
2.2.8 What next?
The Icelandic government is currently in the process of publishing its first river basin management plan. The implementation of the RBMP aims for water bodies to reach their environmental objectives, reduce pressures where needed, increase knowledge of the water resource and long-term monitoring of water. The validity period for the RBMP is between 2022 and 2027.
The measure as mentioned above: Waste water treatment plant for the largest town located in the river catchment.
3. Region II
3.1 Humber

Figure 3.1.1: Map showing the extent and land use in the Humber river basin

Figure 3.1.4: Time series of Mercury loads

Figure 3.1.6: Time series of Total Phosphorus loads

Figure 3.1.2: Time series of Cadmium loads

Figure 3.1.3: Time series of Lead loads

Figure 3.1.5: Time series of Total Nitrogen loads
3.1.1 Size and geography
The Humber River Basin District (RBD) covers an area of 26 100 km2, draining approximately 20% of the land area of England. This river basin comprises 18 river management catchments (including the major catchments of the Rivers Trent and Ouse) extending north, west and south from the River Humber, and draining eastwards through the Humber Estuary to the North Sea. The management catchments that make up the river basin district include many interconnected rivers, lakes, groundwater and coastal waters.
3.1.2 Population density
Population density is an average of 429 inhabitants per km2, but the spread of more than 10,8 million people is not uniform, the highest populations living and working in towns and cities, with the main urban centres being Birmingham, Leeds, Bradford, Sheffield, Hull, and Grimsby.
")
Figure 3.1.7: The Humber river basin population (UK Department for Environment Food and Rural Affairs – Catchment Data Explorer, 2020)
")
Figure 3.1.8: The Humber Estuary and Spurn Head looking north-east from over North Lincolnshire (RuthAS, Wikipedia 2012 CC BY-SA 3.0)
3.1.3 Land use
The river basin ranges from the uplands of the Yorkshire Dales and North York Moors National Parks in the north, and the Peak District in the west, to fertile river valleys of the Trent in the south, and the low-lying Lincolnshire Wolds in the east. The area encompasses the full range of land uses, from rural agricultural to urban and industrial. There is a rich diversity of wildlife and habitats, supporting many species of global and national importance.
3.1.4 Use of the river
Large parts of the Humber basin are of great landscape, conservation and amenity value, and attract many tourists due to the National Parks and forests, natural features and historic sites. The catchments are home to a mixture of commercial and industrial towns, sparsely populated uplands and intensively agricultural lowland areas. Several rivers in rural landscapes are impounded by public water supply reservoirs. There are many industrial and recreational uses of the Humber estuary, and the city of Hull is a major port with strong trade links to Europe, Scandinavia and the Baltic. Large conurbations are associated with the Birmingham Canal Navigations, the most extensive canal network of any urban area in the UK. Several large conurbations of the Trent and its tributaries have an ongoing legacy of issues relating to urban runoff, pollution incidents, and effluent dilution from sewage treatment, industry and coal mining.
3.1.5 Point and diffuse sources
The Humber river basin is a diverse landscape with multiple uses. Based on the SEPARATE modelling framework (Zhang et al., 2014), agriculture is the main source of nutrients (80% of nitrogen and 52% of phosphorus). For groundwater-fed sub-catchments, nitrogen can also be problematic, as a legacy from historic agricultural fertiliser use. However, the second largest source of phosphorus is sewage treatment works, delivering 24% of total phosphorus load in the catchment, with a further 13% from combined sewer overflows.
3.1.6 Trends in the export
Nitrogen and phosphorus loads from the Humber catchment have shown downward trends during the period 2010-2019. Also during this period, the trends in heavy metal loads have remained stable for mercury, and decreased steadily for cadmium and lead. However, after attaining a minimum in 2017, a return to 2015 values of flow-normalized lead concentrations can be observed during the period 2017 to 2019.
Nitrogen loads are closely correlated with rainfall, and this may, in part, account for the slower decline in nitrogen levels than is seen for phosphorus. Land use in the east of England is dominated by agriculture and, during periods of high rainfall, groundwater containing elevated concentrations of nitrogen from historic fertiliser use can contribute to riverine loads from the Humber catchment.
")
Figure 3.1.9: Source apportionment of nitrogen and phosphorus loads exported by the Humber catchment (Zhang et al., 2014)
3.1.7 Measures
According to the UK river basin planning progress report (2021), there has been little overall change in ecological status of surface waters since 2015, with only 16% of total water bodies achieving good status, the majority being classified as moderate (63%), and the remainder poor (17%) or bad (3%). These values are typical of those for the Humber RBD, where higher status achieved in some small river sections have been countered by deterioration in others. Likewise, there has been little underlying change for most substances assessed as part of chemical status for surface waters.
The River Basin Management Plan (RBMP) measures between 2016 and 2021 resulted in respective enhancement (along 11 327 km), and protection (along 1 440 km), of waterbodies. Measures have included: actions through the Countryside Stewardship scheme and Catchment Sensitive Farming, and implementation of the Reduction and Prevention of Agricultural Diffuse Pollution (England) Regulations 2018; water industry improvements to sewage treatment work and to the sewerage network; river and floodplain restoration projects; implementation of schemes to treat water discharging from abandoned mines; mitigation to high-risk outfalls on strategic road networks; restoration of sustainable abstraction. These and other ongoing measures continue to work on preventing deterioration, establishing and maintaining protected areas, improving water body status and increasing resilience to climate change impacts.
3.1.8 What next?
The UK government launched a consultation to update the RBMPs, and the updated plans were published in 2022. The updated plans consider climate change to be a critical challenge that requires urgent action and investment to limit future deterioration in the quality of the water environment. While the plans to do not have an end date, they will be reviewed and updated again in 2027. In addition, the UK government is currently analysing the feedback received on the consultation of the UK Marine Strategy Part Three programme of measures and aims to publish this update in 2023.
Under the Environment Act, Defra has made it a statutory duty for water companies to produce comprehensive statutory Drainage and Sewerage Management Plans setting out how they will manage and develop their drainage and sewerage system over a minimum 25-year planning horizon. This will include a requirement to assess the environmental impacts of the sewerage system, such as the impact of phosphorus and nitrogen loads from waste water treatment works.
From 2020 to 2025, water companies are investing £2,5 billion in measures that reduce nutrient pollution from sewage treatment works nationally, including some within the Humber RBD.
Further reductions are anticipated through the PR24 (Ofwat 2024 price review), for delivery 2025-2030.
Defra is introducing the Environmental Land Management scheme which is formed of three components - Sustainable Farming Incentive, Local Nature Recovery and Landscape Recovery. It is hoped that this scheme will drive greater reductions of diffuse agricultural pollution.
Additionally, the Farming Investment Fund offers grants for equipment and infrastructure to help farmers increase their productivity whilst reducing pollution.
3.2 Seine

Figure 3.2.1: Map showing the extent and land use in the Seine river basin

Figure 3.2.4: Time series of Mercury loads

Figure 3.2.6: Time series of Total Phosphorus loads

Figure 3.2.2: Time series of Cadmium loads

Figure 3.2.3: Time series of Lead loads

Figure 3.2.5: Time series of Total Nitrogen loads
3.2.1 Size and geography
The Seine catchment area is a vast territory with a surface area of 76 238 km2 (14% of the French metropolitan territory) and 55 000 km of waterways. It occupies a large part of the Parisian sedimentary basin, which gives it a relatively low relief over most of its territory.
3.2.2 Population density
The average population density is 225 inhabitants/km2. However, the inhabitants are unevenly distributed over this territory. For example, in Paris, the population density exceeds 21 000 inhabitants/km2.
The total number of inhabitants is 18 million. Of these, 11 million live in the Paris conurbation, making it the most populous urban unit in the European Union. Four agglomerations have more than 100 000 inhabitants: Reims, Rouen, Le Havre and Paris.
Finally, Paris is one of the world's leading tourist destinations with around 50 million visitors per year.

Figure 3.2.7: The Seine crossing Paris. Arnaud Bouissou / Terra
. Olivier Brosseau / Terra")
Figure 3.2.8: A wheat field near the Seine (Roche-Guyon). Olivier Brosseau / Terra
3.2.3 Land use
Nowadays, the Seine River basin is characterised by a relatively high proportion of urbanised area (7,6%), compared with grasslands (9,5%), forested areas (25,6%), and croplands (56,5%).
The Seine basin concentrates 40% of national industry and 25% of French agriculture.
5,7 million hectares are devoted to the cultivation of cereals, sugar beet and rape. This intensive cereal farming has become very dependent on chemical inputs such as fertilisers and pesticides.
In terms of economic activity, some sectors such as chemicals and steel are in decline, while other sectors, such as the food industry and waste management, are on the contrary in clear progression.
3.2.4 Use of the river
In general, the flow of the Seine, a lowland river, is strongly influenced by the development of riverbeds, the waterproofing of urban soils, water intakes and releases, and by the dams located on its upper course.
Nearly 3 billion cubic metres of water are abstracted each year (from surface and groundwater). Drinking water supply is the main use with 53% of withdrawals. This is followed by industrial cooling with 33%, then industry with 11% and finally irrigation with 3%.These withdrawals can put pressure on water resources: lowering of water tables or river flows, alteration of the functioning of aquatic life or wetlands.
The port system composed of the ports of Le Havre, Rouen and Paris is the leading cereal exporting port in Western Europe and the second largest European port for cereals.
50% of French river freight is concentrated in the Seine.

Figure 3.2.9: River freight on the Seine. Laurent Mignaux / Terra
. Bernard Suard / Terra")
Figure 3.2.10: Arrival point of treated water in the Seine (Bois-le-Roi waste water treatment plant). Bernard Suard / Terra
3.2.5 Point and diffuse sources
The diffuse pollution found in aquatic environments is mainly caused by substances used by agriculture: pesticides and fertilisers (nitrates and phosphorus). A small amount of this pollution comes from non-collective sanitation installations and leaks in the sanitation networks.
Most of the nutrient flows of point source are generated by a small number of discharges: the six waste water treatment plants of the Paris conurbation treat more than half of the pollution flows entering the basin's waste water treatment plants.
Similarly, for industry, most of the flows are generated by a small number of direct discharges, mainly from the chemical, paper and food industries.
A significant proportion of rainfall effluent is conveyed to the treatment plants via combined sewer systems. A smaller but significant proportion is discharged directly, either via storm overflows or due to network malfunctions and leaks.
3.2.6 Trends in the export
While the population and gross domestic product (GDP) of the basin increased by 7,6%, the number of degraded rivers decreased by 5%. However, other data attenuate this encouraging assessment: the morphology of the rivers remains very altered and phytosanitary products are omnipresent in the vast majority of rivers and groundwater. Regarding nitrogen and phosphorus, pressures from point sources have decreased while pressures from diffuse sources have stabilised. In particular, nitrate flows reaching the coast from the Seine have been stable for the last twenty years. However, pressures from micropollutants remain high. There has been an overall increase in pesticide pressure in the basin since 2008. A stabilisation seems to be taking place since 2014, at levels significantly higher than 2008.
Regarding nitrogen and phosphorus, flows discharged from waste water treatment plants have decreased significantly despite the increase in population thanks to improved treatment systems in urban and industrial waste water treatment plants. Today, the majority of point pressures come from waste water and stormwater collection networks and their possible untreated discharges into the natural environment. Although mineral nitrogen inputs for crops seem to have stabilised in the basin since 2014, the release of nitrates into the environment caused by the turning over of grasslands and changes in land use are difficult to understand. It appears that flows from (agricultural) soil leaching represent at least 70% of the total nitrate flow to the outlet for all water bodies.
Regarding micropollutants, the most common point source micropollutants discharged into surface waters in terms of flows are metals: zinc, copper, aluminium, nickel, manganese, etc. Micropollutants also include organic substances such as nonylphenols (detergents), DEHP (a plasticiser), or PAHs (combustion residues or from the oil industry). The diversity of active ingredients used has also increased.
3.2.7 Measures
The decrease in the number of degraded rivers (in a context of increasing GPD) is an important progress resulting from the involvement of all stakeholders in reducing the pressures produced by human activity (pollutants, withdrawals, physical modifications of rivers or the coastline). For example, the results show a very clear reduction in domestic pollution thanks to the modernisation of waste water treatment plants.
Several major sources have also been eliminated for nonylphenols, xylenes and other benzene derivatives, and chromium and many efforts have been made to reduce the discharge of micropollutants, especially metals and halogenated solvents. In parallel with the overall increase in pesticide pressure, organic farming, which is primarily characterised by the ban on the use of synthetic plant protection products, has clearly increased in the basin.
3.2.8 What next?
Given the increase in demographic and economic pressures, the consequences of climate change, and the continued use of phytosanitary products, it is unlikely that all the rivers in the basin will achieve good status by the deadline of the Water Framework Directive (2027).
The draft of the next WFD management cycle (2022-2027) includes the following groups of key measures:
- Functional rivers, preserved wetlands and restored water-related biodiversity
- Reduce diffuse pollution, particularly in drinking water catchment areas
- For a healthy territory, reduce point source pressures
- Ensure territorial resilience and balanced management of water resources in the face of climate change
- Act from the basin to the coast to protect and restore the sea and the coastline
In parallel, the new research programme is organised around the following axes: the agri-food system, climate change, risk management, biodiversity, the Paris metropolis (with the 2024 Olympic Games and the ambition of a white-water swimming) and the contamination of aquatic environments.
3.3 Scheldt / Schelde / Escaut

Figure 3.3.1: Map showing the extent and land use in the Scheldt river basin

Figure 3.3.4: Time series of Mercury loads

Figure 3.3.5: Time series of Total Nitrogen loads

Figure 3.3.2: Time series of Cadmium loads

Figure 3.3.3: Time series of Lead loads

Figure 3.3.6: Time series of Total Phosphorus loads
3.3.1 Size and geography
The Scheldt river basin covers parts of the north of France, Belgium, and the south of the Netherlands, for approximately 21 630 km2. Due to canalisation, it also includes parts of the polder areas in those countries, as well as the Yser river basin (1 749 km²). As such, the river Scheldt basin district area covers 24 432 km². The river Scheldt discharges through the Westerschelde estuary (160 km long) into the North Sea at Vlissingen. The canal from Ghent to Terneuzen is the most important one, as it is part of a transboundary industrial and harbour area discharging into the Westerschelde.
3.3.2 Population density
Population density reaches on average 458 inhabitants/km². The largest cities are Lille, Brussels, Ghent and Antwerp.
3.3.3 Land use
Dwellings, industries, and agriculture are strongly mixed. Agriculture covers 61% of the total area of the International River Basin District Scheldt. The presence of the harbours of Le Havre, Calais, and Dunkerque in France, of Zeebrugge, Brussels, Ghent, and Antwerp in Belgium, and of Vlissingen and Terneuzen in the Netherlands explains the extent of the traffic network.
")
Figure 3.3.7: The river Scheldt near Antwerp, Lillo (Rudy Vannevel, 2018)
")
Figure 3.3.8: Ghent, the Old Docks on the Canal Ghent-Terneuzen (Rudy Vannevel, 2019)
3.3.4 Use of the river
The river Scheldt and its basin are highly regulated. On the Scheldt, as well as on its tributaries and on the canals of the district, there are more than 250 weirs and locks. Shipping, urbanisation and agriculture are the three main operational usages for which hydro-morphological changes have been made to the water body. Long stretches of the river are canalised.
3.3.5 Point and diffuse sources
Major pressures in the Scheldt river basin include pollution from domestic areas, industry, agriculture and transport. Population is about 11 million. There are a number of major industrial areas, most of them part of a harbour area: Calais and Dunkerque in France, Zeebrugge, Ghent, Antwerp in Belgium, Vlissingen, and Terneuzen in the Netherlands. In the northern and western part of the basin, the main agricultural activity is live-stock farming (piggery), whereas crop farming is the main agricultural activity in the southern part.
3.3.6 Trends in the export
The mean flow rate from France and Belgium to the North Sea and the Netherlands is about 138 m³/s in 2018. On average, the combined flows of the river Scheldt and the Canal Ghent-Terneuzen reach about 80-85 % of the total flow in Belgium. The flow rate of the Scheldt varies strongly. Climate change is likely to have an impact on the flow: since 1990, the average annual flow decrease of the river Scheldt near the Belgian-Dutch border is about 1,12 m³/s (0,74%). Flow variations do not fully reflect natural conditions as both in times of floods and droughts large water volumes are diverted by and to canals (in particular the Canal Ghent-Terneuzen) to evacuate water volumes or to secure shipping.
In 2018, nitrogen loads discharged from Belgium and France reached 18,06 kt, and 1,42 kt for phosphorus. The river Scheldt is well monitored since the 1990s and is representative of showing trends of pollutants in the river basin. Loads strongly correlate with flows, reflecting peaks of floods and droughts. Nevertheless, stronger effects of nutrient load reductions are observed. Since 1993, total nitrogen loads decrease by 1,12 kt/year (or 2,87%/y) and total phosphorus loads by 0,076 kt/year (or 2,74%/y). Loads of heavy metals decrease annually by 2,8% for total zinc, 3,8% for total lead, 3,2% for total copper, 3,0% for total cadmium, and 4,4% (since 1998) for total mercury.
In particular minimum flows are a reason for concern, with an average annual flow decrease of 0,49 m³/s (0,048%/y) for the Scheldt river (BE-NL border, 1990-2020).
3.3.7 Measures
Major efforts to improve the water quality result from European legislation, in particular the Urban Waste Water Treatment Directive and the Nitrate Directive. A few episodes had a significant impact on the organic pollution reduction of the Scheldt. From 1991 on, waste water treatment in Flanders was intensified by a large number of new installations and the renovation of old installations. In 1999 and 2004, two large plants in Northern France started the treatment of domestic and industrial waste water. Between 2000 and 2019, the two large urban waste water treatment plants (UWWTPs) of the Brussels Capital Region became operational and have been upgraded. Pig farming is particularly intensive in Flanders, for this reason the first manure action plan was agreed in 1995.
The waste water treatment rate (percentage of the population of which domestic waste water is collected and treated in urban or independent waste water treatment plants) in Belgium increased from 65% in 2000 to 97,81% in 2020.
3.3.8 What next?
Measures to obtain a good river status are defined by the WFD and integrated in the RBMPs. Progress reports indicate that the majority of the rivers in the Scheldt basin and coastal area will not reach good ecological status by 2027.
Climate change is expected to significantly influence flows and pollution loads in the coming years.
3.4 Meuse / Maas

Figure 3.4.1: Map showing the extent and land use in the Meuse River basin

Figure 3.4.6: Time series of Total Nitrogen loads

Figure 3.4.2: Time series of Cadmium loads

Figure 3.4.3: Time series of Lead loads

Figure 3.4.4: Time series of Mercury loads

Figure 3.4.5: Time series of Total Phosphorus loads
3.4.1 Size and geography
The Meuse is a major European river, rising in Pouilly-en-Bassigny, on the Langres plateau (France) at an altitude of 384 m and flowing through Belgium and the Netherlands before draining into the North Sea from the Rhine–Meuse–Scheldt delta. It has a total length of 925 km (575 miles). The catchment has a total area of 35 000 km², which is discharged trough the Haringvliet into the North Sea. The Meuse had a discharge on average of 350 m3/s.
3.4.2 Population density
Around 9 million residents live in the Meuse River basin district. The population density is around 250 inhabitants per km2. The downstream part of the Meuse catchment area is characterised by a higher population density than the upstream part of the river.
3.4.3 Land use
The downstream part of the Meuse catchment area is characterised by intense economic activities and a higher population density than the upstream part of the river, whose landscape structure is similar to that of the mid-mountain region with a strong predominance of agricultural and forestry activities. These differences have a significant impact on water use and the problems encountered upstream and downstream of the basin.
Over the entire basin, land use determined by the CORINE dataset (EEA 2014) is dominated by croplands (39%), forests (29%), pastures (18%) and urban areas (12%). Agriculture has developed as intensive farming with the use of large quantities of chemical fertilisers and pesticides since the 1960s (Burny and Debode 2013).

Figure 3.4.7: The Meuse at Monthermé. Laurent Mignaux / Terra
. Laurent Mignaux / Terra")
Figure 3.4.8: Dam of Monthermé (Meuse). Laurent Mignaux / Terra
3.4.4 Use of the river
The river Meuse is heavily used for shipping, production of energy, cooling water for industry, production of drinking water as well as recreation. Furthermore, many transverse structures are built in the river(bed) and a large part is modified for shipping, agriculture and flood protection.
The water from the Meuse is used for hydraulic regulation of the river (retention, storage, discharge), supply of water for human consumption (water suitable for drinking), agriculture, industry (including hydroelectric production and cooling of nuclear power plants), navigation (freight transport and leisure boating) and recreation.
The majority of the inhabitants of the Meuse consume drinking water produced from the surface and groundwater of the catchment area. In addition, large quantities of water are abstracted and transported by canal or pipeline to produce water for human consumption for over 6 million people outside the Meuse basin.
The Meuse is a major ecosystem in North-Western Europe: not only does it provide a habitat for the fauna and flora characteristic of the large rivers of North-Western Europe, but it is also an important migratory route for diadromous fish that breed in the Meuse, its tributaries or in the sea.
3.4.5 Point and diffuse sources
The Meuse River is a recipient for waste water from various industries, sewage treatment plants and individual sewers as well as storm water from urban areas and nutrient input from agriculture.
The pressures in Meuse River basin include:
- Hydromorphological pressures: engineering structures for flood protection, navigation and/or hydropower generation (locks, dams and dykes) as well as channelling, bank artificialisation and embankments;
- Discharges, emissions and losses of harmful substances;
- Water abstraction (e.g., for canal supply, agriculture, industry and drinking water production);
- Mine water from mining activities.

Figure 3.4.9: Pond banks reinforced by Larssen sheet piling. Laurent Mignaux / Terra
These pressures result in the following potential impacts and consequences, either individually or in combination:
For surface waters:
- Modification and alteration of ecosystems, including water-related terrestrial ecosystems;
- Impediments to the free movement of fish;
- Eutrophication, especially in the main river and in transitional and coastal waters;
- Risks to water quality and water uses.
For groundwater:
- Quantitative imbalances in groundwater and altered exchange between surface water and groundwater;
- Damage to dependent terrestrial ecosystems;
- Risks to groundwater quality and uses.
3.4.6 Trends in the export
Phosphorus emissions have decreased significantly in the Meuse basin since 2005, mainly due to decreases in agricultural and urban discharges. Emissions from industries have remained relatively stable over the same period.

Figure 3.4.10: Trend of phosphorus emissions in the Meuse basin

Figure 3.4.11: Trend of nitrogen emissions in the Meuse basin
A decrease of nitrogen emissions in the Meuse basin can also be observed over the last 15 years, although less important than for phosphorus. Again, this reduction is mainly the result of a decrease in agricultural and urban emissions.
In the Meuse basin, based on current data, phosphorus in surface waters is mainly due to human activities: domestic, industrial and agricultural waste water. Approximately 47% of the phosphorus in the water comes from domestic waste water, 38% is attributed to agriculture and 15% to industry.
Figure 3.4.12: Relative phosphorus emissions - contributions from sources (current status)
Figure 3.4.13: Relative nitrogen emissions - contributions from sources (current status)
The situation is somewhat different for nitrogen: about 4/5 of the inputs are due to agriculture, while the share attributed to urban waste water amounts to 17%, with industry accounting for 3%.
3.4.7 Measures
Measures to achieve good river status are defined by the WFD and integrated into the Meuse River basin Management Plan. Progress reports show that most rivers in the Meuse basin will not achieve good ecological status by 2027.
3.4.8 What next?
In 2022 the MSFD measures plan 2022-2027 will be adopted to support and expand the measures of the WFD.
3.5 Rhine / Rhin / Rijn

Figure 3.5.1: Map showing the extent and land use in the Rhine River basin

Figure 3.5.5: Time series of Total Phosphorus loads

Figure 3.5.2: Time series of Cadmium loads

Figure 3.5.3: Time series of Lead loads

Figure 3.5.4: Time series of Mercury loads

Figure 3.5.6: Time series of Total Nitrogen loads
3.5.1 Size and geography
The total length of the river Rhine is 1 230 km. The river begins in the Swiss canton of Graubünden in the south-eastern Swiss Alps, forms part of the Swiss-Liechtenstein, Swiss-Austrian, Swiss-German and then the France-German border, then flows in a mostly northerly direction through the German Rhineland and the Netherlands and empties into the North Sea. The catchment has a total area of 200 000 km², which flows in the branches of Haringvliet, Nieuwe Waterweg, Noordzeekanaal and IJsselmeer into the North Sea. The Rhine has a discharge on average of 2 300 m3/s.
")
Figure 3.5.7: Confluence of Mosel in Rhine at Koblenz (ICBR)
")
Figure 3.5.8: Transport on the Rhine (ICBR, S.Schulte-Kellinghaus)
3.5.2 Population density
Around 60 million residents live in the Rhine river basin district. The population density is around 300 inhabitants per km2. Among the most important and the largest cities on the Rhine are Cologne, Düsseldorf, Rotterdam, Strasbourg and Basel.
3.5.3 Land use
Around 50% of the land use is for agricultural, subdivided into cultivated area (25%) and grassland (25%), 9% of the land is in use as urban area and nearly all of the rest is used as forested area. The other land uses (water expanses, traffic such as other vegetations) take only a small share. These numbers show that the land use in the Rhine river basin district is mainly agriculturally shaped.
3.5.4 Use of the river
The river Rhine is heavily used for shipping, production of energy, cooling water for industry, production of drinking water as well as recreation. Furthermore, many transverse structures are built in the Rhine and a large part is modified for shipping, agriculture and flood protection.
3.5.5 Point and diffuse sources
The Rhine river is a recipient for waste water from various industries, sewage treatment plants and individual sewers as well as storm water from urban areas and nutrient input from agriculture.
The principal components of the inventory and their inter-linkages are shown in Figure 3.5.9. The most important sources for the release of substances into the environment are shown on the left of the Figure. Substances may be released to water, air or soil. Direct input routes into surface water are indicated by blue arrows, other transport routes by black arrows. The main routes of transport into surface waters are shown from left to right. The description of the corresponding pathways is in Table 3.5.1.
| number | pathways |
|---|---|
| P1 | Atmospheric Deposition directly to Surface Waters |
| P2 | Erosion |
| P3 | Surface Runoff from Unsealed Areas |
| P4 | Interflow, Tile Drainage and Groundwater |
| P5 | Direct Discharges and Drifting |
| P6 | Surface Runoff from Sealed Areas |
| P7 | Storm Water Outlets, Combined Sewer Overflows and Unconnected Sewers |
| P8 | Urban Waste Water Treated |
| P9 | Individual - Treated and Untreated Household Discharges |
| P10 | Industrial Waste Water treated |
| P11 | Direct Discharges from Mining Areas |
| P12 | Direct Discharges from Navigation |
| P13 | Natural Background |

Figure 3.5.9: The principal components of the inventory and their inter-linkages
Figure 3.5.10: The source apportionment for N-tot (ICBR 2016)
Figure 3.5.11: The source apportionment for P-tot (ICBR 2016)
3.5.6 Trends in the export
The river Rhine is well monitored. Pollution loads strongly correlate with flows, reflecting peaks of floods and droughts. Nevertheless, effects of load reductions are observed in the non-flow normalised data. Between 1990 and 2020, total nitrogen loads decreased significantly in the first decade but in the last two decades there was no trend. The total phosphorus loads decreased much more strongly than nitrogen loads, more than 50% in the same period. For heavy metals there was a steep decrease between 1990 and 2000 but in more recent decades there was only a small trend.
The Emissions Inventory 2016 for International Commission for Protection of the Rhine also gives for the last two decades a reduction in total emissions in to the catchment of the Rhine (IKSR, 2016).
| Emissions | 2000 | 2010 | 2016 |
|---|---|---|---|
| Total-nitrogen | 420 | 321 | 272 |
| Total-phosphorus | 25 | - | 16.7 |
| Mercury | 1,9 | 1,1 | 0,9 |
| Cadmium | 8 | 3,3 | 2,8 |
| Lead | 192 | 144 | 111 |
")
Figure 3.5.12: The main branch of the lower Rhine in the centre of Rotterdam (ICBR)
3.5.7 Measures
The draft of the next WFD management cycle from 2021-2027 included the following groups of key measures:
- to reduce inputs from urban areas
- to reduce inputs from agriculture
- to reduce inputs from mining industry
- to improve continuity of water bodies
- to improve the water balance
- to reduce priority hazardous substances
- to avoid or protect from disadvantageous effects
- conceptional measures (research and advice)
3.5.8 What next?
In 2022 the MSFD measures plan 2022-2027 will be adopted to support and expand the measure of the WFD.
3.6 Weser

Figure 3.6.1: Map showing the extent and land use in the Weser river basin

Figure 3.6.5: Time series of Total Nitrogen loads

Figure 3.6.2: Time series of Cadmium loads

Figure 3.6.3: Time series of Lead loads

Figure 3.6.4: Time series of Mercury loads

Figure 3.6.6: Time series of Total Phosphorus loads
3.6.1 Size and geography
The total length of the river Weser is 450 km. Its origin is the confluence of the river Werra and Fulda at Hannoversch-Münden. Usually, the Weser is subdivided into three parts: the upper Weser (from Hannoversch-Münden to Porta Westfalica), the middle Weser (from Porta Westfalica to Bremen-Hemelingen) and the tidal Weser (from Bremen Hemelingen to the North Sea, Bremerhaven). The area of the Weser river basin district belongs entirely to Germany. The federal states of Bavaria, Bremen, Hessen, Lower Saxony, North Rhine-Westphalia, Saxony-Anhalt and Thuringia have shares of varying size in this river basin district. With a total area of 49 000 km², the Weser river basin district encompasses the neighbouring catchments of the Weser and the Jade, both of which flow into the North Sea.
3.6.2 Population density
Around 9 million residents live in the Weser river basin district. The population density is around 193 inhabitants per km2 and the largest cities in the Weser river basin district are Bremen and Hannover.
3.6.3 Land use
Around 50% of the land use is agricultural land subdivided into cultivated area (36%) and grassland (14%). 31% of the land use is forested area and 3% urban area. The other land uses (water expanses, traffic such as other vegetations) take only a small share. These numbers show that the Weser river basin district is agriculturally shaped. Large cities and conurbations in particular contribute to the sealing of the landscape. Around 4% of the river basin district is sealed.
3.6.4 Use of the river
The river Weser is used for shipping, production of energy, drinking water extraction as well as recreation. Furthermore, many transverse structures are built in the Weser and several kilometres are modified for shipping, agriculture and flood protection.
3.6.5 Point and diffuse sources
The Weser river is a recipient for waste water from various industries, sewage treatment plants and individual sewers as well as storm water from urban areas and nutrient input from agriculture. Based on the MoRE1 (Modelling of Regionalized Emissions, https://isww.iwg.kit.edu/MoRE.php) modelling (Fuchs et al., 2011, 2017) groundwater (53%) and drainages (16%) are the main source of total nitrogen while the main sources of total phosphorus are municipal point sources (25%) and groundwater (22%).
Figure 3.6.7: Source apportionment of phosphorus loads exported by the Weser catchment. Source: MoRE model
Figure 3.6.8: Source apportionment of nitrogen loads exported by the Weser catchment. Source: MoRE model
3.6.6 Trends in the export
The river Weser is well monitored. Pollution loads strongly correlate with flows, reflecting peaks of floods and droughts. Nevertheless, effects of load reductions are observed in the non-flow normalised data. Between 1990 and 2019, total nitrogen loads decrease by 0,63 kt/year (or 1,3%/y) and total phosphorus loads by 0,03 kt/year (or 1,2%/y). Loads of heavy metals decrease between 1990 and 2019 annually by 0.06 t/y (or 2,7%/y) for cadmium, 0,02 t/y (or 3,2%/y) for mercury and 0,38 t/y (or 1,3%/y) for lead.
3.6.7 Measures
The draft of the next WFD management cycle from 2021-2027 identified the following groups of key measures:
- to reduce inputs from urban areas
- to reduce inputs from agriculture
- to reduce inputs from mining industry
- to improve continuity of water bodies
- to improve the water balance
- to reduce priority hazardous substances
- to avoid or protect from disadvantageous effects
- conceptional measures (research and advice)
3.6.8 What next?
In 2022 the MSFD measure plan 2022-2027 will be adopted to support and expand the measures of the WFD.
3.7 Elbe

Figure 3.7.1: Map showing the extent and land use in the Elbe river basin
Figure 3.7.5: Time series of Total Nitrogen loads

Figure 3.7.2: Time series of Cadmium loads

Figure 3.7.3: Time series of Lead loads

Figure 3.7.4: Time series of Mercury loads

Figure 3.7.6: Time series of Total Phosphorus loads
3.7.1 Size and geography
The total length of the river Elbe is 1 094 km from its source in the Krkonoše Mountains to its estuary, the North Sea. The area of the Elbe river’s drainage basin is 148 268 km². About two thirds of the catchment belongs to Germany and represents about 27% of the total German land area. Around one third of the Elbe catchment belongs to the Czech Republic. Austria and Poland have almost the same small shares in the catchment area. Usually, the Elbe is subdivided into three parts: the upper Elbe (from the spring to Elbe km 96 – Schloss Hirschstein, 54 170 km2), the middle Elbe (from km 96 to Elbe km 585,9 – weir Geesthacht, 80 843 km2) and the lower Elbe (from Elbe km 585,9 to the North Sea, Elbe km 727,7 – Cuxhaven Kugelbake, 13 255 km2). Near the city of Hamburg, the Elbe divides into two branches: the Norderelbe and Süderelbe, encompassing the harbour. From this point on, the river forms an estuary with a width of 1,5 km downstream of Hamburg and 18 km near Cuxhaven. With a length of 90 km, the Elbe estuary is connected to the Wadden Sea – German Bight.
3.7.2 Population density
The Elbe river basin is a populous cultural landscape, counting approximately 25 million residents, thereof 18 million in Germany. The population density is around 187 inhabitants per km2 and the largest and best-known cities in the German Elbe catchment are Berlin, Hamburg, Leipzig and Dresden.
3.7.3 Land use
Around 60% of the land use is agricultural land subdivided into cultivated area (40%) and grassland (20%). 30% of the land use is forested area, 3% urban area and 5% water expanses. In the view of the land use, the German part of the Elbe catchment is widely characterized by agriculture – particularly by cultivated area.
3.7.4 Use of the river
The waters in the German part of the Elbe catchment are mainly used for shipping, production of energy, use- and drinking water extraction as well as recreation.
3.7.5 Point and diffuse sources
The Elbe river is a recipient of waste water from various industries, sewage treatment plants and individual sewers as well as storm water from urban areas and nutrient export from agriculture. Based on the MoRE2 (Modelling of Regionalized Emissions, https://www.iwg.kit.edu/MoRE.php) modelling (Fuchs et al. 2011, 2017) groundwater (37%) and drainages (27%) are the main source of total nitrogen while the main sources of total phosphorus are groundwater (27%) and municipal point sources (22%).
Figure 3.7.7 Source apportionment of phosphorus loads exported by the Elbe catchment. Source: MoRE model
Figure 3.7.8: Source apportionment of nitrogen loads exported by the Elbe catchment. Source: MoRE model
3.7.6 Trends in the export
The river Elbe and its tributary rivers are well monitored, but in this report, only the data of the Elbe Estuary are considered. Therefore, data of the Elbe tributary rivers Este, Lühe, Schwinge, Oste, Pinnau, Krückau and Stör are not included. Pollution loads strongly correlate with flows, reflecting peaks of floods and droughts. Nevertheless, effects of load reductions are observed in the non-flow normalized data. Between 1990 and 2019, total nitrogen loads decreased by 2,42 kt/year (or 2,0 %/y) and total phosphorus loads by 0,18 kt/year (or 2,3%/y). Loads of heavy metals decrease between 1990 and 2018 annually by 0,15 t/y (or 2,5%/y) for cadmium, 0,31 t/y (or 3,3%/y) for mercury and 3,79 t/y (or 2,2%/y) for lead.
3.7.7 Measures
Measures to the following field of action are planned for most water bodies in the draft of the next WFD measures plan from 2022-2027:
- Water structure
- Nutrient inputs
- Waste water treatment
- Mining and hazardous substances polluted areas
3.7.8 What next?
In 2022 the MSFD measure plan 2022-2027 will be adopted to support and expand the measures of the WFD.
3.8 Skjern

Figure 3.8.1: Map showing the extent and land use in the Skjern river basin

Figure 3.8.2: Time series of Total Nitrogen loads

Figure 3.8.3: Time series of Total Phosphorus loads
3.8.1 Size and geography
Skjern River catchment is 2 885 km2 (monitored part 2 414 km2) from the sources in Tinnet Krat in central Jutland to its mouth in the eastern part of Ringkøbing Fjord. Headwater of Skjern River is 93 km but it consists of 1 500 km stream. Average flow is about 40 m3/s at the mouth, highest flow estimated is about 325 m3/s (Andersen et al., 2004)
The geology of catchment is two hill islands of tills formed under second latest glaciation (Sahle, about 150 000 years old) the soils in the river valley are alluvial deposits from the melting ice cap from last glaciation and approximately 10 000 years old. Overall sandy soils (mainly coarse) dominate (81% of soil types), with sandy loam making up 14% of soil types and organic soils making up 5%.
The lower part of the river was formerly the biggest delta in Denmark. The river valley was a grassland for cattle in summer, and hay was collected during wintertime. Flooding gave manure to the river valley for growing wheat and rye. In addition, channels led water from the river to irrigate the river valley. The river was a source for fishery of salmon, sea trout and white fish. The river was gradually regulated by straightening, channelisation, summer dikes, pumping activities etc. since 1800, and more intensive farming was introduced. During 1962 to 1968 about 20 km of river in the lower part of the catchment were channelised and the headwaters moved to the north of the river valley. The river valley drained combined with continuously pumping activities allowing for even more agricultural activities. The river straightening and drainage of the river valley resulted in heavy pollution of the downstream situated Ringkøbing Fjord with nutrients, ochre, suspended matter as the natural self-purification effect in the river was destroyed, destroying fishery in the Fjord, and the special Skjern River salmon was nearly extinct. Water quality in the river decreased as a result of lower physical variation in the river, higher inputs of ochre, sulphur, lignite etc. which also lead to decreasing pH
Many rare plants species, and birds etc. disappeared.
The ground surface in the central areas of the river valley settled by as much as 1,5 m due to computation of soils and oxygenation of organic soils (by lowering groundwater table), which required more draining and more pumping activities to sustain farming.
In 1999-2003 the biggest restoration project in Denmark aimed to get Skjern River back to natural conditions. In total 40 km of rivers were reconstructed, including dividing lower stretches of river into a delta. About 2 220 ha of former 4 000 ha was recreated with lakes, ponds, wetland, reeds swamps, and the rivers were allowed to flood in some parts of the recreated areas. After the restoration project Skjern River salmon and sea trout have returned, as have many rare both aquatic and riparian plants species, birds, otter, amphibians etc. The remaining part of the river valley is still used for farming (growing cereals, grassland etc.)
")
Figure 3.8.4: Flooding in parts of the Skjern River Valley (photo by Brian Kronvang)
")
Figure 3.8.5: Reconstructed delta of Rivers Skjern at the outlet to Ringkøbing Fjord (photo by Hans Ole Hansen)
3.8.2 Population density
In 2020 about 133 000 inhabitants lived in the catchment, with a population density of 46 per km-2 which is rather low compared with the average for Denmark of 135 per km-2. The biggest city in the catchment is Skjern with nearly 8 000 inhabitants.
3.8.3 Land use
About 60% of the catchment is agricultural land, of this about 93% intensive farming. More than 16% is covered by forest, and about 11% of the catchment is dry or wet nature with some agricultural activities (as grassing cattle). Fortified areas cover 9% of the catchment, freshwaters (lakes, rivers, delta) about 2%. The remaining 2% are recreational areas and not classified areas.
3.8.4 Use of river
Today the river is much used for tourism and leisure activities, such as fishing (salmon, sea trout), bird watching, canoeing, walking trips. It is further described under “Size and Geography”.
3.8.5 Point and diffuse sources
Source apportionment have been assessed for 2018 and 2020 and the average is shown for total nitrogen and total phosphorus below. Flow in 2018 was more than 11% below and in 2020 nearly 23% over the long term average (1990—2020).
Agriculture is the main source for total nitrogen (more than 70%) followed by natural background load (nearly 25%). Atmospheric deposition on inland surface waters contributed 1% of total nitrogen loads. Points sources (sum of loads from municipal waste water treatment plants, industrial plants and aquaculture plants) constitutes only 3% of total waterborne, 96% nitrogen load, and load from scattered dwellings and storm waters together 1%.
Natural background load is the main source for total phosphorus (nearly 55%) followed by agriculture (more than 20%). Atmospheric deposition on inland surface waters contributed 1% of total nitrogen loads. Points sources contributed with about 16% total waterborne phosphorus load, and the share from sum of load from scattered dwellings and storm waters is more than 7%.
3.8.6 Trends in the export
Timeseries 1990-2020 of normalised waterborne total nitrogen and total phosphorus input and corresponding flow for Skjern River have been statistically tested for trend. Further, inputs have been divided in normalised diffuse and point source total nitrogen and total phosphorus inputs and tested for trends –results of both analyses are shown in the plots below. The methodology for testing for trends is described in Larsen & Svendsen, 2021.
For waterborne total nitrogen there is a statistically significant decrease from 1990 to 2020, with a breakpoint in 2000. From 1990 to 2000 total waterborne inputs decreased by 25%, from 2000 to 2020 by 22%, and by 41% since 1990. For waterborne total phosphorus there is a statistically significant decrease from 1990 to 2020, and the total reduction since 1990 is 30%.
For diffuse waterborne total nitrogen there is a statistically significant decrease from 1990 to 2020, with a break point in 2000. The reduction in diffuse total nitrogen inputs from 1990 to 2000 is 24%, from 2000 to 2020 17%, and since 1990 37%. There is also a statistically significant reduction in loads from points source. The reduction of 66% took place from 1990 to 2011; since 2011 there has been no significant reduction.
For diffuse waterborne total phosphorus there is a statistically significant increase from 1990 to 1995 with 100%, a break points in 1995 and 2015 with no trend from 1995 to 2015 and after 2015 no trend, but diffuse waterborne phosphorus being 13% lower than during 1995 to 2015. There is a statistically significant reduction in loads from points source with a break point in 1997. From 1990 to 1997 there is a 55% reduction and from 1997 to 2020 a 56% reduction, and total reduction since 1990 is 76%.
Figure 3.8.6: Total Nitrogen (3793 tonnes)
Figure 3.8.7: Total Phosphorus (91,7 tonnes)
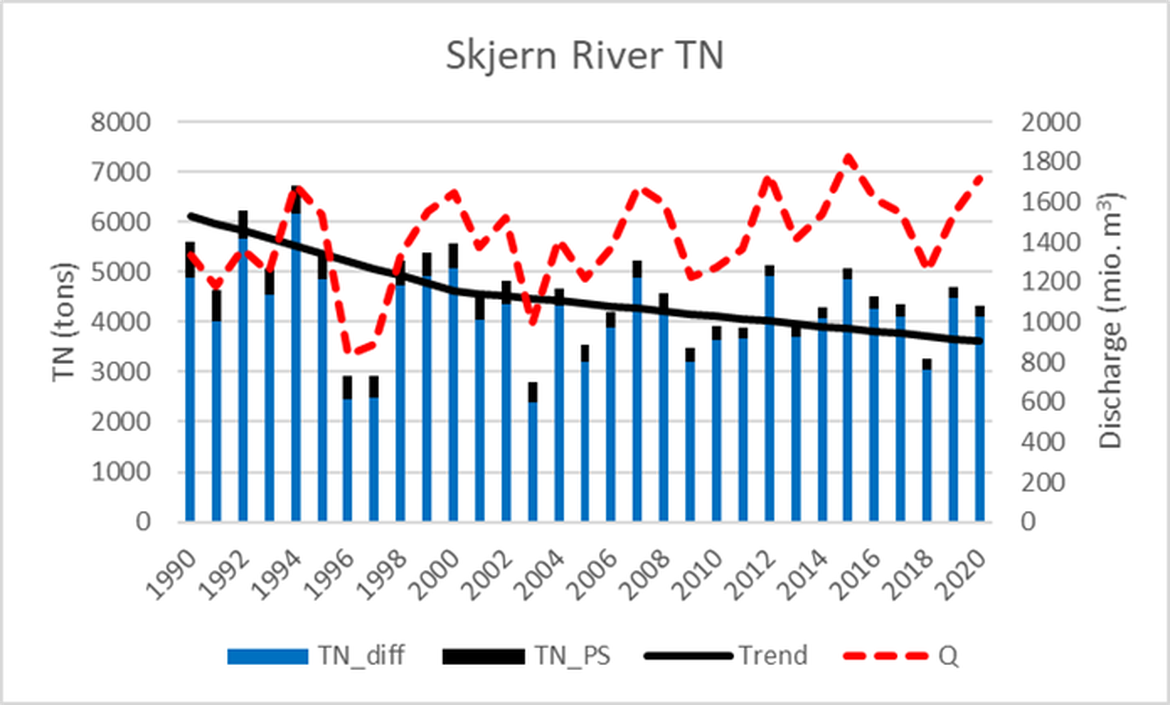
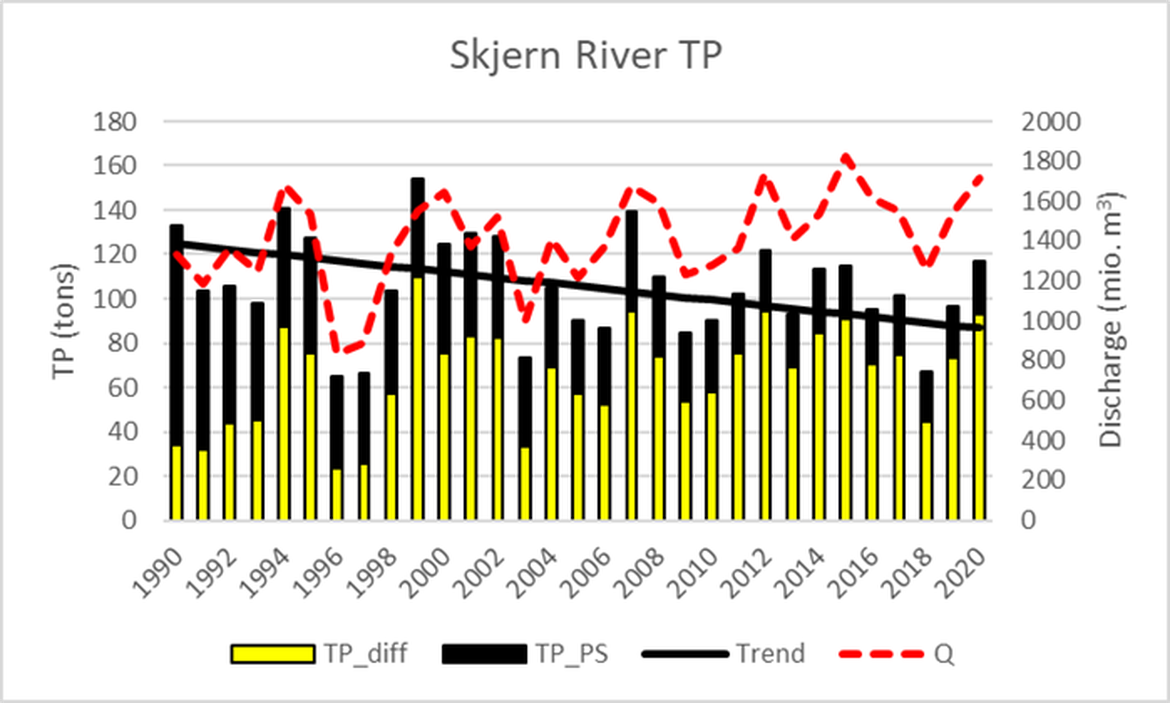
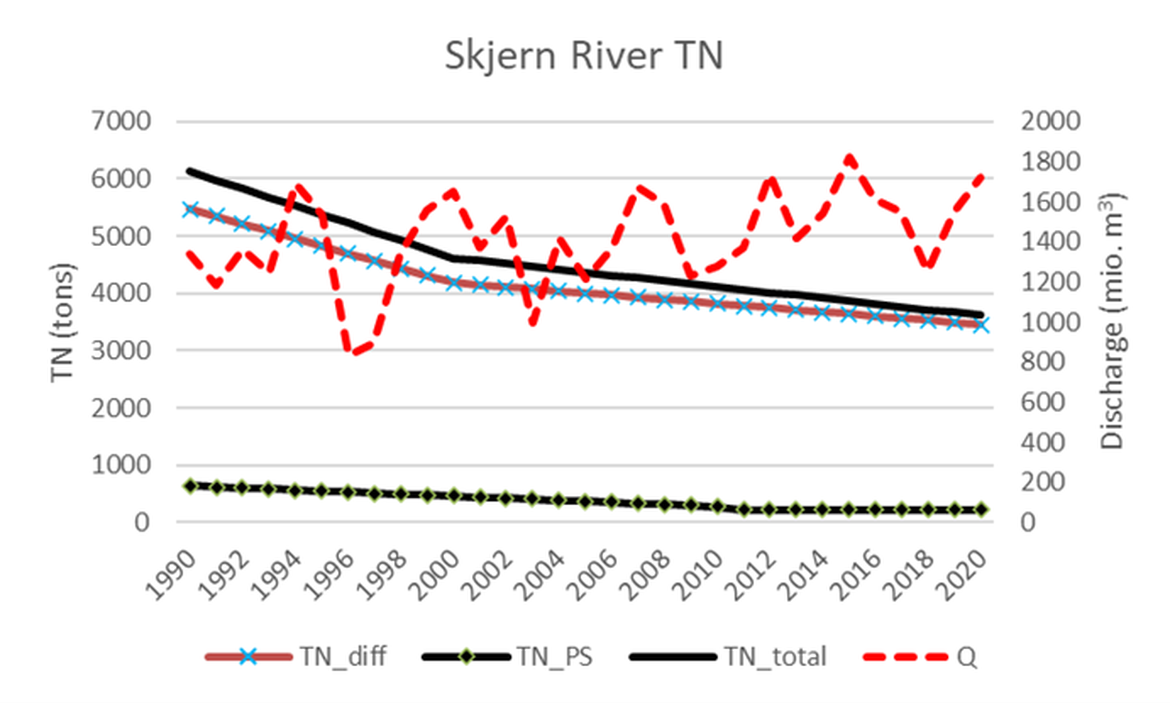
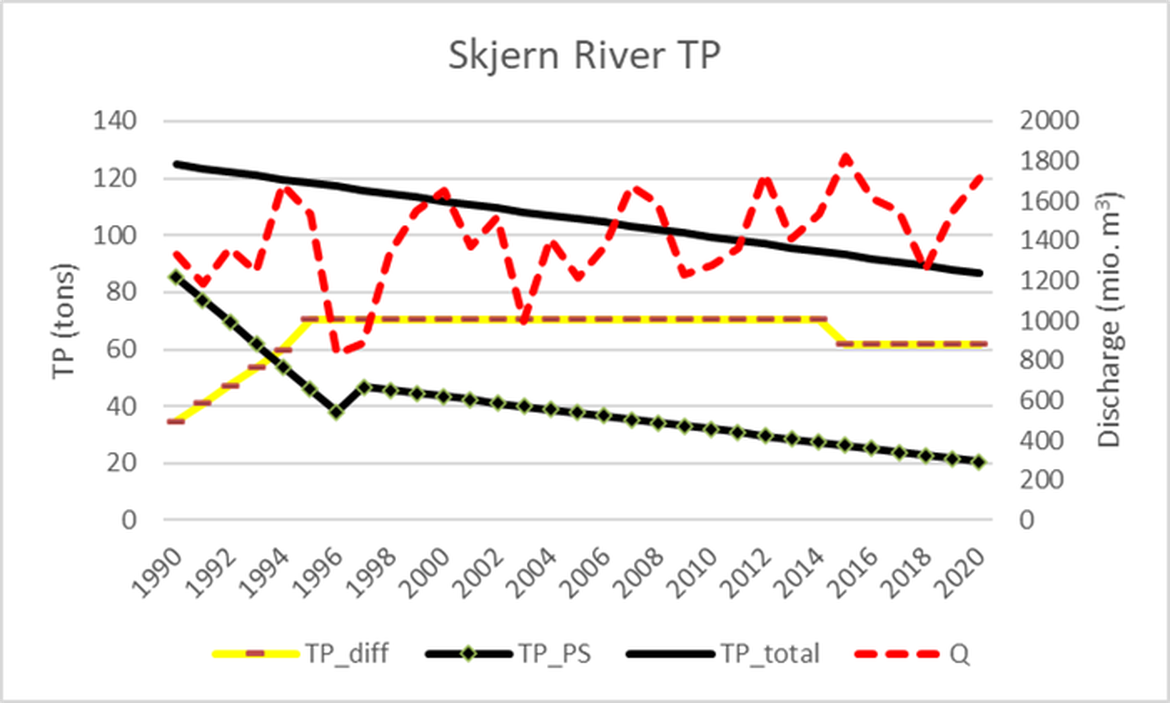
Figure 3.8.8: Normalised Total Nitrogen and Total Phosphorus input and corresponding flow for Skjern River 1990 - 2020
The annual variation in total nitrogen and total phosphorus inputs are overall related to weather conditions. High precipitation leads to higher flow and in years with high flow total waterborne nitrogen and phosphorus flow is high, and the opposite in years with low flow, as most of the nitrogen and phosphorus in Skjern River originates from diffuse sources. Flow was very low in 1997 and 1996 and 2004 resulting in low waterborne total nitrogen loads. In 2018 there was a severe drought with a rather bad harvest and e.g., nitrogen was accumulated in the soils. Autumn 2019 and winter 2019- 2020 was very wet with high flow in the Skjern River, and the accumulated nutrients in soils were leached to the river.
3.8.7 Measures
Several measures have been taken since 1989 in the catchment as a part of three Action Plans for the Aquatic Environment, Action Plan for Sustainable Agriculture, the dedicated Aquatic Environment and Nature Preservation initiative, Green Economic Growth, Economic Growth Programme for Foods, and River Basin Management Plans for 2009-20015 and 2016-2021. The measures have been related to waste water from municipal waste water treatment plants, industrial plants, aquaculture, and in recent years also for scattered dwellings. In addition, several measures have been taken regarding nitrogen emission to the air from agriculture.
The restoration of the lower part of the Skjern River in 1999-2003 with remeandering the rivers, reestablishing a delta, lakes and wet meadows and allowing flooding in part of the river valley has recreated some of the self-purification effect in the river. However, making former farmed soils with high organic contents wet also in a period after the remeandering resulted in some phosphorus release to the river.
3.8.8 What next?
River basin management plans 2021-2027 are at present in public hearing (Ministry of the Environment, 2021), but for the Skjern River watershed approximately a further 30% reduction of total nitrogen input to the sea is planned, including by taking mitigation measures such as taking soils out of cultivation, extensive of farming, afforestation, creation of wetland, cutting tiles, further measures on waste water, local targeted measures
The Danish Parliament decided in 2021 the CO2 and nitrogen reduction plan for agriculture with specific target mitigation measures.
3.9 Göta älv

Figure 3.9.1: Map showing the extent and land use in the Göta river basin

Figure 3.9.5: Time series of Total Nitrogen loads

Figure 3.9.2: Time series of Cadmium loads

Figure 3.9.3: Time series of Lead loads

Figure 3.9.4: Time series of Mercury loads

Figure 3.9.6: Time series of Total Phosphorus loads
3.9.1 Size and geography
The area of the Göta River’s drainage basin is 50 230 km2. Most of the catchment belongs to Sweden (85%) and represents about 10% of the total Swedish land area. However, the northernmost part of the river system is in Norway (Figure 3.9.1). Lake Vänern, the largest lake in Sweden and the third largest in Europe, has an important role in the nutrient transport in the catchment as it efficiently retains nutrients originating from its upstream catchments. The river divides into two river branches near the estuary leading into the North Sea. At least two thirds of the river volume runs through the northern branch: Nordre älv (Göta älvs vattenvårdsförbund 2015 ). The remainder joins the sea at the city of Göteborg (Gothenburg).
3.9.2 Population density
The population density is 21 inhabitants per km2 with Göteborg (1 million inhabitants with almost 600 000 in the city, WWTP as a direct discharge to the Sea), Karlstad (66 000 inhabitants), and Trollhättan (50 000 inhabitants) are the largest cities in the catchment.
3.9.3 Land use
The northern parts are pristine, whereas the human impact is most evident in the southern parts of the catchment. More than 50% of land use is forested areas, especially in the northern part (Sonesten, 2004). Arable land is mainly found in the south-eastern part, as well as in the lower reaches of the catchment areas running into Lake Vänern. Also, the areas beyond the outlet of Lake Vänern have a notable amount of arable land.
3.9.4 Use of the river
The southern branch passes through the city of Gothenburg providing more than 700 000 people with drinking water. The Göta River is used as a shipping channel and allows for transport of goods both in the upstream and downstream direction. The total fall in height between lake Vänern and the sea is 44 metres. This is used for producing hydropower through a highly regulated water flow in several water power plants, corresponding to a total capacity of approximately 300 MW.
3.9.5 Point and diffuse sources
The Göta River is a recipient for waste water from various industries, sewage treatment plants and individual sewers as well as storm water from urban areas and nutrient input from agriculture in the valley. Natural background leaching was the main source of nitrogen (37%) of the Göta River in 2017, whereas agriculture comprised the largest proportion (36%) of the phosphorus load followed by natural leaching (Figure 3.9.7 and Figure 3.9.8). Besides agriculture, atmospheric deposition was an important contributor to the nitrogen loads. Point sources contributed with 13% of TN load and 8% of the TP load respectively.
Figure 3.9.7: Nitrogen loads exported by the Göta River in 2017 divided into load sources
Figure 3.9.8: Phosphorus loads exported by the Göta River in 2017 divided into load sources
3.9.6 Trends in the export
In 2017 flow was less than 70% of the long-term average flow, which was reflected in the low N export (7 300 t) and P export (217 t). N export was only half of the long-term average export and P export 62%, respectively. In 2017 the area specific total nitrogen load was 145 kg/km2 and the mean total nitrogen concentration was 576 μg/l. The respective total phosphorus load was 4,3 kg/km2 and the mean concentration was 17 μg/l. Total nitrogen loads dropped in 2002 and have been decreasing after that. In fact, the total nitrogen load has been decreasing since the mid-1980s. This is a general tendency for nitrogen transport in different parts of the river system as well as for the nitrogen levels in Lake Vänern. The reduced nitrogen levels in the system are due to reduced inputs of nitrogen from point sources (Christensen et al., 2002) including nitrogen removal from waste water treatment plants, and also from diffuse nitrogen sources. Total phosphorus loads do not show any statistically significant changes. There was a better correlation between flow and total nitrogen load than between flow and total phosphorus load, indicating that nitrogen is more easily leached from soils into freshwaters during rain events.
The weather normalised metal inputs via Göta älv have been on rather even levels the last two decades, after slightly higher levels in the late 1990s. A contributing factor for the lower inter-annual variability during the last 15-20 years is a changed regulation of the upstream Lake Vänern, Sweden’s and the EU’s largest lake. This change is due to heavy flooding of the lake shores due to heavy rainfalls in 2000.
3.9.7 Measures
Already accomplished actions to reduce the nutrient inputs to the river system, as well as to the sea, are constant development of MWWTPs, agricultural measures, reduced industrial emissions, remedial measures of soils at old industrial sites as well as old waste dump sites and petrol stations (VISS, VattenInformationsSystem för Sverige). Identifying the vast and combined measures that have been developed over a considerable number of years is quite hard. For instance, MWWTs started in the early 1970s and have been more or less constantly improved with e.g., the addition of improved nitrogen removal at Ryaverken, the largest MWWTP in Gothenburg with about 700 000 persons connected from 2013 (Göta älvs vattenvårdsförbund 2015).
Planned measures within the WFD management plans are to reduce nutrient inputs within the catchment area to a large extent focused on reducing the number of scattered dwellings mainly by connections to MWWTs. This measure is already partly accomplished, but increased efforts are planned (VISS). In addition, potential future measures include reducing soil erosion as the lower stretches of the river system is very prone to erosion and even landslides, agricultural measures like buffer zones, as well as stormflow prevention. An additional combined measure mentioned is to construct wetlands that may reduce the impact from e.g., agriculture and/or stormflow inputs.
3.9.8 What next?
The proposed regional water management plan notes that problems in the catchment are a microcosm of national water management issues. The catchment is characterised by well drained, productive agricultural soils. These cause a lack of nutrient and water retention with problems likely to be exacerbated by climate change. The management plan seeks to achieve a balance between agricultural productivity and wetland restoration for biodiversity and climate resilience. These measures to retain water in the catchment also protect the urban centres downstream which are vulnerable to flooding. An additional challenge is to ensure that water retention methods don’t create further barriers to migratory fish. The lower reaches of the river are vulnerable to landslips associated with high flow and flood events. These potentially mobilise hazardous substances which occur both from historical industrial use but also from the natural characteristics of the regional geology. Successful adaptation to climate change and flooding is therefore key to reducing nutrient and hazardous substance inputs in this catchment.
3.10 Glomma

Figure 3.10.1: Map showing the extent and land use in the Glomma river basin

Figure 3.10.5: Time series of Total Nitrogen loads

Figure 3.10.2: Time series of Cadmium loads

Figure 3.10.3: Time series of Lead loads

Figure 3.10.4: Time series of Mercury loads

Figure 3.10.6: Time series of Total Phosphorus loads
3.10.1 Size and geography
The Glomma catchment is Norway’s largest, approximately 42 000 km2. It has two main branches, Glomma and Lågen/Vorma, and has Norway’s largest lake, Mjøsa, in its catchment. Other large lakes are Femunden and Øyeren. The catchment produces 8,7 % of Norway’s hydropower, with many hydropower stations, some of which are run-of-the-river plants.
3.10.2 Population density
Population density is 15 per km2. In the upper parts of the catchment there are large areas with few or no settlements. Smaller cities like Lillehammer, Hamar, Kongsvinger, and Lillestrøm are found in the middle of the catchment area. At the outlet, the two cities of Sarpsborg (where the monitoring station is located) and Fredrikstad are found.
3.10.3 Land use
About half of the catchment is covered by forests. In the north and west, there are mountain areas with bare rock or shallow moraine deposits, and some glaciers to the north-west. Agriculture is found in the lowlands and in the valleys along the main river stretches; in the south there is mainly grain production with some potato and vegetable fields, whereas grass production and animal husbandry dominate further north in the valleys.
3.10.4 Use of the river
Due to its size, there are many different uses of this river: Hydropower, forestry, agriculture, industry, fishing, tourism and recreation.
3.10.5 Point and diffuse sources
There are many point sources in this catchment, especially in or near the cities. Near the outlet there are several factories, some of these are downstream of the RID sampling station. Diffuse pollution stems from agriculture and scattered dwellings not connected to sewage systems. A recent study of tributaries to Lake Mjøsa, Norway’s largest lake, showed that nutrient inputs have increased in later years, causing increased eutrophication and risks of algae blooms. Untreated sewage and agriculture are the main causes of this.
Trends in direct discharges is shown in the figures below for total phosphorus (TP) and total nitrogen (TN). The figures are based on the entire Glomma River Basin District, which is slightly larger than the catchment of River Glomma.
Data are collected from the Norwegian TEOTIL Programme that feeds into the RID Programme. The overall trend is that nutrients from direct discharges have decreased since 1990. Both for phosphorus and nitrogen, this decline is mainly explained by a reduction from agriculture. For phosphorus, there is also a reduction from sewage and partly from industry. Unlike other regions in Norway, the Glomma River Basin has very few fish farms along the coastal areas.
 from direct discharges by source, for the entire Glomma River Basin Region. (Source: TEOTIL, www.niva.no)")
Figure 3.10.7: Total phosphorus (TP) from direct discharges by source, for the entire Glomma River Basin Region. (Source: TEOTIL, www.niva.no)
 from direct discharges by source, for the entire Glomma River Basin Region. (Source: TEOTIL, www.niva.no)")
Figure 3.10.8: Total nitrogen (TN) from direct discharges by source, for the entire Glomma River Basin Region. (Source: TEOTIL, www.niva.no)
3.10.6 Trends in the export
There is a statistically significant increasing trend of water flow since 1990 in this river. Similarly, there is an increase of total nitrogen loads (not flow normalised) and ortho-phosphate, but a decreasing trend in ammonia since 1990. Metal loads have declined since 1990, but no detectable changes have occurred the last 15 years, except for a downwards trend in copper loads since 2004.
The year 1998 had very high loads of some metals. This is due to one sample in November that year. The reason for the peak is not known, but the values have not been removed from the dataset since nothing wrong was detected in the analyses.
3.10.7 Measures
Several mitigation measures have been implemented both in sewage and agriculture the last two decades, following up the requirements in the EU WFD. In the new plan of measures (2022-2027), the highest investments in measures are within the sectors of sewage (7 000 million NOK) and agriculture (170 million NOK). Operation costs come in addition.
3.10.8 What next?
Recent studies indicate that more measures need to be carried out. In the proposed plan for 2022-2027 the River Basin District also points to the need for better economical and juridical incentives, amongst others for agricultural measures.
Climate change in this part of Norway is predicted to result in increased and more intense rains, that will increase soil erosion and river bank erosion. This, in addition to higher summer temperatures and less rain during summers can increase eutrophication and the risk of harmful algae blooms in the lakes and coastal areas.
Presently there is strong concern about the conditions in the Oslo Fjord, where the ecosystem is deteriorating rapidly. Nutrients from sewage (especially untreated nitrogen discharges) and agriculture are believed to be the main reasons.
4. Region III
4.1 Suir

Figure 4.1.1: Map showing the extent and land use in the Suir river basin

Figure 4.1.4: Time series of Mercury loads

Figure 4.1.6: Time series of Total Phosphorus loads

Figure 4.1.2: Time series of Cadmium loads

Figure 4.1.3: Time series of Lead loads

Figure 4.1.5: Time series of Total Nitrogen loads
4.1.1 Size and geography
The Suir catchment is in the south-east of Ireland and includes the area drained by the River Suir and all streams entering tidal water between Drumdowney and Cheekpoint, Co. Waterford. It drains a total area of 3 542 km². The largest urban centre in the catchment is Waterford City.
The geology of the Suir catchment is quite complex. Three units can be recognised: The uplands of the Slieve Felim, Galtee, Slievenamon, Knockmealdown and Comeragh mountains, which ring the catchment, are formed of Silurian and Devonian slates, greywackes and sandstones. The Slieve Ardagh hills, which lie on the catchment divide with the Nore, are formed of Upper Carboniferous sandstones, shales and coal measures. The remaining central areas, mostly lowlands, are almost entirely underlain by Lower Carboniferous limestones. The purer limestone formations are extensively karstified, particularly south of Cashel. Such karst areas are characterised by swallow holes, sinking streams, caves, and large karst springs.
4.1.2 Population density
The total population of the catchment is approximately 184 860 with a population density of 52 people per km².
4.1.3 Land use
Agriculture predominates in this catchment with 96% of landcover consisting of agricultural use.
4.1.4 Use of the river
The Suir river flows through the towns of Cahir, Clonmel and Carrick-on-Suir which is the tidal limit of the river. The estuary flows from here through Waterford city and the Port of Waterford before joining with the other ‘three-sisters’ rivers the Barrow and Nore. The Suir is an important river for angling and recreation.
4.1.5 Point and diffuse sources
Excess nutrients remain the most prevalent issue in the Suir Catchment. The number of waterbodies with nutrients issues have increased by 36 from 55 to 91 between the latest WFD assessment cycles. The number of waterbodies impacted by organic pollution has increased by 13 from 20 to 33.
The EPA has developed Source Load Apportionment Models (SLAM) for both P and N (Mockler et al., 2017) which estimate the proportion of the phosphorus and nitrogen inputs, respectively, to waters in each catchment that comes from each sector.
In the catchment, pasture and arable land is responsible for 84% and 9% of the nitrogen load respectively while land in pasture, discharges from urban waste water and forestry contribute 33%, 32% and 14% of the phosphorus loadings for the catchment respectively.

Figure 4.1.7: Significant Issues across all At Risk WBs in the Suir catchment between WFD Cycle 2 and Cycle 3

Figure 4.1.8: Estimated proportions of N & P from each sector in the Suir Catchment
4.1.6 Trends in the export
Large decreases in TP have been observed from a high in the 1990s. This decrease continued to 2010-2012 but a significant increase has been seen since then. Significant increases in TN since 2010 have also been seen in this catchment.
There is a gap in the flow data for 2007 which causes an anomalous dip in the normalised inputs.
4.1.7 Measures
An assessment was undertaken to determine if nitrogen reductions in rivers, streams and lakes are required for Transitional and Coastal (TRACs) waterbodies to achieve their WFD environmental objective. The outcome of the assessment indicated that 13 catchments of the 18 catchments with Ireland’s long established OSPAR monitoring stations have elevated nitrogen concentrations and are key catchments of concern requiring N reductions. The assessment report can be found at : https://www.catchments.ie/assessment-of-the-catchments-that-need-reductions-in-nitrogen-concentrations-to-achieve-water-quality-objectives.
The estimated N reduction required in the Suir Catchment is considered to be high at around 750 t N/y.
Measures to reduce inputs are identified in the Draft River Basin Management Plan for Ireland 2022 – 2027. Management measures are required to protect and restore natural waters. These measures are many and diverse. They include the implementation of eleven existing EU Directives such as the Nitrates Directive and the Urban Waste Water Treatment Directive. Specific supplementary programmes for addressing elevated inputs will also be addressed and it is recognised that reducing excessive nitrate losses from high-risk free draining soils to in agriculturally intensive areas (reduce N losses by up to 50% to water) are needed.
5. Region IV
5.1 Guadalquivir

Figure 5.1.1: Map showing the extent and land use in the Guadalquivir river basin

Figure 5.1.3: Time series of Lead loads

Figure 5.1.5: Time series of Total Nitrogen loads

Figure 5.1.2: Time series of Cadmium loads

Figure 5.1.4: Time series of Mercury loads

Figure 5.1.6: Time series of Total Phosphorus loads
5.1.1 Size and geography
The Guadalquivir Catchment is approximately 57 000 km2. The highest peak of the Iberian Peninsula, Mulhacén, with 3 478 m of altitude, is located in this catchment. In contrast, the Guadalquivir wide valley has a low altitude, being navigable for 90 of the 657 km of the river, until Seville. This lower part of the basin has wide areas of marshes and a strip of dunes up to 10 km wide (Doñana).
")
Figure 5.1.7: Cargo ships and cruise ships sailing on the Guadalquivir (Autoridad Portuaria de Sevilla CC BY-NC-ND 4.0)
. (Banco Audiovisual de la Junta de Andalucía CC BY-NC-ND 4.0)")
Figure 5.1.8: La Puebla del Rio (Sevilla). (Banco Audiovisual de la Junta de Andalucía CC BY-NC-ND 4.0)
5.1.2 Population density
18% of the Spanish population lives in this river basin, with a population density of 75 inhabitants/km2. 44 municipalities are completely included in the catchment, and another 110 are partially included. Cordoba and Seville are the largest cities on the banks of the Guadalquivir River; Granada is also included in this catchment.
5.1.3 Land use
The different characteristics of this territory in climate, relief, latitudinal position, lithology and types of soils determine, to a large extent, the potential distribution of vegetation and, together with the human activities, the landscapes. About half of the catchment is dedicated to agriculture, - olive trees, fruit trees, cereals, grapevines and, in the lowlands, rice the most important crops. In the mountains there are also areas with bare rock or Mediterranean forests. Mining and quarrying are also present in the catchment.
. (Banco Audiovisual de la Junta de Andalucía CC BY-NC-ND 4.0)")
Figure 5.1.9: Olive groves in Luque (Córdoba). (Banco Audiovisual de la Junta de Andalucía CC BY-NC-ND 4.0)
")
Figure 5.1.10: Irrigated crops and rice in the Guadalquivir marshes (Banco Audiovisual de la Junta de Andalucía CC BY-NC-ND 4.0)
5.1.4 Use of the river
The Guadalquivir River and basin are highly regulated. The economic activity with the highest water requirement is agriculture, accounting for around 85% of consumptive use of available water stored in reservoirs. Industry and population represent the remaining 15%. Hydropower is also present in this catchment. Commercial navigation is an important usage in the lower part of the river.
5.1.5 Point and diffuse sources
Agriculture, mining and farming are the main activities contributing to diffuse pollution. The use of fertilisers is one of the main causes of eutrophication in this catchment and pesticides also lead to a few instances of non-compliance with the Water Framework Directive. Regarding the point sources, urban discharges are the most important, although industrial discharges are also present.
5.1.6 Trends in the export
It is difficult to establish trends in this catchment as there is no data for all recent years and for those years with data, this does not always cover the full catchment. Tributaries Guadaira and Guadiamar flow into the estuary directly, with loads similar to those of Guadalquivir or even higher for total phosphorous or zinc for example. Information for these tributaries is not always available, and when it is, a peak is observed but that is mostly related to availability of data rather than changes in loads.
The contribution of metals from the Guadalquivir Basin comes fundamentally from the mining activity of the Aznalcóllar Mines and from the geology of the Guadalquivir Basin itself.
The breakage of the Aznalcóllar mines pond in 1998 caused a significant environmental damage to the Guadiamar River. A total of 5 million m3 of toxic sludge and almost 2 million m3 of acidic water were spilled, contaminating 62 km of the river, which explains the increase in pollution in that year. Despite the development of mitigation measures, specific problems of contamination by heavy metals are observed, especially in areas near the mine. This may be due to the runoff that carries pollutants from the dumps, which still exist.
On the other hand, in the Guadalquivir Basin, from 2009 to 2014 there was no control of the qualitative status of surface water masses, which is a limitation to calculate trends.
5.1.7 Measures
In general, Spain has a significant problem with urban discharges and with the delay in the materialisation of the basic sanitation and purification measures that are necessary. Diffuse pollution is also a relevant problem in the Guadalquivir catchment, due to its agricultural and livestock tradition. The next WFD measures plan from 2022-2027 includes various actions to address both issues.
5.1.8 What next?
The National Plan for Purification, Sanitation, Efficiency, Savings and Reuse (DSEAR Plan) aims to review the intervention strategies defined in the River Basin Management Plans 2015-2021, relating to the purification, sanitation and reuse, facing the River Basin Management Plans 2022-2027.
The fight against climate change is a challenge that has to mark the management of water resources. The National Climate Change Adaptation Plan (PNACC) 2021-2030 is the reference framework for public efforts to generate knowledge and build adaptive responses to climate change in Spain. Among the defined work areas, it includes one dedicated to water and water resources.
5.2 Guadiana

Figure 5.2.1: Map showing the extent and land use in the Guadiana river basin

Figure 5.2.3: Time series of Lead loads

Figure 5.2.5: Time series of Total Nitrogen loads

Figure 5.2.2: Time series of Cadmium loads

Figure 5.2.4: Time series of Mercury loads

Figure 5.2.6: Time series of Total Phosphorus loads
5.2.1 Size and geography
The Guadiana River basin is an international basin that extends for territories of Spain and Portugal in the south of the Iberian Peninsula. This watershed has a total area of 67 174 km2 and an estimated river length of 852 km. Most of the catchment is located in Spain, 82.7 % (an area of 55 554 km2), and the remanent 17,3% (11 620 km2) are in Portugal. The Guadiana River rises in the Ruidera lagoons, in Spain, at an altitude of 868 m and flows through the Guadiana estuary into the Atlantic Ocean.
")
Figure 5.2.7: Guadiana river (© Confederación Hidrográfica del Guadiana, 2014)
 (©Confederación Hidrográfica del Guadiana, 2021)")
Figure 5.2.8: Irrigated vineyards (drip irrigation) (©Confederación Hidrográfica del Guadiana, 2021)
The river delimits the border between Spain and Portugal for 110 km. The average altitude of the Spanish basin is about 550 m, being the highest peak the Pico de Villuercas of 1 601 m, in Extremadura. The lower slopes are found in the La Mancha plain, which favours the existence of humid areas, very vulnerable to variations in climate, both seasonally and annually.
5.2.2 Population density
Almost 1.5 million people live in the Spanish part of the catchment (2019) distributed in 399 municipalities (333 completely within the basin), which means a population density of 25,6 inhabitants/km2. There are 12 municipalities with more than 20 000 inhabitants, the most important being Badajoz (150 543 inhabitants) and Ciudad Real (74 641 inhabitants). A total of 236 600 inhabitants (2,4% of population) lives in the Portuguese part of the catchment distributed in 32 municipalities (10 completely within the basin), the most important cities being Évora and Beja (not completely included in the river basin, 86 000 inhabitants). Population density is 20 inhabitants/km2.
5.2.3 Land use
In Spain, the main use is agrarian, being extensively agriculture predominant and mainly dedicated to the cultivation of cereals, grapevines, fruit trees and olive trees and, in the lowlands, rice. The Guadiana catchment has an important part of irrigated cultivation.
In Portugal, land use includes mainly agricultural areas (70% of land cover) and forests and semi-natural areas (27%). Water bodies and wetlands account for about 2% of land coverage while artificial surfaces, including urban fabric, represent 1% of land use.
5.2.4 Use of the river
In the Spanish part of the catchment, the human activity that requires the most water in this basin is crops irrigation, with an estimated demand of about 2 000 hm3/year, which is obtained from rivers, reservoirs and aquifers. Urban and industrial uses are also present. Regarding energy, currently there are no thermal power plants operating in the basin but there are 8 main hydroelectric power plants with an average annual production of about 130 GWh. Fishing is allowed in 23 areas, which extend over 417 km of rivers and 153,16 km2 of reservoirs.
There are 49 bathing sites, 35 inland and 14 in coastal waters. The estuary is navigable for different types of boats, including recreational, fishing and passenger boats. In Portugal, main water uses are irrigation of agricultural fields and drinking water supply. Hydroelectric production exists but to a lesser extent than in other parts of the country. Regarding surface water abstraction, agriculture accounts for about 91% of captured volumes and drinking water supply for about 8%. Other activities are negligible in this river basin in terms of surface water consumption.
5.2.5 Point diffuse sources
The main point sources of pollution are those derived from anthropic activity, both industrial and urban. In addition, the pressure due to mining activity in Spain is very important in certain areas of the demarcation. Others of lesser importance are dumps, rubbish dumps and contaminated soils. Agriculture and livestock are the main activities causing diffuse pollution, being both of comparable magnitude.
In the Portuguese part of the catchment, diffuse pollution accounts for most nitrogen and phosphorus sources. Livestock is the main source of nutrients (61% for nitrogen and 53% for phosphorus) followed by agriculture (36% for nitrogen and 31% for phosphorus). Main point sources include urban waste water discharges that represent 3% of nitrogen inputs and 16% of phosphorus inputs. Other activities are negligible in this river basin.
5.2.6 Trends in the export
Regarding nutrients, total nitrogen seems to show a downward trend in the last decade and lower loads in these years than previously. For total phosphorus, results seem to show a downward trend until 2012 and a slight increase in the later years. Regarding metals, results of the last decade show lower loads of cadmium and lead than previous years, although it is considered that data included in the 2003-2007 time series should be subject to validation.
Differences in the number of samples collected each year and data gaps can justify variations in calculations. There is a lack of data for direct discharges.
5.2.7 Measures
In general, Spain has a significant problem with urban discharges and with the delay in the materialisation of the basic sanitation and purification measures that are necessary. Diffuse pollution is also a general problem in the Guadiana catchment, due to its agricultural and livestock tradition. Almost 100% of the surface water bodies in the demarcation have pressures from agricultural uses. The next WFD measures plan from 2022-2027 includes various actions to address both issues. Under the WFD, Portugal has been working on the identification of pressures and impacts in order to define the necessary measures to achieve good status of water bodies. These measures can be corrective (aimed at correcting an existing problem) or preventive (aimed at preventing problems from occurring). The main measures defined in the River Basin Management Plans include the reduction of pollution by nutrients from agriculture and livestock, the improvement of sanitation systems, the reduction of waste water not connected to the drainage systems and the reduction of chemical pollution (priority substances and pesticides). According to the most recent assessment, 40% of the water bodies reach good status in this hydrographic region. 60% of water bodies are in a less than good condition, essentially due to biological quality elements and nutrient pollution.
5.2.8 What next?
The Spanish National Plan for Purification, Sanitation, Efficiency, Savings and Reuse (DSEAR Plan) aims to review the intervention strategies defined in the River Basin Management Plans 2015-2021, relating to the purification, sanitation and reuse, facing the River Basin Management Plans 2022-2027. The fight against climate change is a challenge that has to mark the management of water resources. The National Climate Change Adaptation Plan (PNACC) 2021-2030 is the reference framework for public efforts to generate knowledge and build adaptive responses to climate change in Spain. Among the defined work areas, it includes one dedicated to water and water resources. In Portugal, within the scope of the WFD, the country will continue to implement the program of measures foreseen in the RBMPs to reduce point and diffuse sources of pollution and achieve the good status of water bodies. As one of the European countries most vulnerable to the impacts of climate change, priorities are to continue adapting and mitigating the effects of climate variations namely regarding floods and droughts and water supply to populations.
5.3 Tejo / Tajo

Figure 5.3.1 Map showing the extent and land use in the Tagus river basin
5.3.1 Size and geography
The Tagus River basin is an international basin, located in the central area of the Iberian Peninsula, that extends for territories of Spain and Portugal. It has an area of 80 797 km2, of which 25 016 km2 (31%) are in Portuguese territory and 55 781 km2 (69%) in Spanish territory. The Tagus River rises in the Serra de Albarracín (Spain) at an altitude of around 1 600 m and has a length of 1 100 km, of which 230 km in Portugal and 43 km of international section. The Tagus basin is in an area characterised by a Mediterranean climate strongly continental with particularities related to altitude, latitude, and distance to the Atlantic Ocean. According to the IPCC, Mediterranean countries are expected to experience serious climate change with variations in precipitation, river flows and most likely increase in the intensity and frequency of droughts and floods.
5.3.2 Population density
More than 8 million Spanish live in the catchment (2019) distributed in 1 185 municipalities (869 completely within the basin), which means a population density of 140 inhabitants/km2. There are 10 municipalities with more than 100 000 inhabitants, the most important being Madrid and its region.
Almost 4 million people (39,8% of population) live in the Portuguese part of the catchment distributed in 103 municipalities (73 completely within the basin), the most important being the Lisbon metropolitan area (2 722 782 inhabitants). Population density is 142 inhabitants/km2.
")
Figure 5.3.7: Tagus river in Toledo (Jocelyn Erskine-Kellie, Wikipedia 2019 CC BY 2.0)
5.3.3 Land use
An important part of the Spanish Tagus River basin corresponds to forest mass, with an important representation of the land cover (50%), followed by cultivation areas, both rainfed and irrigated, scrub, grasslands and lands with little vegetation. In the Portuguese part of the catchment land use includes mainly forests and semi-natural areas (49% of land cover) and agricultural areas (46%). Artificial surfaces, including urban fabric, represent 3% of land use while water bodies and wetlands account for about 1% of land coverage.
5.3.4 Use of the river
The Tajo River and basin are highly regulated In Spain. The economic activity with the highest water requirement is agriculture, assuming around 57% of consumptive use of available water stored in reservoirs. The use for power generation and urban supply represents 21,2 % and 19,6% respectively. Industries not connected to municipal supply networks represent 1,5%, being 0,8% intended for other uses.
Main water uses in Portugal are hydroelectric production, irrigation of agricultural fields and drinking water supply. Regarding surface water abstraction, agriculture accounts for about 60% of captured volumes, drinking water supply for about 26% and industry for 13%, while tourism and other activities represent less than 1% of water consumption in this watershed. Other water uses include bathing waters and leisure activities. Navigation is also important, mainly in the Tagus estuary.
5.3.5 Point and diffuse sources
Agriculture and livestock are the main activities contributing to diffuse pollution in the Spanish Tagus River basin. The use of fertilisers is one of the main causes of eutrophication in this catchment along with the contribution of nitrogenous elements in the form of manure. Regarding the point sources, urban discharges is the most important one, although industrial discharges are also present. In the Portuguese part of the catchment, diffuse pollution accounts for most nitrogen and phosphorus sources. Livestock is the main source of nutrients (62% for nitrogen and 72% for phosphorus) followed by agriculture (18% for nitrogen and 14% for phosphorus). Main point sources include urban waste water discharges that represent 19% of nitrogen inputs and 11% of phosphorus inputs. Food and wine industry account for 0,46% of nitrogen inputs and 2% of phosphorus inputs. Other activities (e.g., tourism, landfill) represent less than 1% of pollution sources in this river basin.
5.3.6 Trends in the export
Gaps in the data series do not allow for the description of trends in metals and nutrients. According to information from the River Basin Management Plans, agriculture and livestock are the main sources of nutrient loads to the river basin. Regarding metals, zinc has the higher loads to the watershed. Main activities contributing to metal loads are paper industry, textile manufacturing, mining, manufacturing of metallic products, metallurgical industries, and manufacture of chemical and synthetic products.
Gaps in the data series do not allow for the analysis of peaks and anomalies.
5.3.7 Measures
In general, Spain has a significant problem with urban discharges and with the delay in the materialisation of the basic sanitation and purification measures that are necessary. Diffuse pollution is also a general problem in the Tagus catchment. The next WFD measures plan from 2022-2027 includes various actions to address both issues. Under the WFD, Portugal has been working on the identification of pressures and impacts in order to define the necessary measures to achieve good status of water bodies. These measures can be corrective (aimed at correcting an existing problem) or preventive (aimed at preventing problems from occurring). The main measures defined in the River
Basin Management Plans include the reduction of pollution by nutrients from agriculture and livestock, the improvement of sanitation systems, the reduction of waste water not connected to the drainage systems and the reduction of chemical pollution (priority substances and pesticides). According to the most recent assessment, 40% of the water bodies reach good status in this hydrographic region. 60% of water bodies are in a less than good condition, essentially due to biological quality elements and nutrient pollution.
5.3.8 What next?
In Spain, the National Plan for Purification, Sanitation, Efficiency, Savings and Reuse (DSEAR Plan) aims to review the intervention strategies defined in the River Basin Management Plans 2015-2021, relating to the purification, sanitation and reuse, facing the River Basin Management Plans 2022-2027. On the other hand, the fight against climate change is a challenge that has to mark the management of water resources. The National Climate Change Adaptation Plan (PNACC) 2021-2030 is the reference framework for public efforts to generate knowledge and build adaptive responses to climate change in Spain. Among the defined work areas, one is dedicated to water and water resources. Within the scope of the WFD, Portugal will continue to implement the programme of measures foreseen in the RBMPs to reduce point and diffuse sources of pollution and achieve the good status of water bodies. As one of the European countries most vulnerable to the impacts of climate change, priorities are to continue adapting and mitigating the effects of climate variations namely regarding floods and droughts and water supply to populations.
")
Figure 5.3.8: Mofragüe Biosphere Reserve in Extremadura (Alejandro Rodríguez Villalobos, Public Domain)
5.4 Douro / Duero

Figure 5.4.1: Map showing the extent and land use in the Douro river basin
5.4.1 Size and geography
The Douro River basin is an international basin that extends over territories of Spain and Portugal. It has an area of 97 603 km2, of which 18 643 km2 (19,1%) are in Portuguese territory and 78 960 km2 (80,9%) in Spanish territory. The Douro River rises in the Serra de Urbion (Spain), at an altitude of around 1 700 m, and flows through the Douro estuary into the Atlantic Ocean, in Oporto city. The river has a length of 927 km, of which 597 km in Spain, 208 km in Portugal and 122 km of international section. It is the largest watershed in the Iberian Peninsula. Due to its size, this river basin is characterised by wide climatic (depending on altitude, latitude, and distance to the Atlantic Ocean) and morphological variations.
5.4.2 Population density
The population of the Spanish part of the catchment is 2,2 million inhabitants (2019), distributed in almost 2000 municipalities, which means a population density of 26,87 inhabitants/km2.
More than 52% of them live in 14 municipalities with more than 20 000 inhabitants, the most important being Valladolid. The rest of the population is distributed in a more homogeneous way in the territory.
Almost 1,9 million inhabitants (18,8% of population) lives in the Portuguese part of the catchment distributed in 74 municipalities (47 completely within the basin), the most important being the Oporto metropolitan area (941 202 inhabitants). Population density is 98 inhabitants/km2.
5.4.3 Land use
In Spain, it is estimated that roughly 44% of the catchment is covered by natural vegetation, including forest trees, scrub, grasslands and meadows. On the other hand, 47% corresponds to rainfed crops and roughly 7% is covered by irrigated land. In Portugal, land use includes mainly forests and semi-natural areas (49% of land cover) and agricultural areas (48%). Artificial surfaces, including urban fabric, represent 3% of land use while water bodies and wetlands account for about 1% of land coverage.
")
Figure 5.4.7: Agriculture and shrubs in Castilla y León (Nicolás Pérez, CC BY-SA 3.0)
")
Figure 5.4.8: Douro/Duero Internacional (Pedro Nuno Caetano, CC BY 2.0)
5.4.4 Use of the river
The uses of waters in the Spanish part of the catchment include supplying the population, irrigation and agricultural uses, industrial uses for production of electrical energy, with 180 hydroelectric power production plants, other industrial uses and recreational uses. Main water uses in Portugal are hydroelectric production, drinking water supply and irrigation of agricultural fields. Regarding surface water abstraction, drinking water supply and agriculture account for 98% of captured volumes (around 49% each) while industry, tourism and other activities represent less than 2% of water consumption in this watershed. Water uses also include bathing waters and other leisure activities. Navigation is also important in the River Douro.
5.4.5 Point and diffuse sources
The main activities causing diffuse pollution in the Spanish part of the catchment are agriculture and livestock, due to surplus chemical fertilisation and the contribution of nitrogenous elements in the form of manure. The main point sources are related to sewage discharges from urban waste water treatment plants and untreated waters. In the Portuguese part of the catchment, diffuse pollution accounts for most nitrogen and phosphorus sources. Livestock is the main source of nutrients (45% for nitrogen and 54% for phosphorus) followed by agriculture (41% for nitrogen and 31% for phosphorus). Main point sources include urban waste water discharges that represent 14% of both nitrogen and phosphorus inputs. Industry, tourism, aquaculture and other activities represent less than 1% of nutrient sources in this river basin.
5.4.6 Trends in the export
Gaps in the data series do not allow for analysis before 2010. In the last years, results from both metal and nutrient loads seem to show a downward trend. Currently, main sources of nutrient loads to the river basin are agriculture and livestock. Regarding metals, zinc has the higher loads to the watershed. Main activities contributing to metal loads are waste water discharges, manufacturing of machinery and equipment and manufacturing industry.
Peaks and anomalies may be related to flow variations reflecting periods of drought or heavy rainfall. Also, differences in the number of samples collected each year and data gaps can justify variations in calculations.
5.4.7 Measures
In general, Spain has a significant problem with urban discharges and with the delay in the materialisation of the basic sanitation and purification measures that are necessary. Diffuse pollution is also a general problem in the Tagus catchment. The next WFD measures plan from 2022-2027 includes various actions to address both issues. Under the WFD, Portugal has been working on the identification of pressures and impacts in order to define the necessary measures to achieve good status of water bodies. These measures can be corrective (aimed at correcting an existing problem) or preventive (aimed at preventing problems from occurring). The main measures defined in the River Basin Management Plans include the reduction of pollution by nutrients from agriculture and livestock, the improvement of sanitation systems, the reduction of waste water not connected to the drainage systems and the reduction of chemical pollution (priority substances and pesticides). According to the most recent assessment, 52% of the water bodies reach good status in this hydrographic region. 47% of water bodies are in a less than good condition, essentially due to biological quality elements and nutrient pollution. Less than 1% of water bodies are in an unknown state.
5.4.8 What next?
In Spain, the National Plan for Purification, Sanitation, Efficiency, Savings and Reuse (DSEAR Plan) aims to review the intervention strategies defined in the River Basin Management Plans 2015-2021, relating to the purification, sanitation and reuse, facing the River Basin Management Plans 2022-2027. On the other hand, the fight against climate change is a challenge that has to mark the management of water resources. The National Climate Change Adaptation Plan (PNACC) 2021-2030 is the reference framework for public efforts to generate knowledge and build adaptive responses to climate change in Spain. Among the defined work areas, one is dedicated to water and water resources. Within the scope of the WFD, Portugal will continue to implement the programme of measures foreseen in the RBMPs to reduce point and diffuse sources of pollution and achieve the good status of water bodies. As one of the European countries most vulnerable to the impacts of climate change, priorities are to continue adapting and mitigating the effects of climate variations namely regarding floods and droughts and water supply to populations.
5.5 Miño / Minho

Figure 5.5.1: Map showing the extent and land use in the Miño river basin
5.5.1 Size and geography
The Miño River basin is an international basin that extends for territories of Spain and Portugal. The international hydrographic basin of the Miño rivers covers an area of 17 072 km², being the surface of the Spanish part 16 257 km2 (95,3%) and the surface of the Portuguese part 814,45 km² (4,7%). The Miño River rises in the Serra de Meira (Spain), at an altitude of around 700 m, and flows through the Minho estuary into the Atlantic Ocean. The river has a length of 300 km, of which 230 km in Spain and 70 km of international section, delimiting the border between Spain and Portugal. The territory of the Miño catchment is characterised by a great variety of landscapes supported by a complex relief structure: mountains, valleys and coastline.
5.5.2 Population density
The population of the Spanish part of the catchment is 795 407 inhabitants (2018). More than 50% of them live in ten cities, the largest of which are Orense and Lugo. The rest of the population is distributed in a more homogeneous way in the territory. The basin has 12 354 population centres of which 11 591 have less than 100 inhabitants. It is, therefore, a catchment with great population dispersion. Population density is about 45 inhabitants/km2. A total of 273 816 people (2,8% of population) live in the Portuguese part of the catchment distributed in 15 municipalities (10 completely within the basin), the largest is Viana do Castelo (84 636 inhabitants). Population density is 114 inhabitants/km2.
5.5.3 Land use
In Spain, areas of forest trees, scrubland and scrub are predominant, with a representation of 54%, followed by cultivation areas, grasslands and lands with little or no vegetation (41%). The remaining 5% is urban land, land dedicated to infrastructures and land dedicated to the different production sectors. In Portugal, land use includes mainly forests and semi-natural areas (65% of land cover) and agricultural areas (29%). Artificial surfaces, including urban fabric, represent 5% of land use while water bodies and wetlands account for about 2% of land coverage.
5.5.4 Use of the river
The uses of waters in Spain include supplying the population, irrigation and agricultural uses, industrial uses for production of electrical energy, other industrial uses, aquaculture, recreational uses, navigation and water transport. In Portugal, main water uses are hydroelectric production, industry, irrigation of agricultural fields and drinking water supply. Regarding surface water abstraction, industry (including aquaculture) accounts for about 73% of captured volumes, agriculture for about 16% and drinking water supply for about 11%. Other activities are negligible in this river basin in terms of surface water consumption.
")
Figure 5.5.7: O Cabo do Mundo (Beatriz Sánchez Fernández)
")
Figure 5.5.8: Canyon of the Sil River from the Cabezoas (SanchoPanzaXXI, CC BY-SA 3.0)
5.5.5 Point and diffuse sources
In Spain, urban sewage discharges and surpluses from chemical fertilisation with agricultural origin and the contribution of nitrogenous elements from manure, are causing pollution in this catchment. Mines, some of them abandoned, and extraction of aggregates are present too, but in located sites of the Sil catchment and in the Lower Miño. In Portugal, diffuse pollution accounts for most nitrogen and phosphorus sources. Livestock is the main source of nutrients (44% for nitrogen and 53% for phosphorus) followed by agriculture (37% for nitrogen and 22% for phosphorus). Main point sources include urban waste water discharges that represent 13% of nitrogen inputs and 19% of phosphorus inputs. Aquaculture represents about 5% of both nitrogen and phosphorus sources and transforming industry 0,4% of nitrogen inputs and 1,4% of phosphorus inputs. Other activities are negligible in this river basin.
5.5.6 Trends in the export
Regarding nutrients, total nitrogen and total phosphorus show lower loads in the last decade than the previous years. Likewise, results after 2010 show lower loads of metals than previous years.
In Spain, there are two control points, one located on the Miño river and another on a tributary of the river (Louro river). The flow of the Miño river is high enough so that its variations do not significantly affect the pollutant loads shown. However, in the case of the Louro river, which crosses an industrially pressured area, the alterations in flow due to periods of drought or flooding would justify peaks in the pollutant loads shown.
5.5.7 Measures
In general, Spain has a significant problem with urban discharges and with the delay in the materialisation of the basic sanitation and purification measures that are necessary. Diffuse pollution is also a problem in the Miño catchment, due to the presence of agricultural and livestock areas. The next WFD measures plan from 2022-2027 includes various actions to address both issues. Under the WFD, Portugal has been working on the identification of pressures and impacts in order to define the necessary measures to achieve good status of water bodies. These measures can be corrective (aimed at correcting an existing problem) or preventive (aimed at preventing problems from occurring). The main measures defined in the River Basin Management Plans include the reduction of pollution by nutrients from agriculture and livestock, the improvement of sanitation systems, the reduction of waste water not connected to the drainage systems and the reduction of chemical pollution (priority substances and pesticides). According to the most recent assessment, 65% of the water bodies reach good status in this hydrographic region. 35% of water bodies are in a less than good condition, essentially due to biological quality elements and nutrient pollution.
5.5.8 What next?
The Spanish National Plan for Purification, Sanitation, Efficiency, Savings and Reuse (DSEAR Plan) aims to review the intervention strategies defined in the River Basin Management Plans 2015-2021, relating to the purification, sanitation and reuse, facing the River Basin Management Plans 2022-2027. The fight against climate change is a challenge that has to mark the management of water resources. The National Climate Change Adaptation Plan (PNACC) 2021-2030 is the reference framework for public efforts to generate knowledge and build adaptive responses to climate change in Spain. Among the defined work areas, it includes one dedicated to water and water resources. In Portugal, within the scope of the WFD, the country will continue to implement the programme of measures foreseen in the RBMPs to reduce point and diffuse sources of pollution and achieve the good status of water bodies. As one of the European countries most vulnerable to the impacts of climate change, priorities are to continue adapting and mitigating the effects of climate variations namely regarding floods and droughts and water supply to populations.
5.6 Garonne / Garona and Dordogne

Figure 5.6.1: Map showing the extent and land use in the Garonne river basin
5.6.1 Size and geography
The catchment area of the Garonne is 56 000 km2 and that of the Dordogne is 24 000 km2. The Garonne is a 575 km long river which rises in the Spanish central Pyrenees while the Dordogne is a 483 km long river that rises in the Massif Central. The Dordogne and Garonne rivers flow into the Atlantic Ocean through the Gironde estuary (75 km long), where they meet.
5.6.2 Population density
The Garonne and Dordogne river basins have a population of approximately 5,5 million inhabitants. They are predominantly rural basins with an average density of 67 inhabitants/km2. The majority of the inhabitants (more than 3 million) are concentrated along the Garonne between the cities of Toulouse and Bordeaux.
5.6.3 Land use
The Garonne and Dordogne river basins are covered by crops and meadows (50%), forests (30%), other natural areas (10%), aquatic environments (1%) and artificial land (6%).
However, there is a strong disparity of land use and occupation in this territory: forests in the Pyrenees and Massif Central, intensive cultivation in the Garonne basin in particular, vineyards in the Bordeaux region and urban areas developed around Bordeaux and Toulouse. It is also a territory with a remarkable natural heritage with numerous wetlands.
The industries are mainly concentrated around the two metropolises (Bordeaux and Toulouse).
5.6.4 Use of the river
The Garonne and the Dordogne are used for drinking water production, irrigation, hydroelectricity, industry, navigation, tourism and leisure.
The Canal du Midi and the Canal de Garonne allow pleasure boating between the Atlantic Ocean and the Mediterranean Sea.
In addition, many transverse structures (weirs and dams) are built on these two rivers or their tributaries for the production of hydroelectricity.
 Damien Carles / Terra")
Figure 5.6.7: Vineyard (Château de Monbazillac) Damien Carles / Terra
. Arnaud Bouissou / Terra")
Figure 5.6.8: Dam of Bort-Les-Orgues (Dordogne). Arnaud Bouissou / Terra
5.6.5 Point and diffuse sources
Point source pressures are due to direct discharge from domestic waste water systems, most often corresponding to waste water treatment plants with a capacity of less than 2 000 population equivalents, storm water overflows and rainwater networks. This pollution also comes from industrial activities: paper mills, chemicals, food processing, etc.
The basin is particularly affected by diffuse pesticides or nitrogen pressures in the Garonne valley and the Dordogne basin where large-scale crops (cereals and oilseeds) and perennial crops (vines and orchards) are concentrated. In these geographical sectors, the high sensitivity of soils to erosion increases the transfer of pesticides or nitrogen to aquatic environments.
5.6.6 Trends in the export
Nitrogen and phosphorus flows discharged by waste water treatment plants have decreased and overall, the pressure linked to diffuse nitrogen and phosphorus inputs is also decreasing. However, micropollutant pressures remain high.
The decrease in nitrogen and phosphorus flows discharged by waste water treatment plants is due to improvements in the treatment systems of urban and industrial waste water treatment plants. Efforts still need to be made on plants with a capacity of less than 2 000 population equivalents. The decrease in diffuse nitrogen and phosphorus input is the result of the efforts made to limit mineral and organic fertilisation. However, diffuse nitrogen input may increase in certain areas, particularly due to changes in land use and the development of large-scale farming (cereals and oilseeds).
The majority of micropollutant substances are emitted by runoff from sealed land with 81% of the total flow in the basin. This figure is mainly driven by zinc, which alone accounts for 70% of emissions. Excluding zinc, the share of emissions related to runoff from sealed land drops to 53%. Next come emissions from waste water treatment plants (27%), agriculture (12%) and industry (8%). Metals (zinc, copper, arsenic, chromium, nickel, lead, cadmium and mercury) account for more than 3/4 of the total flow of emitted substances. Micropollutants also include organic substances such as PAHs, BTEX (benzene, toluene and xylenes) and DEHP.
The two main sources of diffuse micropollutants are runoff from sealed land and agriculture. The cumulative discharge of copper, lead and zinc represents more than 97% of the total pollutant flow from runoff from sealed land, with zinc accounting for almost 83%. Pesticides are found everywhere in the region, with greater pressure around vine areas and large-scale crops. Five substances account for almost 3/4 of the flow from this source of emissions: 2 metals (zinc and copper) and 3 pesticides (glyphosate, pendimethalin and chlortoluron).
5.6.7 Measures
Many efforts have been made to reduce the release of micropollutants, including metals and halogenated solvents. For example, the discharge flows of priority hazardous metals (mercury and cadmium) to be eliminated by 2021 represent only 0,4% of the total flow of metals in the basin.
5.6.8 What next?
The basin drafted its climate change adaptation plan in 2018 and its programme of measures (2022-2027) as part of the implementation of the WFD. The actions or measures presented in these two documents are organised around the following main objectives: to find a balance between needs and resources, to reduce pollution (domestic, industrial, agricultural) at source, to rehabilitate the functionality of aquatic environments in order to improve their resilience, to find a way to protect against natural risks (flooding, coastal erosion, marine submersions)
5.7 Loire

Figure 5.7.1: Map showing the extent and land use in the Loire river basin
5.7.1 Size and geography
The Loire basin covers almost 117 800 km2. It is the largest river basin in France. The Loire, a river over 1 000 km long, rises at Mont Gerbier de Jonc in the Massif Central and then swells before meeting the marine waters of the Atlantic Ocean in a wide estuary from Nantes to Saint-Nazaire.
5.7.2 Population density
The Loire catchment area has a population of 11,5 million, of which more than 4 million live on the Loire alone, mainly around the major cities (Nantes, Angers, Tours, Orléans and Saint-Etienne). It is a relatively unurbanised basin with an average density of 70 inhabitants/km2.
However, there is a strong territorial disparity with the juxtaposition of highly populated and growing areas with less populated and shrinking areas.
5.7.3 Land use
The Loire basin is covered mainly by agricultural land (70% of its territory), forests and other natural areas (18%), aquatic environments (8%) and artificial land (4%).
However, there is a strong disparity in land use and occupation between the south-east, where forests and grasslands are predominant, and the north-west, where agricultural land is predominant.
The other categories of use are industry (with a growing agri-food industry) and urbanisation.
5.7.4 Use of the river
The Loire is used for the production of drinking water (almost 1 000 million cubic metres are taken each year for the supply of drinking water), the production of energy (power stations take 2 000 million cubic metres from the basin and return almost all of this water downstream) and irrigation. Irrigation is the use with the highest net consumption at low water.
The other uses are river transport with two large ports in Saint-Nazaire and Nantes, leisure activities and aggregate production.
In addition, many transverse structures (weirs and dams) are built on the Loire or its tributaries.
. Olivier Brosseau / Terra")
Figure 5.7.7: Agricultural land (Chaudefonds-sur-Layon). Olivier Brosseau / Terra

Figure 5.7.8: Scow on the Loire in Briare. Laurent Mignaux / Terra
5.7.5 Point and diffuse sources
Point source pressures are due to direct discharge of pollution from sewage treatment plants, storm drains and rainwater systems.
Diffuse pressures are due to fertilisers and the treatment of crops with phytosanitary products. A small amount of this pollution also comes from non-collective sanitation installations and leaks in the sanitation networks.
5.7.6 Trends in the export
Nitrogen and phosphorus flows discharged from waste water treatment plants have decreased significantly despite the increase in population thanks to improvements in the treatment systems of urban and industrial waste water treatment plants. The pressure linked to diffuse nitrogen and phosphorus inputs is also decreasing. However, micropollutant pressures remain high.
Today, the majority of nitrogen and phosphorus point source pressures come from rainfall discharges and phosphorus discharges in the most sensitive environments, particularly low flow rivers. The pressure linked to diffuse nitrogen and phosphorus inputs is decreasing thanks to the efforts made to limit mineral and organic fertilisation. Efforts must nevertheless continue in order to re-establish a situation of balance, otherwise the impacts currently observed in terms of health (drinking water catchments exceeding standards) and ecology (proliferation of green algae on the coast, blooms of phytoplankton) will continue.
The pressure linked to point source discharges of micropollutants remains a difficult subject to deal with in view of the multiplicity of molecules used and the availability and reliability of data on discharges. Analyses carried out at industrial and urban sites nevertheless show that the priority hazardous substances of the WFD are very rarely quantified in the discharges of urban waste water treatment plants and are slightly more present at industrial sites. Pesticides are found everywhere in the region, with greater pressure around wine-growing areas (along the Loire) or large-scale farming. The diversity of pesticides used is increasing.
5.7.7 Measures
In 2018 the Loire-Brittany basin drew up its climate change adaptation plan based on five central issues: quality, quantity, aquatic environments, flooding and marine submersion, and governance.
5.7.8 What next?
Given the increase in demographic and economic pressures, the consequences of climate change, and the continued use of pesticides, it is unlikely that all rivers in the basin will achieve good status by the deadline of the Water Framework Directive (2027).
The draft of the next WFD management cycle (2022-2027) includes the following key groups of measures
- Rethinking river development
- Reducing nitrate, organic and bacteriological pollution
- Controlling pollution from pesticides and micropollutants
- Protecting health by protecting water resources
- Controlling water abstraction
- Preserving wetlands
- Preserving aquatic biodiversity
- Preserving the coastline
6. Pathways for selected Catchments
The reported major pathways include riverine inputs, direct point sources and, for nitrogen, atmospheric deposition. The information is based on the national on riverine inputs and direct point sources reported according to the OSPAR Riverine Inputs and Direct discharges monitoring programme (RID, Agreement 2014-04), and the EMEP modelled atmospheric deposition of nitrogen to the OSPAR Maritime Area in the period 1995-2019.
The importance of the different pathways varies considerably over the OSPAR area. For instance, the Norwegian waterborne phosphorus inputs, i.e., riverine and direct point sources, to the North Sea are highly dominated by direct point sources, mainly different sea-based fish farms, whereas the riverine inputs only constitute a fraction of the total waterborne inputs (Figure 6.1). On the contrary, for the Swedish phosphorus inputs to the Kattegat the situation is the opposite with heavy domination of riverine inputs that in fact are to a large degree themselves dominated by River Göta älv (cf. the river catchment Göta älv in the previous chapter).
In other areas, the waterborne nutrient inputs are more equally divided between the different pathways as e.g., the UK phosphorus inputs to area SC4 (Figure 6.1). The different pathway patterns illustrate mainly if large rivers or substantial direct point sources dominate for the different substances, or as in many cases if the inputs originate from several minor rivers and/or direct point sources. However, the actual upstream sources for the riverine inputs are not included in the present assessment as these data are not regularly reported and assessed within OSPAR. This kind of detailed information is vital for directing effective measures to reduce the nutrient inputs which is needed to achieve the Strategic objective no 1 in the North-East Atlantic Environment Strategy, 2030, i.e., “Tackle eutrophication, through limiting inputs of nutrients and organic matter...” (NEAES SO1).
Figure 6.1: Importance of direct point-sources (red bars) vs. normalised riverine (green bars) inputs of total P from 1990-2019 for UK to Area SC4, NO to the North Sea, and SE to Kattegat
Corresponding to the large impact from major rivers on the waterborne inputs, OSPAR sea areas with a large sea area compared to land mass and land-based sources will have a more profound impact from atmospheric deposition than areas with smaller sea area to land mass ratio. For instance, the atmospheric deposition of nitrogen constitutes roughly half the total nitrogen inputs to the whole OSPAR Maritime Area (I-IV) (Figure 6.2). For the Arctic Ocean (OSPAR Region I) the impact of the atmospheric nitrogen deposition is even larger (Figure 6.3). Although the waterborne nitrogen inputs are increasing significantly to this sea area, the overall nitrogen inputs are decreasing due to the notably large impact of the atmospheric nitrogen deposition that substantially decreases over time. The increase in waterborne nitrogen inputs to this sea area is mainly due to comparatively large increase in Norwegian direct point sources, namely the increased sea-based fish farming corresponding to the same trends for the Norwegian nitrogen inputs to the North Sea (cf. Figure 6.1). However, due to the comparatively large impact of the atmospheric deposition this increase in release from direct point sources is counter-acted or disguised by the vast atmospheric deposition mainly due to the large sea area.
Figure 6.2: Combined normalized airborne and waterborne nitrogen inputs to the OSPAR Maritime Area, showing countries of origin. Missing data are replaced by a mean value based on data reported from that country for the period 1990–2019. The dashed line indicates a statistically significant trend (p<0,05; calculated with Scipy.Stats.Kendalltau). Atmospheric deposition for 1990 – 1994 represents actual, not normalised deposition (Axe et al., 2022).
Figure 6.3: Combined normalized airborne and waterborne nitrogen inputs to the Arctic Ocean (OSPAR Region I), showing countries of origin. Missing data are replaced by a mean value based on data reported from that country for the period 1990–2019. The dashed line indicates a statistically significant trend (p<0,05; calculated with Scipy.Stats.Kendalltau). Atmospheric deposition for 1990 – 1994 represents actual, not normalised deposition (Axe et al.,2022).
7. Effectiveness of Measures
Over the past three decades, many river basins show decreasing trends in nutrient and heavy metal concentrations, due to the numerous measures that have been taken to reduce pollution emissions and enhance the resilience of the water systems. These measures are large or small, direct or indirect, and long term or short term, and their (combined) effect on the aquatic ecosystem is not always fully or directly visible. Not surprisingly, clear impact assessments are rather rare or difficult to make since both pressures and effects must substantially change. This section describes three case studies at a catchment scale with measures that had a clear environmental impact.
Case study: Urban waste water treatment in the Brussels Capital Region (Belgium, Scheldt River basin)
Brussels, the capital of Belgium, has two urban waste water treatment plants (UWWTPs): Brussels-South (design capacity 360 000 pe.) and Brussels-North (design capacity 1,1 million pe). Large-scale sanitation infrastructure was absent until 2000, when Brussels-South became operational, applying secondary treatment only. After a substantial upgrade in 2019, quaternary treatment now treats a waste water volume equal to 400 000 pe. In 2007, Brussels-North became operational, its capacity reaching at present about 1,4 million pe. The waste water treatment has had a huge impact on the receiving surface water, as is shown in the Figure 7.1, Figure 7.2 and Figure 7.3 for total nitrogen (tot-N), total phosphorus (tot-P), and suspended particulate matter (SPM). Monitoring of both the upstream and downstream stretches of the Senne/Zenne river is performed since the 1990s. Upstream concentrations show a gradual decrease of pollution, the result of a large number of local and regional long- and short-term measures in the catchment. The downstream concentrations show the combined effect of upstream improvements and urban waste water treatment in the capital. In particular the impact of the Brussels-North treatment plant in 2007 is very clear. Since 2019, the additional impact of Brussels on the receiving water body is almost reduced to a minimum.
Figure 7.1: Impact of measures in the Brussels Capital Region on the total nitrogen concentrations (1996-2021) upstream and downstream the city. The significant drop in 2007 in the downstream stretch shows the impact when UWWTP Brussels-North became operational. Concentrations are mean values of three monitoring stations maximum.
Figure 7.2: Impact of measures in the Brussels Capital Region on the total phosphorous concentrations (1989-2021) upstream and downstream the city. There is a clear effect of UWWTP Brussels-North becoming operational in 2007. Concentrations are mean values of three monitoring stations maximum.
Figure 7.3: Impact of measures in the Brussels Capital Region on the SPM concentrations (1990-2021) upstream and downstream the city. The combined measures in the catchment show a gradual decrease in both the upstream and downstream water bodies. Concentrations are mean values of three monitoring stations maximum.
Case study: Pollution load reductions in the Yser catchment (Belgium, OSPAR area 243)
The Yser/IJzer river is located in the Belgian coastal area and its river basin is transboundary with France (1 092 km², of which 714 km² in Belgium). The main activity in this polder area is agriculture, which causes high nutrient pressures from diffuse sources. In 2000, a pollution load balance estimate was developed for the reference year 1996. Total emissions (domestic and industrial waste water, and manure production) were estimated at that time to be 32,4 kt tot-N/y and 6,45 kt tot-P/y, apportioned to households, industry, and agriculture as follows: 3,5% - 0,5 % - 96 % for tot-N, and 3,0% - 0,6% - 96,4% for tot-P. After treatment, loads discharged to the surface waters were estimated at 4,74 kt/y for tot-N and 0,41 kt tot-P/y, and the share of households, industry, agriculture, and UWWTPs was as follows: 10,2% - 1,3% - 82,3% - 6,2% for tot-N, and 20% - 6% - 59% - 15% for tot-P. Comparing these loads with the totals of the monitored loads of the surface waters – 4,71 kt tot-N/y and 0,44 kt tot-P/y - indicated that transboundary inputs were low. The nutrient levels also fit very well within the ranges reported to OSPAR in 1999. Since then, an average annual decrease of 2,3 % for tot-N and 1.9% for tot-P is observed (Figure 7.4)
 reported to OSPAR.")
Figure 7.4: Trends of nutrient loads in the Yser catchment (1999-2020) reported to OSPAR.
In addition, there is no steady decrease of the nutrient inputs and it is assumed that the water flow has a significant influence on the loads discharged to the North Sea. The water flow shows no significant trend, although it looks highly variable over the years. It reflects the combined impact of changing weather conditions and intensive water use for agricultural purposes in a complex network of waterways and polder waters.
In 1995, an ambitious programme – the Manure Action Plan - started to reduce nutrient pressures on the environment. In 2000, load reductions in the surface waters were calculated for tot-N to be at a minimum of 30% (1,43 kt/y) to meet the less stringent EQSs and up to 90% (4,25 kt/y) to meet the ecological EQSs; for tot-P, values were respectively 61% (0,25 kt/y) and 95% (0,39 kt/y). This means that, at present, tot-N loads should not exceed 3,3 or 0,5 kt/y, and tot-P loads not 0,19 or 0,05 kt/y. For both nutrients, the upper limits are met since 2014, but meeting the ecological EQSs still requires substantial efforts. (Muylle & Vannevel, 2000).
Case study: Eutrophication and recovery in the Solent, Hampshire, UK
Nitrogen enrichment in some estuaries of the Solent (the channel of water between the south coast of England and the Isle of Wight) has contributed to historic eutrophication over several decades, with adverse environmental and ecological consequences. The Solent is approximately 32 km long and varies in width generally between 4 km and 8 km, except where it narrows to roughly 1,5 km at its western end, where a shingle bank juts into the channel from the mainland. The area’s estuarine habitats are of ecological importance, much of the coastline being designated as a Special Area of Conservation, and the surroundings contribute to a group of several nationally-important protected landscapes. Due to its natural harbours, the Solent is a major shipping lane and port area, as well as being popular for recreational water sports.
As published in an overview of Solent eutrophication and recovery (Environment Agency, 2020), source-apportionment data from the 2019 Eutrophication Assessment confirmed that the main sources of N to the Solent estuaries were: diffuse sources from agriculture (50%); point sources from sewage discharges (10%); and the remainder from coastal background and urban sources. A series of measures, including reductions in N inputs from agriculture (via the Nitrates Directive and associated Nitrate Vulnerable Zone designations and measures), and N removal from sewage discharges (via the Urban Waste Water Treatment Directive and Habitats Directive), have led to declining trends in N and sustained reductions in macroalgal growth, compared with historic levels.
, Hampshire, UK")
Figure 7.5: Trends in concentrations of N and P in the River Test (at Testwood), Hampshire, UK
Recovery from eutrophication is evident in several estuaries in the Solent area, following almost 20 years of measures to reduce N from agricultural, sewage and other sources in the catchments. For example, Langstone Harbour at the eastern end of the Solent has experienced decreases in N and P loads of 49% and 75%, respectively, over 20 years. The resulting reduction in macroalgal biomass and entrainment has led to consistent achievement of Water Framework Regulations (WFR)3 ‘Good’ status for macroalgae in Langstone Harbour. Langstone Harbour was one of the first Solent estuaries to experience N load reduction measures (2001), so it is one of the first to recover from eutrophication.
Other improvements in Solent rivers have included reductions in P, mostly as phosphate, due to improved actions and reductions in detergents over many years. Nevertheless, recovery from eutrophication in the Solent area takes time due to biological time lag and, in some places, the influence of N-rich groundwater. An example is the River Test, which flows through Southampton and drains to the Solent directly north of the Isle of Wight, where gradual increases in concentrations of N have been observed, while P has decreased dramatically (Figure 7.5). In this river catchment, the rising trend in N concentrations is from the groundwater feeding the river, which contains high levels of N resulting from historic agricultural fertiliser use. Eventually these elevated N concentrations will plateau and decline, as continued environmental measures start to take effect on ‘younger’ groundwater.
8. Gaps and Uncertainties
8.1 Introduction
The nutrient input assessment is based on a combination of observations, statistical analyses, and dynamic numerical models. The variations in climate, geographical location, implementation of measures, population density and land-use pattern are elements that influence concentrations of pollutant inputs from rivers, discharges from direct point sources, and the losses from unmonitored areas.
Over the years, the RID Programme has seen many improvements, but there are still gaps and uncertainties that can be reduced. Each year in September, all Contracting Parties (CPs) are approached and asked to deliver their data on an excel sheet template, to comply with the requirements of the current RID Database, as well as a template for a written annual report. The latter is designed to ensure transparent methodologies of the RID programme, where CPs documents how the RID programme has been carried out (e.g., rivers monitored, methods used, quantification limits, and any anomalies). For various reasons, some CPs are delayed in their deliveries, and it is an ongoing effort to keep the database and the library of supporting written reports complete.
Despite gaps and inconsistencies, there must be no doubt that monitoring riverine inputs to the sea is of high importance, as it provides an increasingly sound basis for management decisions throughout the OSPAR area. These data can also be used by scientists to further explore trends and relationships in nutrient and pollutant dynamics, can be used for educational purposes, and are suitable for informing stakeholders about the pan-European work on reducing pressures to our common seas. Thus, the work to reduce gaps and uncertainties should continue to be a key priority for all CPs.
8.2 Station network and monitoring coverage
The RID Principles state that CPs should “aim to monitor on a regular basis at least 90% of the inputs of each selected pollutant. If this is not achievable due to a high number of rivers draining to the sea, modelling/extrapolation can be used to ensure sufficient coverage.” This paragraph accommodates for the large geographical variations of European river networks. Whereas some CPs have a few, large river mouths to monitor, others are faced with numerous smaller rivers draining to the sea and must therefore select which rivers to monitor. Hence, the proportion of monitored vs. unmonitored land varies between CPs.
8.3 Changes in river stations monitored
Over the years, some CPs have changed their RID Programmes for various reasons. Stations may have been abandoned and new ones opened, or sampling frequency and the parameters monitored have changed. This may impact the time series and therefore the trend analyses, although work is constantly ongoing to reduce the effect of such changes.
8.4 Sampling frequency
Concentrations in rivers can show high variations over time. In line with the RID Principles, and for practical and economic reasons, most CPs employ monthly or fortnightly regular sampling. This can underestimate both maximum and average concentrations since the high concentration peaks, for example during floods or environmental accidents, are not always detected.
8.5 Laboratory analyses
Improvements in analytical laboratory techniques since 1990 enable concentrations of many parameters to be quantified at much lower levels and with higher accuracy and precision than in earlier years. Especially for substances with low concentrations, such as mercury and cadmium, this improvement can affect the trend analyses, and it is therefore important that the data analysers make sure they do not simply show a trend of laboratory improvements.
A related issue is that some CPs can use several local laboratories, whereas others have changed the laboratory over the years. Different laboratories can use different analytical methods and limits of quantification, which can lead to artificial jumps in the time series. For that reason, it is advised that CPs pay attention to keep LOQ within comparable ranges, and to make regular intercalibration to allow for evaluation of comparability between laboratories and variation within laboratories.
Whereas the RID Programme monitors the substances in whole water samples, including both the particulate and dissolved phase, the Water Framework Directive (WFD) requires analyses of the bioavailable phase.

Figure 8.1: Example of TP concentrations in the Norwegian river Orkla, with a change of laboratory in the period 2000-2003
8.6 Hydrological data
Hydrological data are important for load calculations and trend analyses, as well as to assess developments over time due to changes in climatic conditions. Usually, these data are monitored continuously in a river, but not always at the RID sampling station. Hence, up- or down-scaling needs to be done. At RID sampling stations with no nearby hydrological stations, hydrological interpolation or modelling is done.
On a larger, country-based scale, the overall water discharge from a CP to the sea is used to assess total loads to the sea. The calculation methods of such total water discharges may differ from country to country.
8.7 Transboundary river outlets
Some rivers have estuaries that are shared between two CPs, or where the lower parts are channelled, so that parts of the water can flow to the coast upstream of the sampling station. This is the case for the river Scheldt, crossing France, Belgium, and the Netherlands, and of which parts of the water flow is deviated towards the North Sea. This makes the polder region – the area between the catchment and the coastal region – factually part of the river basin. However, not all CPs report inputs from these areas to OSPAR.
8.8 Load calculation method
Several studies have shown that the ratio method used in the RID Programme can underestimate loads, but under- or overestimation can also occur when using other methods, such as linear interpolation and the rating curve (e.g., Skarbøvik et al., 2012).
Load calculations including values below LOD/LOQ are estimated as being half the LOD/LOQ value, which can make them prone to overestimation, especially if the LOD/LOQ value is unnecessarily high due to inadequate analytical capabilities.
In some rivers, load calculations can be especially challenging. An example is the load calculations for the Scheldt estuary, a 160 km long stretch between Vlissingen (the Netherlands) and Ghent (Belgium), is extremely difficult because of its tidal regime, its complex network of rivers, canals, and polder system, and the different land uses and activities (agriculture, industries, harbour activities). Results obtained from modelling could improve the estimated and partially lacking load inputs.
8.9 Unmonitored areas
As noted above, the coverage of monitored land by rivers differ between the CPs. Hence, also the proportion/percentage of unmonitored land varies, and the methods for estimating inputs from unmonitored areas can be of higher importance in some CPs than in others. Some CPs do not report any inputs from unmonitored areas.
Different methods are used to calculate inputs from unmonitored areas, and there is a requirement to inform about these in the annual written report, to ensure transparency of the data. Focus should be on ensuring that the applied methodologies by countries provide results that are comparable and consistent.
8.10 Direct discharges
Most CPs report direct discharges from industry and sewage treatment plants, some from urban runoff, and a few CPs do not report direct discharges at all. A few CPs report discharge from aquaculture. Certainly, this variation in what is being reported opens for incomplete total estimates of the direct discharges to the seas, but overall, this source is often less important than riverine inputs. However, major direct discharges are believed to be reported relatively conscientious and consistent in the programme. The reason Belgium does not report direct discharges is that all related point sources in the coastal area have been removed since 1995.
Correct estimates of direct discharges usually require a functioning national reporting system, and that the data reported are available for the RID programme each year in time for the reporting. Moreover, the responsibility of the submitted data lies with the point source, including number of samples collected each year, the LOD/LOQ of the laboratory used, etc. Delays and gaps may occur, and in general, the direct discharges data are assumedly less consistent from year to year than the riverine inputs. Some CPs have therefore employed inter- and extrapolation routines to ensure that these datasets are more consistent.
8.11 Improving the uncertainties
Improving the uncertainties of the RID Programme’s database is an on-going task, that can never be finalised. An important tool would be better access to the data for a wider audience, so that more parties could use the RID data and thereby detect anomalies and other unexplained issues. An improved database solution would be a major instrument in achieving this.
OSPAR areas do not always match the WFD river basin districts or subunits. Different spatial aggregations hamper the exchange and use of data from different data sources, often only available at national or WFD river basin level. Collection of basic national data at WFD sub-basin or catchment level, or at a low governance level, is a prerequisite for impact assessments and water mass and pollution load balances. In particular, there is a need of (transboundary) pollution loads and population numbers, and possibilities to report source apportionment of inland points (waste water treatment plants, industrial plants, aquacultural plants) and diffuse sources (natural background inputs, agricultural inputs, inputs from scattered dwellings and stormwaters etc.).
9. Conclusions and next steps
The OSPAR Maritime Area is vast, covering a large variability in geological, and hydrological conditions as well as considerable climatological differences in different parts of the area. In addition, the population density as well as the human impact vary all over the area. All this creates a variability in the amount of water that reaches the marine environment from land, and this also holds true for the inputs of various the substances that are kept in this water including nutrients and metals. The variability may be high inter-annually, as well as intra-annually depending on the hydrological regimes in a specific area. However, as the prevailing data is on an annual basis, it has not been possible to assess the variability within the years. Sections 2 - 5 give an overview of this variability through a selection of river catchments thorough the OSPAR Maritime Area.
In Section 6 some examples of the importance of different pathways are given, which is to a large degree dependent on the substance, and the degree of human impact and on the human activities from which this impact originates. The section focuses on the nutrients, but it would have been further refined if metals had also been included. In general, as the Maritime Area is large, the atmospheric deposition is always an important source. However, in densely populated areas the point sources tend to have an increased importance, and especially if the population is dense in the coastal areas the direct point sources become an increasingly important pathway. In areas with comparatively large rivers or many rivers that together are responsible for large amounts of water entering the marine environment, the riverine inputs may play a substantially important pathway for the input of e.g., nutrients to the Sea.
Over the years substantial efforts have been taken to reduce the human impact on our marine systems, e.g., to combat eutrophication in our coastal waters via reducing the riverine inputs and direct discharges from point-sources. Some examples of remedial measures resulting in reduced nutrient inputs to the sea or reduced nutrient levels in the rivers are given in Section 7.
Efforts to reduce the inputs vary temporarily as well as spatially over the OSPAR Maritime Area, this implies that the measures have been addressed at different times as well as at different locations which creates large challenges to identify general patterns. It is mainly in minor rivers, e.g., headwaters, that effects of measures taken, in particular to reduce diffuse sources, may be traced. On the other hand, the positive impact on the water quality of implementing or improving large point sources are more evident, as illustrated in Section 7.
The reason behind only presenting selected river catchments in this assessment was the general challenge to attain high quality times series of input data as well as water flow data with a minimum of data-gaps, which is needed to perform comprehensive assessments. In Section 8 some information on data quality and quantity issues are given. Assessing incomplete data series or data with low quality is challenging and may give no or erroneous results as the variability in the inputs may be considerable. This may be extra challenging as the monitoring is supposed to monitor changes in water quality and inputs, including changes due to implemented measures. Hence, large resources may be allocated to e.g., combat eutrophication in coastal areas by reducing the nutrient inputs, but limited resources may be assigned to monitor and ensure that the effects are as expected.
The next steps in monitoring and assessing the inputs of nutrients and hazardous substances such as metals to our sea areas are to ensure that the OSPAR NEAES 2030 Strategic Objectives 1 and 2, that is, to achieve clean seas by tackling eutrophication, through limiting inputs of nutrients and organic matter, and preventing pollution by hazardous substances, is to continue to improve the monitoring programmes both at the OSPAR level (RID programme) as well as at the national level. The programmes must result in input and water flow data of sufficient coverage and quality to ensure that changes in the water quality can be revealed to certify that no deterioration in water quality can occur, but that the measures implemented have the expected effects on inputs of nutrients and hazardous substances to the sea. In parallel to the monitoring of riverine and direct discharges, the monitoring of the atmospheric deposition (CAMP) must also continue, to ensure proper modelling work can be performed to facilitate the assessments of the atmospheric deposition over the OSPAR Maritime Area.
To tackle eutrophication (NEAES SO1) it is also important to have realistic goals on maximum allowable nutrient inputs set to the different sea areas to ensure that the measures have specific targets to reach by an agreed time. At the moment, the only goals are the 50% reduction from 1985 to 1995 set in the paused PARCOM Recommendation 88/2 on the reduction of nutrients to the Paris Convention area. This reduction target is not specific enough to be relevant to all coastal areas, instead area-specific maximum levels are under development.
To achieve more effective overviews on the effectiveness of measures and where to allocate new measures to have most effect, it is vital to also have better access to source-apportionment information, covering the inputs especially for all problem areas. Preferably, this information should be collected in a harmonised way, but at least as comparable as possible so as to enhance future assessments.
10. Climate change and inputs
The Joint Research Centre of the European Commission has recently published the results of the PESETA IV project, mapping climate change impacts and adaptation in Europe. The project consisted of downscaling global climate models to describe the regional changes in physical environment, which were then fed into biophysical and socioeconomic models to describe changes in the biosphere and society. The global climate scenarios used reflected both achievement of the Paris targets, but also the moderate mitigation (RCP 4.5) and high emissions (RCP 8.5) scenarios.
All project scenarios predicted increased annual mean temperatures across the OSPAR Maritime Area, with greatest increases observed in the north-east (Northern Scandinavia). Mean precipitation patterns also changed, with reduced precipitation over the Iberian peninsula – particularly in summer - and increased precipitation over Scandinavia. Combining the changes in temperature with changes in precipitation in Scandinavia is likely to result in increased winter run-off, as snow instead falls as rain – and a reduction in spring melt run-off.
The reduced precipitation over the Iberian peninsula is likely to exacerbate the existing water scarcity, Problems of water scarcity were predicted to extend further into Northern Europe, becoming more frequent in the Loire valley and occurring occasionally even along the continental coast of Northern Europe into Denmark. Impacts of water scarcity on agriculture were uncertain, as changes in crops or irrigation techniques may mitigate some shortages while technological development may reduce industrial water use.
The PESETA IV project also considered changes in flood frequency and intensity. Several extreme flood events have occurred in recent years, with the Rhine floods of July 2021 responsible for the loss of more than 180 lives in Germany and a total of 243 lives across Europe as a whole. The ”no mitigation” RCP 8.5 scenario resulted in a 6-fold increase in direct damage from flooding by 2100. Even limiting temperature increases to 2°C resulted in a tripling of the impacts compared to the present day. Extreme flood events result in massive stormwater inputs to the sea, carrying eroded soils with nutrients and hazardous substances, large quantities of litter as well as oil and other products used in society.
Climate impacts on agriculture are decisive for estimating the effects on waterborne inputs. PESETA IV suggested an increase in insect outbreaks in forestry but did not estimate effects on agriculture. While water scarcity is expected to limit production of non-irrigated crops, changes in water management and crop breeding may maintain production at present day levels, which would suggest a similar consumption (and emission) of fertilisers and herbicides. Anecdotally however late season drought in southern Sweden gave an example where a crop did not grow to completion resulting in high soil nutrient content which was washed out in the following winter. As such, the predictability of drought conditions may become an important factor in minimising future nutrient inputs.
11. References
Chapters 2, 3, 4 and 5
WFD and FD Implementation Reports - Environment - European Commission. Available at: ec.europa.eu/environment/water/water-framework/impl_reports.htm
Alta
https://en.wikipedia.org/wiki/Altaelva
Douro
APA (2022). Plano de Gestão de Região Hidrográfica. 3º ciclo (2022-2027). Douro (RH3). Parte 1 – Enquadramento e Aspetos Gerais. Agência Portuguesa do Ambiente, 69p. Available at: https://apambiente.pt/sites/default/files/_Agua/DRH/ParticipacaoPublica/PGRH/2022-2027/3_Fase/PGRH_3_RH3_Parte1.pdf
APA (2022). Plano de Gestão de Região Hidrográfica. 3º ciclo (2022-2027). Douro (RH3). Parte 2 – Caracterização e Diagnóstico, Volume A. Agência Portuguesa do Ambiente, 178p. Available at: https://apambiente.pt/sites/default/files/_Agua/DRH/ParticipacaoPublica/PGRH/2022-2027/3_Fase/PGRH_3_RH3_Parte2_VolumeA.pdf
APA (2022). Plano de Gestão de Região Hidrográfica. 3º ciclo (2022-2027). Douro (RH3). Parte 3 – Análise Económica das Utilizações da Água. Agência Portuguesa do Ambiente, 176p. Available at: https://apambiente.pt/sites/default/files/_Agua/DRH/ParticipacaoPublica/PGRH/2022-2027/3_Fase/PGRH_3_RH3_Parte3.pdf
Confederación Hidrográfica del Duero (2022). Planificación hidrológica. Available at: https://www.chduero.es/web/guest/planificacion
Confederación Hidrográfica del Duero (2022). Informe del Consejo del Agua de la Demarcación sobre la propuesta de proyecto de revisión del Plan Hidrológico del Tercer ciclo de planificación: 2022-2027. Available at: https://www.chduero.es/documents/20126/1577759/Informe+CAD_08042022.pdf/ad7ba287-3c0b-9a58-2070-c1f6c2c885fa?t=1649679539122
Confederación Hidrográfica del Duero (2022) Propuesta de Plan Hidrológico del Tercer ciclo de planificación 2022-2027 (Normativa). Available at: https://www.chduero.es/documents/20126/1577759/PHD22-27_000_00_Normativa_v12.pdf/7641fb77-edb6-8404-cc78-7833b1893891?t=1649327341322
Confederación Hidrográfica del Duero (2022) Propuesta de Plan Hidrológico del Tercer ciclo de planificación 2022-2027 (Memoria). Available at: https://www.chduero.es/documents/20126/1577759/PHD22-27_000_00_Memoria-v07.pdf/06121987-8865-002f-089e-01602515524b?t=1649327955785
Ministerio de Agricultura, Pesca y Alimentación (2016) Real Decreto 1/2016, de 8 de enero, por el que se aprueba la revisión de los Planes Hidrológicos de las demarcaciones hidrográficas del Cantábrico Occidental, Guadalquivir, Ceuta, Melilla, Segura y Júcar, y de la parte española de las demarcaciones hidrográficas del Cantábrico Oriental, Miño-Sil, Duero, Tajo, Guadiana y Ebro. «BOE» núm. 16, de 19/01/2016. Available at: https://www.boe.es/buscar/act.php?id=BOE-A-2016-439
Elbe
FGG Elbe, 2020: Entwurf der zweiten Aktualisierung des Bewirtschaftungsplans nach § 83 WHG bzw. Artikel 13 der Richtlinie 2000/60/EG für den deutschen Teil der Flussgebietseinheit Elbe für den Zeitraum von 2022 bis 2027. Available at: https://tlubn.thueringen.de/fileadmin/00_tlubn/Wasser/Dokumente/WRRL/Elbe/1_Bewirtschaftungsplan/2_Entwurf_BP_Stand_12-2020.pdf
FGG Elbe, 2020: Entwurf der zweiten Aktualisierung des Maßnahmenprogramms nach § 82 WHG bzw. Artikel 11 der Richtlinie 2000/60/EG für den deutschen Teil der Flussgebietseinheit Elbe für den Zeitraum von 2022 bis 2027. Available at: https://www.hamburg.de/contentblob/14731648/ff4ee047eec7a8e858c2f95f47bb3fd5/data/d-wrrl-massnahmenprogramm-dez2020.pdf
Hofmann et al. 2005: Catchment – coastal zone interaction based upon scenario and model analysis: Elbe and the German Bight study. Regional Environmental Change. Available at: https://doi.org/10.1007/s10113-004-0082-y
Fuchs, S., Wander, R., Rogozina, T., Hilgert, S. (2011): The MoRE Handbook. Karlsruhe Institute of Technology. Institute for Water and River Basin Management. Available at: http://isww.iwg.kit.edu/MoRE.php
Fuchs, S.; Kaiser, M.; Kiemle, L.; Kittlaus, S.; Rothvoß, S.; Toshovski, S.; Wagner, A.; Wander, R.; Weber, T.; Ziegler, S. (2017): Modeling of Regionalized Emissions (MoRE) into Water Bodies: An Open-Source River Basin Management System. Water 2017, 9, 239. Available at: https://doi.org/10.3390/w9040239
https://en.wikipedia.org/wiki/Elbe
Garonne
https://www.initiativesfleuves.org/wp-content/uploads/2019/02/Fiche-synoptique-GARONNE_FR.pdf
http://www.occitanie.developpement-durable.gouv.fr/IMG/pdf/5512_sdage_etat_des_lieux_bd.pdf
https://www.eptb-dordogne.fr/contenu/index/idcontenu/182
https://fr.calameo.com/books/000222592810e5530b06c
Guadalquivir
Confederación Hidrográfica del Guadalquivir (2022). Planificación hidrológica. Available at: https://www.chguadalquivir.es/demarcacion-hidrografica-guadalquivir
Confederación Hidrográfica del Guadalquivir (2022). Informe del Consejo del Agua de la Demarcación sobre la propuesta de proyecto de revisión del Plan Hidrológico del Tercer ciclo de planificación: 2022-2027 Available at: https://www.chguadalquivir.es/-/el-consejo-del-agua-de-la-demarcacion-cad-informa-favorablemente-del-proyecto-de-plan-hidrologico-del-guadalquivir
Confederación Hidrográfica del Guadalquivir (2022) Propuesta de Plan Hidrológico del Tercer ciclo de planificación 2022-2027 (Normativa y Memoria). Available at: https://www.chguadalquivir.es/tercer-ciclo-guadalquivir
Ministerio de Agricultura, Pesca y Alimentación (2016) Real Decreto 1/2016, de 8 de enero, por el que se aprueba la revisión de los Planes Hidrológicos de las demarcaciones hidrográficas del Cantábrico Occidental, Guadalquivir, Ceuta, Melilla, Segura y Júcar, y de la parte española de las demarcaciones hidrográficas del Cantábrico Oriental, Miño-Sil, Duero, Tajo, Guadiana y Ebro. «BOE» núm. 16, de 19/01/2016. Available at: https://www.boe.es/buscar/act.php?id=BOE-A-2016-439
Guadiana
APA (2022). Plano de Gestão de Região Hidrográfica. 3º ciclo (2022-2027). Guadiana (RH7). Parte 1 – Enquadramento e Aspetos Gerais. Agência Portuguesa do Ambiente, 70p. Available at: https://apambiente.pt/sites/default/files/_Agua/DRH/ParticipacaoPublica/PGRH/2022-2027/3_Fase/PGRH_3_RH7_Parte1.pdf
APA (2022). Plano de Gestão de Região Hidrográfica. 3º ciclo (2022-2027). Guadiana (RH7). Parte 2 – Caracterização e Diagnóstico, Volume A. Agência Portuguesa do Ambiente, 167p. Available at: https://apambiente.pt/sites/default/files/_Agua/DRH/ParticipacaoPublica/PGRH/2022-2027/3_Fase/PGRH_3_RH7_Parte2_VolumeA.pdf
APA (2022). Plano de Gestão de Região Hidrográfica. 3º ciclo (2022-2027). Guadiana (RH7). Parte 3 – Análise Económica das Utilizações da Água. Agência Portuguesa do Ambiente, 179p. Available at: https://apambiente.pt/sites/default/files/_Agua/DRH/ParticipacaoPublica/PGRH/2022-2027/3_Fase/PGRH_3_RH7_Parte3.pdf
Confederación Hidrográfica del Guadiana (2022). Sistema de Información de Redes Automáticas de la cuenca del Guadiana. Redes de control cuantitativo y cualitativo de recursos hídricos: SAIH, SAICA, ROEA y piezometría. https://www.saihguadiana.com & https://www.chguadiana.es/visorCHG/
Confederación Hidrográfica del Guadiana (2022). Informe del Consejo del Agua de la Demarcación sobre la propuesta de proyecto de revisión del Plan Hidrológico del Tercer ciclo de planificación: 2022-2027 https://www.chguadiana.es/sites/default/files/2022-04/Informe_del_CAD_PH2022-27.pdf
Confederación Hidrográfica del Guadiana (2022) Propuesta de Plan Hidrológico del Tercer ciclo de planificación 2022-2027 (Normativa). Available at: https://www.chguadiana.es/sites/default/files/2022-04/Normativa.pdf
Confederación Hidrográfica del Guadiana (2022) Propuesta de Plan Hidrológico del Tercer ciclo de planificación 2022-2027 (Memoria). Available at: https://www.chguadiana.es/sites/default/files/2022-04/Memoria_1.pdf
Ministerio de Agricultura, Pesca y Alimentación (2016) Real Decreto 1/2016, de 8 de enero, por el que se aprueba la revisión de los Planes Hidrológicos de las demarcaciones hidrográficas del Cantábrico Occidental, Guadalquivir, Ceuta, Melilla, Segura y Júcar, y de la parte española de las demarcaciones hidrográficas del Cantábrico Oriental, Miño-Sil, Duero, Tajo, Guadiana y Ebro. «BOE» núm. 16, de 19/01/2016. Available at: https://www.boe.es/buscar/act.php?id=BOE-A-2016-439
Göta
Christensen, A. 2002. Utsläpp av kväve och fosfor frååpunktkällor vid Vänern (Emissions of nitrogen and phosphorus from point sources to Lake Vänern, In Swedish). In: Christensen A. (red.), Vänern-Årsskrift 2002. Vänerns vattenvårdsförbund, rapport 22.
Göta älvs vattenvårdsförbund. 2015. Fakta om Götaälv – en beskrivning av Göta älv och dess avrinningsområde nedströms Vänern 2015, Göta älvs vattenvårdsförbund, 2016. Available at: https://www.gotaalvvvf.org/download/18.2f0ad835166c596881356a83/1540998119692/fakta_om_gota_alv_webb.pdf
Sonesten, L. 2004. Kväve och fosfor till Vänern och Västerhavet - Transporter, retention och åtgärdsscenarier inom Göta älvs avrinningsområde (Nitrogen and Phosphorus to Lake Vänern and to the North Sea, In Swedish). SLU, Dept. Environmental Assessment (now Dept. of Aquatic Sciences and Assessment).
https://en.wikipedia.org/wiki/G%C3%B6ta_%C3%A4lv
Vattenmyndigheten Västerhavet, 2021, Förvaltningsplan för vatten 2021—2027 (Version for public consultation), Available at: https://www.vattenmyndigheterna.se/download/18.5df150191754f287d917a00/1603999914350/F%C3%B6rslag%20till%20f%C3%B6rvaltningsplan%202021-2027%20V%C3%A4sterhavet.pdf
Glomma
https://en.wikipedia.org/wiki/Glomma
Humber
Humber River Basin District descriptions. Available at: https://environment.data.gov.uk/catchment-planning/RiverBasinDistrict/4
Zhang, Y.; Collins, A.L.; Murdoch, N.; Lee, D.; Naden, P.S. (2014) Cross sector contributions to river pollution in England and Wales: Updating waterbody scale information to support policy delivery for the Water Framework Directive. Environmental Science & Policy, 42, pp 16-32. Available at: doi:10.1016/j.envsci.2014.04.010
https://environment.data.gov.uk/catchment-planning/RiverBasinDistrict/4
Zhang, Y.; Collins, A.L.; Murdoch, N.; Lee, D.; Naden, P.S. (2014) Cross sector contributions to river pollution in England and Wales: Updating waterbody scale information to support policy delivery for the Water Framework Directive. Environmental Science & Policy, 42, pp 16-32. Available at: doi:10.1016/j.envsci.2014.04.010
Hvítá-Ölfusá
Environment Agency of Iceland (2023). Icelandic River Basin Management Plan 2022-2027. Available at: https://ust.is/library/sida/haf-og-vatn/Icelandic%20RBMP%202022-2027_English%20summary_version%2023.1.2023.pdf
Skipulagsstofnun 2020. Available at: https://www.skipulag.is/media/attachments/Umhverfismat/1593/201910003%20Selfoss%20fraveita.pdf
Iceland’s Geen Economy (2013). Available at: https://www.grida.no/resources/4551
Loire
Meuse
Rijkswaterstaat (2009) River basin management plans a summary 2009-2015 Ems, Meuse, Rhine-Delta and Scheldt. Available at: https://puc.overheid.nl/rijkswaterstaat/doc/PUC_144832_31/
Rijkswaterstaat (2009) National Water Plan 2009-2015. Available at: https://puc.overheid.nl/PUC/Handlers/DownloadDocument.ashx?identifier=PUC_136178_31&versienummer=1
Burny P, Debode F (2013) Is organic farming the solution for the future of Walloon agriculture? In: The sixth international scientific conference” rural development 2013”. Proceedings, vol. 6, book 1. ASU Publishing Center, pp 514–517
EEA (2016) European environmental agency, Corine land cover 2006 raster data. Available at: https://www.eea.europa.eu/data-and-maps/data/clc-2006-raster-4. Accessed June 2022.
Minho
APA (2022). Plano de Gestão de Região Hidrográfica. 3º ciclo (2022-2027). Minho e Lima (RH1). Parte 1 – Enquadramento e Aspetos Gerais. Agência Portuguesa do Ambiente, 68p. Available at: https://apambiente.pt/sites/default/files/_Agua/DRH/ParticipacaoPublica/PGRH/2022-2027/3_Fase/PGRH_3_RH1_Parte1.pdf
APA (2022). Plano de Gestão de Região Hidrográfica. 3º ciclo (2022-2027). Minho e Lima (RH1). Parte 2 – Caracterização e Diagnóstico, Volume A. Agência Portuguesa do Ambiente, 149p. Available at: https://apambiente.pt/sites/default/files/_Agua/DRH/ParticipacaoPublica/PGRH/2022-2027/3_Fase/PGRH_3_RH1_Parte2_VolumeA.pdf
APA (2022). Plano de Gestão de Região Hidrográfica. 3º ciclo (2022-2027). Minho e Lima (RH1). Parte 3 – Análise Económica das Utilizações da Água. Agência Portuguesa do Ambiente, 166p. Available at: https://apambiente.pt/sites/default/files/_Agua/DRH/ParticipacaoPublica/PGRH/2022-2027/3_Fase/PGRH_3_RH1_Parte3.pdf
Confederación Hidrográfica del Miño-Sil (2022). Planificación hidrológica. Available at: https://www.chminosil.es/es/chms/planificacionhidrologica
Confederación Hidrográfica del Miño-Sil (2022). Informe del Consejo del Agua de la Demarcación sobre la propuesta de proyecto de revisión del Plan Hidrológico del Tercer ciclo de planificación: 2022-2027. Available at: https://www.chminosil.es/es/chms/planificacionhidrologica/proyecto-de-plan-hidrologico-2022-2027-version-consejo-del-agua-de-la-demarcacion
Confederación Hidrográfica del Miño-Sil (2022) Propuesta de Plan Hidrológico del Tercer ciclo de planificación 2022-2027 (Normativa). Available at: https://www.chminosil.es/images/planificacion/consulta-proyecto-ph-21-27/NORMATIVA/01.NORMATIVA.pdf
Confederación Hidrográfica del Miño-Sil (2022) Propuesta de Plan Hidrológico del Tercer ciclo de planificación 2022-2027 (Memoria). Available at: https://www.chminosil.es/images/planificacion/consulta-proyecto-ph-21-27/EAE/01.EAE_Y_RESUMEN_NO_TECNICO_EAE.pdf
Ministerio de Agricultura, Pesca y Alimentación (2016) Real Decreto 1/2016, de 8 de enero, por el que se aprueba la revisión de los Planes Hidrológicos de las demarcaciones hidrográficas del Cantábrico Occidental, Guadalquivir, Ceuta, Melilla, Segura y Júcar, y de la parte española de las demarcaciones hidrográficas del Cantábrico Oriental, Miño-Sil, Duero, Tajo, Guadiana y Ebro. «BOE» núm. 16, de 19/01/2016. Available at: https://www.boe.es/buscar/act.php?id=BOE-A-2016-439
Ölfusá
https://en.wikipedia.org/wiki/%C3%96lfus%C3%A1
https://en.wikipedia.org/wiki/Hv%C3%ADt%C3%A1_(%C3%81rness%C3%BDsla)
Rhine
IGN (2022) - Geoportail “Le Rhin”. Available at: https://www.geoportail.gouv.fr/plan/67482/strasbourg. Accessed June 2022.
KSR-CIPR-ICBR (2022) Internationaler Warn- und Alarmplan Rhein (IWAP) – Meldungen 2020. Available at: https://www.iksr.org/fileadmin/user_upload/DKDM/Dokumente/Fachberichte/FR/rp_Fr_0285_f.pdf
https://en.wikipedia.org/wiki/Rhine
Schedlt
ISC-CIE, 2005. Scheldt International River Basin District. Roof report. February 2005. Internationale Scheldecommissie (ISC) – Commission Internationale de l’Escaut (CIPE). (in Dutch / French)
ISC-CIE, 2015. Europese Kaderrichtlijn Water 2000/60/EG - Overkoepelend Deel Van Het Beheerplan van het Internationale Scheldestroomgebiedsdistrict / Directive-Cadre Européenne sur l’Eau 2000/60/CE - Partie Faitière du Plan de Gestion du District Hydrographique International de l’Escaut. ODB2-PFPG2_RAPPORT_NL-FR_VDEF, 18/12/2015. 111 p. (in Dutch / French)
UNECE, 2007. Scheldt River Basin District. p.199-202. In: UNECE, 2007. Our Waters: Joining Hands Across Borders. First Assessment of Transboundary Rivers, Lakes and Groundwaters. 373 p. Available at: https://unece.org/fileadmin/DAM/env/water/blanks/assessment/assessmentweb_full.pdf
UNECE, 2011. XIV. Scheldt River Basin, p. 44-51. In: UNECE, 2011. Assessment of transboundary waters discharging into the North Sea and Eastern Atlantic. United Nations, Economic and Social Council, Economic Commission for Europe - Convention on the Protection and Use of Transboundary Watercourses and International Lakes. Working Group on Monitoring and Assessment. ECE/MP.WAT/WG.2/2011/15. 2 May 2011. 75 p. Available at: https://unece.org/fileadmin/DAM/env/documents/2011/wat/WG2/ECE_MP_WAT_WG2_2011_15_North_Sea_Eastern_Atlantic.pdf
Seine
https://www.piren-seine.fr/publications/fascicules
https://www.piren-seine.fr/publications/fiches_4_pages
http://www.eau-seine-normandie.fr/domaines-d-action/sdage/etat-des-lieux
http://www.eau-seine-normandie.fr/domaines-d-action/sdage
Skjern
Andersen, J. M. (red.), Jessen, K., Boysen Larsen, B., Bundgaard, P., Glüsing, H., Illum, T., Berg Hansen, L., Damgaard, O., Koed, A., Baktoft, H., Harrekilde Jensen, J., Linnemann, M., Ovesen, N. B., Svendsen, L. M., Bregnballe, T., Skriver, J. , Baattrup-Pedersen, A., Pedersen, M. L., Madsen, A. B., Amstrup, O. & Bak, M. (2005): Restoration of Skjern River: Summary of monitoring results 199-2003, National Environmental research institute (in Danish), Aarhus University. 94 s. Scientific repprt from NERI no. 531
Larsen, S.E, & Svendsen, L.M. 2021. Statistical aspects in relation to Baltic Sea Pollution Load Compilation. Task under HELCOM PLC-8 project. Aarhus University, DCE – Danish Centre for Environment and Energy, 60 pp. Technical Report No. 224. Available at: http://dce2.au.dk/pub/TR224.pdf
Ministry of the Environment (2021). Proposal for River Management Plans 2021-2027 (in Danish) with appendixes, 271 pages. Available at: https://mim.dk/media/226716/vandomraadeplanerne-2021-2027.pdf
https://en.wikipedia.org/wiki/Skjern_River
Suir
Eva M. Mockler, Jenny Deakin, Marie Archbold, Laurence Gill, Donal Daly, Michael Bruen, Sources of nitrogen and phosphorus emissions to Irish rivers and coastal waters: Estimates from a nutrient load apportionment framework. Science of The Total Environment, 601–602, 2017. Available at: https://doi.org/10.1016/j.scitotenv.2017.05.186.
Tejo
APA (2022). Plano de Gestão de Região Hidrográfica. 3º ciclo (2022-2027). Tejo e Ribeiras do Oeste (RH5A). Parte 1 – Enquadramento e Aspetos Gerais. Agência Portuguesa do Ambiente, 72p. Available at: https://apambiente.pt/sites/default/files/_Agua/DRH/ParticipacaoPublica/PGRH/2022-2027/3_Fase/PGRH_3_RH5A_Parte1.pdf
APA (2022). Plano de Gestão de Região Hidrográfica. 3º ciclo (2022-2027). Tejo e Ribeiras do Oeste (RH5A). Parte 2 – Caracterização e Diagnóstico, Volume A. Agência Portuguesa do Ambiente, 194p. Available at: https://apambiente.pt/sites/default/files/_Agua/DRH/ParticipacaoPublica/PGRH/2022-2027/3_Fase/PGRH_3_RH5A_Parte2_VolumeA.pdf
APA (2022). Plano de Gestão de Região Hidrográfica. 3º ciclo (2022-2027). Tejo e Ribeiras do Oeste (RH5A). Parte 3 – Análise Económica das Utilizações da Água. Agência Portuguesa do Ambiente, 189p. Available at: https://apambiente.pt/sites/default/files/_Agua/DRH/ParticipacaoPublica/PGRH/2022-2027/3_Fase/PGRH_3_RH5A_Parte3.pdf
Confederación Hidrográfica del Tajo (2022). Planificación hidrológica http://www.chtajo.es/LaCuenca/Planes/PlanHidrologico/Paginas/default.aspx
Confederación Hidrográfica del Tajo (2022). Informe del Consejo del Agua de la Demarcación sobre la propuesta de proyecto de revisión del Plan Hidrológico del Tercer ciclo de planificación: 2022-2027 http://www.chtajo.es/LaCuenca/Planes/PlanHidrologico/Planif_2021-2027/Paginas/PropuestaPHT_2021-2027_ConsejoAgua.aspx
Confederación Hidrográfica del Tajo (2022) Propuesta de Plan Hidrológico del Tercer ciclo de planificación 2022-2027 (Normativa). http://www.chtajo.es/LaCuenca/Planes/PlanHidrologico/Planif_2021-2027/Documents/BorradorPHT_2021-2027/PHT2227_Normativa.pdf
Confederación Hidrográfica del Tajo (2022) Propuesta de Plan Hidrológico del Tercer ciclo de planificación 2022-2027 (Memoria). http://www.chtajo.es/LaCuenca/Planes/PlanHidrologico/Planif_2021-2027/Documents/BorradorPHT_2021-2027/PHT2227_Memoria.pdf
Ministerio de Agricultura, Pesca y Alimentación (2016) Real Decreto 1/2016, de 8 de enero, por el que se aprueba la revisión de los Planes Hidrológicos de las demarcaciones hidrográficas del Cantábrico Occidental, Guadalquivir, Ceuta, Melilla, Segura y Júcar, y de la parte española de las demarcaciones hidrográficas del Cantábrico Oriental, Miño-Sil, Duero, Tajo, Guadiana y Ebro. «BOE» núm. 16, de 19/01/2016. https://www.boe.es/buscar/act.php?id=BOE-A-2016-439
Weser
FGG Weser, 2020: Entwurf Bewirtschaftungsplans 2021 bis 2027 für die Flussgebietseinheit Weser gemäß § 83 – Anhörungsdokument 2020 zur Information der Öffentlichkeit gemäß § 83 Abs. 4 WHG und Art. 14, Abs. 1 (c), 2000/60/EG. Available at: https://www.fgg-weser.de/component/jdownloads/send/8-eg-wrrl/389-bwp2021-weser-textteil-entwuf-201222
FGG Weser, 2020: Entwurf Maßnahmenprogramm 2021 bis 2027 für die Flussgebietseinheit Weser gemäß § 83 – Anhörungsdokument 2020 zur Information der Öffentlichkeit gemäß § 83 Abs. 4 WHG und Art. 14, Abs. 1 (c), 2000/60/EG. Available at: https://www.fgg-weser.de/component/jdownloads/send/8-eg-wrrl/395-mnp2021-weser-texteil-entwurf-201222
Fuchs, S., Wander, R., Rogozina, T., Hilgert, S. (2011): The MoRE Handbook. Karlsruhe Institute of Technology. Institute for Water and River Basin Management. Available at: http://isww.iwg.kit.edu/MoRE.php
Fuchs, S.; Kaiser, M.; Kiemle, L.; Kittlaus, S.; Rothvoß, S.; Toshovski, S.; Wagner, A.; Wander, R.; Weber, T.; Ziegler, S. (2017): Modeling of Regionalized Emissions (MoRE) into Water Bodies: An Open-Source River Basin Management System. Water 2017, 9, 239. Available at: https://doi.org/10.3390/w9040239
https://en.wikipedia.org/wiki/Weser
Chapter 6
Axe, P., Sonesten, L., Skarbövik, E., Leujak, W. and Nielsen, L, 2022. Inputs of Nutrients to the OSPAR Maritime Area.In OSPAR, 2023: The 2023 Quality Status Report for the North-East Atlantic. OSPAR Commission, London. Available at: https://oap.ospar.org/en/ospar-assessments/quality-status-reports/qsr-2023/indicator-assessments/inputs-nutrients/
Chapter 7
Muylle, K.; Vannevel, R., 2000. Algemeen Waterkwaliteitsplan 2 (AWP 2)—1. IJzer; Vlaamse Milieumaatschappij: Aalst, Belgium.215 pp. (In Dutch)
Environment Agency, 2020. Overview of Solent Eutrophication and Recovery (External), Environment Agency, Solent and South Downs Area, Marine Team (Analysis & Reporting), April 2020. Available at: http://www.solentforum.org/services/Member_Services/css/Nutrients/Solent_Eutrophication.pdf
Footnotes
1 In Germany there are two different model approaches for determining nutrient loads. The MoRE approach used for the present QSR reporting provides good results for substance inputs into surface waters at the regional catchment area level. The further model approach AGRUM-DE also comes to very similar results after a model comparison in the magnitude of the calculated total inputs at subunit level. It has not yet been decided which model will be used for QSR reporting in the future. Due to the comparability of the results, this is of secondary importance for the further use of the data.
2 In Germany there are two different model approaches for determining nutrient loads. The MoRE approach used for the present QSR reporting provides good results for substance inputs into surface waters at the regional catchment area level. The further model approach AGRUM-DE also comes to very similar results after a model comparison in the magnitude of the calculated total inputs at subunit level. It has not yet been decided which model will be used for QSR reporting in the future. Due to the comparability of the results, this is of secondary importance for the further use of the data.
3 The Water Environment (Water Framework Directive) (England and Wales) Regulations 2017, The Water Environment (Water Framework Directive) Regulations (Northern Ireland) 2017 and Water Environment and Water Services (Scotland) Act 2003 transpose the Water Framework Directive into UK law.
Contributors
Lead authors: Lars Sonesten
Supporting authors: Philip Axe, Bert Bellert, Lugdiwine Burtschell, Didier Eumont, Vanessa Fairbank, Csilla Farkas, Carolyn Graves, Lucia Martínez García-Denche, Georgina McDermott, Lars Moeslund Svendsen, Julian Mönnich, Susana Nunes, Michael Pohl, Paulette Posen, Beatriz Sánchez Fernández, Eva Skarbøvik, Emmanuelle Thiesse, Rudy Vannevel and Robert Wilkes.
Supported by: Inputs to the Marine Environment Working Group and Hazardous Substances and Eutrophication Committee.
Citation
Sonesten, L., Axe, P., Bellert, B., Burtschell, L., Eumont, D., Fairbank, V., Farkas, C., Graves, C., Martínez García-Denche, L., McDermott, G., Moeslund Svendsen, L., Mönnich, J., Nunes, S., Pohl, M., Posen, P., Sánchez Fernández, B., Skarbøvik, E., Thiesse, E., Vannevel, R. and Wilkes, R. 2022. Waterborne and Atmospheric Inputs of Nutrients and Metals to the Sea. In: OSPAR, 2023: The 2023 Quality Status Report for the Northeast Atlantic. OSPAR Commission, London. Available at: https://oap.ospar.org/en/ospar-assessments/quality-status-reports/qsr-2023/other-assessments/inputs-nutrients-and-metals