

Pilot assessment of Changes in Plankton Diversity
D1 - Biological Diversity
D1.6 - Habitat condition D1.7 - Ecosystem Structure
Phytoplankton form the base of marine food webs and respond rapidly to environmental change. Variations in plankton community composition affect other pelagic and benthic organisms. This pilot study shows that diversity indices detect trends and significant shifts in community composition. Integrating this indicator with other plankton indicators will improve future assessments.
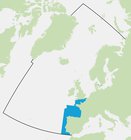
Area assessed
Printable Summary
Background
Phytoplankton are plant-like microscopic organisms that occur in the sunlit layers of the ocean and freshwater systems (Figure 1). Monitoring phytoplankton can help inform our understanding of how sustained long-term and / or rapid changes in biodiversity can alter marine ecosystem functioning and impact the services they provide to humans. Phytoplankton are already being used as indicators for water quality assessments, such as in the European Union Water Framework Directive (WFD).
While plankton diversity has been adopted as an OSPAR common indicator for the Celtic Seas, this pilot assessment presents results for five sites in the Greater North Sea and Bay of Biscay and Iberian Coast since the only data available to test this indicator was from these regions (Figure 2).
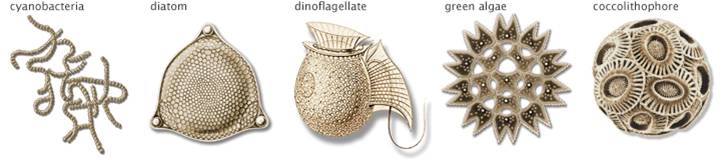
Figure 1: Five examples of phytoplankton groups
Phytoplankton are extremely diverse, varying from photosynthesising bacteria (cyanobacteria), to plant-like green micro-algae, silicon-armoured diatoms, dinoflagellates, plant-like green algae and calcite-plated coccolithophores (drawings not to scale). (adapted from Sally Bensusen, NASA Earth Observing System Project Science Office and NASA Earth Observatory)
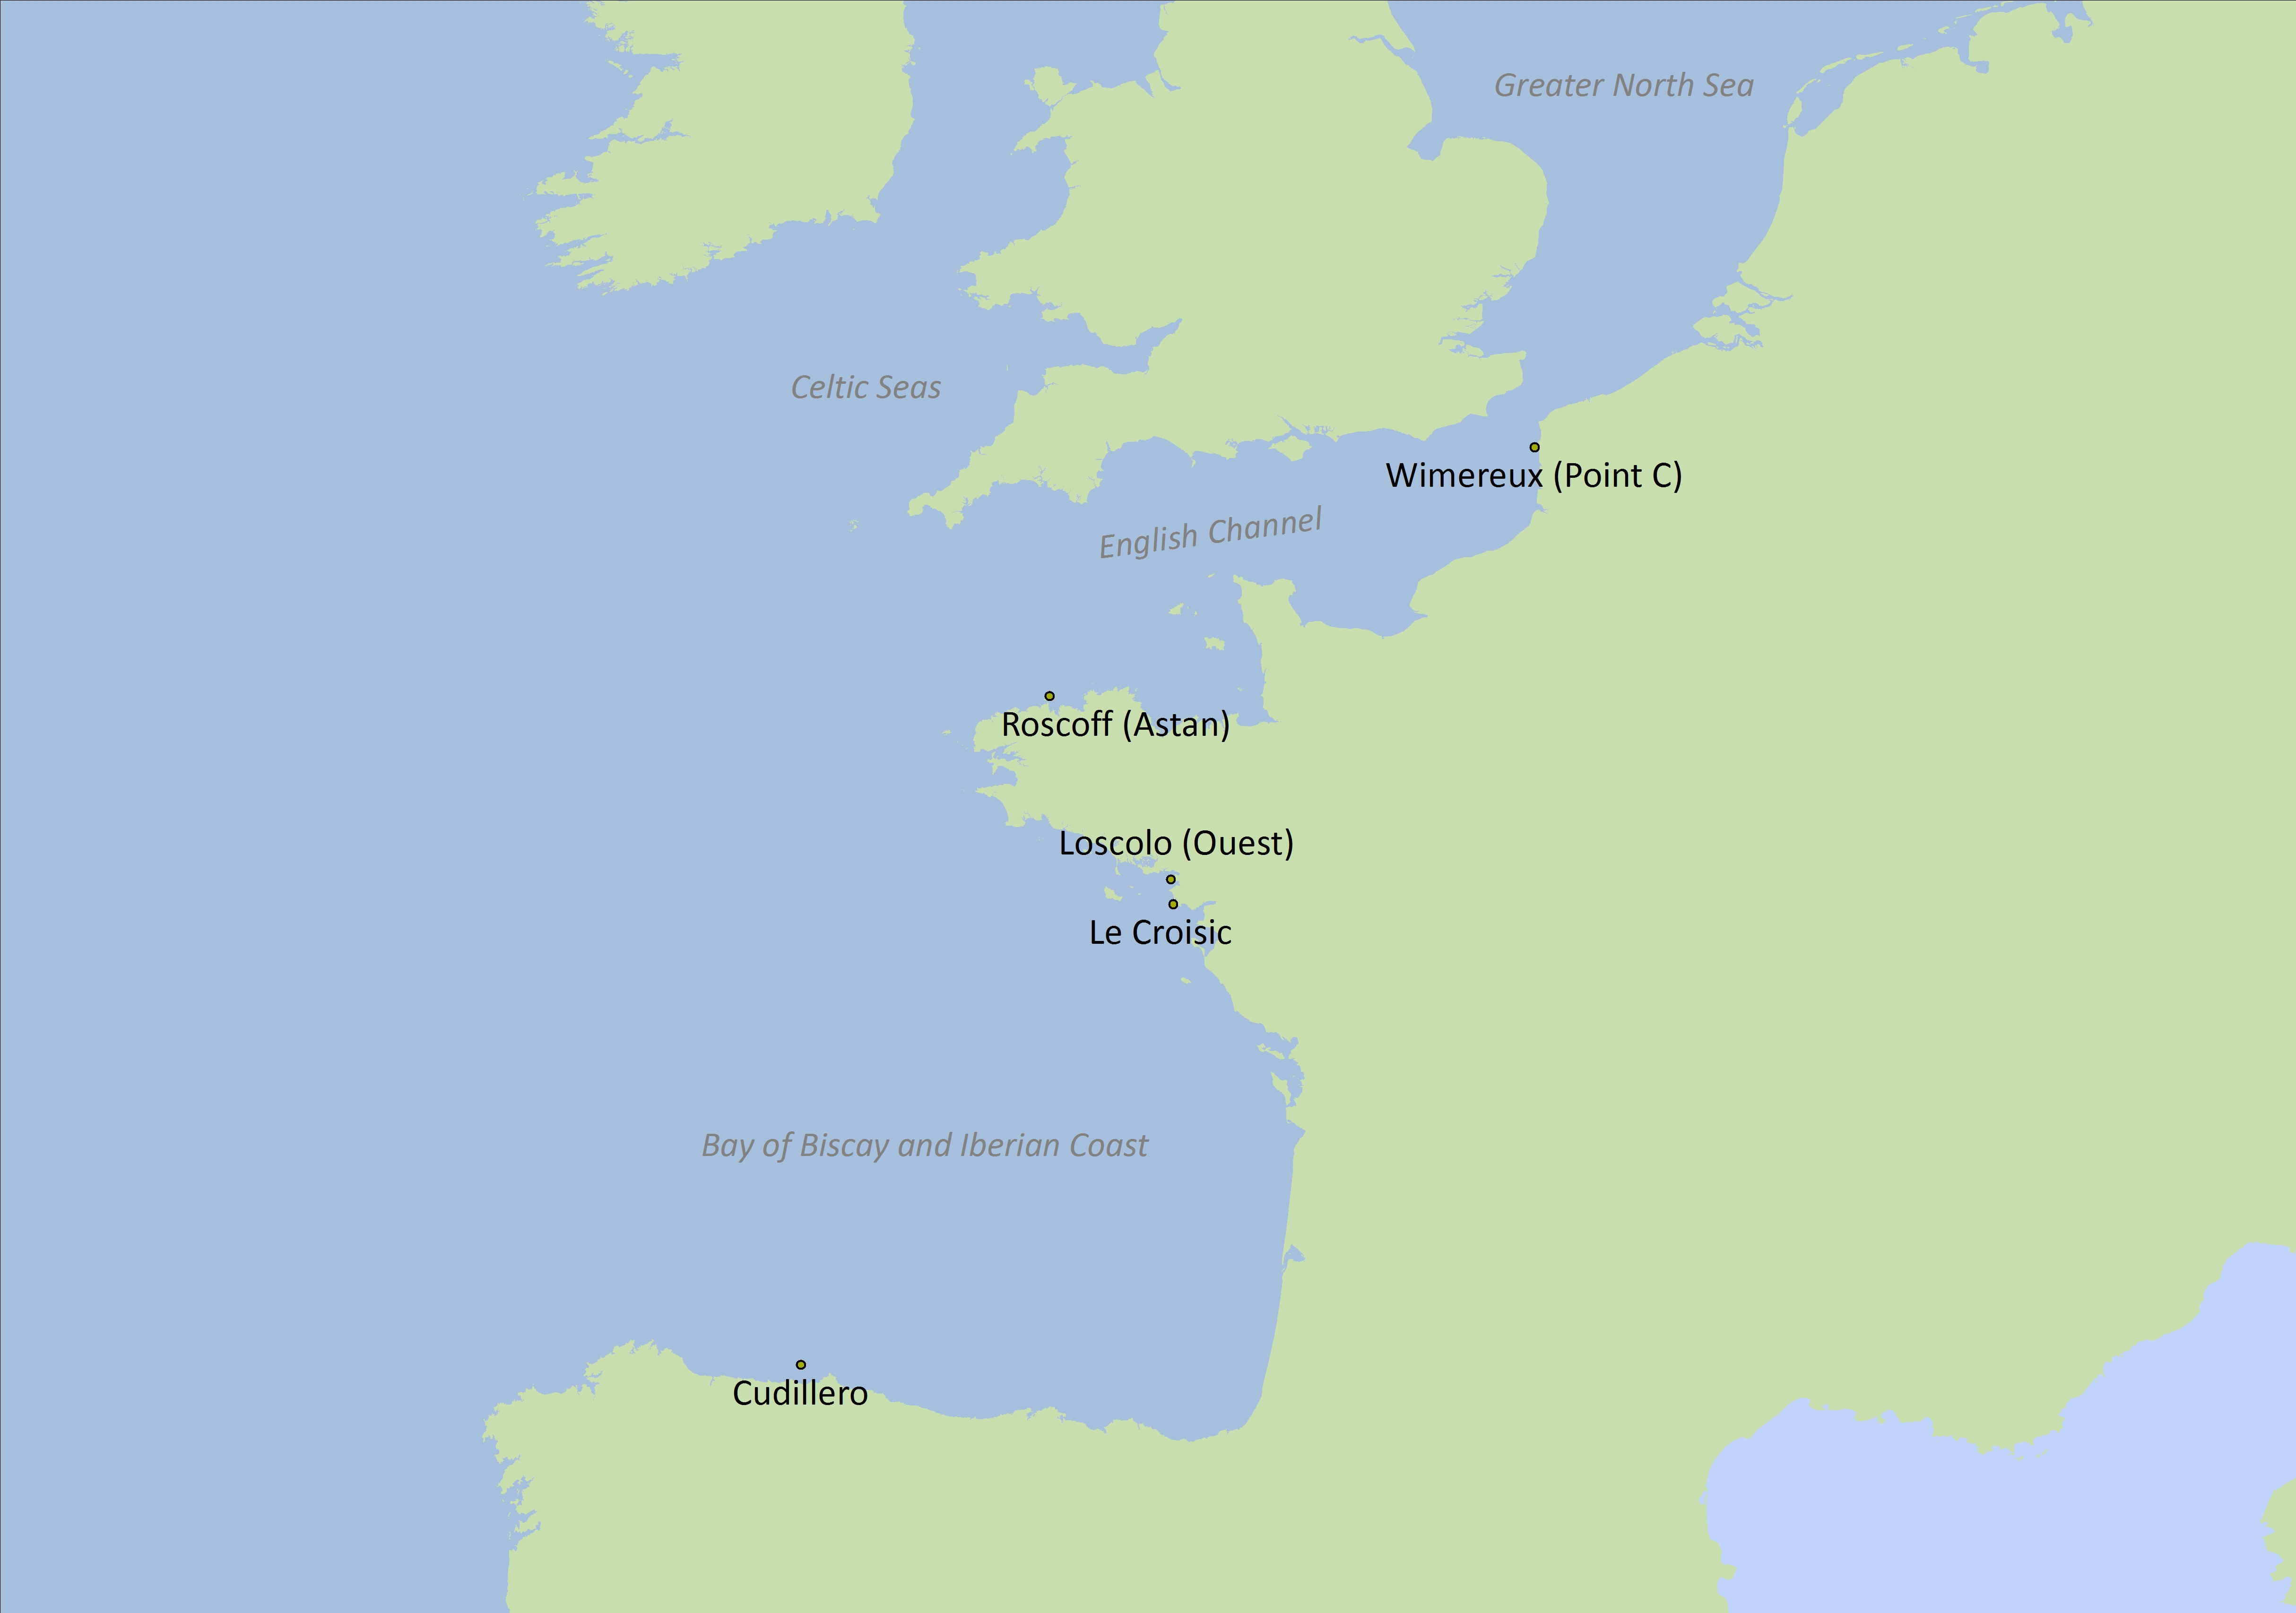
Figure 2: Locations of the five time series
Species composition and abundance are influenced by changes in physical and chemical environmental conditions. As a result, phytoplankton communities can fluctuate in space and time. Human-induced disturbances such as pollution and / or eutrophication (i.e. excessive nutrients) can drive marked changes in community composition because only some species can cope with the changed habitat conditions. Consequently, the dynamics of the phytoplankton community, and thus its structural attributes (e.g. diversity, dominance or size structure), will differ from those of natural (undisturbed) communities. To help assess dominance, an analysis of community variance is made over time. Low community variation characterises a site with average species composition over time (little change over time), whereas large community variance may indicate sites that have shifted to a species-poor state.
In order to quantify changes in biodiversity, indices based on the number of species and / or their relative abundances in the community can be calculated. ‘Species richness’ was recently identified as an Essential Biodiversity Variable, a measurement required for studying, reporting and managing biodiversity change (Pereira et al., 2013). There are many indices in the scientific literature to quantify species diversity but their use in a management context depends on: the objective of the study; their ecological relevance; the mathematical properties; and ease of interpretation by stakeholders.
Few community composition indicators of environmental status have been applied to date and this probably reflects the difficulty in setting reference conditions and environmental objectives for these indicators (Garmendia et al., 2013). The response of phytoplankton communities to human pressures is often non-linear, making it difficult to identify clear state-pressure linkages. On the other hand, the main advantages of using diversity indices is their advanced development within the scientific literature and their ease of calculation.
While chlorophyll-a has been widely used as an indicator of eutrophication, several other metrics such as species abundance and community composition are currently being promoted for water quality assessment (Caroppo et al., 2013; Garmendia et al., 2013). OSPAR’s assessment of chlorophyll-a concentrations in the OSPAR Maritime Area can be found here. In contrast to indicators of environmental status based on chlorophyll-a, diversity indices (based on abundance and richness) are generally calculated on the entire plankton community, including heterotrophic species, and will therefore provide additional information for assessing pelagic habitats (Domingues et al., 2008). The integration of chlorophyll-a with composition data may provide an even better understanding of environmental conditions, because the inclusion of additional metrics can increase the sensitivity of an index (Garmendia et al., 2013).
Several case studies have examined the potential use of diversity indices in relation to a pressure gradient. In the Aegean Sea, for example, Spatharis and Tsirtsis (2010) evaluated the efficiency of diversity indices for various sites, previously classified by methods based on nutrient concentrations or phytoplankton data. The results indicate that the phytoplankton metrics proposed (chlorophyll-a, abundance, and species composition) individually contribute to the assessment thus showing differences in the final classification of areas. Therefore, use of comprehensive indices could be a promising approach for the integration of assessments of coastal water quality in the framework of European policies (Spatharis and Tsirtsis, 2010).
In French waters, for example, a multi-metric index called the Phytoplankton Index for Lakes (IPLAC) (Laplace-Treyture and Feret, 2016), that includes both phytoplankton biomass and species composition, has been developed for assessing the quality of lakes under the European Union Water Framework Directive (WFD). Other applications include studies in transitional waters and coastal lagoons (Pereira Coutinho et al., 2012; Facca et al., 2014), where similar multi-metric indices, including species composition, were used to assess water quality in relation to trophic and pollutant levels.
Work to progress development of this Indicator Assessment has been undertaken during the European Union co-financed EcApRHA project, coordinated by OSPAR to address gaps in biodiversity indicator development.
Phytoplankton assemblages are generally characterised by a few common and many rare species, and they exhibit spatial and temporal compositional variability. As for terrestrial plant assemblages, phytoplankton communities are characterised by an ordered sequence of substitutions of species, that is, seasonal succession (Reynolds, 2006). The causes of succession are the reactivity and interactions of the species to favourable environmental conditions throughout the year, such as seasonal changes in temperature, water column mixing / stratification, nutrient loading and light availability (Chalar, 2009). Other processes act on periods of days to weeks, such as meteorological events (wind, rain, cloudiness) and hydrological events (upwelling / downwelling, hydrological withdrawal, water level fluctuations). In the long term, phytoplankton assemblages also react to climate change and to large-scale processes such as variability in atmospheric circulation patterns (e.g. North Atlantic Oscillation). Hence, it is important to consider phytoplankton diversity at multiple time-scales.
The aim of the assessment using diversity indices is not only to quantify the total community composition but also to be able to detect changes in the structure of the community on a seasonal and annual basis. Indices to quantify biological diversity are numerous, but the choice of the most appropriate and the most sensitive index to calculate community diversity is difficult.
Considering several indices that focus primarily on the number of species (or richness) and / or the dominance of a few species within the community will provide a holistic image of community structure that is not possible when using each index separately. Examples of the former include the Species richness (S), Menhinick (D), and Margalef (d) indices, while examples of the latter include the Shannon, Berger-Parker, and Hulburt (δ) indices. From multivariate analyses, it was found that the Menhinick Index was the most sensitive index to changes in environmental conditions. Therefore, it was decided to use the Menhinick Index for assessing species richness in this assessment. Species richness (S) of phytoplankton was not included in this assessment because it is highly correlated to sampling effort and to the level of taxonomic expertise, which has the potential to bias the results.
Many ‘dominance’ indices exist in the literature and are often highly intercorrelated. In relation to the most commonly used indices (including the Shannon Wiener Index, Simpson's Index and Brillouin Index), the Hulburt Index (δ) was judged to be the easiest to interpret, as suggested by Facca et al. (2014). Therefore it was decided to use the Hulburt Index for assessing species dominance.
In this assessment, bimonthly phytoplankton data from microscopic counts were used. To calculate the indices, data on abundance were considered at the genus level, but diversity can also be calculated at other taxonomic resolutions. The Menhinick and Hulburt indices were calculated for every month in each time series, as outlined in Table a. Only years where all months were sampled were used in the analyses.
The Menhinick index (D; Whittaker, 1977) measures taxonomic richness but is more sensitive to environmental change than other richness indices.

where S is the number of taxa and N is the number of individuals.
The Hulburt Index (δ; Hulburt, 1963) is a measure of dominance and is relatively easy to interpret since it is expressed as a percentage.
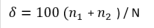
where n1 is the abundance of the dominant genus and n2 is the abundance of the second most abundant genus and N is the total abundance.
In order to relate the Hulburt Index to water quality, the ‘100 - δ’ value was used, in line with the classic theory by which dominance phenomena and changes in community composition occur in impacted areas (Howarth et al., 2000; Facca et al., 2014).
Other indices exist that quantify the onset and amplitude of variations in community structure. Temporal beta diversity is the variation in community composition with time in a study area (Legendre and Gauthier, 2014). More specifically, the Local Contributions to Beta Diversity (LCBD) indices were calculated, which indicate how much each observation contributes to beta diversity; for example, a site with an average species composition would have an LCBD value of 0. Large LCBD values may indicate sampling units (in time) that have high conservation value or, perhaps, degraded and species-poor sites that are in need of restoration (Legendre and De Cáceres, 2013). High values may also correspond to special ecological conditions, or may result from the disturbance effect of invasive species on communities (i.e. differing from the normal condition in a positive or a negative way). As such, LCBD indices are comparative indicators of the ecological uniqueness of the sampling units along the time series.
Temporal beta diversity was computed as the total community composition variance across years following the method described in detail by Legendre and De Cáceres (2013; Figure a). Only monthly abundance time series data (genus level) from the Ouest Loscolo and Le Croisic sites (in the Bay of Biscay) were considered, because these long time series provided the most robust analyses compared to the other available data sets.
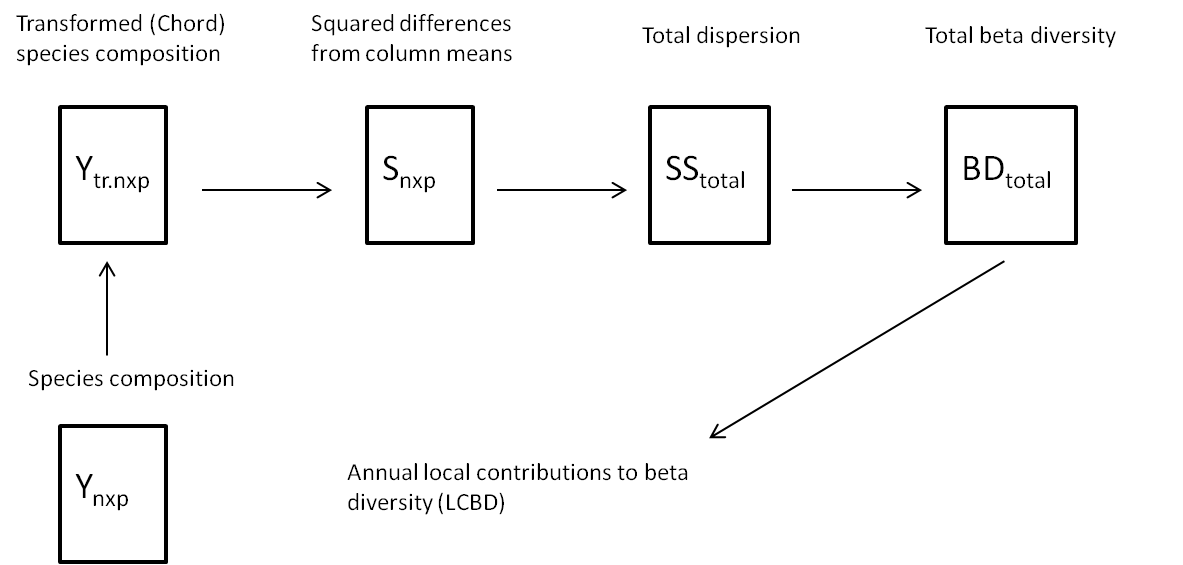
Figure a: Schematic diagram representing the method used to compute beta diversity as the total variance in species composition
(adapted from Legendre and De Caceres, 2013)
| Sites | Database | Coordinates | Region | Time series |
|---|---|---|---|---|
| Roscoff (Astan) | RESOMAR-PELAGOS | Lat:48,772 Lon: -3,968 | Greater North Sea | 2007-2013 |
| Wimereux (Point C) | RESOMAR-PELAGOS | Lat:50,679 Lon: 1,5213 | Greater North Sea | 2006-2012 |
| Croisic* | Ifremer- Quadrige | Lat:47,273 Lon: -2,504 | Bay of Biscay | 1988-2014 |
| Loscolo (Ouest)* | Ifremer-Quadrige | Lat:47,457 Lon: -2,538 | Bay of Biscay | 1988-2014 |
| Cudillero | RADIALES | Lat:43,7 Lon: -6,15 | Bay of Biscay | 1999-2006 |
All time series are currently ongoing and are available from the following dataportals RESOMAR-PELAGOS, Ifremer-Quadrige-REPHY (marked by *) and EmoDNET .
Results
For this pilot assessment, which is a proof of concept, plankton diversity indices have been calculated to examine the seasonal and annual variability in phytoplankton community composition at five sites: four in French waters and one in Spanish waters. The amplitude of the variation in the phytoplankton community was also assessed to identify years where significant changes, or shifts in species composition, have taken place.
The results of this pilot assessment show that diversity indices are useful to describe the structure of the phytoplankton community and also variability of this structure.
Species dominance is highly variable between years and variations are site-specific (Figure 3). For the longer time-series (i.e. sites in the Bay of Biscay), a peak in dominance is shown in 2007–2008 but a long-term trend is difficult to identify. For the shorter time-series, i.e. sites in the Greater North Sea (Roscoff and Wimereux), there appears to be a tendency towards increased dominance from 2006 onwards, although care should be taken in trying to interpret trends for such a short period.
For Ouest Loscolo and Le Croisic in the Bay of Biscay (which both have a time series of 26 years), 2007 and 2008 were identified as years with a temporary shift to relatively high community variation (Figure 4). Inspection of the phytoplankton community composition, revealed unusually high abundance of Leptocylindrus spp. at Ouest Loscolo and a peak in abundance of Lepidodinium spp. at Le Croisic. However, the reasons for the high abundances of these species are still unclear.
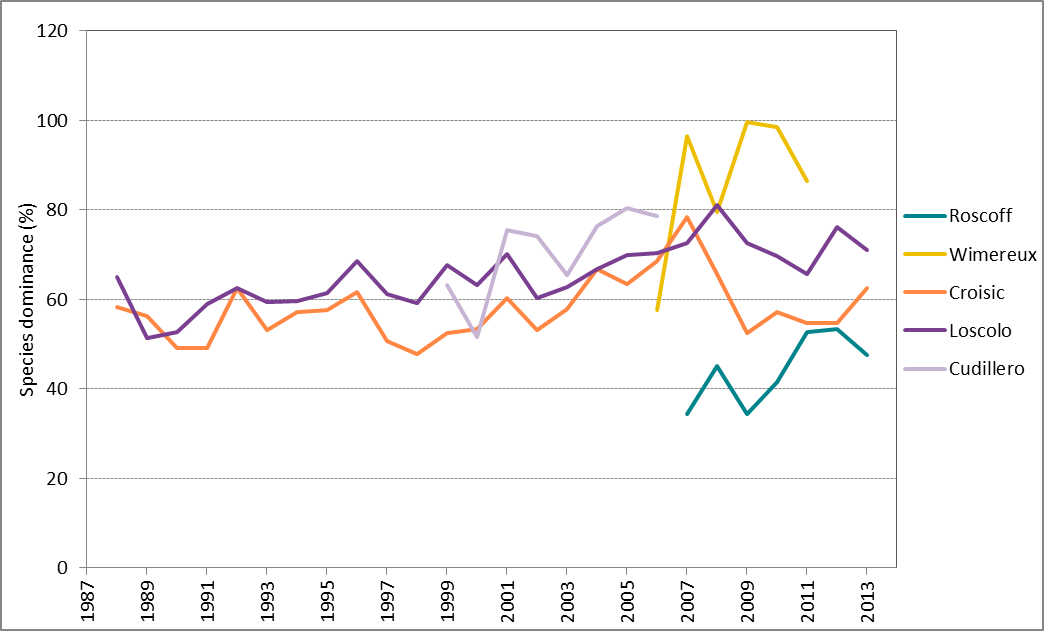
Figure 3: Trends in percentage species dominance (annual averages) at Roscoff (2007–2013), Wimereux (2006–2012), Le Croisic (1988–2014), Ouest Loscolo (1988–2014) and Cudillero (1999–2006)
Higher values indicate dominance by few species, whereas lower values indicate a more even balance among species
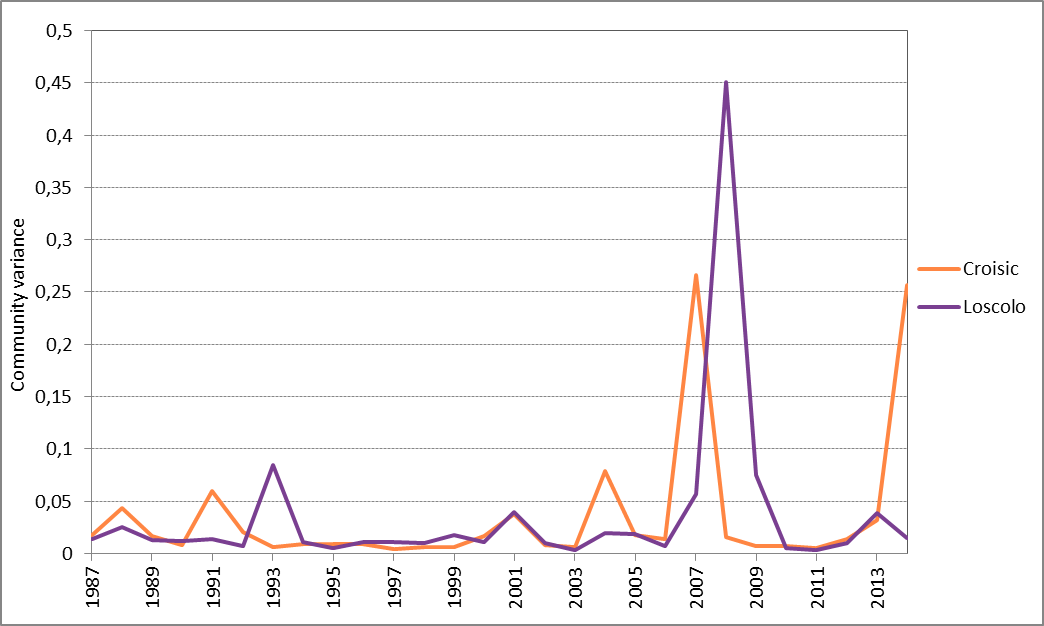
Figure 4: Annual average phytoplankton community variance for Ouest Loscolo and Le Croisic
Diversity indices which focus on the number of species (expressed as genus richness) (Menhinick; D) and dominance within the community (Hulburt Index; δ) were calculated for each month across all years of the time series. Since classic analytical techniques (microscopic counts) allow only the bigger size-fraction of the community to be quantified, true diversity (expressed as richness and dominance in this case) is likely to be under-estimated in most studies dealing only with microscopic counts (including the present study). Since datasets originated from different sources, spatial comparison could be incorrect and so only relative changes within each site should be examined.
Seasonal dynamics were shown to be site-specific, however, the winter months were the most diverse across all sites (Figure b). Roscoff (Greater North Sea) shows the strongest seasonal variation in species richness with a peak at the end of winter. Le Croisic (Bay of Biscay) shows the most consistent pattern across years with a distinct peak in dominance in spring and summer (Figure c), whereas the nearby site of Ouest Loscolo had shown a less distinct peaks in spring, at the beginning of summer and in early autumn (Figure c). One reason for this could be that the latter site may experience more variable environmental conditions and less direct influence of continental nutrient inputs which favour phytoplankton blooms and the resulting high dominance of particular species.
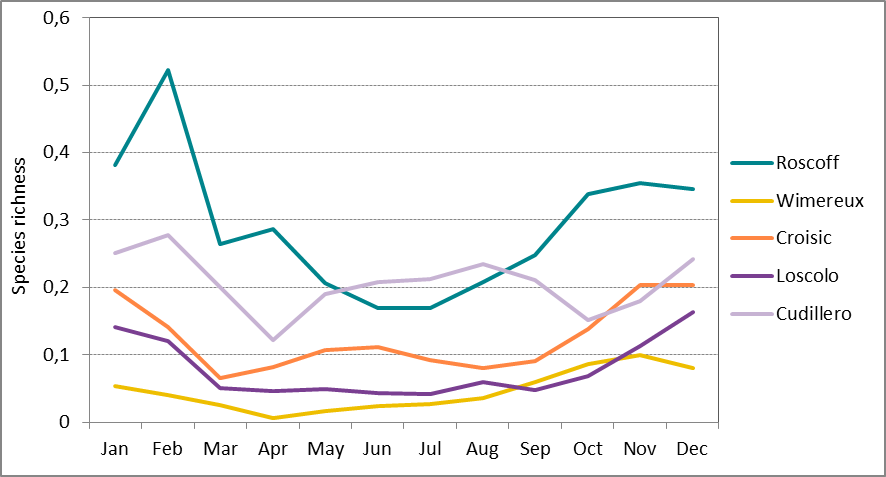
Figure b: Long-term monthly-average species richness at Roscoff (Astan) (2007-2013), Wimereux (Point C) (2006-2012), Le Croisic (1988 – 2014), Ouest Loscolo (1988-2014) and Cudillero (1999-2006)
(see table a for time series)
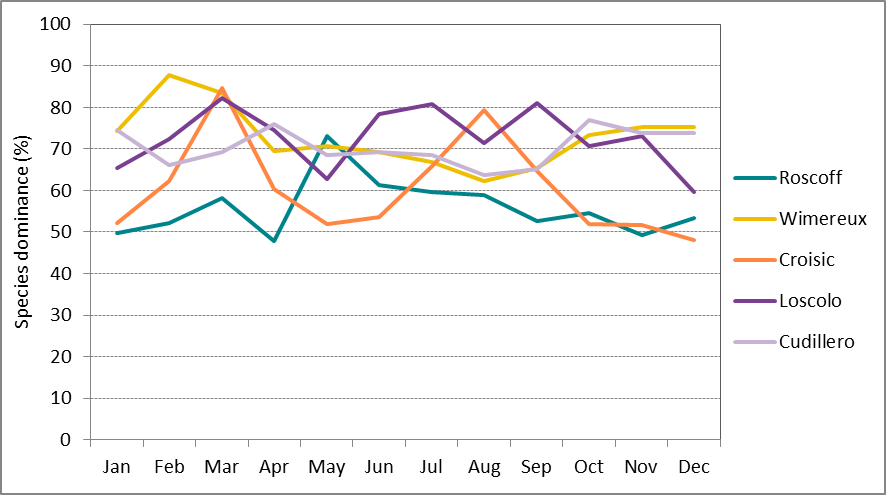
Figure c: Long-term monthly-average species dominance at Roscoff (Astan) (2007-2013), Wimereux (Point C) (2006-2012), Le Croisic (1988 – 2014), Ouest Loscolo (1988-2014) and Cudillero (1999-2006)
Higher values indicate dominance by a few species, whereas lower values indicate a more even balance among species.
The high LCBD coefficients (community variance, see Figure 4) observed in 2007 to 2008 for Ouest Loscolo and Le Croisic indicate an important change / shift or uniqueness in species composition. In effect, this temporal variation was driven by two unusually abundant species in that year, namely Leptocylindrus spp. (Ouest Loscolo) and Lepidodinium spp. (Le Croisic). Further analyses could determine the factors that are responsible for the shift.
Whereas data on nutrient concentrations were available for most of the stations in this assessment, a clear link between diversity indices and nutrients could not yet be established. Further work could determine the sensitivity of these diversity measures to human pressures such as nutrient enrichment.
Conclusion
For the longer time series in this pilot study (Ouest Loscolo and Le Croisic, both Bay of Biscay), the diversity indices show 2007 to 2008 to be years with high dominance values. A corresponding shift in community composition was also identified. The community composition data showed these extreme events were marked by an unusually high abundance of one genus, namely Leptocylindrus spp. (a diatom - at Ouest Loscolo) and Lepidodinium spp. (a dinoflagellate - at Le Croisic).
As would be expected, the number of species is related to the dominance in the community. When one or a few species become extremely abundant (i.e. dominance increases), the overall number of species in the community (richness) decreases. Variations in the number of taxa and the dominance of phytoplankton species appear to be site-specific. This variation will be a reflection of the prevailing physiographic conditions and human pressures at the individual sites but could provide early warning of where there will be consequences for other pelagic and benthic organisms.
This pilot assessment shows that plankton diversity indices are a promising tool to assess plankton communities. However, for a more robust assessment of pelagic habitats, other measures such as total biomass / abundance of the community and information on functional groups should be included so that a multi-metric indicator could be developed.
The proof of concept presented here may be applicable to data in the Celtic Seas. It is also expected that it would also be suitable for application in other OSPAR regions, depending on data availability.
Seasonal and annual dynamics of phytoplankton diversity were site-specific and therefore, assessments should be undertaken to include information on the environmental conditions for each site to interpret the results. Furthermore, information (e.g. changes in gear used, different people analysing the data, weather events, etc.) from the data holders at each of the sites could help to identify unusual events taking place in their local pelagic system. In the future, by extending the geographic scope, the robustness of the assessment could be further determined as a regional indicator of environmental status across the OSPAR Maritime Area. Spatial comparison between sites was not carried out because this requires homogeneity in data sampling and analysis and only limited data was available. In any case, such homogeneity is seldom achievable when data originate from different projects. Increased effort at both national and international scales will be needed to implement coherent monitoring of phytoplankton across European waters.
Knowledge Gaps
For a regional assessment, better acquisition of region-wide plankton data is required, including offshore stations. Appropriate training of taxonomists (to ensure comparable results) as well as the integration of semi-automated sampling techniques (to increase spatial coverage) are recommended for the implementation of monitoring programmes on a regional scale.
This indicator has been used as a proof of concept to assess the state of the phytoplankton community. For a more robust assessment of the pelagic habitat, information on the community structure of phytoplankton should be supplemented by other parameters, such as total community biomass / abundance and the dynamics of their functional groups.
This assessment used currently available data from coastal French and Spanish waters (time series at fixed stations). Therefore, no robust wider regional assessment could be undertaken due to a lack of available data, especially for offshore regions, and / or common methodologies across datasets. To fill the gaps in geographic coverage, data from regular scientific cruises could be used to assess spatial variations in phytoplankton community composition. More datasets will be added in future analyses, for example zooplankton data from the Continuous Plankton Recorder. In addition, common methodologies and taxonomic guides (Avancini et al., 2006) are available at the national level, but more effort is needed for the implementation of monitoring programmes at a regional scale (Caroppo et al., 2013).
Conventional sampling protocols for characterising marine phytoplankton communities consist of collecting a small volume of seawater which is analysed under the microscope for species identification and cell counting. However, microscopic counts data has its limitations, notably for estimating the smaller cells in the plankton community. While microscopic counts consider only a fraction of the community and are subject to biases due to differences in taxonomic expertise, the application of state-of-the-art (semi-)automated methods, such as flow-cytometry (Bonato et al., 2015; Morán et al., 2015; Thyssen et al., 2015) and image analysis, such as FlowCAM (Álvarez et al., 2013) could increase the range of organisms considered and allow higher spatial and temporal resolution. Molecular approaches, on the other hand, allow for the whole range of sizes at the finest taxonomical resolution to be considered. DNA barcoding and meta-barcoding, for example, have the potential to increase speed, accuracy and resolution of species identification, while decreasing its cost in biodiversity monitoring (Ji et al., 2013). Hence, combining methods may fill the gaps in microscopic examinations and the complementary methods will allow for monitoring the whole size range of the phytoplankton community.
The biological component of pelagic habitats also includes zooplankton, the animal part of the plankton. Development of zooplankton indicators is less advanced (and fewer data than for phytoplankton are currently available for stations) and so a major activity is required to understand potential community responses to human pressures.
To assess the environmental status of Pelagic Habitats, each of the three OSPAR assessments on Pelagic Habitats (Changes of plankton functional types (lifeform) index ratio, Plankton biomass and / or abundance, and this assessment) consider the community at different levels of community assembly, namely at the lifeform (functional) level; at the level of aggregated community properties (total biomass / abundance); and at the organism level. Therefore, by combining the information from these three indicators, a more holistic assessment of plankton dynamics could be obtained.
Álvarez, E., Moyano, M., López-Urrutia, A., Nogueira, E., Scharek, R. (2013) Routine determination of plankton community composition and size structure: a comparison between FlowCAM and light microscopy J. Plankton Res. 1-15.
Avancini M, AM Cicero, I Di Girolamo, M Innamorati, E Magaletti, T Sertorio & T Zunini. 2006. Guida al riconoscimento del plancton dei mari italiani, Vol. I. Fitoplancton, Vol. 2. Zooplancton. Ministero dell’Ambiente e della Tutela del Territorio e del Mare, ICRAM, Rome.
Bonato, S., Christaki, U., Lefebvre, A., Lizon, F., Thyssen, M., Artigas, L.F. (2015). High spatial variability of phytoplankton assessed by flow cytometry, in a dynamic productive coastal area, in spring: the eastern English Channel. Estuarine Coastal And Shelf Science, 154, 214-223.
Caroppo, C., Buttino, I., Camatti, E., Caruso, G., De Angelis, R., Facca, C., Giovanardi, F., Lazzara, L., Mangoni, O., Magaletti, E. (2013) State of the art and perspectives on the use of planktonic communities as indicators of environmental status in relation to the EU Marine Strategy Framework Directive. 44° Congresso della Società Italiana di Biologia Marina Roma, 14-16 maggio 2013
Chalar, C. (2009) The use of phytoplankton patterns of diversity for algal bloom management. Limnology 39: 200-208.
Domingues, R.B., Barbosa, A., Galvão, H., (2008). Constraints on the use of phytoplankton as a biological quality element within the Water Framework Directive in Portuguese waters. Mar. Pollut. Bull. 56, 1389–1395.
Facca, C., Aubry, F.B., Socal, G., Ponis, E., Acri, F., Bianchi, F., Giovanardi, F. and Sfriso, A. (2014). Description of a Multimetric Phytoplankton Index (MPI) for the assessment of transitional waters, Marine Pollution Bulletin, 79 (1–2): 145-154.
Garmendia, M., Borja, A. Franco, J., Revilla, M. (2013). Phytoplankton composition indicators for the assessment of eutrophication in marine waters: Present state and challenges within the European directives, Marine Pollution Bulletin 66(1–2):7-16.
Howarth, R., Anderson, D., Cloern, J., Elfring, C., Hopkinson, C., Lapointe, B., Malone, T., Marcus, N., McGlathery, K., Sharpley, A., Walker, D. (2000). Nutrient pollution of coastal rivers, bays, and seas. Issues in Ecology 7: 2–15.
Hulburt, E.M. (1963). The diversity of phytoplankton population in oceanic, coastal and estuarine regions. J. Mar. Res. 21, 81–93.
Ji, Y., Ashton, L., Pedley, S.M., Edwards, D.P., Tang, Y. (2013) Reliable, verifiable and efficient monitoring of biodiversity via metabarcoding. Ecol Letters 16: 1245–1257.
Laplace-Treyture,C. and Feret,T. (2016) Performance of the Phytoplankton Index for Lakes (IPLAC): A multimetric phytoplankton index to assess the ecological status of water bodies in France, Ecological Indicators 69: 686-698.
Legendre, P. and De Cáceres, M. (2013) Beta diversity as the variance of community data: dissimilarity coefficients and partitioning. Ecology Letters 16: 951-963.
Legendre, P. and Gauthier, O. (2014) Statistical methods for temporal and space-time analysis of community composition data. Proceedings of the Royal Society B 281:20132728.
Morán, X.A.G, Alonso-Sáez, L., Nogueira, E., Ducklow, H.W., González, N., Ángel López-Urrutia, A., Díaz-Pérez, L., Calvo-Díaz, A., Arandia-Gorostidi, N., Huete-Stauffer, T.M. (2015) More, smaller bacteria in response to ocean’s warming? Proceedings of the Royal Society B 282: 20150371.
Pereira Coutinho, M.T., Brito, A.C., Pereira,, P., Gonçalves, A.S., Moita, M.T. (2012) A phytoplankton tool for water quality assessment in semi-enclosed coastal lagoons: Open vs closed regimes, Estuarine, Coastal and Shelf Science 110: 134-146.doi:10.1016/j.ecss.2012.04.007.
Pereira, H. M., S. Ferrier, M. Walters, G. N. Geller, R. H. G. Jongman, R. J. Scholes, M. W. Bruford (2013) “Essential Biodiversity Variables.” Science 339 (6117): 277–278. doi:10.1126/science.1229931.
Reynolds, C. (2006) Ecology of phytoplankton. Cambridge University Press.
Spatharis, S. and Tsirtsis, G. (2010) Ecological quality scales based on phytoplankton for the implementation of Water Framework Directive in the Eastern Mediterranean. Ecological Indicators 10: 840–847
Thyssen, M., Alvain, S., Lefèbvre, A., Dessailly, D., Rijkeboer, M., Guiselin, N., Creach, V., and Artigas, L.-F. (2015) High-resolution analysis of a North Sea phytoplankton community structure based on in situ flow cytometry observations and potential implication for remote sensing, Biogeosciences, 12, 4051-4066.
Whittaker, R.H. (1977) Evolution of species diversity in land communities. Evolutionary Biology 10: 1-67.
| Sheet reference | BDC17/D114 |
|---|---|
| Assessment type | Intermediate Assessment |
| Context (1) | Biological Diversity and Ecosystems - Targeted actions for the protection and conservation of species, habitats and ecosystem processes |
| Context (2) | OSPAR CEMP Guideline for Phytoplankton diversity (in prep) |
| Context (3) | D1 - Biological Diversity |
| Context (4) | D1.6 - Habitat Condition, D1.7 - Ecosystem Structure |
| Point of contact | OSPAR Secretariat |
secretariat@ospar.org | |
| Metadata date | 2015-12-01 |
| Title | Changes in plankton diversity |
| Resource abstract | Analysis of phytoplankton community composition for marine water quality assessment under the MSFD. |
| Linkage | http://resomar.cnrs.fr/bases/pelagos/index.php |
| Linkage | http://envlit.ifremer.fr/resultats/quadrige |
| Linkage | http://www.emodnet-biology.eu |
| Topic category | Environment |
| Indirect spatial reference | L3.2.2.1;L3.2.6.1;L3.4.1.1;L3.4.1.4;L3.4.1.5;L3.2.6.2;L3.2.2.5;L3.2.2.2;L3.2.2.3;L3.2.2.4;L3.3.1.8;L3.4.1.6 |
| N Lat | 51.3039005369803 |
| E Lon | 2.54486264569459 |
| S Lat | 36.0000000001 |
| W Lon | -10.9999999995003 |
| Countries | ES, FR |
| Start date | 1987-08-31 |
| End date | 2014-09-01 |
| Data Source | http://resomar.cnrs.fr/bases/pelagos/index.php |
| Data Source | http://envlit.ifremer.fr/resultats/quadrige |
| Conditions applying to access and use | https://www.ospar.org/site/assets/files/1215/ospar_data_conditions_of_use.pdf |