

Evaluation pilote des modifications de la diversité du plancton
D1 - Diversité Biologique
D1.6 - Condition des habitats D1.7 - Structure des Écosystèmes
Message clé:
Le phytoplancton constitue la base des réseaux trophiques marins et réagit rapidement aux modifications environnementales. Les variations de la composition des communautés planctoniques affectent d’autres organismes pélagiques et benthiques. Cette étude pilote révèle que les indices de la diversité détectent des tendances et des modifications significatives de la composition des communautés. L’intégration de cet indicateur à d’autres indicateurs du plancton permettra d’améliorer les évaluations futures.
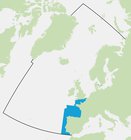
Zone Évaluée
Récapitulatif Imprimable
Contexte
Le phytoplancton est un ensemble d’organismes microscopiques végétaux présents dans les couches de l’océan et des systèmes d’eau douce éclairés (Figure 1). La surveillance du phytoplancton peut permettre d’améliorer notre compréhension de la manière dont des modifications durables à long terme et/ou rapides de la biodiversité peuvent affecter le fonctionnement des écosystèmes marins et avoir un impact sur les services qu’ils fournissent à l’homme. On utilise déjà le phytoplancton à titre d’indicateur pour les évaluations de la qualité de l’eau, telles que dans le cadre de la Directive cadre sur l’eau (DCE) de l’Union européenne.
La diversité du plancton a été adoptée à titre d’indicateur commun OSPAR pour les mers Celtiques mais cette évaluation pilote présente des résultats pour cinq sites de la mer du Nord au sens large, du golfe de Gascogne et de la côte ibérique car les seules données disponibles permettant de tester cet indicateur concernent ces régions (Figure 2).
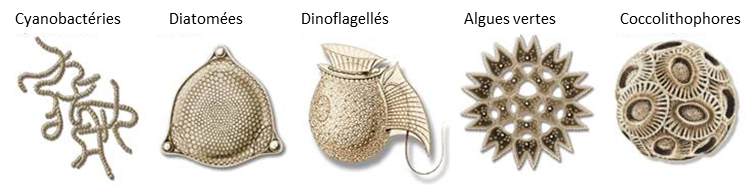
Figure 1: Cinq exemples de groupes phytoplanctoniques
Le phytoplancton comprend des organismes très divers, tels que des bactéries photosynthétiques (cyanobactéries), des microalgues vertes, des diatomées protégées par une carapace de silice, des dinoflagellés, des algues vertes et des coccolithophores recouvertes de plaques de calcite (les dessins ne sont pas à l’échelle). (adapte de Sally Bensusen, NASA Earth Observing System Project Science Office and NASA Earth Observatory)
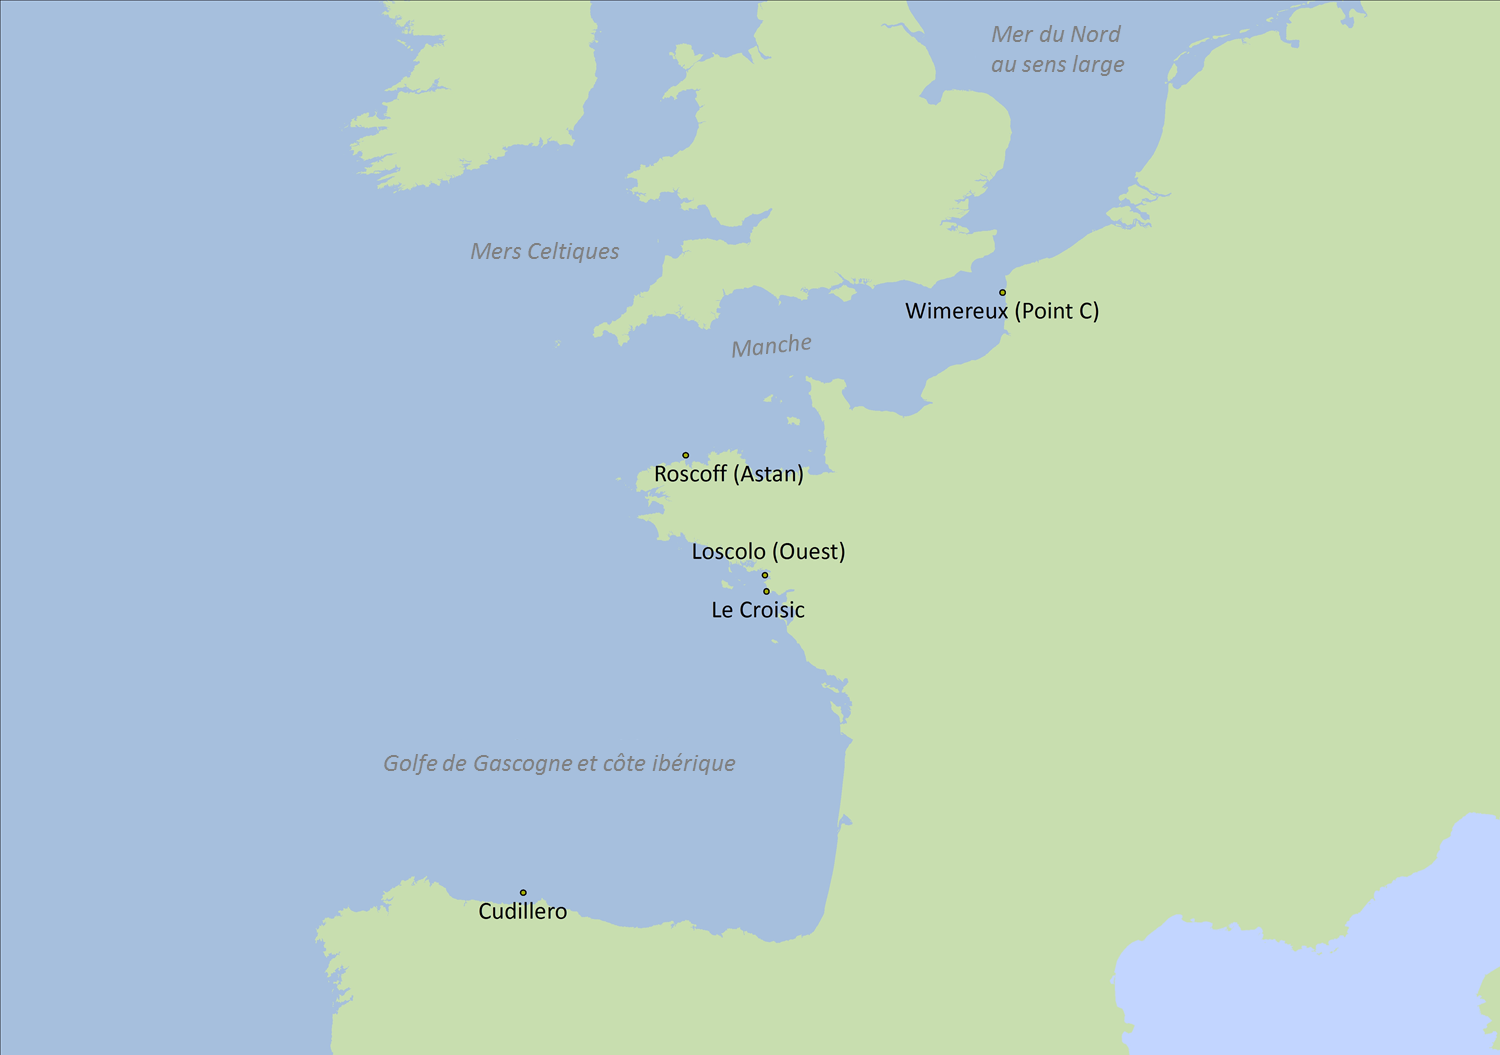
Figure 2: Sites des cinq séries temporelles
Cette évaluation utilise les limites antérieures entre la mer du Nord et les mers Celtiques mais elles seront actualisées pour la prochaine évaluation
Les modifications des conditions physiques et chimiques du milieu marin affectent la composition et l’abondance des espèces. Les communautés phytoplanctoniques peuvent donc fluctuer dans l’espace et dans le temps. Les perturbations d’origine anthropique, telles que la pollution et/ou l’eutrophisation (c’est-à-dire un excès de nutriments) peuvent entraîner des modifications profondes de la composition des communautés car seules quelques espèces peuvent faire face aux modifications de la condition des habitats. Par conséquent, les dynamiques des communautés phytoplanctoniques et donc de leurs caractéristiques structurelles (par exemple diversité, dominance ou taille), seront différentes de celles des communautés naturelles (non perturbées). On analyse au fil du temps la variance des communautés pour permettre d’évaluer la dominance. Une variation faible des communautés caractérise un site doté d’une composition moyenne d’espèces dans le temps (peu de changements dans le temps) alors qu’une variance importante des communautés pourrait indiquer des sites dont la composition des espèces est médiocre.
In order to quantify changes in biodiversity, indices based on the number of species and / or their relative abundances in the community can be calculated. ‘Species richness’ was recently identified as an Essential Biodiversity Variable, a measurement required for studying, reporting and managing biodiversity change (Pereira et al., 2013). There are many indices in the scientific literature to quantify species diversity but their use in a management context depends on: the objective of the study; their ecological relevance; the mathematical properties; and ease of interpretation by stakeholders.
Few community composition indicators of environmental status have been applied to date and this probably reflects the difficulty in setting reference conditions and environmental objectives for these indicators (Garmendia et al., 2013). The response of phytoplankton communities to human pressures is often non-linear, making it difficult to identify clear state-pressure linkages. On the other hand, the main advantages of using diversity indices is their advanced development within the scientific literature and their ease of calculation.
While chlorophyll-a has been widely used as an indicator of eutrophication, several other metrics such as species abundance and community composition are currently being promoted for water quality assessment (Caroppo et al., 2013; Garmendia et al., 2013). OSPAR’s assessment of chlorophyll-a concentrations in the OSPAR Maritime Area can be found here. In contrast to indicators of environmental status based on chlorophyll-a, diversity indices (based on abundance and richness) are generally calculated on the entire plankton community, including heterotrophic species, and will therefore provide additional information for assessing pelagic habitats (Domingues et al., 2008). The integration of chlorophyll-a with composition data may provide an even better understanding of environmental conditions, because the inclusion of additional metrics can increase the sensitivity of an index (Garmendia et al., 2013).
Several case studies have examined the potential use of diversity indices in relation to a pressure gradient. In the Aegean Sea, for example, Spatharis and Tsirtsis (2010) evaluated the efficiency of diversity indices for various sites, previously classified by methods based on nutrient concentrations or phytoplankton data. The results indicate that the phytoplankton metrics proposed (chlorophyll-a, abundance, and species composition) individually contribute to the assessment thus showing differences in the final classification of areas. Therefore, use of comprehensive indices could be a promising approach for the integration of assessments of coastal water quality in the framework of European policies (Spatharis and Tsirtsis, 2010).
In French waters, for example, a multi-metric index called the Phytoplankton Index for Lakes (IPLAC) (Laplace-Treyture and Feret, 2016), that includes both phytoplankton biomass and species composition, has been developed for assessing the quality of lakes under the European Union Water Framework Directive (WFD). Other applications include studies in transitional waters and coastal lagoons (Pereira Coutinho et al., 2012; Facca et al., 2014), where similar multi-metric indices, including species composition, were used to assess water quality in relation to trophic and pollutant levels.
Work to progress development of this Indicator Assessment has been undertaken during the European Union co-financed EcApRHA project, coordinated by OSPAR to address gaps in biodiversity indicator development.
Phytoplankton assemblages are generally characterised by a few common and many rare species, and they exhibit spatial and temporal compositional variability. As for terrestrial plant assemblages, phytoplankton communities are characterised by an ordered sequence of substitutions of species, that is, seasonal succession (Reynolds, 2006). The causes of succession are the reactivity and interactions of the species to favourable environmental conditions throughout the year, such as seasonal changes in temperature, water column mixing / stratification, nutrient loading and light availability (Chalar, 2009). Other processes act on periods of days to weeks, such as meteorological events (wind, rain, cloudiness) and hydrological events (upwelling / downwelling, hydrological withdrawal, water level fluctuations). In the long term, phytoplankton assemblages also react to climate change and to large-scale processes such as variability in atmospheric circulation patterns (e.g. North Atlantic Oscillation). Hence, it is important to consider phytoplankton diversity at multiple time-scales.
The aim of the assessment using diversity indices is not only to quantify the total community composition but also to be able to detect changes in the structure of the community on a seasonal and annual basis. Indices to quantify biological diversity are numerous, but the choice of the most appropriate and the most sensitive index to calculate community diversity is difficult.
Considering several indices that focus primarily on the number of species (or richness) and / or the dominance of a few species within the community will provide a holistic image of community structure that is not possible when using each index separately. Examples of the former include the Species richness (S), Menhinick (D), and Margalef (d) indices, while examples of the latter include the Shannon, Berger-Parker, and Hulburt (δ) indices. From multivariate analyses, it was found that the Menhinick Index was the most sensitive index to changes in environmental conditions. Therefore, it was decided to use the Menhinick Index for assessing species richness in this assessment. Species richness (S) of phytoplankton was not included in this assessment because it is highly correlated to sampling effort and to the level of taxonomic expertise, which has the potential to bias the results.
Many ‘dominance’ indices exist in the literature and are often highly intercorrelated. In relation to the most commonly used indices (including the Shannon Wiener Index, Simpson's Index and Brillouin Index), the Hulburt Index (δ) was judged to be the easiest to interpret, as suggested by Facca et al. (2014). Therefore it was decided to use the Hulburt Index for assessing species dominance.
In this assessment, bimonthly phytoplankton data from microscopic counts were used. To calculate the indices, data on abundance were considered at the genus level, but diversity can also be calculated at other taxonomic resolutions. The Menhinick and Hulburt indices were calculated for every month in each time series, as outlined in Table a. Only years where all months were sampled were used in the analyses.
The Menhinick index (D; Whittaker, 1977) measures taxonomic richness but is more sensitive to environmental change than other richness indices.

where S is the number of taxa and N is the number of individuals.
The Hulburt Index (δ; Hulburt, 1963) is a measure of dominance and is relatively easy to interpret since it is expressed as a percentage.
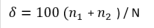
where n1 is the abundance of the dominant genus and n2 is the abundance of the second most abundant genus and N is the total abundance.
In order to relate the Hulburt Index to water quality, the ‘100 - δ’ value was used, in line with the classic theory by which dominance phenomena and changes in community composition occur in impacted areas (Howarth et al., 2000; Facca et al., 2014).
Other indices exist that quantify the onset and amplitude of variations in community structure. Temporal beta diversity is the variation in community composition with time in a study area (Legendre and Gauthier, 2014). More specifically, the Local Contributions to Beta Diversity (LCBD) indices were calculated, which indicate how much each observation contributes to beta diversity; for example, a site with an average species composition would have an LCBD value of 0. Large LCBD values may indicate sampling units (in time) that have high conservation value or, perhaps, degraded and species-poor sites that are in need of restoration (Legendre and De Cáceres, 2013). High values may also correspond to special ecological conditions, or may result from the disturbance effect of invasive species on communities (i.e. differing from the normal condition in a positive or a negative way). As such, LCBD indices are comparative indicators of the ecological uniqueness of the sampling units along the time series.
Temporal beta diversity was computed as the total community composition variance across years following the method described in detail by Legendre and De Cáceres (2013; Figure a). Only monthly abundance time series data (genus level) from the Ouest Loscolo and Le Croisic sites (in the Bay of Biscay) were considered, because these long time series provided the most robust analyses compared to the other available data sets.
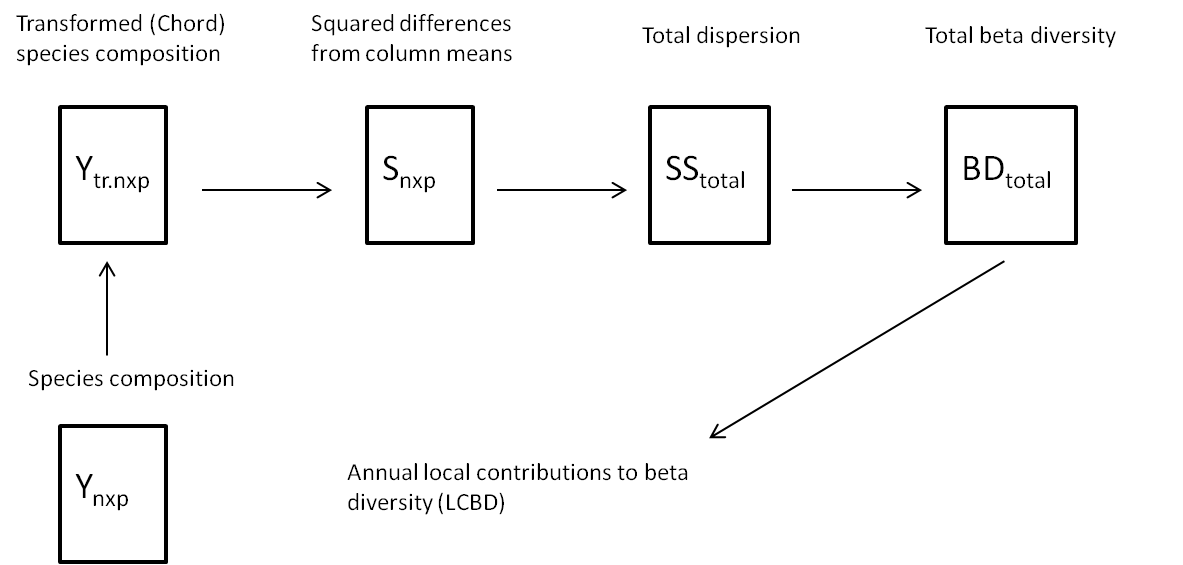
Figure a: Schematic diagram representing the method used to compute beta diversity as the total variance in species composition
(adapted from Legendre and De Caceres, 2013)
| Sites | Database | Coordinates | Region | Time series |
|---|---|---|---|---|
| Roscoff (Astan) | RESOMAR-PELAGOS | Lat:48,772 Lon: -3,968 | Greater North Sea | 2007-2013 |
| Wimereux (Point C) | RESOMAR-PELAGOS | Lat:50,679 Lon: 1,5213 | Greater North Sea | 2006-2012 |
| Croisic* | Ifremer- Quadrige | Lat:47,273 Lon: -2,504 | Bay of Biscay | 1988-2014 |
| Loscolo (Ouest)* | Ifremer-Quadrige | Lat:47,457 Lon: -2,538 | Bay of Biscay | 1988-2014 |
| Cudillero | RADIALES | Lat:43,7 Lon: -6,15 | Bay of Biscay | 1999-2006 |
All time series are currently ongoing and are available from the following dataportals RESOMAR-PELAGOS, Ifremer-Quadrige-REPHY (marked by *) and EmoDNET .
Résultats
Pour cette évaluation, qui est une « validation de principe », les indices de la diversité du plancton ont été calculés pour étudier la variabilité saisonnière et annuelle de la composition des communautés phytoplanctoniques dans cinq sites: quatre dans les eaux françaises et un dans les eaux espagnoles. On a également évalué l’ampleur de la variation dans les communautés phytoplanctoniques pour identifier les années durant lesquelles se sont produits des modifications significatives ou des changements de la composition des espèces.
Les résultats de cette évaluation pilote révèlent que les indices de la diversité permettent de décrire la structure des communautés phytoplanctoniques ainsi que la variabilité de cette structure.
La dominance des espèces varie beaucoup d’une année à l’autre et les variations sont propres à un site (Figure 3). Dans le cas de séries temporelles plus longues (c’est-à-dire, sites du golfe de Gascogne), on relève un point culminant de la dominance en 2007 à 2008 mais il est difficile de déterminer une tendance à long terme. Dans le cas de séries temporelles plus courtes, c’est-à-dire des sites de la mer du Nord au sens large (Roscoff et Wimereux), il semblerait que la tendance de la dominance soit à la hausse à partir de 2006. Il faut cependant être prudent en essayant d’interpréter les tendances pour une période aussi courte.
Dans le cas de Ouest Loscolo et du Croisic, dans le golfe de Gascogne (pour lesquels on dispose de séries temporelles de 26 ans), on a déterminé que 2007 et 2008 sont des années présentant un déplacement temporaire vers une variation relativement élevée des communautés (Figure 4). L’examen de la composition des communautés phyptolanctoniques a révélé une abondance exceptionnellement élevée de Leptocylindrus spp. à Ouest Loscolo et un point culminant de l’abondance de Lepidodinium spp. au Croisic. On ne connaît cependant pas bien les raisons de cette abondance élevée.
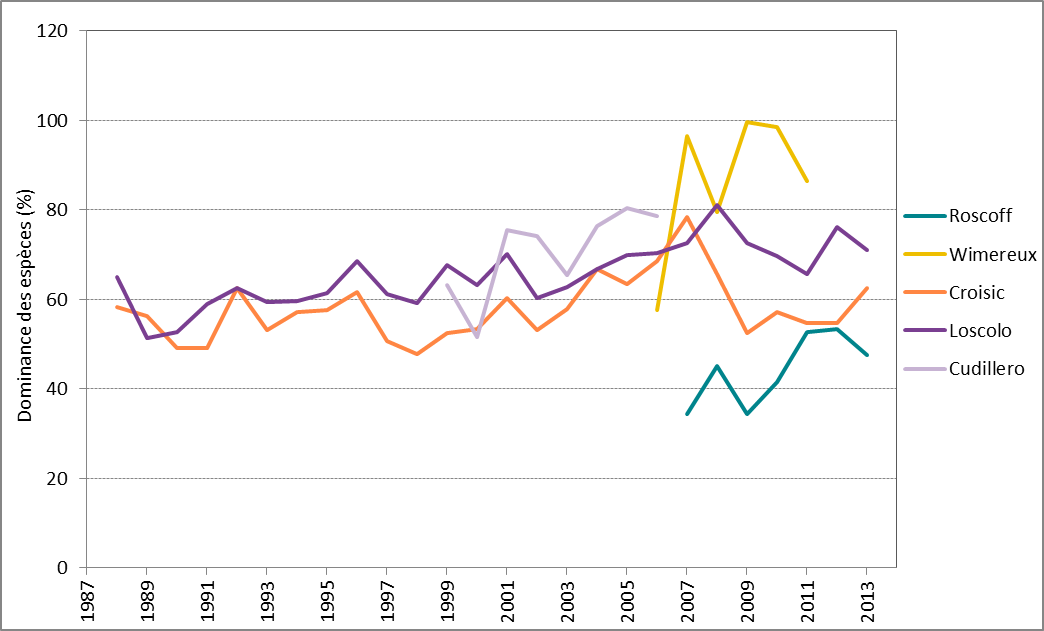
Figure 3: Tendances, exprimées en pourcentage, de la dominance des espèces (moyennes annuelles) à Roscoff (2007–2013), Wimereux (2006–2012), Le Croisic (1988–2014), Ouest Loscolo (1988–2014) et Cudillero (1999–2006).
Des valeurs plus élevées indiquent une dominance par quelques espèces alors que des valeurs plus faibles indiquent un équilibre plus régulier parmi les espèces.
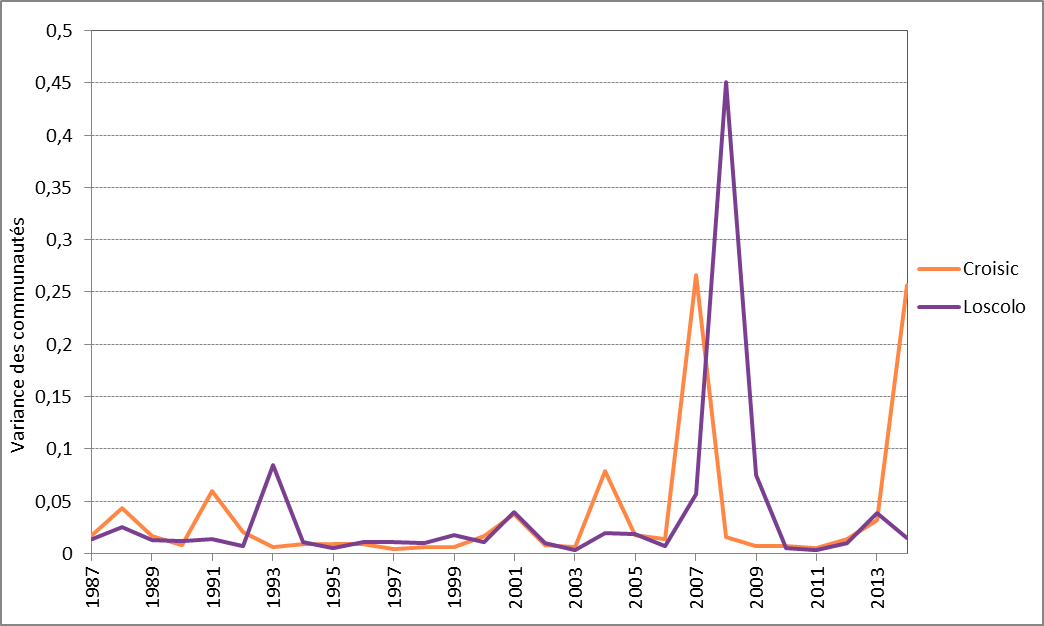
Figure 4: Variance moyenne annuelle des communautés phytoplanctoniques pour Ouest Loscolo et Le Croisic
Diversity indices which focus on the number of species (expressed as genus richness) (Menhinick; D) and dominance within the community (Hulburt Index; δ) were calculated for each month across all years of the time series. Since classic analytical techniques (microscopic counts) allow only the bigger size-fraction of the community to be quantified, true diversity (expressed as richness and dominance in this case) is likely to be under-estimated in most studies dealing only with microscopic counts (including the present study). Since datasets originated from different sources, spatial comparison could be incorrect and so only relative changes within each site should be examined.
Seasonal dynamics were shown to be site-specific, however, the winter months were the most diverse across all sites (Figure b). Roscoff (Greater North Sea) shows the strongest seasonal variation in species richness with a peak at the end of winter. Le Croisic (Bay of Biscay) shows the most consistent pattern across years with a distinct peak in dominance in spring and summer (Figure c), whereas the nearby site of Ouest Loscolo had shown a less distinct peaks in spring, at the beginning of summer and in early autumn (Figure c). One reason for this could be that the latter site may experience more variable environmental conditions and less direct influence of continental nutrient inputs which favour phytoplankton blooms and the resulting high dominance of particular species.
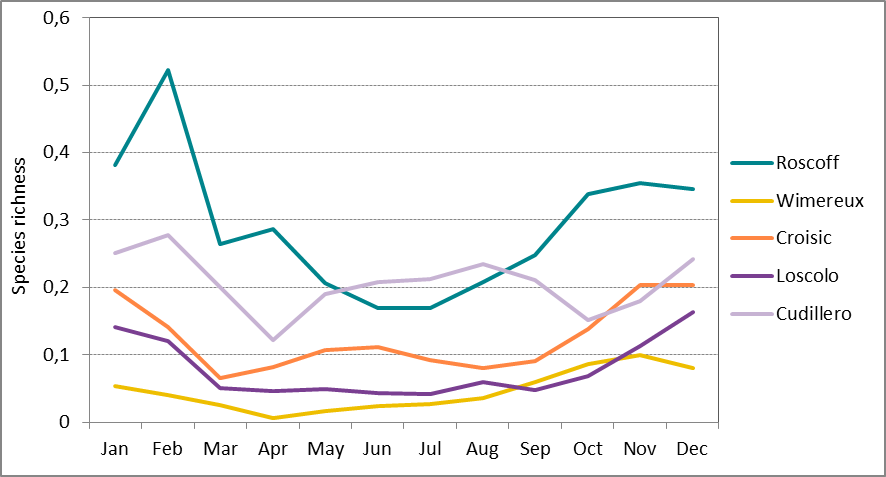
Figure b: Long-term monthly-average species richness at Roscoff (Astan) (2007-2013), Wimereux (Point C) (2006-2012), Le Croisic (1988 – 2014), Ouest Loscolo (1988-2014) and Cudillero (1999-2006)
(see table a for time series)
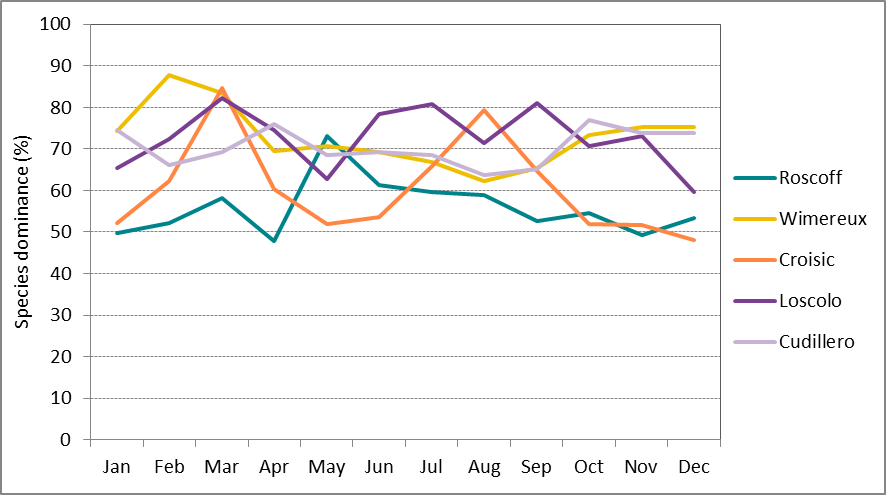
Figure c: Long-term monthly-average species dominance at Roscoff (Astan) (2007-2013), Wimereux (Point C) (2006-2012), Le Croisic (1988 – 2014), Ouest Loscolo (1988-2014) and Cudillero (1999-2006)
Higher values indicate dominance by a few species, whereas lower values indicate a more even balance among species.
The high LCBD coefficients (community variance, see Figure 4) observed in 2007 to 2008 for Ouest Loscolo and Le Croisic indicate an important change / shift or uniqueness in species composition. In effect, this temporal variation was driven by two unusually abundant species in that year, namely Leptocylindrus spp. (Ouest Loscolo) and Lepidodinium spp. (Le Croisic). Further analyses could determine the factors that are responsible for the shift.
Whereas data on nutrient concentrations were available for most of the stations in this assessment, a clear link between diversity indices and nutrients could not yet be established. Further work could determine the sensitivity of these diversity measures to human pressures such as nutrient enrichment.
Conclusion
Pour les séries temporelles plus longues dans cette évaluation pilote (Ouest Loscolo et Le Croisic, dans le golfe de Gascogne), les indices de la diversité révèlent que les années 2007 et 2008 présentent des valeurs de la dominance élevées. On a également relevé un déplacement correspondant de la composition des communautés. Les données sur la composition des communautés révèlent que ces évènements extrêmes sont marqués par une abondance exceptionnellement élevée d’un genre, à savoir Leptocylindrus spp. (diatomée - à Ouest Loscolo) et Lepidodinium spp. (dinoflagellé - au Croisic).
Comme on pourrait s’y attendre, le nombre d’espèces est lié à la dominance dans la communauté. Lorsque l’une ou quelques espèces deviennent très abondantes (c’est-à-dire, augmentations de la dominance), le nombre total d’espèces de la communauté (richesse) diminue. Les variations du nombre de taxons et de la dominance des espèces phytoplanctoniques semblent propres à un site. Ces variations reflèteront les conditions physiographiques et les pressions anthropiques prédominantes dans les sites individuels mais pourraient fournir une alerte précoce en ce qui concerne les conséquences pour d’autres organismes pélagiques et benthiques dans ces sites.
Cette évaluation pilote révèle que les indices de la diversité du plancton sont un outil prometteur pour l’évaluation des communautés planctoniques. Il faudra cependant inclure d’autres mesures telles que la biomasse totale / l’abondance de la communauté et des informations sur les groupes fonctionnels pour pouvoir obtenir une évaluation plus solide des habitats pélagiques afin de développer un indicateur multimétrique.
La validation de principe présentée peut s’appliquer aux données pour les mers Celtiques. On s’attend également à ce qu’elle puisse s’appliquer à d’autres régions OSPAR, selon la disponibilité des données.
Seasonal and annual dynamics of phytoplankton diversity were site-specific and therefore, assessments should be undertaken to include information on the environmental conditions for each site to interpret the results. Furthermore, information (e.g. changes in gear used, different people analysing the data, weather events, etc.) from the data holders at each of the sites could help to identify unusual events taking place in their local pelagic system. In the future, by extending the geographic scope, the robustness of the assessment could be further determined as a regional indicator of environmental status across the OSPAR Maritime Area. Spatial comparison between sites was not carried out because this requires homogeneity in data sampling and analysis and only limited data was available. In any case, such homogeneity is seldom achievable when data originate from different projects. Increased effort at both national and international scales will be needed to implement coherent monitoring of phytoplankton across European waters.
Lacunes des connaissances
Il y a lieu d’acquérir de meilleures données sur le plancton à l’échelle régionale, notamment pour les stations du large, pour pouvoir réaliser une évaluation régionale. Il est recommandé que les taxinomistes reçoivent une formation adéquate (afin de s’assurer que les résultats sont comparables) et d’intégrer des techniques d’échantillonnage semi-automatiques (afin d’augmenter la couverture spatiale) pour pouvoir mettre en œuvre des programmes de surveillance au niveau régional.
Cet indicateur a été utilisé pour la validation de principe afin d’évaluer l’état des communautés phytoplanctoniques. Il faudra complémenter les informations sur la structure des communautés phytoplanctoniques avec des paramètres, tels que la biomasse totale/l’abondance des communautés et les dynamiques de leurs groupes fonctionnels.
This assessment used currently available data from coastal French and Spanish waters (time series at fixed stations). Therefore, no robust wider regional assessment could be undertaken due to a lack of available data, especially for offshore regions, and / or common methodologies across datasets. To fill the gaps in geographic coverage, data from regular scientific cruises could be used to assess spatial variations in phytoplankton community composition. More datasets will be added in future analyses, for example zooplankton data from the Continuous Plankton Recorder. In addition, common methodologies and taxonomic guides (Avancini et al., 2006) are available at the national level, but more effort is needed for the implementation of monitoring programmes at a regional scale (Caroppo et al., 2013).
Conventional sampling protocols for characterising marine phytoplankton communities consist of collecting a small volume of seawater which is analysed under the microscope for species identification and cell counting. However, microscopic counts data has its limitations, notably for estimating the smaller cells in the plankton community. While microscopic counts consider only a fraction of the community and are subject to biases due to differences in taxonomic expertise, the application of state-of-the-art (semi-)automated methods, such as flow-cytometry (Bonato et al., 2015; Morán et al., 2015; Thyssen et al., 2015) and image analysis, such as FlowCAM (Álvarez et al., 2013) could increase the range of organisms considered and allow higher spatial and temporal resolution. Molecular approaches, on the other hand, allow for the whole range of sizes at the finest taxonomical resolution to be considered. DNA barcoding and meta-barcoding, for example, have the potential to increase speed, accuracy and resolution of species identification, while decreasing its cost in biodiversity monitoring (Ji et al., 2013). Hence, combining methods may fill the gaps in microscopic examinations and the complementary methods will allow for monitoring the whole size range of the phytoplankton community.
The biological component of pelagic habitats also includes zooplankton, the animal part of the plankton. Development of zooplankton indicators is less advanced (and fewer data than for phytoplankton are currently available for stations) and so a major activity is required to understand potential community responses to human pressures.
To assess the environmental status of Pelagic Habitats, each of the three OSPAR assessments on Pelagic Habitats (Changes of plankton functional types (lifeform) index ratio, Plankton biomass and / or abundance, and this assessment) consider the community at different levels of community assembly, namely at the lifeform (functional) level; at the level of aggregated community properties (total biomass / abundance); and at the organism level. Therefore, by combining the information from these three indicators, a more holistic assessment of plankton dynamics could be obtained.
Álvarez, E., Moyano, M., López-Urrutia, A., Nogueira, E., Scharek, R. (2013) Routine determination of plankton community composition and size structure: a comparison between FlowCAM and light microscopy J. Plankton Res. 1-15.
Avancini M, AM Cicero, I Di Girolamo, M Innamorati, E Magaletti, T Sertorio & T Zunini. 2006. Guida al riconoscimento del plancton dei mari italiani, Vol. I. Fitoplancton, Vol. 2. Zooplancton. Ministero dell’Ambiente e della Tutela del Territorio e del Mare, ICRAM, Rome.
Bonato, S., Christaki, U., Lefebvre, A., Lizon, F., Thyssen, M., Artigas, L.F. (2015). High spatial variability of phytoplankton assessed by flow cytometry, in a dynamic productive coastal area, in spring: the eastern English Channel. Estuarine Coastal And Shelf Science, 154, 214-223.
Caroppo, C., Buttino, I., Camatti, E., Caruso, G., De Angelis, R., Facca, C., Giovanardi, F., Lazzara, L., Mangoni, O., Magaletti, E. (2013) State of the art and perspectives on the use of planktonic communities as indicators of environmental status in relation to the EU Marine Strategy Framework Directive. 44° Congresso della Società Italiana di Biologia Marina Roma, 14-16 maggio 2013
Chalar, C. (2009) The use of phytoplankton patterns of diversity for algal bloom management. Limnology 39: 200-208.
Domingues, R.B., Barbosa, A., Galvão, H., (2008). Constraints on the use of phytoplankton as a biological quality element within the Water Framework Directive in Portuguese waters. Mar. Pollut. Bull. 56, 1389–1395.
Facca, C., Aubry, F.B., Socal, G., Ponis, E., Acri, F., Bianchi, F., Giovanardi, F. and Sfriso, A. (2014). Description of a Multimetric Phytoplankton Index (MPI) for the assessment of transitional waters, Marine Pollution Bulletin, 79 (1–2): 145-154.
Garmendia, M., Borja, A. Franco, J., Revilla, M. (2013). Phytoplankton composition indicators for the assessment of eutrophication in marine waters: Present state and challenges within the European directives, Marine Pollution Bulletin 66(1–2):7-16.
Howarth, R., Anderson, D., Cloern, J., Elfring, C., Hopkinson, C., Lapointe, B., Malone, T., Marcus, N., McGlathery, K., Sharpley, A., Walker, D. (2000). Nutrient pollution of coastal rivers, bays, and seas. Issues in Ecology 7: 2–15.
Hulburt, E.M. (1963). The diversity of phytoplankton population in oceanic, coastal and estuarine regions. J. Mar. Res. 21, 81–93.
Ji, Y., Ashton, L., Pedley, S.M., Edwards, D.P., Tang, Y. (2013) Reliable, verifiable and efficient monitoring of biodiversity via metabarcoding. Ecol Letters 16: 1245–1257.
Laplace-Treyture,C. and Feret,T. (2016) Performance of the Phytoplankton Index for Lakes (IPLAC): A multimetric phytoplankton index to assess the ecological status of water bodies in France, Ecological Indicators 69: 686-698.
Legendre, P. and De Cáceres, M. (2013) Beta diversity as the variance of community data: dissimilarity coefficients and partitioning. Ecology Letters 16: 951-963.
Legendre, P. and Gauthier, O. (2014) Statistical methods for temporal and space-time analysis of community composition data. Proceedings of the Royal Society B 281:20132728.
Morán, X.A.G, Alonso-Sáez, L., Nogueira, E., Ducklow, H.W., González, N., Ángel López-Urrutia, A., Díaz-Pérez, L., Calvo-Díaz, A., Arandia-Gorostidi, N., Huete-Stauffer, T.M. (2015) More, smaller bacteria in response to ocean’s warming? Proceedings of the Royal Society B 282: 20150371.
Pereira Coutinho, M.T., Brito, A.C., Pereira,, P., Gonçalves, A.S., Moita, M.T. (2012) A phytoplankton tool for water quality assessment in semi-enclosed coastal lagoons: Open vs closed regimes, Estuarine, Coastal and Shelf Science 110: 134-146.doi:10.1016/j.ecss.2012.04.007.
Pereira, H. M., S. Ferrier, M. Walters, G. N. Geller, R. H. G. Jongman, R. J. Scholes, M. W. Bruford (2013) “Essential Biodiversity Variables.” Science 339 (6117): 277–278. doi:10.1126/science.1229931.
Reynolds, C. (2006) Ecology of phytoplankton. Cambridge University Press.
Spatharis, S. and Tsirtsis, G. (2010) Ecological quality scales based on phytoplankton for the implementation of Water Framework Directive in the Eastern Mediterranean. Ecological Indicators 10: 840–847
Thyssen, M., Alvain, S., Lefèbvre, A., Dessailly, D., Rijkeboer, M., Guiselin, N., Creach, V., and Artigas, L.-F. (2015) High-resolution analysis of a North Sea phytoplankton community structure based on in situ flow cytometry observations and potential implication for remote sensing, Biogeosciences, 12, 4051-4066.
Whittaker, R.H. (1977) Evolution of species diversity in land communities. Evolutionary Biology 10: 1-67.