

Ecosystem assessment outlook – developing an approach to cumulative effects assessment for the QSR

Multiple human activities occur within the OSPAR Maritime Area and understanding their cumulative effect on ecosystem components is a key step in implementing the ecosystem approach.
The OSPAR Commission’s activities under the North East Atlantic Environment Strategy are guided by the application of the Ecosystem Approach. Understanding and assessing cumulative effects is at the heart of implementing an ecosystem-based approach to the management of human activities in the OSPAR Maritime Area. The delivery of the next OSPAR Quality Status Report (QSR) therefore needs to include an understanding of the consequences of cumulative effects. Cumulative effects assessment cuts across the work of all OSPAR committees and expert groups, as well as the Co-ordination Group. As such it is essential that the assessment of cumulative effects is embedded within the OSPAR structural framework and makes best use of the available data and expertise. The cumulative effects assessment for the next QSR will build on the OSPAR (2009) trend analysis of maritime human activities and their collective impact on the OSPAR Maritime Area.
Cumulative effects assessment is defined as a systematic procedure for identifying and evaluating the significance of effects from multiple human activities. It can also provide an estimate of the overall expected impact in order to inform management decisions. Analysis of the causes, pathways of exposure and consequences of these effects on ecosystem components is an essential and integral part of the process.
An assessment of cumulative effects has not been undertaken for the IA 2017. This section describes the approaches being developed for the next OSPAR Quality Status Report (QSR).
The next QSR will not include an attempt to assess the cumulative effects of every possible pressure and impact combination in the North East Atlantic, but instead will focus efforts on undertaking a cumulative effects assessment that is integrated with the OSPAR common Indicator Assessments and their associated data.
This section presents an outline of an indicator-based approach that relates the pressures arising from human activities (Chapter 4) to biodiversity status (Chapter 5) in the context of climate change (Chapter 2, Section 2.1) and physiographic and prevailing conditions (Chapter 2, Section 2.2).
A review of existing approaches that could be applied in cumulative effects assessment (including those applied by different regions, countries and projects: HARMONY, CUMULEO, ODEMM) was undertaken in 2015 (Korpinen, 2015). While this review identified tools that could be adapted and applied in the cumulative effects assessment for the QSR, there was a disconnect with the developing OSPAR suite of indicators and associated data. As such, none of the approaches could be easily utilised unless modified to fit the OSPAR work programme. Before any such modification can be contemplated there first needs to be a clear understanding of the OSPAR common indicators.
The cumulative effects assessment for the next OSPAR QSR is therefore being designed as an extension of existing OSPAR thematic work on indicators, rather than undertaking a completely independent assessment. The approach to cumulative effects assessment will extend and integrate the individual common indicators and wider thematic work streams through:
- helping to provide a clear message on what the accumulation of each indicator assessment says about the status of the ecosystem components
- cumulatively describing the temporal trends (trajectories) shown by the indicator assessment (including where relevant an explanation of any variation in the value of the indicator between OSPAR regions or within regions)
- identifying pressures that are known to have a major effect cumulatively on the value of the indicator – and, where appropriate, mentioning any existing measures.
The cumulative effects assessment for the next OSPAR QSR will follow a flexible and adaptive approach to provide a more proportionate and pragmatic process (rather than imposing a single approach (such as with HARMONY, CUMULEO, ODEMM). This means that the cumulative effects assessment builds on the wider OSPAR work streams and can be designed to be compatible with the procedures and outputs. So whereas most cumulative effects assessment approaches work towards generating a map, the reality may be that not all ‘pressure’ or ‘biodiversity’ parameters can (or should) be mapped because the scale, resolution, frequency, or significance of certain parameters might be distorted in a two-dimensional map. Rather than force the data to fit an approach, the OSPAR cumulative effects assessment can be adapted to fit the component data and assessments from the thematic work streams of the OSPAR Coordinated Environmental Monitoring Programme (CEMP) (Figure 1). This work is being progressed through dialogue with indicator leads, in order to better understand the data, functioning and outputs of the indicators.
A key focus for this ongoing work programme is to determine the ‘best-fit’ between the discrete data streams and indicators and the most appropriate groupings and methods to combine parameters and indicators in the cumulative effects assessment. The aim is for the next OSPAR QSR to include a cumulative effects assessment based on a predefined set of cause-effect pathways aligned to the OSPAR monitoring and assessment thematic work streams. The intention of applying this pragmatic approach is to build up a composite of comparable parameters in a way that the effects can be traced back to causal factors to inform management decisions.
To ensure that (as far as possible) the combination of different exposure pathways and subsequent assessment methodologies are compatible, a simple filtering will be done to distinguish between point source[1] and dispersive[2] pressures and to identify the temporal and spatial (three-dimensional) behaviour of the pressures and any pressure-effect consequences pertinent to the assessment (such as acute versus chronic effects). Once the various pressures and pressure-effect consequences have been filtered the effects can be cumulated using the most appropriate method (Figure 2).
Case studies are being used to test the practicalities of understanding the indicators and associated data, as well as how to combine datasets. This will help guide what further work is needed. The Netherlands has undertaken two related case studies, which apply a framework to establish cumulative effect exposure pathways describing the causal factors for hazards (sources of pressure) to the consequences (effects) on a single receptor (harbour porpoise population) (see Case Study).
[1] ‘Point-Source’ pressures are those where there is effectively a one-to-one relationship between the activity and the pressure (and effect), e.g. the pressure ‘habitat structure changes’ from aggregate extraction will only be exhibited where the minerals are actively extracted; ‘extraction of target species’ from fishing will only be exhibited where fishing vessels operate.
[2] ‘Dispersive’ pressures are those where the pressure (and effect) cover a larger spatial area than the causal activity, e.g. noise will propagate away from its source (e.g. pile driving); nutrients and hazardous chemicals entering the marine environment from rivers will disperse.
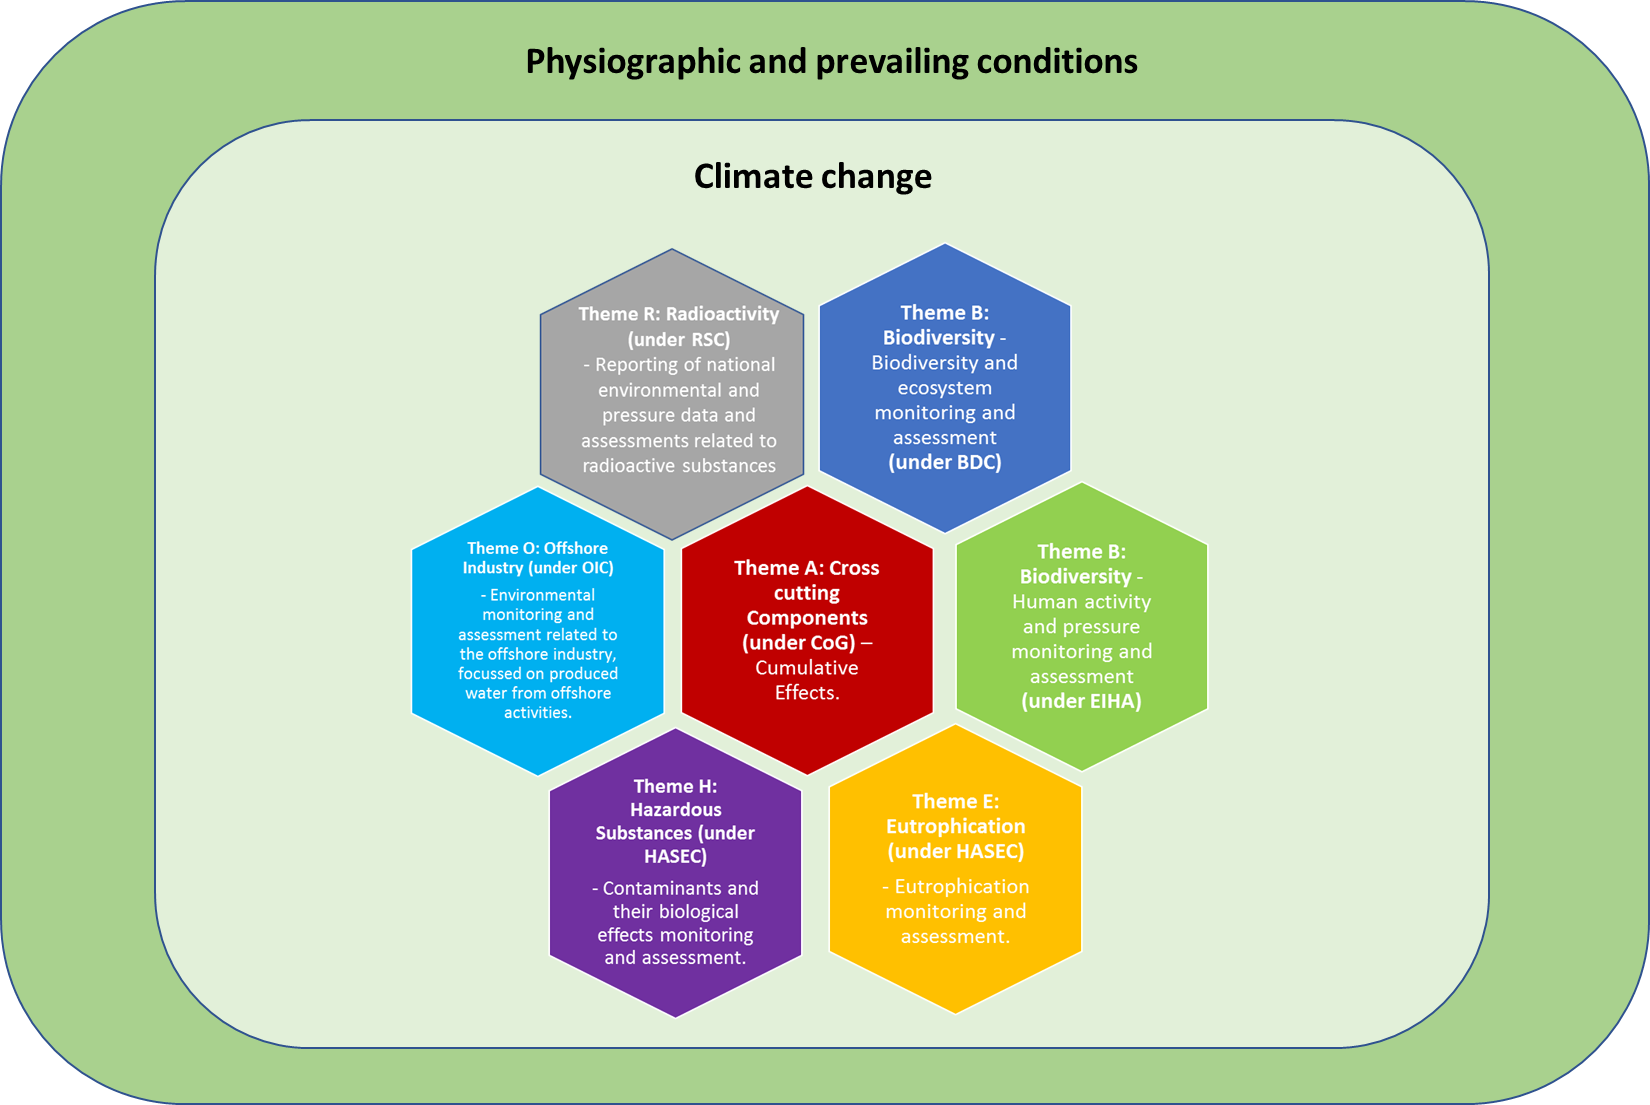
Figure 1. OSPAR (CEMP) thematic work streams provide the components for the cumulative effects assessment
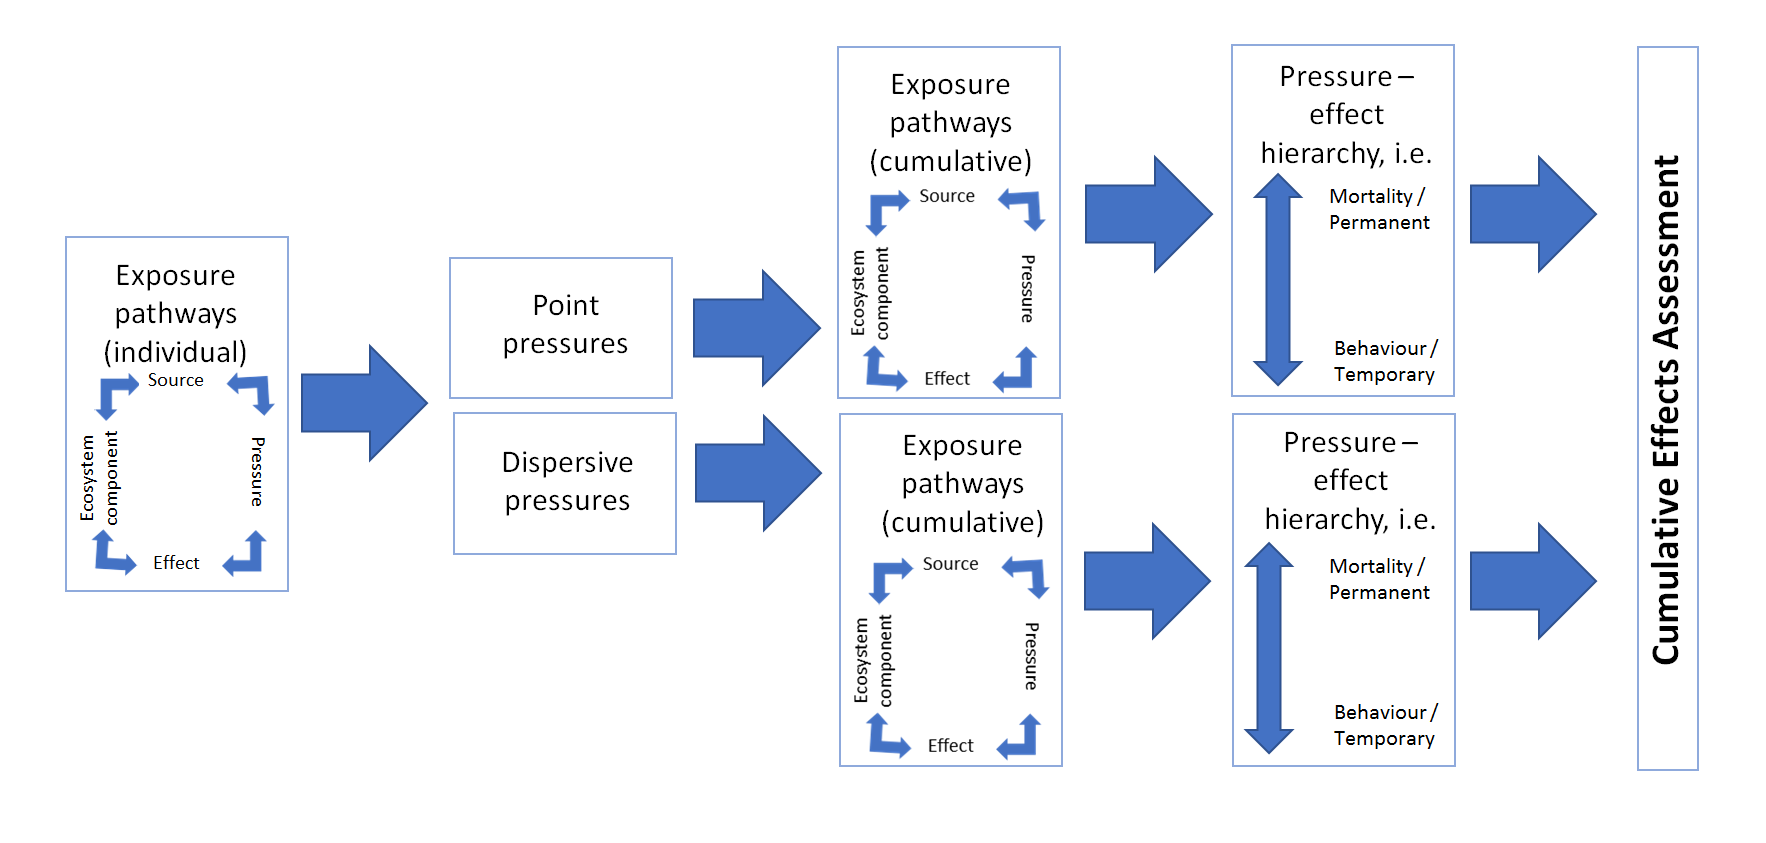
Figure 2. Schematic of the OSPAR cumulative effects assessment
Having established that the cumulative effects assessment for the next OSPAR QSR needs to be based on a clear understanding of the causes and consequences of hazards that could impact the status of the marine ecosystem (including any associated legislative and management controls), a simple method is now needed to combine these elements. The method being applied to construct these causal relationships is a modified bow-tie analysis (ICES, 2014). The International Organization for Standardization (ISO) describes a bow-tie analysis as “A simple diagrammatic way of describing and analysing the pathways of a risk from hazards to outcomes and reviewing controls.” This approach is illustrated in Figure 3, with the hazard represented by the knot of the bow-tie, the causal factors listed to the left and the consequences listed to the right. Controls can be inserted to act on all possible links between the causes, hazard and potential consequences. The position of the controls can be considered as follows:
- The first set of controls are placed between the causes and the central event (the knot). These barriers are aimed at preventing the causes from creating a hazard by eliminating, avoiding or controlling the causes (e.g. reduce the likelihood of a hazard such as a change in state of the ecosystem). These ‘barriers’ are often referred to as preventive controls.
- The second set of controls are placed between the hazard and the consequences. These are aimed at providing mitigation or recovery from the consequences resulting from the hazard (e.g. reduce the magnitude or severity of the impacts on ecosystem structure or function or to ecosystem services). These ‘barriers’ are often referred to as mitigation or recovery controls.
- The third set of controls (not shown in Figure 3) can be placed between a control and an escalation factor. These controls are aimed at preventing the escalation factor from causing the other controls to fail.
The cumulative effects assessment in the next OSPAR QSR will focus on predefined components (bow-ties) based on the core work programmes of OSPAR’s thematic committees. Bow-ties are being constructed to summarise and expand the content from the assessment sheets for each OSPAR common indicator. Figure 4 shows an example of a bow-tie for the seafloor damage indicator (BH3).
There are various options for combining bow-ties for each indicator in the cumulative effects assessment. Once the work to construct bow-ties for each indicator is complete, linkages between related parameters will be established, such as linking pressures, hazards or effects depending on the nature of the relationships and the confidence in the associations. Figure 5 provides an example that identifies potential cumulation points between bow-ties for two indicators associated with marine sediments (organotin in sediment and seafloor damage).
Once the network (or sub-groupings) of bow-ties connecting indicators is complete, the most appropriate method to expand the visualisation of the effect will be applied (i.e. a map, a graph, qualitative, quantitative).
Applying the bow-tie approach to describe and integrate the indicators generates an understanding of if and how the output from OSPAR’s thematic work streams (such as from each indicator or groupings of indicators) relate to one another, in order to allow a final cumulative (holistic) assessment.
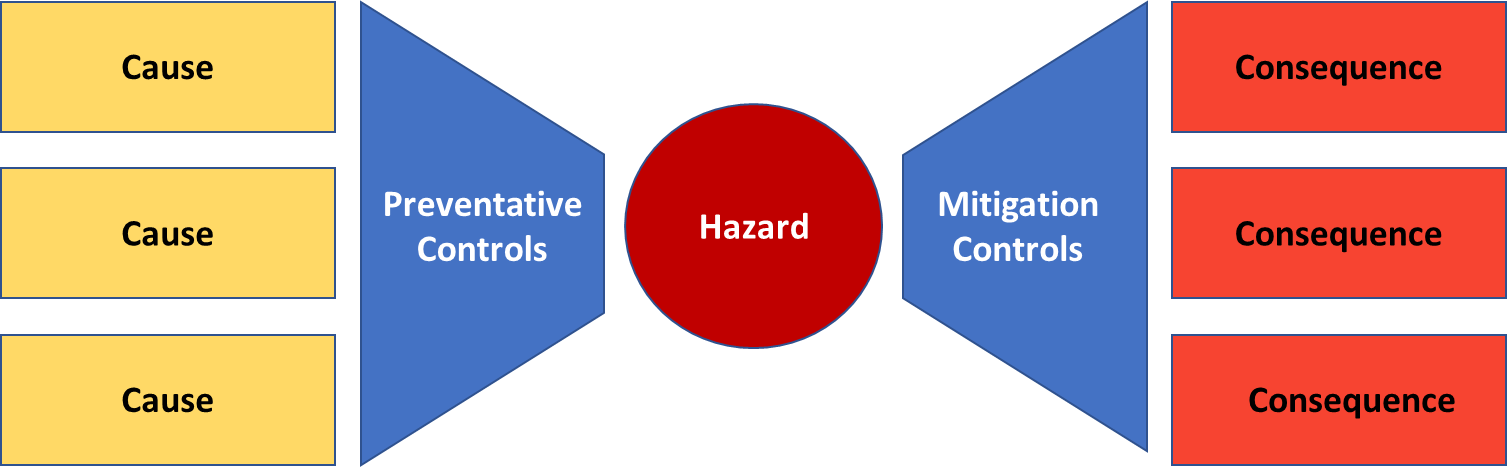
Figure 3. Bow-ties analysis
The cumulative effects assessment in the next QSR will focus on predefined components (bow-ties) based on the core work programmes of OSPAR’s thematic committees. Bow-ties are being constructed to summarise and expand the content from the assessment sheets for each OSPAR common indicator. Figure 4 shows an example of a bow-tie for the seafloor damage indicator (BH3).
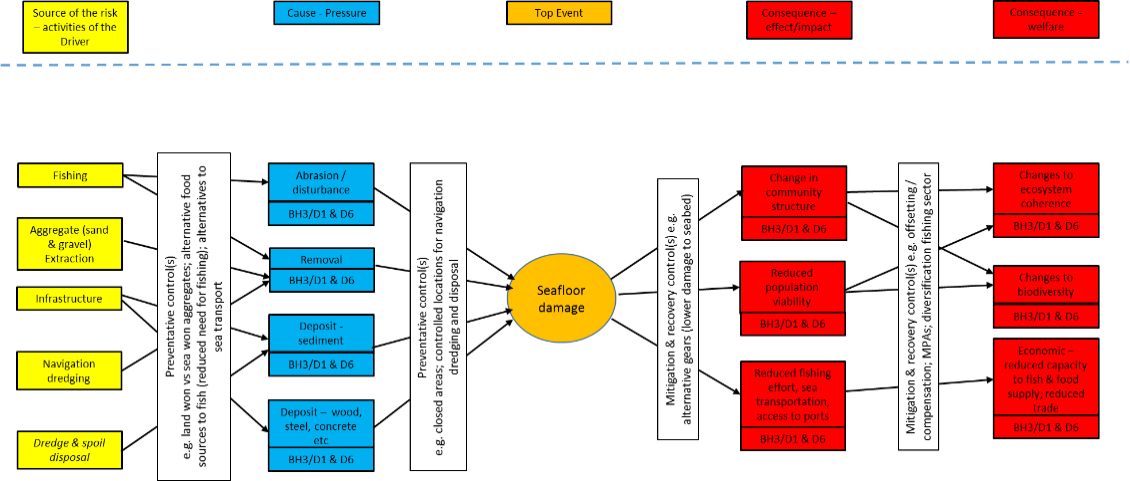
Figure 4. Seafloor damage bow-tie
There are various options for combining bow-ties for each indicator in the cumulative effects assessment. Once the work to construct bow-ties for each indicator is completed, linkages between related parameters will be established, e.g. linking pressures, hazards or effects depending on the nature of the relationships and the confidence in the associations. Figure 5 is an example which identifies potential cumulation points between bow-ties for two indicators associated with marine sediments (organotin in sediment and seafloor damage).
Once the network (or sub-groupings) of bow-ties connecting indicators is complete, the most appropriate method to expand the visualisation of the effect will be applied (i.e. a map, a graph, qualitative, quantitative).
Applying the bow-tie approach to describe and integrate the indicators generates an understanding of if and how the outputs from OSPAR’s thematic work streams (e.g. from each indicator or groupings of indicators) relate to one another, in order to allow a final cumulative (holistic) assessment.
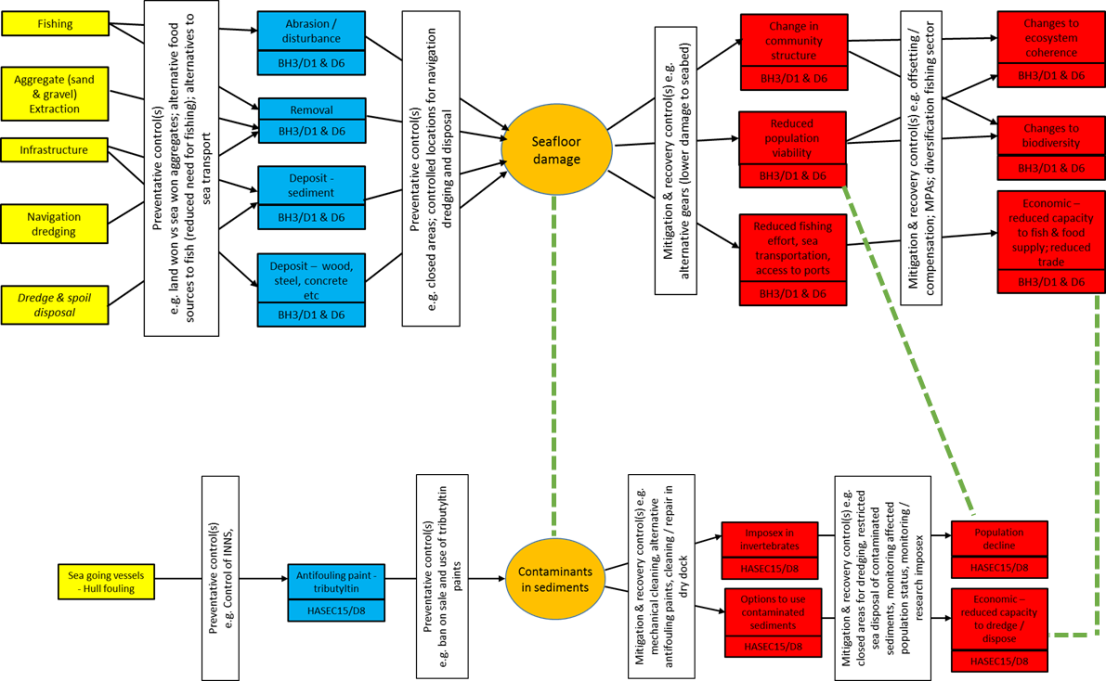
Figure 5. building up assessment of cumulative effects from OSPAR common indicators
Case studies are currently being progressed to test and describe the practical application of the cumulative effects approach for the next OSPAR Quality Status Report (QSR). These case studies will evolve over time as our understanding of the suite of indicators and if / how they can be combined in a cumulative effects assessment develops.
The Netherlands has undertaken two related cumulative effects assessment case studies investigating effects from human activities on the harbour porpoise. The first presents a general framework of the way cumulative effects of all (most relevant) pressures for the harbour porpoise population could be assessed. In the second case study, this framework is constructed in a more detailed and quantified manner for the cumulative effects of impulsive noise on the harbour porpoise population of the North Sea. The framework illustrated in Figure 2 is applied to establish cumulative exposure pathways from multiple pressures–effects from multiple activities (sources) on a single receptor.
Case Study 1: Cumulative effects on harbour porpoise populations
Pressures differ in the way they lead to effects. Bycatch of marine mammals has a direct and measurable impact on the population in that animals could die, whereas exposure to impulsive underwater sound will not generally kill an animal directly but will affect its behaviour and ultimately, its fitness / chances of survival and reproduction. There may also be interactions between various pressure / effect combinations that may amplify or reduce potential effects. The approach described in Figure a and Figure b was applied to identify and rationalise pressure and ecosystem component relationships. Figure b gives a simplified representation of a cumulative effects assessment for harbour porpoise. The arrows from the pressures to the effect indicate that a particular pressure can have multiple effects but also that a certain type of effect may be a result of multiple pressures.
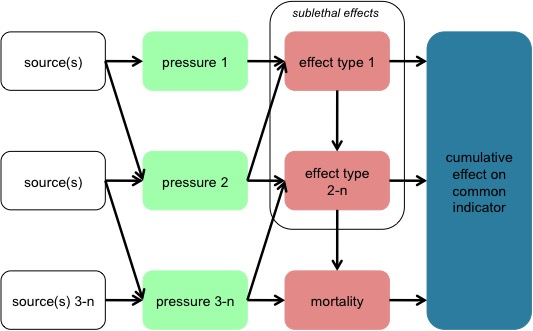
Figure a. Simplified representation of a cumulative effect assessment.
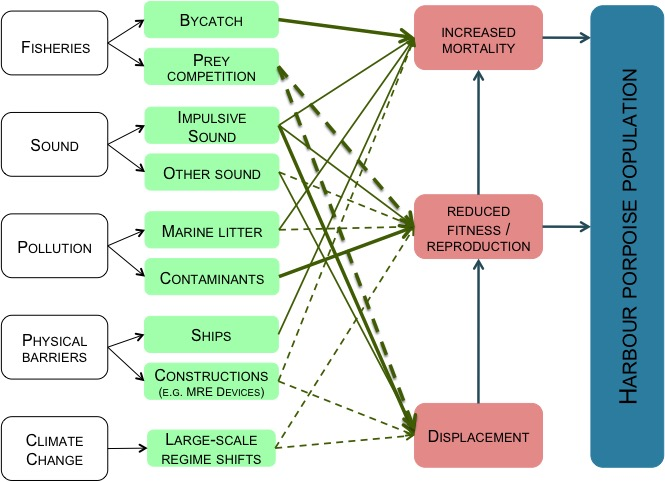
Figure b. Sources and pressures (point or diffusive) and exposure pathways
This provides a schematic overview of the potential effect pathways through which the harbour porpoise population could be affected by human activities, in this case study the aim was to make this specific for (a limited set of) pressures considered to be most relevant. The bold lines in the graphic indicate a proven relationship that is also, in all probability, relatively important. The relationships shown by thin lines have also been proven but their relative importance is thought to be much less. The dashed lines show relationships that are assumed to exist but which have not been proven or cannot yet be quantified. The thickness of the dashed lines also indicates the relative importance of these relationships.
The pressure-effect relationships in the case study are supported by a review of the literature and the knowledge base within OSPAR committees and thematic work streams. This analysis rationalised the associations to identify the most important relationships shown by the bold, continuous and dashed arrows (Figure c). The pressures suspected to have a strong impact on the harbour porpoise population in the North Sea and for which enough quantitative information is available to estimate the effect on the population are: fisheries bycatch (increased mortality), impulsive underwater sound (habitat loss), and pollutants (reduced fitness / impaired reproduction).
Species targeted by the fishing industry may be the preferred prey of the harbour porpoise. As a result, adverse impacts on the harbour porpoise population through fisheries-related reductions in prey availability cannot be excluded. However, this relationship is difficult to quantify for various reasons. It is also unclear how large the effect on the population could be. An unknown but potentially important relationship might therefore be: fishing industry ® competition (reduction in fitness, loss of habitat).
The case study demonstrates that the effects of a pressure with multiple sources (impulsive underwater sound) on a single ecosystem component (harbour porpoise population) can be extended relatively easily to produce a cumulative effects assessment of all human pressures on this species. To do this, sufficient quantitative data are required concerning the effect of the major human pressures on survival (mortality), fitness, reproduction and habitat loss for individual harbour porpoises. The case study indicates that adequate data are probably available for three major pressures (bycatch, impulsive underwater sound, pollution) to estimate the impact on the entire North Sea harbour porpoise population. At the time of writing, the case study has only quantified the potential relationship between effects from impulsive underwater sound and harbour porpoise populations.
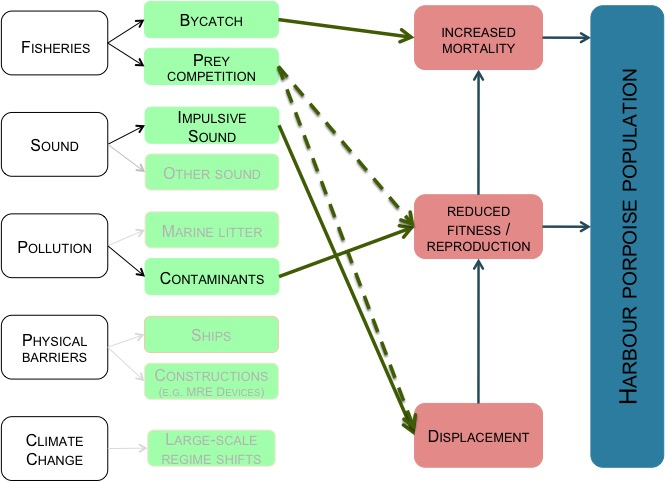
Figure c. Main sources, pressures and exposure pathways for harbour porpoise population
Case Study 2: Cumulative effects for assessing cumulative effects of impulsive sound on marine mammals
The approach described here has been used by the Dutch government in licensing the construction of offshore wind farms. At the time of writing, OSPAR had not agreed a methodology for assessing the effects of impulsive underwater sound, nevertheless the approach taken can be used to further explore possibilities.
This case study employed a stepwise approach to assess (the effects of) impulsive sound in the OSPAR Maritime Area on marine mammals a stepwise approach has been applied. This links two OSPAR common indicators (impulsive underwater sound and the distribution and abundance of cetaceans). The Dutch approach to cumulative effects assessment for impulsive underwater noise on harbour populations is as described by Heinis and de Jong (2015), in summary:
Step 1: Quantify underwater sound propagation
Step 2: Determine the area affected by underwater sound: effect parameters and threshold values
Step 3: Quantify the number of affected animals
Step 4: Calculate the number of ‘animal disturbance days’
Step 5: Assess the possible impact on the population
Step 6: Assess cumulative effects of multiple projects / impulsive underwater sound sources
The approach was tailored to make it compatible with the data collected in the OSPAR Noise register. An accurate estimate of the effects of a pressure on a population (whether cumulative or not) requires either a qualitative or quantitative understanding of the relationship between pressures and their effects on individual animals. Such information is available (with certain margins of error) for most of the steps listed. For step 5, however, translating direct effects (disturbance) into population effects is hampered by a fundamental lack of knowledge. The Dutch approach to this problem has been to use a population model as a temporary solution (Figure d).
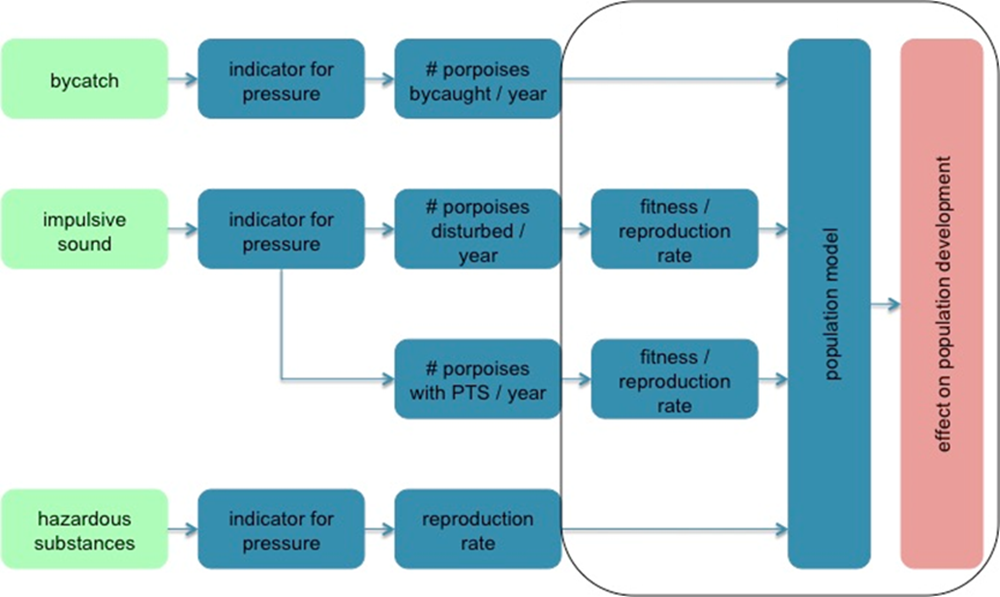
Figure d. Approach for a CEA for harbour porpoises
Transparency in terms of how outcomes are determined and how they are interpreted and used to inform management decisions, will be critical to gaining international acceptance. In this case study, transparency is ensured by showing the uncertainties at each step, and by indicating the relative influence of these uncertainties for the outcomes. This helps to focus future research effort. Verification of population size (whether measured or modelled) is a clear priority to make this methodology acceptable at a regional scale.
The flexible and adaptive approach to cumulative effects assessment being applied for the next OSPAR Quality Status Report (QSR) should ensure that OSPAR can make the best use of the data sets and knowledge accrued from the thematic assessments under OSPAR’s Coordinated Environmental Monitoring Programme (CEMP). It also ensures that the outputs of the cumulative effects assessment can be aligned with the outputs of the individual assessments, i.e. the key findings from the cumulative effects assessment can be discussed in the context of the other chapters of the QSR.
Although the methods previously reviewed by OSPAR (i.e. HARMONY, CUMULEO, ODEMM) are still relevant, rather than impose a ‘one size fits all’ approach to cumulative effects assessment it is now thought better to target the methodology to the parameters involved. In this respect, it is important that the approach to cumulative effects assessment retains the flexibility to incorporate new science as and when it becomes available. In so doing, the presumption is that it is better to start with what is achievable and to focus on those source sectors and human activities that are of particular importance in a given region, with the approach elaborated over time as understanding improves, linking with OSPAR committees and expert groups as necessary.
A distinction needs to be made between knowledge gaps for cumulative effects assessment per se and those specifically for the next OSPAR Quality Status Report (QSR) assessment. The former require work on, for example, species and habitat distributions / abundance; understanding pressure interactions (additive, antagonistic, synergistic); accumulation methodologies; and ecosystem models. However, the targeted approach being applied for the next QSR and the alignment of the cumulative effects assessment with existing thematic work streams helps to narrow the field.
Since work to extract information from the suite of assessment sheets (and wider work streams) for use in the cumulative effects assessment has only just started, it is not yet possible to specify gaps in the existing thematic work streams that will hinder its application, although there will undoubtedly be some. However, the flexibility of the approach is such that the cumulative effects assessment can adapt to fit around knowledge gaps. Nevertheless, it is acknowledged that this would have direct implications for the certainty and potential robustness of the assessment.
is F., C.A.F. de Jong & Rijkswaterstaat Underwater Sound Working Group, 2015. Cumulative effects of impulsive underwater sound on marine mammals. TNO report 2015 R10335-A. pp. 86.
ICES. (2014). Report of the Joint Rijkswaterstaat/DFO/ICES Workshop: Risk Assessment for Spatial Management (WKRASM), 24–28 February 2014, Amsterdam, the Netherlands. ICES CM 2014/SSGHIE:01. 35 pp. http://ices.dk/sites/pub/Publication%20Reports/Expert%20Group%20Report/SSGHIE/2014/WKRASM2014.pdf
Korpinen, S. (2015) OSPAR Case Study on Cumulative Effects: Evaluation of the methods and analysis of their outcomes. Report to CEFAS, Final version 2 January 2015