

Marine Climate: Prevailing Conditions and Climate Change
Introduction
This chapter considers the marine climate (prevailing conditions) of the OSPAR Maritime Area, and how it has changed over time (2011–2015) compared to preceding decades. Characteristics of the marine climate include temperature, sea ice, sea level, salinity, storms and waves, and ocean pH. Changes on land, including glaciers and snow-covered areas, are also considered. This is because precipitation and the delivery of freshwater to the marine environment through catchments is an important pathway for contaminants and nutrients, with implications for accumulation and productivity in marine ecosystems. The characteristics of a marine climate can act as both a direct pressure on the ecosystem, and also as a factor influencing indirect pressures on the ecosystem.
The marine climate is changing both in response to, and as part of, climate change. The characteristics of regional marine climate are the means by which global warming and ocean acidification influence OSPAR’s regional ecosystems. While the best understood part of the marine climate is sea surface temperature, there is a wide range of other marine climate characteristics with implications for marine biodiversity and contaminants.
Sea Surface Temperature
2011–2015
The ocean warming trend associated with anthropogenic climate change is superimposed upon natural variability on inter-annual to multi-decadal timescales and between regions. When examining change in temperature on the regional scale in the North Atlantic, whether over the past century or past 30 years, it is evident that temperature evolution at any particular location does not follow a smooth, continuously upward path. Records show short periods of rapid warming, periods of little change, and periods of cooler conditions.
The difference between a short-term and long-term view can be seen by comparing average temperature in the five-year period 2011–2015 with that of either the preceding decade (2001–2010) or the 30-year period 1971–2000 (the baseline for the Quality Status Report (QSR) 2010). General long-term warming can be seen in all OSPAR regions when comparing current conditions (2011–2015) with the long-term average (1971–2000), with a pattern broadly similar to that shown in the QSR 2010. However, compared to the past decade (2001–2010) the picture differs. Current temperature in the Greater North Sea, Celtic Seas, and Bay of Biscay and Iberian Coast regions is broadly similar to or slightly cooler, while large areas of the Wider Atlantic region are more than 0.4°C cooler. In contrast, Arctic Waters are now (2011–2015) warmer. For the past 50 years, the Arctic is thought to have been warming at a rate more than twice the global average and is now warmer than at any time during the 20th century (AMAP, 2017).

The International Council for the Exploration of the Sea (ICES) produces an annual report on the marine climate of the North Atlantic, and has documented the variations above for a number of years from a set of hydrographic stations (Larsen et al., 2016). These show patterns of change from year to year within the period 2011–2015. In the North Sea the data show that the years 2011–2013 were cooler than the previous decade but that 2014 was the warmest year in the 30–50 year sea surface temperature (SST) record and that 2015 was also relatively warm. At the northern edge of the North Sea, close to the conjunction of four OSPAR regions (Greater North Sea, Arctic Waters, Celtic Seas, Wider Atlantic), the Faroe Shetland Channel time series of North Atlantic water temperature illustrates some of the cooling seen in the open North Atlantic, while temperature in the Barents Sea has stayed relatively warm through most of the five-year period (2011–2015).
Beyond 2015
There is high confidence in the long-term rise in sea temperatures on a global scale, but on shorter timescales and at regional scales there is much more variation. Some analyses (e.g. Cannaby and Hüsrevoğlu, 2009; Ting et al, 2009) show that natural variability could account for up to 50% of the recent (1990s to 2000s) warming and this might explain why the 30-year warming trend reported in the QSR 2010 exceeded the long-term global trend. Even with a long-term anthropogenic warming trend, in different sea areas there will be some decades in the future that will show particularly strong warming while others will exhibit little change or even cooling.
Implications
The temperature of the sea has wide ranging effects on the life within it and how society interacts with its marine environment. Given that these effects are so wide ranging they have not been covered in detail here but can be found in the rest of the Intermediate Assessment where links are identified between the temperature of the environment and the indicators of its state.
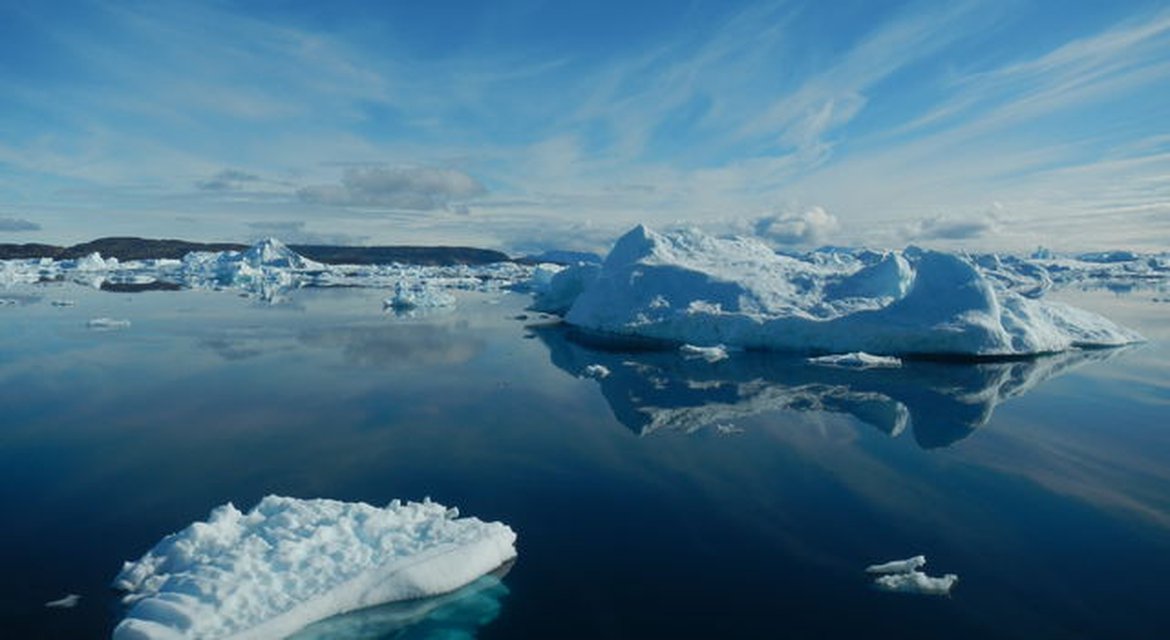
Sea Ice
2011–2015
Arctic sea ice extent, described in terms of area covered at a particular time of year, has varied widely in recent years (AMAP, 2017), but continues to show a decreasing trend, especially during late summer when it reaches its annual minimum. The September monthly average trend for the entire Arctic Ocean is currently a reduction of 13.3% per decade relative to the 1981–2010 average (Arctic Report Card, 2016). The record low in sea ice extent occurred in 2012 (AMAP, 2017; NSIDC). While this trend is less pronounced in the Arctic Waters region than in other parts of the Arctic, it is notable that during the record low sea ice extent recorded in September 2012, there was no ice present anywhere in the Barents Sea. Sea ice thickness has been more difficult to monitor but according to the latest Snow, Water, Ice and Permafrost in the Arctic (SWIPA) assessment (AMAP, 2017), sea ice thickness in the central Arctic Ocean reduced by 65% over the period 1975–2012.
Sea ice can also form in the shallow parts of the southern North Sea in cold winters dominated by easterly winds often associated with the negative phase of the North Atlantic Oscillation, a large-scale pattern describing much of the variability in winter atmospheric pressure across the region. There has been a general decreasing trend in occurrences of North Sea ice winters since the mid-20th century although conditions in the winters of 2010, 2011, 2012 resulted in some ice cover following a decade in which it had been absent (NOSCCA, 2016).
Beyond 2015
September 2016 was tied with 2007 for the second lowest minimum sea ice extent, despite Arctic conditions being more favourable for sea ice with relatively cool and stormy weather in 2016. The National Snow & Ice Data Centre (NSIDC) suggests that with more typical warming in the next few years, very dramatic sea ice losses might be expected (NSIDC, 2016). AMAP (2017) reported that the Arctic could be largely free of sea ice in late summer within the next few decades, possibly as early as the 2030s, although natural variability and other factors make it impossible to make precise predictions. The ice that appears in winter will be thinner, of higher salinity, less rigid, and more mobile than sea ice that currently exists. Sea ice is currently thinning and shrinking more rapidly than projected by most models.
Despite the ongoing trend toward milder conditions and fewer ice winters in the Greater North Sea as the climate warms, the southern North Sea can expect occasional strong ice winters in the future when conditions are favourable (Vavrus et al., 2006; Kodra et al. 2011; NOSCCA, 2016).
Implications
Reduced Arctic sea ice extent could have important socio-economic implications (e.g. shipping routes, fisheries and offshore mineral, oil and gas exploration); the associated activities have the potential to increase impacts on marine ecosystems. Some studies indicate the possibility that reductions in sea ice could open up a direct route for Pacific species to move into the OSPAR Maritime Area (Reid et al., 2007; Miller and Ruiz, 2014). Sea ice is becoming more mobile as its extent and thickness decrease, increasing ice-related hazards for shipping (AMAP, 2017).
A positive warming feedback leads to additional melting as reflective surfaces are replaced by darker surfaces such as open water or land, less energy is radiated back to space and the region warms further.
Evidence suggests that reduced sea ice cover could lead to an increase in cold winters in northern Europe through its effects on atmospheric circulation patterns, thus affecting OSPAR regions beyond the Arctic.
Ocean pH
2011–2015
On a global basis, the post-industrial increase in atmospheric carbon dioxide (CO2) is estimated to have reduced mean surface ocean pH by ~0.1 units, (corresponding to a ~30% increase in hydrogen ion concentration) (Royal Society, 2005). The pH of seawater affects the level of saturation of aragonite and calcite in seawater. The saturation state of these carbonate minerals is important for skeleton and shell building, which is favoured when the water is super-saturated. Since the QSR 2010, many more direct observations confirming an ongoing decrease in pH (or acidification) have been published. The OSPAR / ICES Study Group on Ocean Acidification (SGOA, 2015) examined observations of long-term trends in ocean acidification related chemical parameters in the OSPAR Maritime Area and found that the studies were consistent in showing acidification of near-surface waters of around -0.02 pH units per decade. The rate has been slower in the deeper waters of the North-East Atlantic, although higher rates of acidification and reduction in aragonite saturation may occur in sub-surface water masses relative to surface waters. The primary cause of ocean acidification is uptake of atmospheric CO2 but other processes such as mixing, changing freshwater inputs and input of terrestrial organic carbon can also influence the trajectory of ocean acidification at any given location.
Five North Atlantic datasets for the ocean carbonate system of more than 20 years’ duration were reported by Bates et al. (2014). These show a consistent pattern of surface-ocean pH decrease although with variability in site-specific values. Observations show a downward trend of 0.014 pH units per decade in the Iceland Sea and 0.026 pH units per decade in the Irminger Sea.
The UK Ocean Acidification programme examined the long historical record of pH observations in the ICES database back to 1910, with the most robust information covering the period since 1984. The Greater North Sea, including the English Channel was the only OSPAR region with enough coverage to determine a trend (-0.035 ± 0.014 pH units per decade) (Ostle et al., 2016).
The AMAP assessment of Ocean Acidification (2013) reported a pH decrease of about 0.02 pH units per decade in the Arctic Ocean. It also reported that other processes are important in setting the rate of acidification at any location making its progress non-uniform across the region. The Arctic Ocean might also be particularly vulnerable due to its low temperature (because cold water takes up more CO2), shallow saturation horizon and more limited buffering capacity due to the large input of freshwater.
Beyond 2015
Projections for future ocean acidification for the OSPAR regional seas depend on the future anthropogenic emissions of CO2 and thus on international policy decisions. For example, Magnan et al. (2016) showed that full implication of the Paris Agreement would result in a future decrease of 0.15 pH units in global ocean pH as opposed to a decrease of 0.4 pH units under ‘business-as-usual’ emissions. Estimates made in the context of the UN Framework Convention on Climate Change (UNFCCC, 2016) indicated that the CO2 emissions reductions currently pledged by individual countries would lead to a decrease in global surface ocean pH closer to 0.2–0.3 pH units by the end of the century. The SGOA looked at projected end of century aragonite saturation states and found that that much of the cold-water coral reef habitat in the OSPAR area will be exposed to corrosive waters by the end of the century unless CO2 emissions are greatly curbed.
Implications
The SGOA (2015) reported that changes in aragonite saturation in deep water habitats in the OSPAR Maritime Area could “lead to irreversible damage, including habitat loss, to the detriment of important ecological function and services provided by these ecosystems”.
Changing pH has been linked to a number of impacts in the marine environment. Reduced pH will change the transport, mobilization and accumulation of organic contaminants, radionuclides, hydrocarbons and heavy metals.
A knowledge gap exists concerning indirect effects of reduced pH on the marine ecosystem, species adaptation, interspecies competition for resources, colonisation by non-indigenous species of OSPAR areas, and predator-prey interactions. The combined effects highlight the need to make assessments of impacts based on cumulative effects and within the context of other drivers of change in the ecosystem.
Sea Level
2011–2015
Global mean sea level rose by an average rate of 1.7 mm/y between 1901 and 2013, with a higher rate of 3.2 mm/y shown in the satellite record over the past two decades (IPCC, 2015). This rise in sea level is reflected across European coastlines, albeit to a lower extent in generally northern areas experiencing a higher rate of post-glacial rebound of the land. The impact of rising sea level is most evident when the combination of the local sea level combines with tidal, wave and weather conditions in an extreme high water level event. An increase in the occurrence of extreme high water level events in many locations is due to the rise in local sea level, rather than any change in storm or surge activity (EEA 2014).
The Arctic plays an important role in sea level rise. AMAP (2017) reported that meltwater from Arctic glaciers and ice caps currently accounts for 35% of current global sea level rise. 70% of the Arctic’s contribution to sea level rise comes from Greenland, which lost an average of 375 Gt of ice per year between 2011 and 2014. This is almost twice the rate of loss over the period 2003–2008. In 2012 and 2015, melting occurred over more than half of the Greenland ice sheet and its marine-terminating glaciers both sped up their travel and decreased in area (Arctic Report Card, 2015).
Beyond 2015
In the Intergovernmental Panel on Climate Change’s (IPCC) 5th Assessment report, global mean sea level rise by 2100 under the highest future CO2 emission scenario is estimated to range from 0.45 to 0.82 m (5th to 95th percentile range). Based on improved understanding, AMAP (2017) now estimates that when all sources of sea level rise are considered (not just those from the Arctic), the rise in global sea level by 2100 would be at least 0.52 m for a greenhouse gas reduction scenario and 0.74 m for a business-as-usual scenario. Another study (Grinsted et al., 2015), taking the highest (Representative Concentration Pathway (RCP) 8.5) scenario, and assuming the collapse of marine-based sections of the Antarctic ice sheet, provides less conservative projections (greater than 2 m). These projections are useful for adaptation planning in respect of the high-end scenarios of sea level rise. The regional patterns in the resultant relative sea level at the coasts across Europe reflect differences in uplift or subsidence of land. Most recently, Vousdoukas et al. (2017) reported average projected increases of 57–81 cm in the 100-year extreme sea level event for Europe, including the OSPAR Maritime Area from Gibraltar to the Barents Sea coast of Norway.
Implications
Sea level rise can cause coastal flooding, coastal erosion and the loss of coastal regions. It reduces the return period for extreme high-water level events and threatens coastal ecosystems. Future impacts of sea level rise will be felt most on low-lying coastlines with high population densities and relatively small tidal ranges (Kundzewicz et al., 2001). Adaptation measures (e.g. coastal defence or re-alignment) may affect both coastal communities and coastal ecosystems.
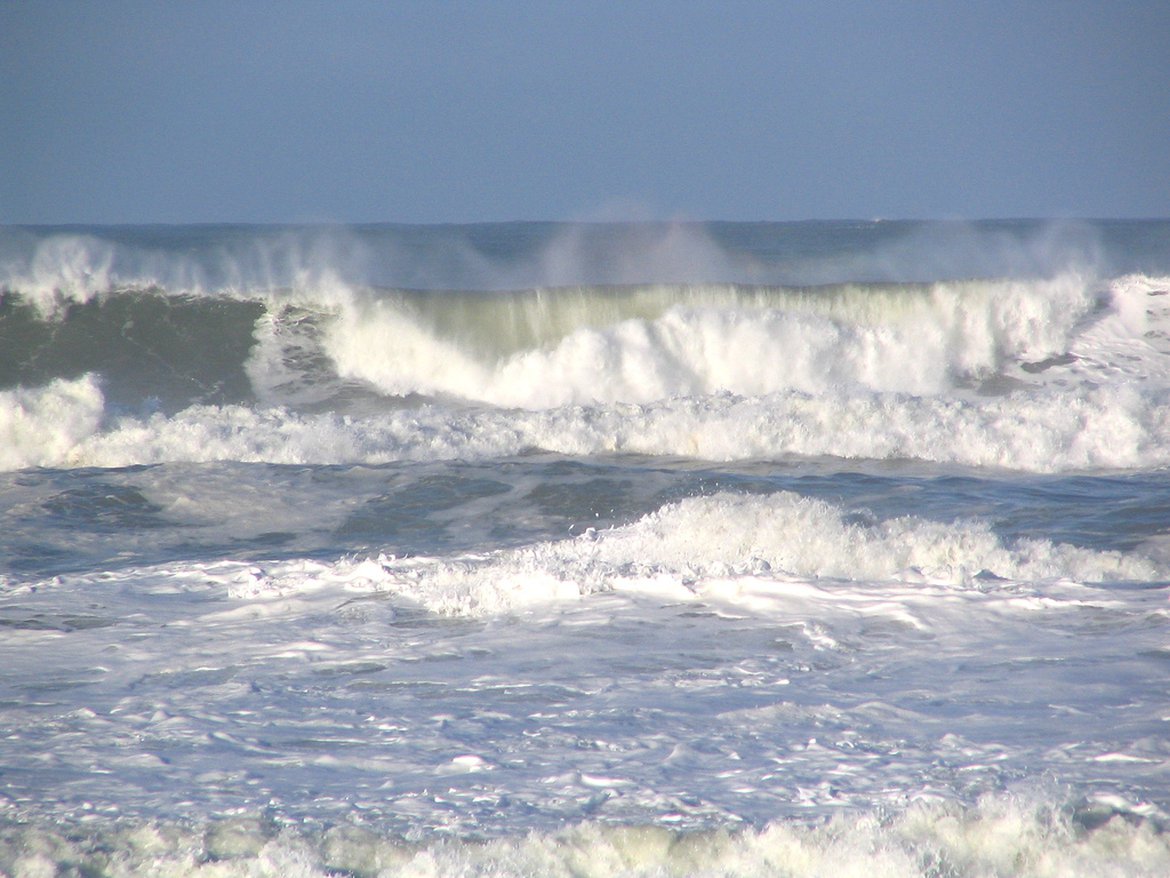
Waves and Storms
2011–2015
Natural variability in the wave and storm climate is large, making long-term trends difficult to discern (Woolf and Wolf, 2013). While recent severe events such as the high number of hurricane-force Atlantic winter storms experienced in 2013–2014 are unusual, they are not necessarily unprecedented. However, there does appear to have been a north-eastward shift in storm tracks, with the number of deep cyclones increasing in the high latitude North Atlantic (north of about 55°N, close to the latitude of Copenhagen) (NOSCCA, 2016).
The IPCC (2015) reports with medium confidence that mean significant wave height has increased since the 1950s over much of the North Atlantic north of 45°N, with typical winter season trends of up to 20 cm per decade. Re-analyses over the longer period of 1871–2010 in the North-East Atlantic showed a positive trend in wave heights but increasing at a lesser rate.
Beyond 2015
Climate models project a continuing northward shift in the storm track, although confidence in such projections is low (IPCC, 2015). As for storms, future projections of wave height are highly uncertain and are in part dependant on changes in the storm track. In the Arctic, more open water is expected in winter as sea ice continues to decline, affecting temperature and the exchange of moisture between the atmosphere and ocean, leading to more extreme weather locally; this may also influence storms and weather at lower latitudes (AMAP, 2017).
Implications
Potential impacts include increasing risk of wave damage, coastal flooding and erosion to coastal communities and disruption of activities in the marine environment, such as fisheries and offshore operations. The IPCC (2015) reported that a northward shift in the projected storm track could enhance extreme rainfall in high northern latitudes during winter. It has also been suggested that this shift in storm track could enhance polar warming (Kug et al., 2010).
Precipitation and Catchments
2011–2015
Observations of river flow around the North Sea over recent decades (1960s to 2010s) show a high degree of interannual variability (in northern areas closely linked to the North Atlantic Oscillation pattern), but with an apparent increase in winter discharge, reflecting a trend towards more intense winter precipitation. There is no discernible trend in summer. Further south, a general trend towards decreased precipitation is evident, particularly in the Atlantic sector of the Iberian Peninsula (EEA, 2014; NOSCCA, 2016).
Beyond 2015
As the trend towards more intense winter precipitation continues in northern Europe, further increases in river inflow to the North Sea in winter are expected. Models project a 30% increase in peak river flow (or more for some rivers in northern basins) by 2100. Impacts will be compounded by changes in land use along rivers and by urbanisation. Impacts around the North Sea show spatial differences from north to south, with evidence less clear for increased high flows in northern France and Belgium. Summer precipitation in Spain and Portugal could be up to 40% lower by the end of the century (EEA, 2014; NOSCCA, 2016).
Implications
Episodic high river flow can lead to increased nutrient, sediment and contaminant loads to the North Sea, affecting water quality and ecosystem function in coastal environments alongside changes in short-term salinity and related stratification. High concentrations of nutrients, sediment and contaminants during periods of low flow in a more extreme climate could also be an issue. Sewer overflow volumes may be up to four times higher in some areas due to the combined effect of urbanisation and climate change. Increased freshwater inputs to the Arctic Ocean have the potential to affect ocean circulation, ocean acidification, and biological productivity, and also to affect weather patterns far to the south.
Other Aspects of Marine Climate
North Atlantic Oscillation
The North Atlantic Oscillation (NAO) is one of the dominant patterns of atmospheric pressure variability and has a significant impact on oceanic conditions (Visbeck, et al., 2001). During winters with a strong NAO Index the ocean responds quickly and the effects can continue throughout the following year. The Hurrell winter (December–March) NAO index is used to describe the state of the NAO. Positive NAO conditions generally lead to a warmer and wetter northern European winter with dry conditions to the south and west.
All but one of the last five winters (2012–2016) have had a positive NAO index. Three of these winters had strong positive index values (above 3, measured in standard deviations) while winter 2013 experienced a strong negative index value (-1.97).
Further information can be found in the ICES’s report on .
Atlantic Meridional Overturning Circulation
The Atlantic Meridional Overturning Circulation (AMOC) is driven by changes in the temperature and salinity of surface water as it moves north in the Atlantic. The cooling of warm Atlantic waters as they move poleward leads to the sinking of dense waters, which then move south eventually supplying all the oceans of the world with deep water. North-western Europe benefits from the regional warming provided by this north-flowing current. As the circulation requires water to become denser in northern latitudes, freshwater input has the potential to slow or stop the circulation in its current form if the circulating water becomes too fresh and therefore insufficiently dense to sink.
Further information can be found in the Natural Environment Research Council (NERC) report on .
Salinity
The salinity of the surface layer of the ocean (the upper 100 m) is strongly influenced by changes in precipitation and evaporation (Josey and Marsh, 2005) and is more variable than deep-sea salinity. Ocean salinity is important through its effect on water density and the resultant impacts on ocean circulation.
Declining sea ice, acceleration of the global water cycle and thawing of land ice will all influence ocean salinity. In shelf seas, changes in salinity at the surface would affect the presence or absence of stratification of the water column and on local circulation.
Further information can be found in the ICES’s report on and in the .