

Status and Trend for Heavy Metals (Cadmium, Mercury and Lead) in Sediment
D8 - Concentrations of Contaminants
D8.1 - Concentration of contaminants
Mean concentrations of mercury, cadmium and lead concentrations in marine sediments are decreasing or show no significant change in the majority of areas assessed. Nevertheless, concentrations in all areas are above natural background levels, and in four of the six areas assessed are above levels where adverse ecological effects cannot be ruled out.
Area assessed
Printable Summary
Background
OSPAR’s strategic objective is to prevent pollution of the OSPAR Maritime Area by continuously reducing discharges, emissions and losses of hazardous substances. Metals are ubiquitous hazardous substances in the environment, found in marine sediments in all OSPAR regions. The most toxic metals to humans and animals are mercury, cadmium and lead, known as heavy metals, all of which naturally occur in the environment.
Mercury, cadmium and lead enter the marine environment from a number of natural, agricultural and industrial processes, such as emissions from coal-fired power stations, via long range transportation by air, riverine input or run-off from land (). Some metals used as antifouling chemicals (mainly copper) and corrosion anodes (mainly zinc) are deliberately placed in the marine environment through their use on ships’ hulls or marine installations, causing hot spots concentrations of these metals in and around harbours
Mercury is highly toxic. Mercury and cadmium accumulate in the food chain, while lead is not accumulated via the food chain.
Heavy metals do not disappear over time and can be trapped in deeper levels of sediment until mining, geological or biological processes release them, at which point they may affect biota.

Coal-fired power station in Scotland, an example of a potential source of heavy metals
There are natural concentrations of heavy metals in all waters, sediments, and marine biota, referred to as the background concentrations. OSPAR uses the United States National Oceanic and Atmospheric Administration guidelines for assessing the ecological significance of contaminant concentrations in sediment (Effects Range-Low; ERL) as proxy for Environmental Assessment Criteria (EAC).
The most toxic metals to fish and animals are mercury, cadmium and lead. Although other metals are also included in the OSPAR Coordinated Environmental Monitoring Programme, these are the three priority heavy metals.
Mercury has the potential to evaporate and be transported as a gas through the air; other heavy metals are transported as fine particles or bound to other particles. Heavy metals can be trapped in deeper levels of sediment until mining, geological or biological processes release them, at which point they may affect biota.
Mercury and cadmium accumulate in the food chain and are considered the most toxic of the three heavy metals. The effects of high concentrations of heavy metals on humans can include: decreased learning ability (lead and mercury); reduced strength of bones (cadmium); and damage to the central nervous system (mercury). This has led to restrictions on most uses of cadmium and lead, and strict bans on mercury use.
In the Roman empire lead was used for water pipes, as sweetener in wine (lead-acetate) and as colouring for skin-cream. In modern times it is still being used in car batteries and until 2000 in leaded fuel as an engine lubricant, the major source of lead pollution in air and water during the 1970s until its ban (Larsen et al., 2012). It has also been used as a softener in PVC piping.
Mercury has been used in medicine as an antibacterial agent and as a liquid anode in electrolysis in the paper industry. It has also been used in dental fillings, in thermometers and other scientific instruments. The Minamata Convention adopted in 2013 but still to enter into force, is a global treaty to protect human health and the environment from the adverse effects of mercury http://www.zeromercury.org).
Cadmium is used in batteries and electronics and previously in some red paints and plastics. It is found in minerals mined for zinc, copper and lead, and is a minor constituent of all products of these heavy metals. As it is taken up from soil by plants, it is also concentrated in plants, especially tobacco leaves, sunflower and linseed.
Both cadmium and mercury are suspected carcinogens.
In assessing heavy metals both ‘relative’ and ‘absolute’ aspects have been analysed:
• ‘Trend assessment’ or spatial distribution assessment to focus on relative differences and changes on spatial and temporal scales – provides information about the rates of change and whether contamination is widespread or confined to specific locations; and
• ‘Status’ assessment of the significance of the (risk of) pollution, defined as the status where metals are at a hazardous level, usually requires assessment criteria that take account of the possible severity of the impacts and hence requires criteria that take account of the natural conditions (background concentrations) and the ecotoxicology of the heavy metals. For example, (Effects Range-Low (ERL) values are used by OSPAR as proxy Environmental Assessment Criteria (EAC).
OSPAR has clarified that in assessing the Co-ordinated Environmental Monitoring Programme (CEMP) data the primary assessment value used in the assessment of heavy metal concentrations in sediment and biota, “corresponds to the achievement, or failure to achieve, statutory targets or policy objectives for contaminants in these matrices” (OSPAR, 2009). This set of assessment criteria was specifically compiled for the assessment of CEMP monitoring data on hazardous substances contributing to the QSR 2010. The use of this set was considered an interim solution for the purposes of the QSR 2010 until more appropriate approaches to defining assessment criteria could be agreed on and implemented. These criteria have also been used in the annually recurring CEMP assessments since 2010 and will be used until OSPAR agrees on the adoption of improved assessment criteria and subject to the conditions set out in the agreement.
Trends in heavy metal concentrations in sediment are presented. Two assessment criteria are used to assess the status of heavy metal concentrations in sediment: Background Assessment Concentrations (BACs) and United States National Oceanic and Atmospheric Administration (NOAA) sediment quality guidelines; Effects Range-Low (ERL) (NOAA, 1999).
OSPAR IA 2017 Indicator Assessment values are not to be considered as equivalent to proposed European Union Marine Strategy Framework Directive (MSFD) criteria threshold values, however they can be used for the purposes of their MSFD obligations by those Contracting Parties that wish to do so.
Provenance and limitations of BACs
Background Assessment Concentrations (BACs) were developed by OSPAR for testing whether measured concentrations are near background levels for naturally occurring substances and close to zero for man-made substances, the ultimate aim of the OSPAR Hazardous Substances Strategy. Mean concentrations significantly below the BAC are said to be near background (naturally occurring concentrations). BACs are statistical tools defined in relation to the background concentrations or low concentrations, which enable statistical testing of whether observed concentrations could be considered to be near background concentrations.
Background concentrations (BCs) represent the concentrations of hazardous substances that would be expected in the North-East Atlantic if certain industrial developments had not happened. They represent the concentrations of those substances at ‘remote’ sites, or in ‘pristine’ conditions based on contemporary or historical data respectively, in the absence of significant mineralisation and/or oceanographic influences. In this way, they relate to the background values referred to in the OSPAR Hazardous Substances Strategy. BCs for synthetic, man-made substances should be regarded as zero. It is recognised that natural processes such as geological variability or upwelling of oceanic waters near the coast may lead to significant variations in background concentrations of contaminants, for example trace heavy metals. The natural variability of background concentrations should be taken into account in the interpretation of CEMP data, and local conditions should be taken into account when assessing the significance of any exceedance.
Low concentrations (LCs) are values used to assist the derivation of BACs where there have been difficulties in assembling a dataset on concentrations in remote or pristine areas from which to derive BCs. LCs have been prepared on the basis of datasets from areas that could generally be considered remote but which could not be guaranteed to be free from the influence of long-range atmospheric transport of contaminants. LCs have also been used to assess concentrations in sediments from Spain due to the specific bulk composition of sediments from the coasts of the Iberian Peninsula. It is recognised that natural background concentrations may be lower than the LCs and that they may not be directly applicable across the entire Convention area.
BACs are calculated according to the method set out in Section 4 of the CEMP Assessment Manual (OSPAR, 2008). The outcome is that, on the basis of what is known about variability in observations, there is a 90% probability that the observed mean concentration will be below the BAC when the true mean concentration is at the BC. Where this is the case, the true concentrations can be regarded as ‘near background’ (for naturally occurring substances) or ‘close to zero’ (for man-made substances).
BACs are calculated on the basis of variability within the CEMP dataset currently available through databases held by the ICES Data Centre and will be refined at the working level by the relevant assessment group as further CEMP monitoring data are collected.
Provenance and limitations of ERLs
OSPAR has not yet established EACs for heavy metals in sediment. Therefore a proxy means of assessment has been used. ‘Effects range’ values were developed by the United States National Oceanic and Atmospheric Administration (NOAA) for assessing the ecological significance of contaminant concentrations in sediment, to protect against the potential for adverse biological effects on organisms. Concentrations below the Effects Range-Low (ERL) level rarely cause adverse effects in marine organisms.
The ERL value is defined as the lower tenth percentile of the data set of concentrations in sediments, which were associated with biological effects. Adverse effects on organisms are rarely observed when concentrations fall below the ERL value, and the ERL therefore has some parallels with the philosophy underlying the OSPAR EACs and the Environmental Quality Standards (EQSs) of the European Union Water Framework Directive. The procedure by which ERL criteria are derived is very different from the methods used to derive EACs and EQSs, and so precise equivalence between the two sets of criteria should not be expected. ERL values are used in sediment assessments of contaminants as an interim solution where recommended EACs are not available.
Assessment Methods
For each heavy metal at each monitoring site, the time series of concentration measurements was assessed for trends and status using the methods described in the contaminants online assessment tool (http://dome.ices.dk/osparmime2016/main.html). The results from these individual time series were then synthesised at the OSPAR assessment area scale in a series of meta-analyses.
Trend assessments included those monitoring sites that were representative of general conditions, and excluded those monitoring sites impacted due to a point source as well as baseline monitoring sites where trends would not be expected. The analysis was also restricted to assessment areas where there were at least three monitoring sites with trend information and where those monitoring sites had reasonable geographic spread.
The trend in each metal at each monitoring site was summarised by the estimated annual change in log concentration, with its associated standard error. The annual change in log concentration was then modelled by a linear mixed model with fixed effects:
~ heavy metal: OSPAR contaminants assessment areas
and random effects:
~ monitoring site + metal: monitoring site + within-series variation
The choice of fixed and random effects was motivated by the assumption that the heavy metals could have very different trends as they have different sources. Thus, the fixed effects measure the trend in each heavy metal in each OSPAR contaminants assessment area and the random effects measure variation in trends:
- between monitoring sites common across heavy metals (monitoring site); and
- residual variation (heavy metal: monitoring site + within-series variation).
There are two residual terms. Within-series variation is the variation associated with the estimate of the trend from the individual time series and is assumed known (and given by the square of the standard error). Heavy metal: monitoring site allows for any additional residual variation.
Evidence of trends in heavy metal concentrations at the assessment area scale was then assessed by plotting the estimated fixed effects with point-wise 95% confidence intervals.
Similar analyses explored status at the assessment area scale. Two summary measures were considered: the log ratio of the fitted concentration in the last monitoring year to the ERL; and the log ratio of the fitted concentration in the last monitoring year to the BAC. Baseline monitoring sites were also included in these analyses.
BAC assessment criteria differ spatially. The BACs and ERL assessment criteria used to assess sediment are set out in Table a and the number of monitoring sites with time series used for status and trend assessments are set out in Table b.
| BAC | BAC | ERL | |
|---|---|---|---|
| mg/kg dw | All OSPAR assessment areas except Iberian Sea and Gulf of Cadiz | Iberian Sea and Gulf of Cadiz | All OSPAR assessment areas |
| Cadmium | 0.31 | 0.129 | 1.2 |
| Mercury | 0.07 | 0.091 | 0.15 |
| Lead | 38 | 22.4 | 47 |
| OSPAR region | OSPAR assessment area | Status | Trends | ||||
|---|---|---|---|---|---|---|---|
| Mercury | Cadmium | Lead | Mercury | Cadmium | Lead | ||
| Greater North Sea | Northern North Sea | 24 | 24 | 25 | 19 | 15 | 22 |
| Southern North Sea | 62 | 63 | 64 | 48 | 47 | 56 | |
| English Channel | 15 | 14 | 15 | 5 | 4 | 5 | |
| Celtic Seas | Irish and Scottish West Coasts | 7 | 7 | 7 | 7 | 6 | 7 |
| Irish Sea | 17 | 13 | 18 | 17 | 12 | 17 | |
| Celtic Sea | 2 | 2 | 2 | 2 | 2 | 2 | |
| Bay of Biscay and Iberian Coast | Iberian Sea | 15 | 15 | 15 | 0 | 0 | 0 |
| Gulf of Cadiz | 14 | 14 | 14 | 10 | 10 | 10 | |
Differences in methodology used for the IA 2017 compared to the QSR 2010
For the IA 2017, a meta-analysis is used to synthesise the individual time series results and provide an assessment of status and trend at the assessment area level. Meta-analyses take into account both the estimate of status or trend in each time series and the uncertainty in that estimate. They provide a more objective regional assessment than was possible in the QSR 2010, where a simple tabulation of the trend and status at each monitoring site was presented.
Results
Heavy metals in sediment are monitored on a regular basis as part of the OSPAR Co-ordinated Environmental Monitoring Programme (CEMP), at between 65 and 125 monitoring sites (Figure 1) depending on the heavy metal monitored. The assessment is based on monitoring sites that have been monitored at least since 2009; with some monitored since 1989. Temporal trends are assessed from the 10 years of monitoring data (i.e. 2005–2015), and the trend is determined from the last 5 years of data.
The concentrations of mercury, cadmium and lead were compared to Background Assessment Concentrations (BACs) and Effects Range-Low (ERL) values. Mercury and lead concentrations in sediment are at or above the BAC in all contaminants assessment areas. Mean concentrations of cadmium are below the BAC (Figure 2) in three of the six areas assessed: Northern North Sea, Irish and Scottish West Coast and the Irish Sea.
Mercury concentrations in sediment are at or above ERL in three of the six assessment areas (Figure 3). Concentrations of cadmium in sediment are below the ERL in all assessment areas. Lead concentrations are at or above the ERL in five of the six assessment areas, and below the ERL only in the Irish and Scottish West Coast assessment area.

Figure 1: Monitoring sites used to assess heavy metal concentrations in sediment by OSPAR contaminants assessment areas (white lines) determined by hydrogeographic principles and expert knowledge not OSPAR internal boundaries
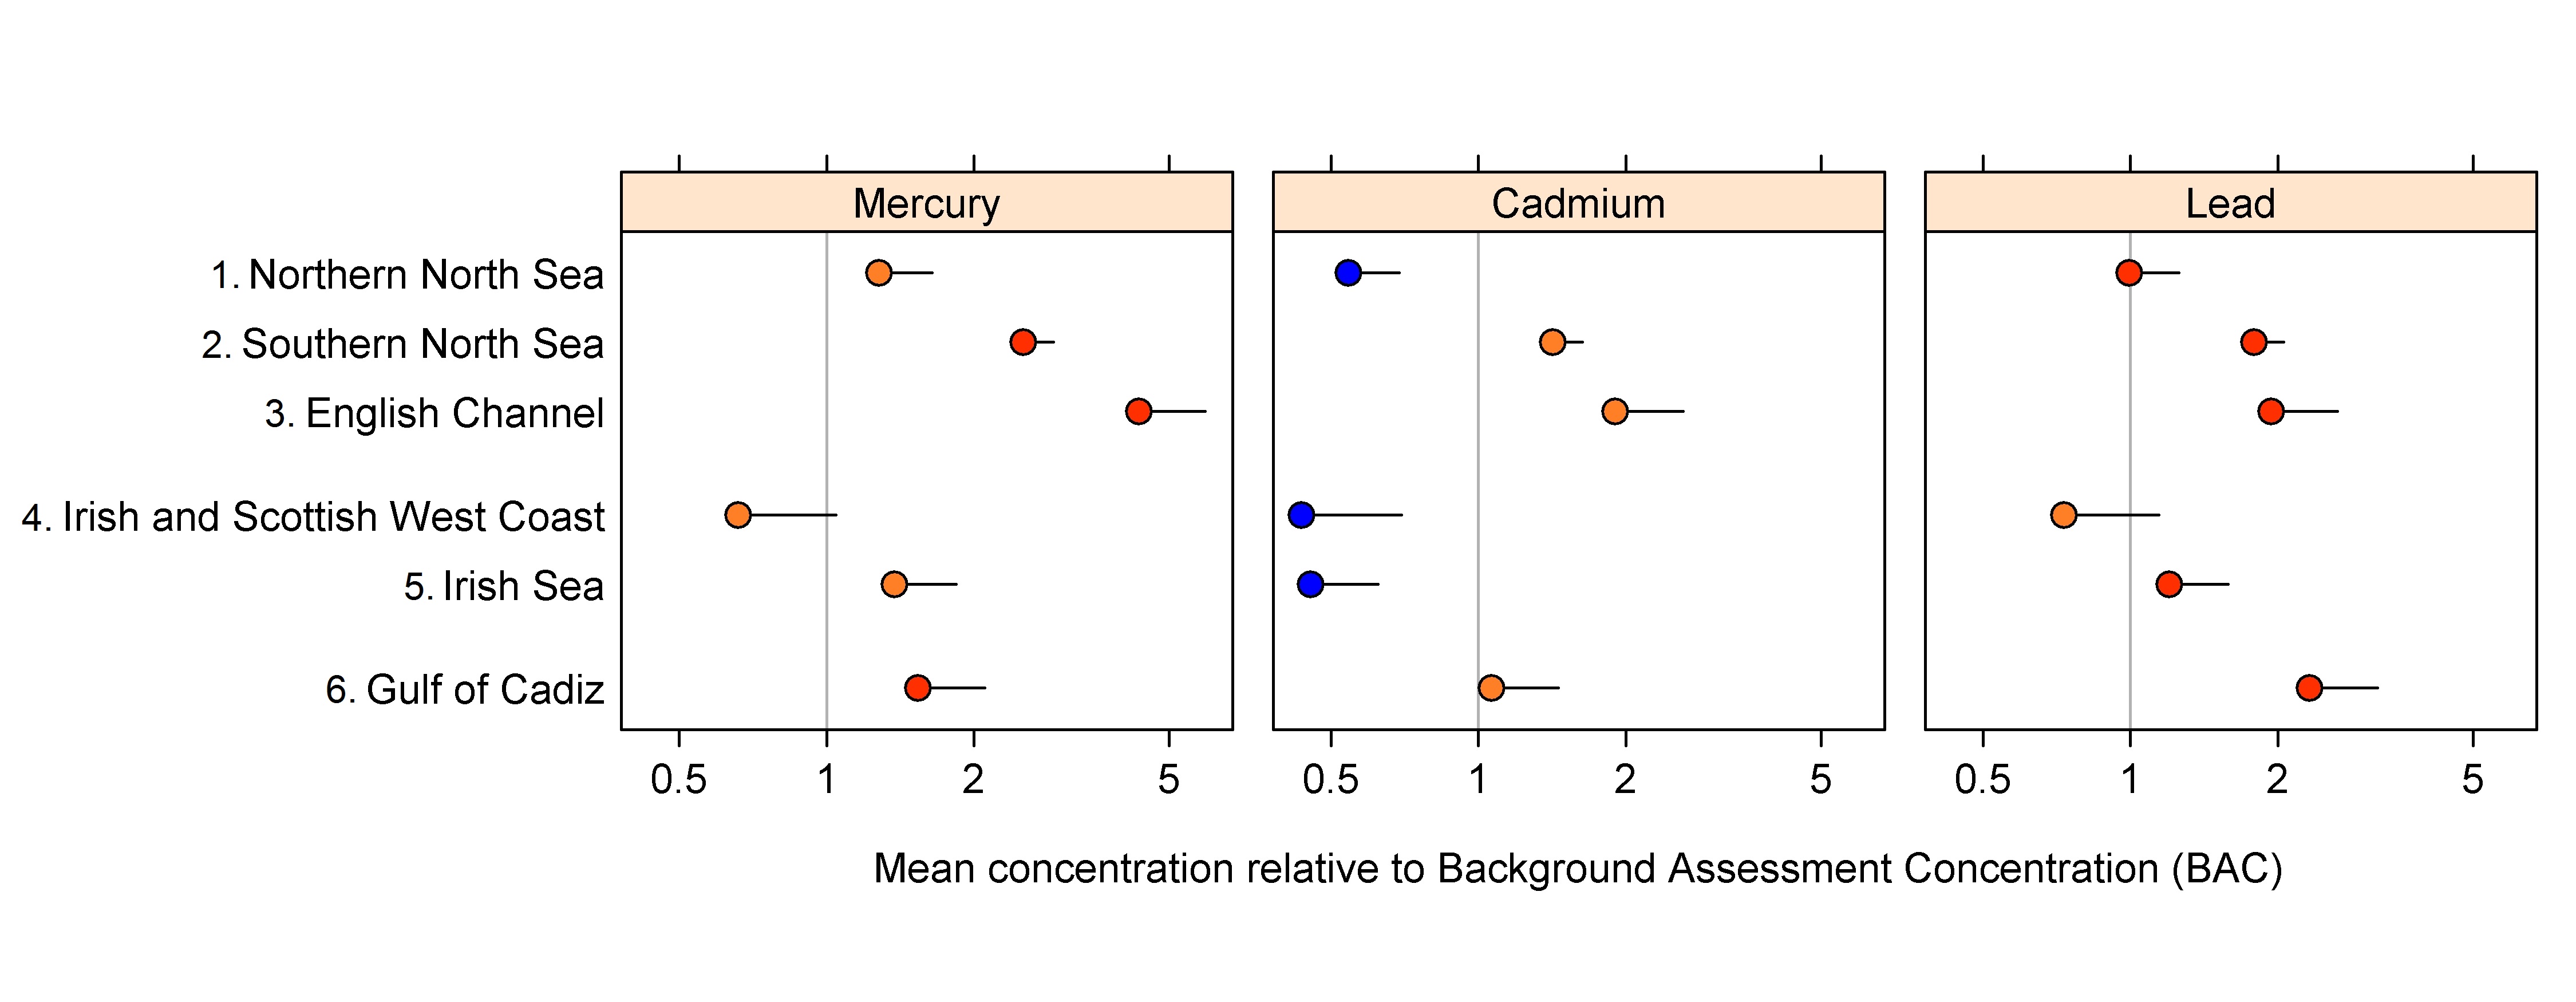
Figure 2: Mean concentrations of three heavy metals in sediment in OSPAR contaminants assessment areas relative to the Background Assessment Concentration (BAC) (with 95% upper confidence limits)
Value of 1 means that the mean concentration equals the BAC. Blue, mean concentration statistically significantly (p <0.05) below the BAC and the ERL. Orange, mean concentrations at or above BAC but statistically significantly below the Effects Range-Low (ERL). Red, mean concentration is above the BAC and at or above the ERL
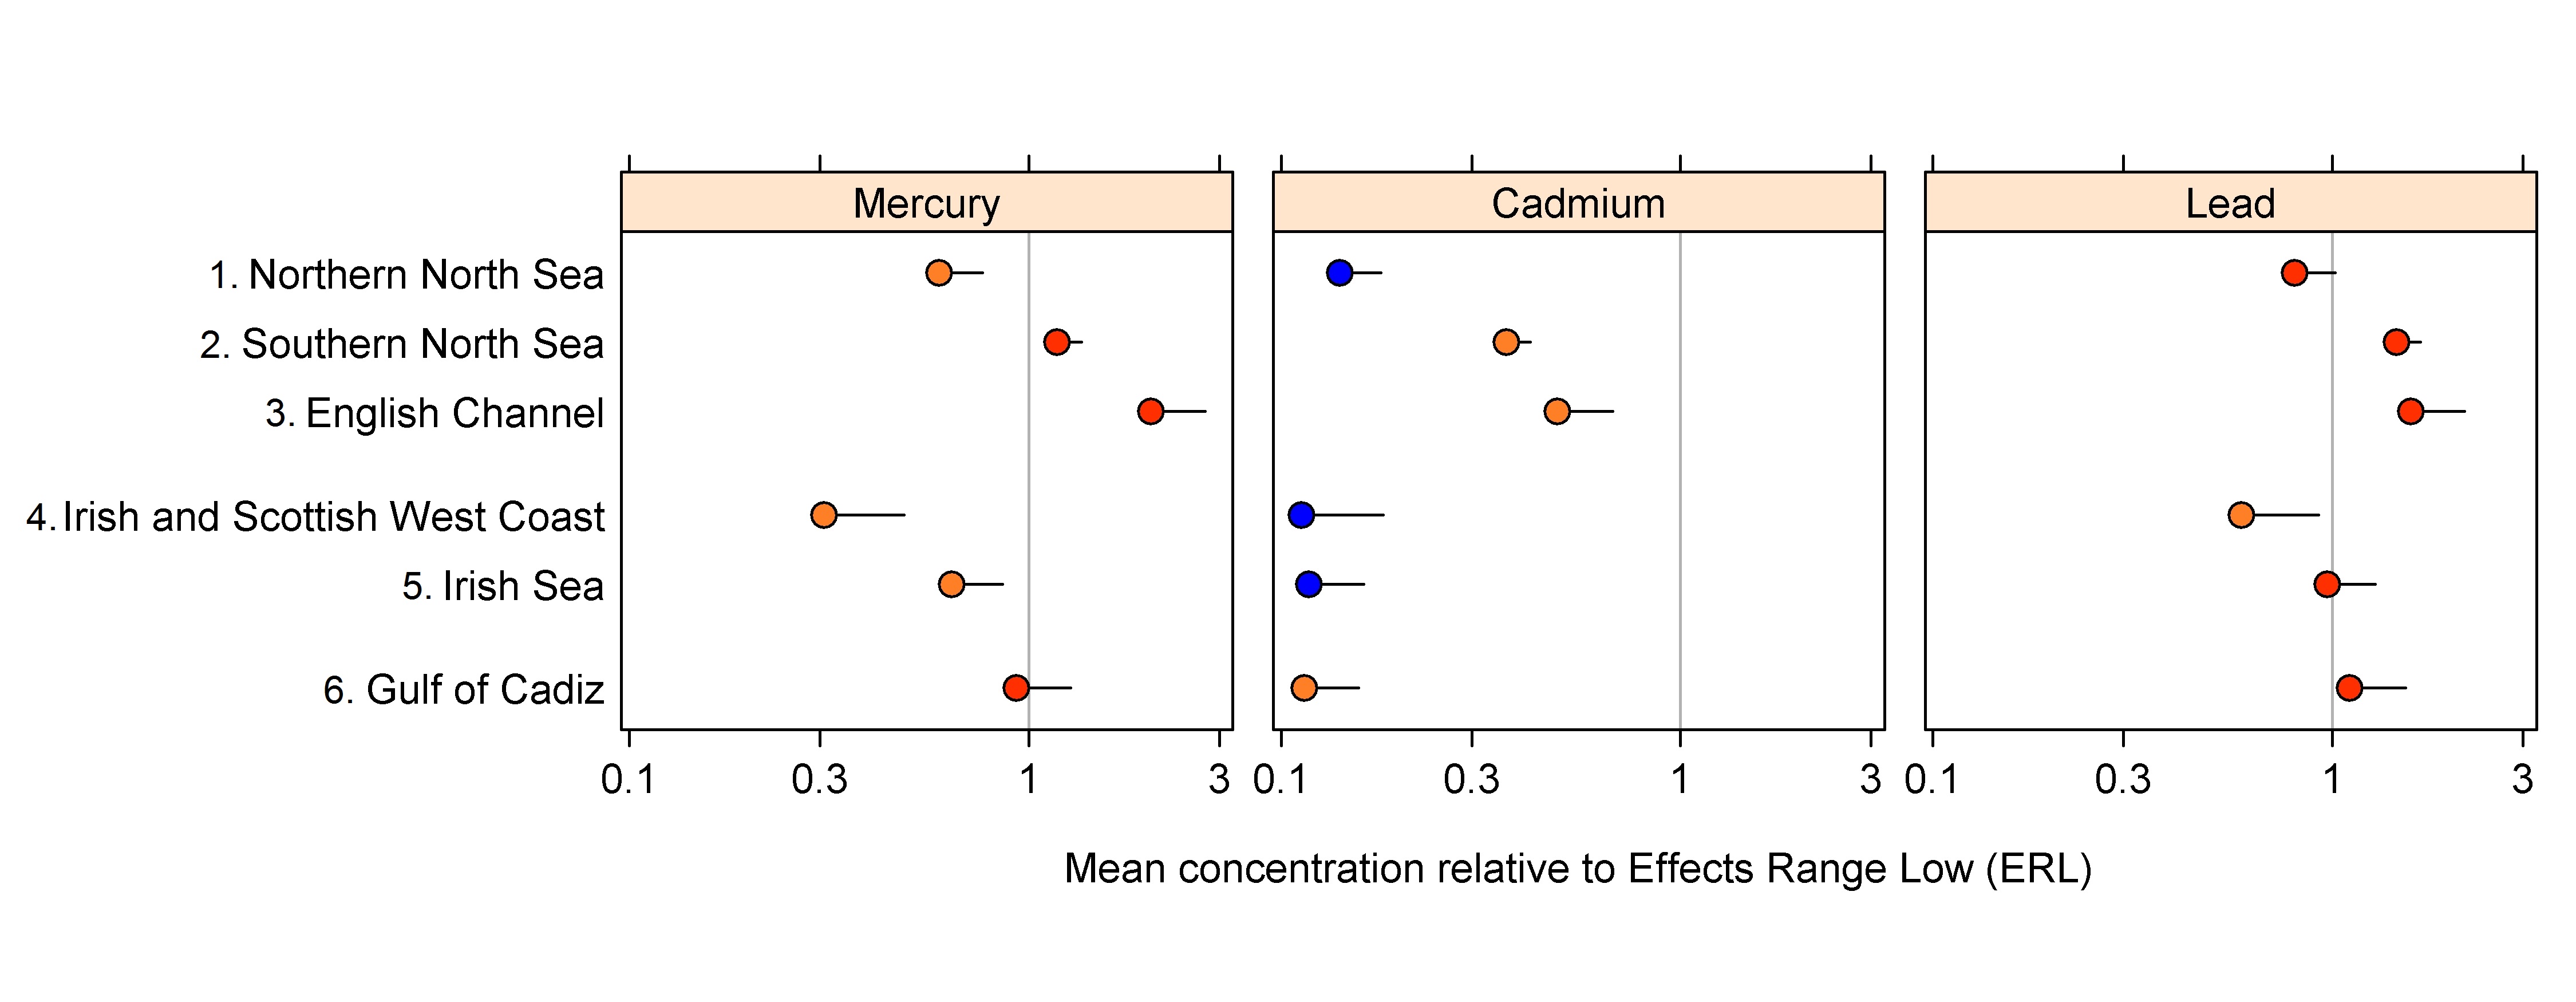
Figure 3: Mean concentrations of heavy metals in sediments relative to Effects Range-Low (ERL) concentration (with 95% upper confidence limits)
Value of 1 means that the mean concentration equals the ERL. Blue, mean concentration is statistically significantly (p <0.05) below the Background Assessment Concentration (BAC) and the ERL. Orange, mean concentration significantly below the ERL but at or above BAC. Red, mean concentration is above the BAC and at or above the ERL
The temporal trends in (overall mean) heavy metal concentrations in sediment (Figure 4) show decreasing levels of mercury in five of the six assessment areas and no statistically significant change in concentrations in the English Channel. Concentrations of cadmium show no statistically significant change in five assessment areas, but are decreasing in the Southern North Sea. Lead concentrations show no statistically significant change in four assessment areas and a downward trend in the Southern North Sea. In the Gulf of Cadiz there is an upward trend for lead.
This is a different pattern from that for biota, where most mercury concentrations show no statistically significant change and lead concentrations at most monitoring sites are decreasing ( Heavy Metals in Fish and Shellfish Common Indicator Assessment ).
The response of sediments to measures taken to reduce heavy metal is expected to be slower than for biota, because the upper sediment layer (top few centimetres) sampled for analysis can represent several years of sedimentation and thus integrate heavy metal inputs over the corresponding period.
There is high confidence in the assessment and sampling methodology and high confidence in the data used.
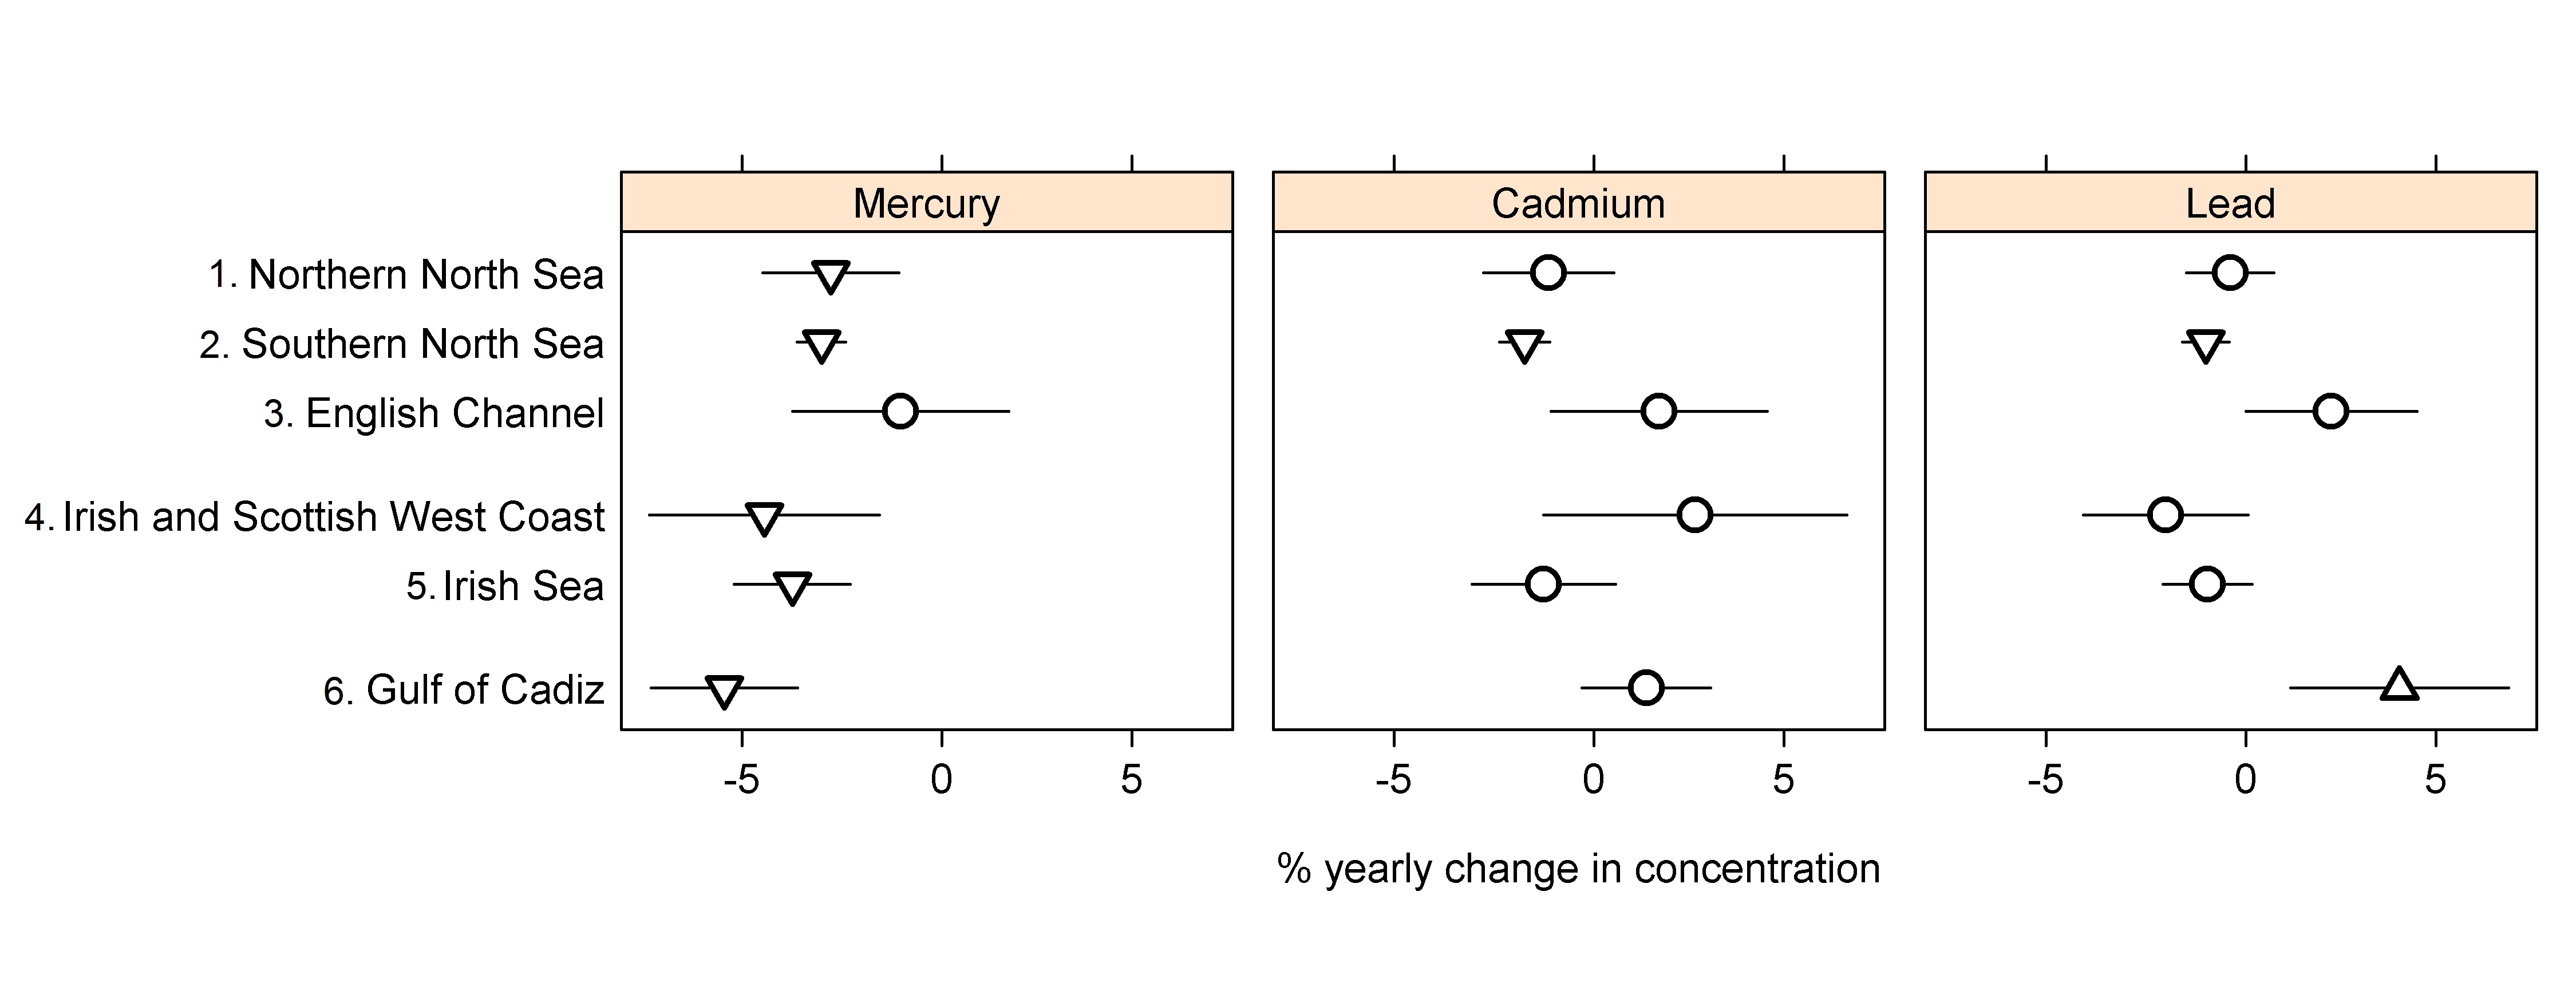
Figure 4: Percentage annual change in heavy metal concentrations in sediment in six OSPAR contaminants assessment areas
No statistically significant change in mean concentration (circle), mean concentration is significantly decreasing (downward triangle), mean concentration is significantly increasing (upward triangle), 95% confidence limits (lines)
Individual Time Series Results per Monitoring Site
A summary of individual time series results at monitoring sites across the OSPAR Maritime Area for heavy metal concentrations in sediment is presented here http://dome.ices.dk/osparmime2016/regional_assessment_sediment_metals.html. In total, mean concentrations of heavy metals in sediment are above the ERL in 243 out of 479 time series. In 90 out of 308 time series where trend assessments have been undertaken, mean concentrations have increased over the assessment period (since 2005). It should be noted that not all individual time series results are included in the regional assessments (see number of time series used in each OSPAR region and assessment area in Table b), due to the criteria set out in the Assessment Methods.
Confidence Assessment
There is high confidence in the quality of the data used for this assessment. The data have been collected over many years using established sampling methodologies. There is sufficient temporal and spatial coverage and no significant data gaps in the areas assessed over the relevant time periods. Although synthesis of monitoring site data for assessment area scale uses new methods they are based on established and internationally recognised protocols for monitoring and assessment per monitoring site, therefore there is also high confidence in the method.
Conclusion
The ultimate aim of the OSPAR Hazardous Substances Strategy is for concentrations of heavy metals in sediment to be at natural background levels. However, in most assessment areas heavy metal concentrations in sediment are above natural background concentrations. The highest concentrations in sediment of mercury and cadmium are found in the English Channel. Lead concentrations in sediment are highest in the Gulf of Cadiz. The lowest concentrations for all heavy metals are in the Irish and Scottish West Coast.
In half of the assessment areas mercury concentrations in sediment are above the ERL and in five of six monitoring sites lead concentrations are at or above the ERL. This means that in these assessment areas adverse ecological effects cannot be ruled out. In contrast cadmium concentrations are below the ERL in all six assessment areas.
The generally decreasing trends for mercury are not reflected in the concentrations of cadmium and lead; most cadmium and lead concentrations in sediment show no statistically significant change.
Knowledge Gaps
There is a lack of ecotoxicological data for developing new assessment criteria based on the European Union Water Framework Directive or OSPAR Environmental Assessment Criteria (EAC) principles, to replace the current Effects Range-Low (ERL) criteria. There are too few monitoring sites in Arctic Waters for an area assessment to be carried out.
Larsen M.M., Blusztajn J.S., Andersen O., Dahllöf I. (2012). Lead isotopes in marine surface sediments reveal historical use of leaded fuel. Journal of Environmental Monitoring, 2012:14, 2893-2901. DOI: 10.1039/c2em30579h
NOAA (1999). Sediment Quality Guidelines developed for the National Status and Trends Program. National Oceanic and Atmospheric Administration, US Department of Commerce, United States of America. 12pp
O’Conner, T.P. (2004): Marine Pollution Bulletin 49, 383–385
OSPAR (2008). OSPAR Publication 2008-379 CEMP Assessment Manual: Co-ordinated Environmental Monitoring Programme Assessment Manual for contaminants in sediment and biota
OSPAR (2009). OSPAR Publication 2009-461 Background Document on CEMP Assessment Criteria for the QSR 2010
| Sheet reference | HASEC17/D810 |
|---|---|
| Assessment type | Intermediate Assessment |
| Context (1) | Hazardous Substances |
| Context (2) | OSPAR Agreement 1997-08 JAMP Guidelines for the sampling and analysis of mercury in air and precipitation |
| Context (3) | D8 - Concentrations of Contaminants |
| Context (4) | D8.1 - Concentration of contaminants |
| Point of contact | Martin Mørk Larsen |
secretariat@ospar.org | |
| Metadata date | 2017-09-15 |
| Title | Status and Trend for Heavy Metals (Mercury, Cadmium, and Lead) in Sediment |
| Resource abstract | Common indicator assessment of trends and concentrations of heavy metals (mercury, cadmium and lead) in sediment. Applicable to Greater North Sea, Celtic Seas and the Gulf of Cadiz. |
| Linkage | https://www.ospar.org/convention/agreements?q=1997-08&t=32281&a=&s= |
| Topic category | Environment |
| Indirect spatial reference | L3.2.2.1;L3.2.3.1;L3.2.8.1;L3.2.8.2;L3.2.8.3;L3.2.5.1;L3.2.5.2;L3.2.5.3;L3.2.5.4;L3.2.5.5;L3.2.5.6;L3.2.5.7;L3.2.5.8;L3.2.5.9;L3.2.5.10;L3.2.5.11;L3.2.5.12;L3.2.5.13; |
| N Lat | 62.0000008852327 |
| E Lon | 11.0587692133286 |
| S Lat | 36.0002573554926 |
| W Lon | -12.0250000001498 |
| Countries | BE, DE, FR, IE, NL, PT, UK |
| Start date | 2009-01-01 |
| End date | 2015-01-01 |
| Date of publication | 2017-06-30 |
| Conditions applying to access and use | https://www.ospar.org/site/assets/files/1215/ospar_data_conditions_of_use.pdf |
| Data Snapshot | https://odims.ospar.org/documents/316/download |
| Data Results | http://dome.ices.dk/osparmime2016/regional_assessment_sediment_metals.html |
| Data Results | https://odims.ospar.org/documents/293/download |
| Data Source | http://ices.dk/marine-data/data-portals/Pages/DOME.aspx |
| Data Source | http://dome.ices.dk/osparmime2016/main.html |
| Data Source | http://dome.ices.dk/views/ContaminantsSediment.aspx |
| Data Source | https://odims.ospar.org/layers/geonode:ospar_ia2017_metals_sediment_2017_01_001 |