

Nutrient Inputs to the Greater North Sea and the Bay of Biscay and Iberian Coast
D5 - Eutrophication
D5.1 - Nutrients levels
Inputs of nitrogen to the Greater North Sea via water and air show a weak downward trend. Waterborne phosphorus inputs have reduced significantly. The decline slowed in the early 2000s but continues. Waterborne phosphorus inputs to the Bay of Biscay and Iberian Coast have decreased but nitrogen inputs have not.
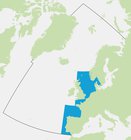
Area assessed
Printable Summary
Background
OSPAR’s strategic objective with regard to eutrophication is to combat eutrophication in the OSPAR Maritime Area, with the ultimate aim to achieve and maintain a healthy marine environment where anthropogenic eutrophication does not occur. The procedure to assess progress towards this objective takes into account the causes, and direct and indirect effects of eutrophication. Enriching the sea with nutrients can lead to eutrophication problems if this results in undesirable disturbances such as excessive growth of phytoplankton (algae), causing oxygen depletion in bottom waters leading to behavioural changes or even death of fish and other species. Elevated nutrient concentrations are thus an important indicator of where eutrophication might occur.
Nutrients, such as nitrogen and phosphorous, enter the marine environment from the atmosphere, rivers, land runoff, or by direct discharges into the sea. Human activities can result in large quantities of nutrients entering the sea (Figures 1 and 2). Data from long-term monitoring help scientists to quantify the effects of human activities and evaluate the success of measures taken to reduce nutrient inputs. One of main directions in the OSPAR Eutrophication Strategy is to cooperate to set appropriate nutrient reduction targets for problem areas with regard to eutrophication.
Nutrient emissions are regulated through OSPAR Recommendations and several EU Directives. Atmospheric emissions are also regulated through the UNECE Convention on Long range Transport of Atmospheric Pollution.
This assessment describes nutrient inputs of nitrogen and phosphorus to the Greater North Sea (waterborne and airborne) and the Bay of Biscay and Iberian Coast (waterborne).
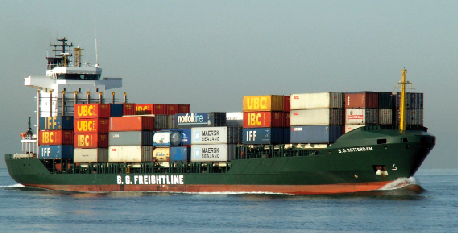
Figure 1: Exhaust emissions, including from shipping, are a significant source of atmospheric nitrogen deposition at sea. ©Alfvan Beem
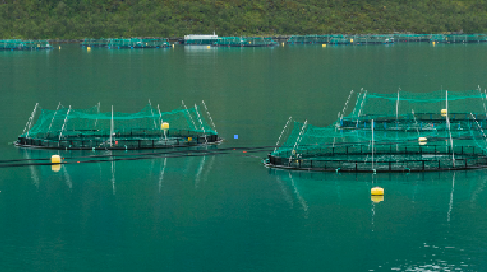
Figure 2: Fish farming in Torskefjorden Norway. Open cage fish farms are a source of nutrients to the surrounding waters. ©Ximonic/Simo Räsänen
Eutrophication is the result of excessive enrichment of water with nutrients. This may cause accelerated growth of algae and / or higher forms of plant life (Council Directive 91/676/EEC). This may result in an undesirable disturbance to the balance of organisms present and thus to the overall water quality. Undesirable disturbances can include shifts in the composition and extent of flora and fauna and the depletion of oxygen due to decomposition of accumulated biomass. Such disturbances then have other effects, such as changes in habitats and biodiversity, blooms of nuisance algae or macroalgae, decrease in water clarity and behavioural changes or even death of fish and other species. Identifying causal links between these disturbances and nutrient enrichment can be complicated by other pressures. Cumulative effects, including climate change, may have similar effects on biological communities and dissolved oxygen, further complicating efforts to demonstrate causal links.
The OSPAR Commission’s strategic objective, with regard to eutrophication, is to combat eutrophication in the OSPAR Maritime Area, with the ultimate aim that by 2020 the OSPAR Maritime Area is a healthy marine environment where anthropogenic eutrophication does not occur (OSPAR, 2010). The OSPAR Eutrophication Strategy requires assessment of eutrophication to be based on the ecological consequences of nutrient enrichment and not just on nutrient enrichment alone, i.e. finding reliable evidence for accelerated growth of algae and / or macrophytes caused by anthropogenic nutrient enrichment, leading to undesirable disturbance. Eutrophication is diagnosed using OSPAR’s harmonised criteria of nutrient inputs, concentrations and ratios, chlorophyll-a concentrations, phytoplankton indicator species, macrophytes, dissolved oxygen levels, incidence of fish kills and changes in zoobenthos (OSPAR, 2010). As there is no single indicator of disturbance caused by marine eutrophication, OSPAR applies a multi-step method using the harmonised criteria OSPAR, 2013). Eutrophication is considered to have occurred if there is evidence for all of the stages shown in Figure a and of causal links between them (ECJ, 2009).
For OSPAR’s Intermediate Assessment 2017, five harmonised criteria have been assessed at a regional scale: nutrient inputs, nutrient concentrations and ratios, chlorophyll-a concentrations, concentrations of the nuisance algae Phaeocystis, and dissolved oxygen levels. These are highlighted in Figure a. The individual assessment results of any one of these five common indicators do not diagnose eutrophication by themselves. However, the assessments provide useful information about trends and are important for informing management measures.
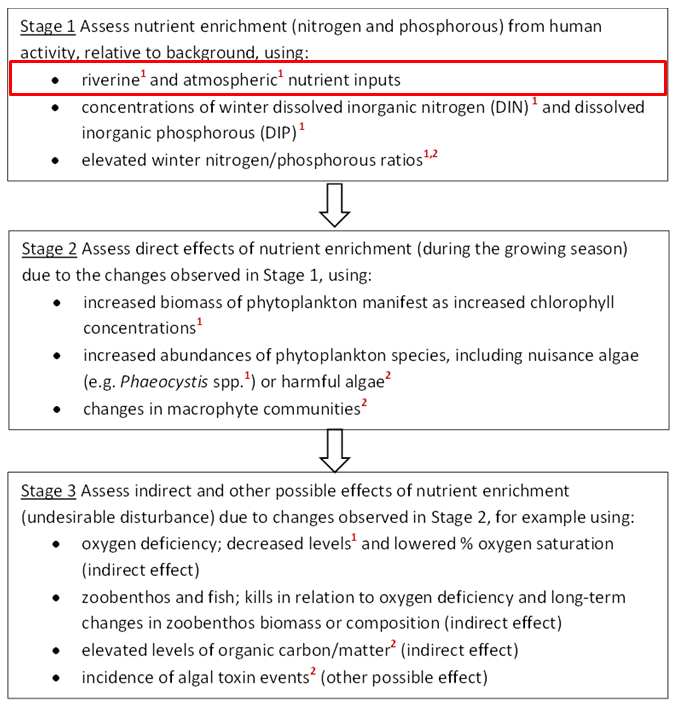
Figure a: Three stages in the identification of eutrophication. The criteria marked ¹ are common indicators for the OSPAR Intermediate Assessment 2017.
The criteria marked ² are not relevant in all countries’ waters. The common indicator assessed here (inputs of nutrients) is outlined in red
This assessment describes inputs of the nutrients nitrogen (via air and water) and phosphorus (via water) to the Greater North Sea, and to the Bay of Biscay and Iberian Coast via water only. Data on waterborne total nitrogen and total phosphorus inputs are collected by the OSPAR countries. Inputs from atmospheric nitrogen deposition are calculated from the sum of oxidised and reduced, wet and dry nitrogen deposition, which in turn comes from modelling by the European Monitoring and Evaluation Programme (EMEP) under the UNECE Convention on Long-Range Transboundary Air Pollution (CLRTAP).
Waterborne inputs enter the Greater North Sea (Figure b) and the Bay of Biscay and Iberian Coast (Figure c) from rivers, point sources (such as factories, fish farms and water-treatment plants discharging directly into estuaries or the sea), and direct deposition from the air. Data on inputs via rivers are from monitoring sites, or are estimated or modelled for unmonitored catchments.
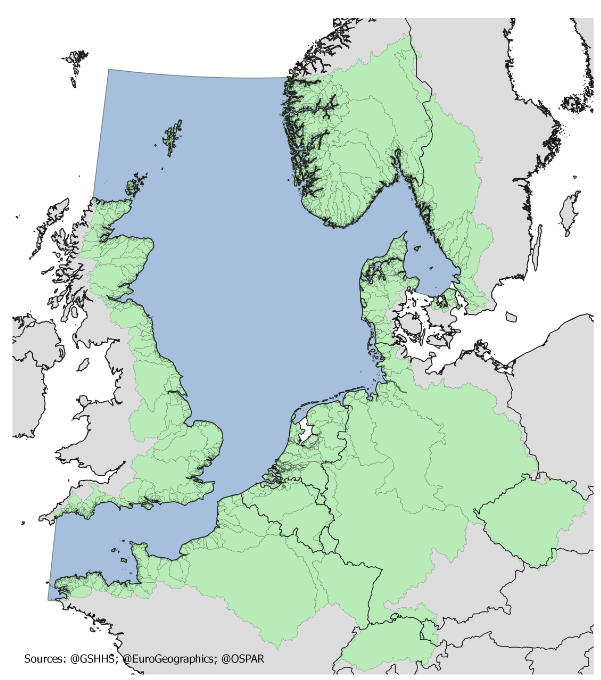
Figure b: Riverine catchment areas supplying nutrients to the Greater North Sea
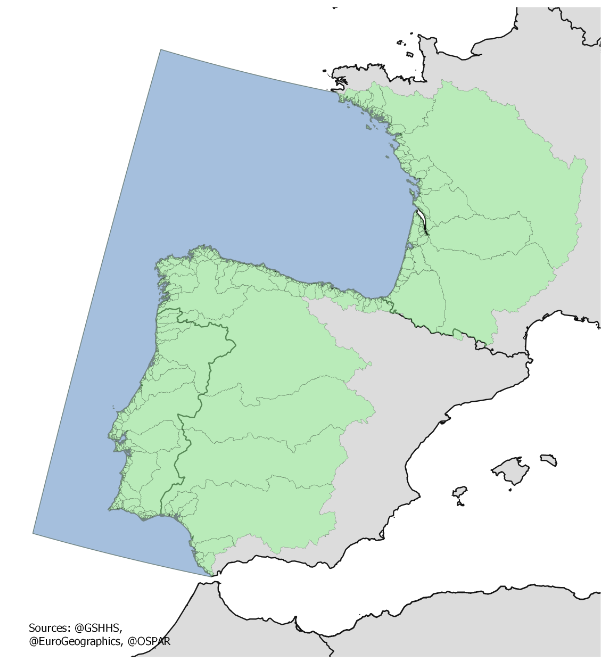
Figure c: Riverine catchment areas supplying nutrients to the Bay of Biscay and Iberian Coast
The aim of the assessment is to show changes in nutrient input from 1990 (1997 in the Bay of Biscay and Iberian Coast) to the present, using the most accurate available data.
The Greater North Sea, and the Bay of Biscay and Iberian Coast are the OSPAR regions assessed as a first step. The aim is to expand the assessment to other OSPAR regions in the future.
The OSPAR Eutrophication Strategy builds on long-standing commitments from countries to reduce inputs of nutrients to eutrophication problem areas (OSPAR, 2010). Countries that are likely to contribute nutrient inputs to eutrophication problem areas are committed to reducing inputs to those areas by 50% relative to inputs in 1985, pending new nutrient reduction targets (OSPAR, 2010).
Data sources
Data sources include riverine, atmospheric and direct inputs. Data are held in the OSPAR rogramme (OSPAR, 2014) database by the data-host (database version 20170127). Data originate from national reporting of monitoring commitments under OSPAR RID and cover riverine inputs (monitored), estimated / modelled inputs from unmonitored catchments and diffuse sources, and point source inputs (industry, sewage treatment plants, fish farming, and urban runoff). The earliest data are from 1989 and the time series extends to 2015. Reporting for some countries began after 1989 and this limits the amount of data available for analysis. Complete reporting for the Bay of Biscay and Iberian Coast did not begin until 1997.
Riverine data are supplemented by atmospheric deposition data provided by EMEP (European Monitoring and Evaluation Programme). EMEP data in this case are from numerical model analyses of nitrogen emissions, which are reported by countries to the UNECE Convention on Long-range Transboundary Air Pollution. All OSPAR countries are also members of EMEP. The EMEP numerical model uses modelled meteorological fields to estimate the spread and deposition of these substances from source to sink, including atmospheric chemical processes. This assessment uses only direct deposition to the sea surface: atmospheric deposition onto land can reach the sea, but would be picked up by the OSPAR RID monitoring programme. A detailed description of the EMEP Nitrogen and Sulphur Model, including the source code, can be found at EMEP. EMEP makes deposition data freely available for the Greater North Sea, with the exception of the Kattegat. Data are available from 1990 and then annually from 1995 using the 2013 model version. From 2000, data from the 2015 model version were used. Data from 2015 were preliminary, being based on emissions for 2014. Deposition to the Kattegat was obtained from the HELCOM Pollution Load Compilation version 5.5. In this way, a complete atmospheric deposition dataset could be obtained for the Greater North Sea. In the Celtic Seas and the Bay of Biscay and Iberian Coast, problem areas with regard to eutrophication are mainly limited to coastal areas, so atmospheric nitrogen inputs have not been assessed here because riverine inputs are the predominant source of nutrients.
Results
There has been a reduction in nitrogen inputs to the Greater North Sea since 1990, but the trend is weak. Nitrogen inputs to the Greater North Sea vary from about 1 400 to 2 000 kilotonnes per year (kt/y). Of this, approximately 500 kt/y is from atmospheric deposition (24–38% of the total). Particularly high nitrogen inputs occurred in 1994, 1995 and 2002, associated with central European flood events. Since 2003, total nitrogen inputs to the Greater North Sea have remained fairly constant at around 1 500 kt/y. Total nitrogen inputs to the Greater North Sea have decreased by about 500 kt/y over 24 years. Of this, approximately 150 kt/y is due to measures taken to reduce atmospheric nitrogen pollution.
Phosphorus inputs to the Greater North Sea have significantly decreased since 1990. Annual phosphorus inputs to this area have halved since 1990 to about 40 kt/y. Prior to 2003, phosphorus inputs varied from 70 to 90 kt/y. Highest inputs occurred in 1995 and lowest in 1996 and 2001. After 2002 phosphorus inputs of around 40 kt/y became typical. Since 2006, waterborne phosphorus inputs have decreased by about 1.5 kt/y. This compares to a rate of decrease of about 2 kt/y for the entire period 1990–2015.
Overall, waterborne nutrient inputs to the Bay of Biscay and Iberian Coast are considerably lower than those to the Greater North Sea, approximately half, and are more variable. Total nitrogen inputs are around 300 kt/y after 2000, although during 2000 they exceeded 500 kt. This is probably due to the extreme floods that occurred in autumn 2000. The minimum observed nitrogen input in 2005 (a year when Portugal did not report data) was approximately 137 kt. Nitrogen inputs are too variable to discern a temporal trend. Atmospheric nitrogen deposition to the Bay of Biscay and Iberian Coast was not assessed.
Phosphorus inputs to the Bay of Biscay and Iberian Coast have declined over the period since 1997. Highest phosphorus inputs occurred, as for total nitrogen, in 2000, and reached nearly 30 kt/y. Since 2004, inputs have been around 10 kt/y, although in the years when Portuguese data are available, this increases to about 12 kt.
Data reporting in the Bay of Biscay and Iberian Coast has been intermittent. The extreme variability in nutrient inputs in this OSPAR region makes a complete dataset important if trends and the impacts of measures are to be determined.
There is moderate confidence in the data used and moderate confidence in the methodology.
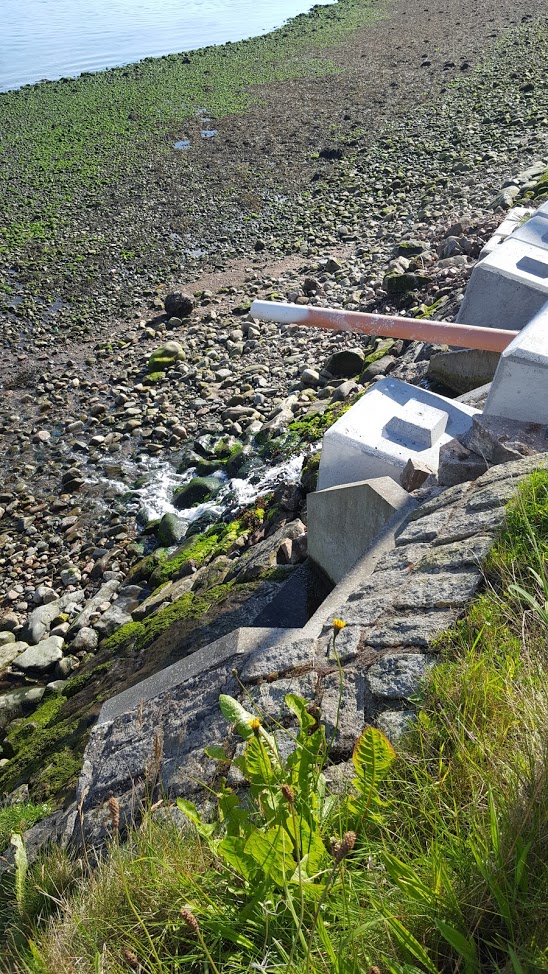
Nutrients, such as nitrogen and phosphorous, enter the marine environment from the atmosphere, rivers, land runoff, or by direct discharges into the sea © Lucy Ritchie
In the Greater North Sea, the proportionally greater reduction in phosphorus input compared to nitrogen input (Figures d and e) leads to an overall change in the molar nitrogen to phosphorus ratio in the inflowing freshwater from about 45 in 1990 to about 80 in 2015. Changes in the molar ratio can have ecosystem effects such as altering the phytoplankton community composition. Aggregated across the entire region, the molar ratio of nitrogen to phosphorus in inflowing water has also changed in the Bay of Biscay and Iberian Coast, from around 40 (1997) to about 80 (2014).
The area-specific inputs of waterborne nitrogen and phosphorus to the Greater North Sea are just under twice the inputs to the Bay of Biscay and Iberian Coast (Table a, Figures f and g). This probably reflects the different climates across the two regions, but may also reflect differences in agriculture and other nutrient management measures.
Data reporting in the Bay of Biscay and Iberian Coast has been intermittent. Spanish data are unavailable prior to 1997 while data reporting from Portugal has been intermittent in recent years. The extreme variability of nutrient inputs in this region shows the importance of having a complete dataset if trends, flow-normalisation and the impacts of measures are to be determined.
Particularly high nitrogen inputs occurred in 1994, 1995 and 2002, associated with central European flood events (Engel, 1997; Förster, 2008).
| Area (thousand km2) | Annual mean area-specific inputs (tonnes/km2) | ||
|---|---|---|---|
| Nitrogen | Phosphorus | ||
| Greater North Sea (1990-2015) | 975 | 1.03 | 0.04 |
| Bay of Biscay and Iberian Coast (1997-2014) | 658 | 0.68 | 0.02 |
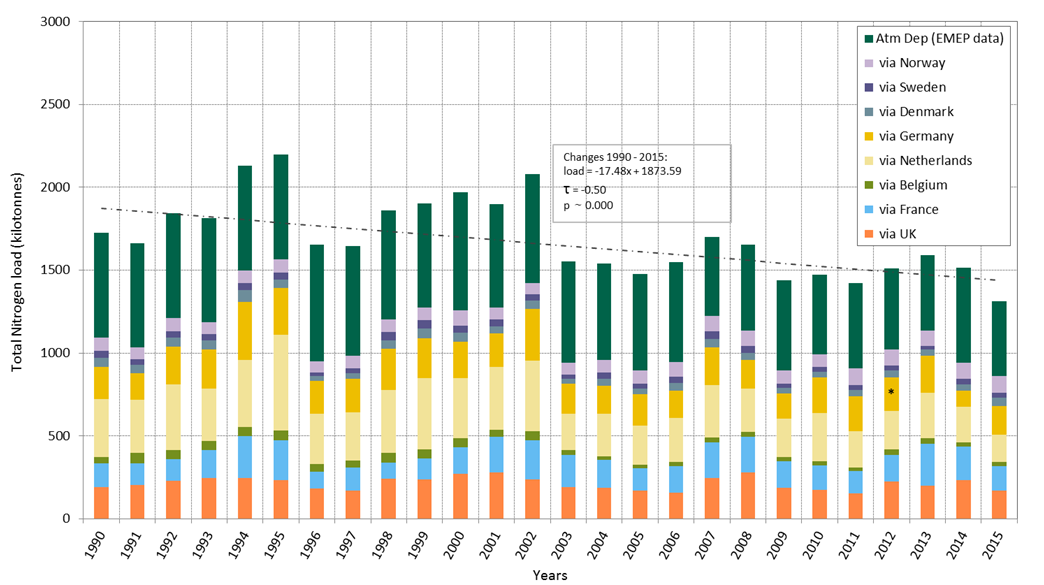
Figure d: Combined airborne (‘Atmos Dep’) and waterborne (by country) nitrogen inputs to the Greater North Sea showing countries of origin
*, missing data. Missing data are replaced by a mean value based on data reported from that country for the period 1990–2014. The dashed line indicates a statistically significant trend (p<0.05; calculated with Scipy.Stats.Kendalltau). (Data for 2015 have yet to be fully quality-controlled)
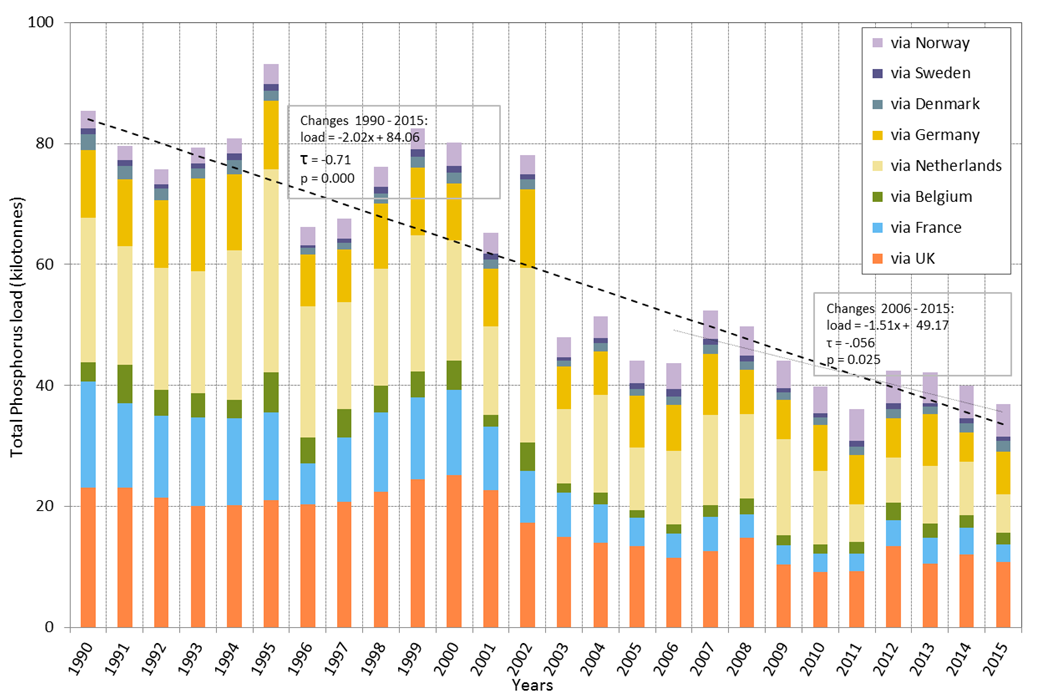
Figure e: Waterborne phosphorus inputs to the Greater North Sea showing countries of origin
*, missing data. Missing data are replaced by a mean value based on data reported from that country for the period 1990–2014. The dashed lines indicate statistically significant trends (p<0.05; calculated with Scipy.Stats.Kendalltau). (Data for 2015 have yet to be fully quality-controlled)
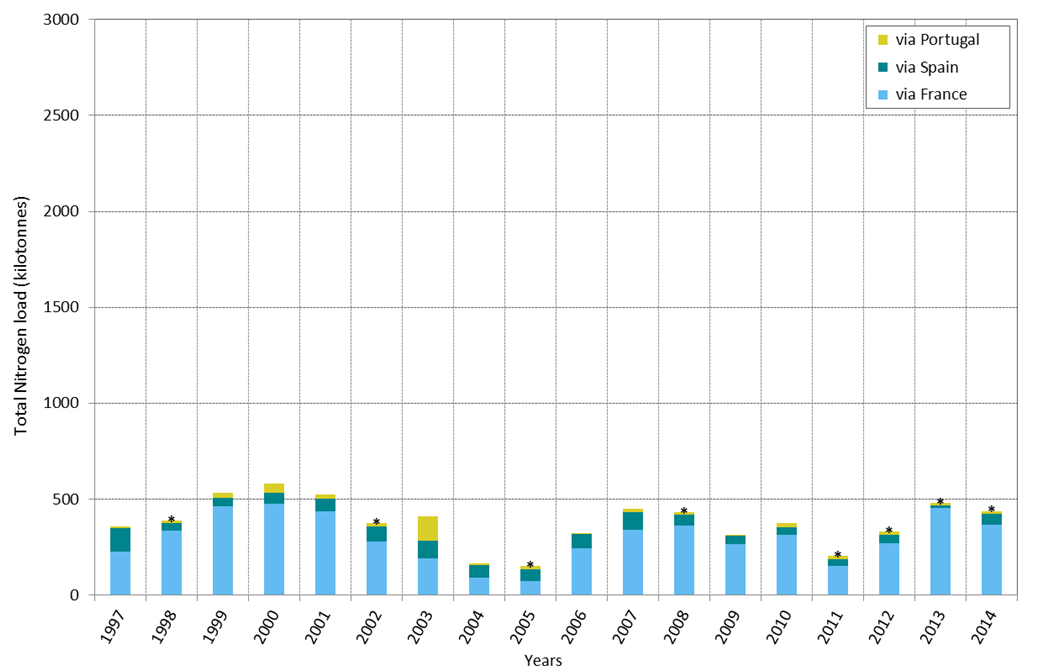
Figure f: Waterborne nitrogen inputs to the Bay of Biscay and the Iberian Coast showing countries of origin
*, missing data. Missing data are replaced by a mean value based on data reported from that country for the period 1997–2014. No statistically significant trend detected. (Data for 2015 not available)
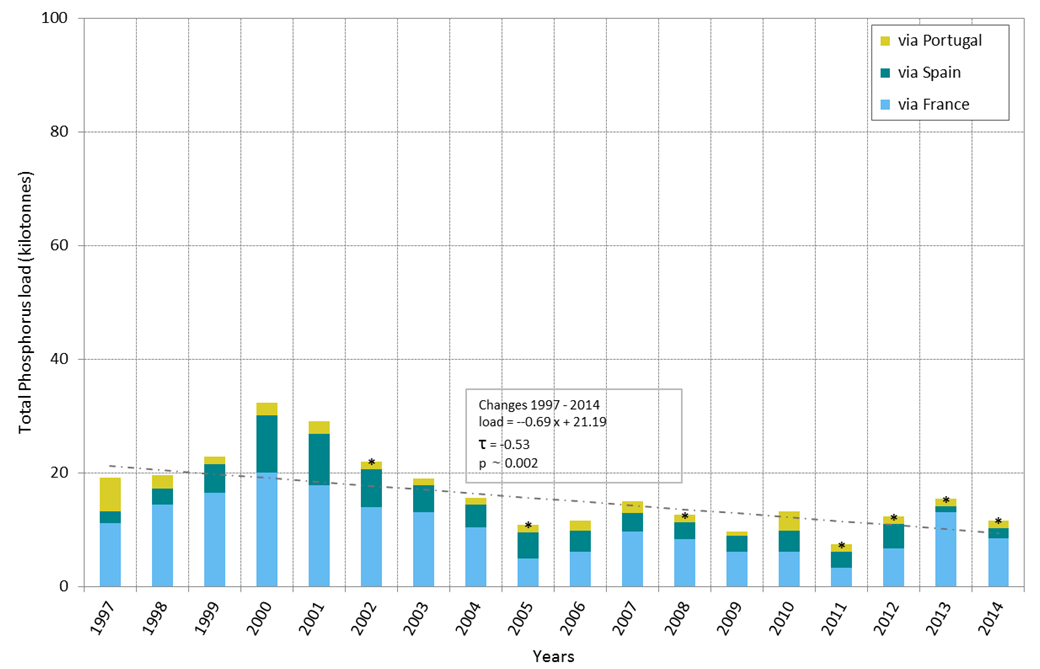
Figure g: Waterborne phosphorus inputs to the Bay of Biscay and the Iberian Coast showing countries of origin
*, missing data. Missing data are replaced by a mean value based on data reported from that country for the period 1997–2014. The dashed line indicates a statistically significant trend (p<0.05; calculated with Scipy.Stats.Kendalltau). (Data for 2015 not available)
Conclusion
Nutrient inputs to the Greater North Sea have decreased significantly since 1990. Total nitrogen inputs to the area are variable, but have decreased significantly. Reduced emissions of nitrogen to air have led to a reduction of about 150 kt/y in atmospheric nitrogen inputs. Changes in the proportion of nitrogen to phosphorus entering the Greater North Sea may affect algal community diversity.
Phosphorus inputs to the Greater North Sea are less variable than nitrogen and the significant reduction in input is particularly obvious. Since 2000, phosphorus inputs have roughly halved to about 40 kt/y. The greatest changes occurred between about 2000 and 2005, although further significant input reductions have occurred since 2006.
Riverine inputs to the Bay of Biscay and Iberian Coast are strongly affected by regional flood events. Furthermore, the time series of available data is shorter than for the Greater North Sea and recent reporting is less complete, making it difficult to draw conclusions on trends. However, phosphorus inputs between 1997 and 1999 were typically about 20 kt/y, while phosphorous inputs of about 13 kt/y are now found. Analyses show a statistically significant downward trend in phosphorus inputs to the Bay of Biscay and Iberian Coast, but not for nitrogen.
OSPAR countries have agreed three Recommendations to reduce nutrient inputs to the OSPAR Maritime Area. PARCOM (1988) was an Agreement of the coastal states around the Greater North Sea to reduce nutrient inputs by 50% relative to the 1985 levels. PARCOM Recommendations 89/2 (PARCOM, 1989) and 92/7 (PARCOM, 1992) identified measures necessary to reduce inputs, which have since been incorporated and in several cases augmented by European Union Directives covering for example wastewater treatment, nitrates in agriculture, industrial emissions and water and marine management. Furthermore, atmospheric emissions are regulated through the United Nations Economic Commission for Europe (UNECE) Convention on Long-range Transboundary Air Pollution.
The result of these measures is a clear reduction in nutrient inputs to the Greater North Sea, and a reduction in phosphorus inputs to the Bay of Biscay and Iberian Coast.
Knowledge Gaps
Nutrient input assessment is based on a combination of observations, statistical analyses and dynamic numerical models. Observations of river flow and chemical concentration could be improved by increasing measurement frequency, particularly under high flow conditions. Assessing nutrient inputs from unmonitored areas is dependent on high quality reporting from industry and agriculture and modelling tools adapted to local conditions. Atmospheric input estimates and pathways are sensitive to model resolution and could be improved, for example by data assimilation and more detailed emissions data. Atmospheric phosphorus deposition is effectively unknown, with no observations over the sea, few observations over land and no operational modelling.
Under the OSPAR Programme countries aim to measure 90% of riverine inputs from their territories. This is achieved through gauging stations to measure discharge with frequent water sampling throughout the year, ideally focussed on periods of high flow. The remaining 10% of inputs originate from ‘unmonitored’ areas downstream of and in between these gauging stations. Estimates of this 10% come from modelling. Discharges from point sources (such as industry and water treatment works) are then added through national and European reporting pathways.
Monitoring and modelling guidelines are well established within OSPAR and consistent monitoring data exists for most countries since 1989. However, identifying periods of high flow and then monitoring before they decline is not always possible and this can result in the estimates from individual rivers being less accurate than desired. This is particularly relevant because extreme weather events with periods of high flow could become more frequent in the future under continued warming.
Atmospheric data rely on emissions data reported under the UNECE Convention on Long-range Transboundary Air Pollution and the European Union Industrial Emissions Directive. While the European Monitoring and Evaluation Programme (EMEP) model is validated against observed deposition, accurate reporting of emissions from all sectors is necessary. Analysing atmospheric nitrogen deposition per country could help identify where to target nitrogen reduction measures.
Engel H. 1997. Destructive Water: Water-Caused Natural Disasters, their Abatement and Control (ed. A J Askew, G H Leavesley, H F Lins, F Nobilis, R S Parker, V R Schneider & F M van de Ven, Proceedings of the Conference held at Anaheim, California, June 1996). IAHS Publ. no. 239. Available from http://hydrologie.org/redbooks/a239/iahs_239_0021.pdf;
ECJ 2009. European Court of Justice Judgment of the Court (Third Chamber) of 10 December 2009. European Commission v United Kingdom of Great Britain and Northern Ireland. Failure of a Member State to fulfil obligations – Environment – Directive 91/271/EEC – Urban waste water treatment - Article 3(1) and (2), Article 5(1) to (3) and (5) and Annexes I and II – Initial failure to identify sensitive areas – Concept of ‘eutrophication’ – Criteria – Burden of proof – Relevant date when considering the evidence – Implementation of collection obligations – Implementation of more stringent treatment of discharges into sensitive areas. Case C-390/07 European Court Reports 2009 I-00214;
Förster S. 2008. An analysis of hydraulic, environmental and economic impacts of flood polder management at the Elbe River. Universität Potsdam Doctoral Thesis. Available from https://publishup.uni-potsdam.de/opus4-ubp/frontdoor/index/index/docId/2539;
OSPAR Agreement 2010-03 The North-East Atlantic Environment Strategy. Strategy of the OSPAR Commission for the Protection of the Marine Environment of the North-East Atlantic 2010–2020;
OSPAR Agreement 2013-08 Common Procedure for the Identification of the Eutrophication Status of the OSPAR Maritime Area;
OSPAR Agreement 2014-04 Riverine Inputs and Direct Discharges Monitoring Programme (RID) applicable from 1 January 2015;
OSPAR Agreement 2016-01 OSPAR Coordinated Environmental Monitoring Programme (CEMP). Revised in 2017;
PARCOM Recommendation 1988/2 on the Reduction in Inputs of Nutrients to the Paris Convention Area;
PARCOM Recommendation 1992/7 on the reduction of nutrient inputs from agriculture into areas where these inputs are likely, directly or indirectly, to cause pollution;
PARCOM Recommendation 1989/4 on a Coordinated Programme for the Reduction of Nutrients
| Sheet reference | HASEC17/D504 |
|---|---|
| Assessment type | Intermediate Assessment |
| Context (1) | Eutrophication |
| Context (2) | OSPAR Agreement 2010-03 The North-East Atlantic Environment Strategy. Strategy of the OSPAR Commission for the Protection of the Marine Environment of the North-East Atlantic 2010–2020 |
| Context (3) | D5 - Eutrophication |
| Context (4) | D5.1 - Nutrients levels |
| Point of contact | Philip Axe, Swedish Agency for Marine and Water Management |
secretariat@ospar.org | |
| Metadata date | 2017-09-15 |
| Title | Nutrient Inputs to the Greater North Sea and the Bay of Biscay and Iberian Coast |
| Resource abstract | Common indicator nutrient Inputs to the Greater North Sea and the Bay of Biscay and Iberian Coast |
| Linkage | https://www.ospar.org/convention/agreements?q=Agreement+2010-03&t=&a=&s= |
| Topic category | Environment |
| Indirect spatial reference | L1.2;L1.4 |
| N Lat | 62.0000000002998 |
| E Lon | 13.0665752428532 |
| S Lat | 36.0000000001 |
| W Lon | -11.0000000084935 |
| Countries | BE, DE, DK, FR, NL, NO, SE, UK |
| Start date | 1990-01-01 |
| End date | 2015-12-31 |
| Date of publication | 2017-06-30 |
| Conditions applying to access and use | https://www.ospar.org/site/assets/files/1215/ospar_data_conditions_of_use.pdf |
| Data Snapshot | https://odims.ospar.org/documents/312/download |
| Data Results | https://odims.ospar.org/documents/288/download |
| Data source | www.ospar.org/data |