

Apports de nutriments dans la mer du Nord au sens large et le golfe de Gascogne et la côte ibérique
D5 - Eutrophisation
D5.1 – Niveaux des nutriments
Message clé:
Les apports aquatiques et atmosphériques d’azote dans la mer du Nord au sens large révèlent une tendance à la baisse faible. Les apports aquatiques de phosphore ont baissé de manière significative. La diminution a ralenti au début des années 2000 mais elle se poursuit. Les apports aquatiques de phosphore dans le golfe de Gascogne et la côte ibérique ont diminué mais pas les apports d’azote.
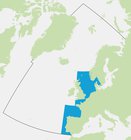
Zone Évaluée
Récapitulatif Imprimable
Contexte
L'objectif stratégique d’OSPAR, en ce qui concerne l’eutrophisation, consiste à lutter contre l'eutrophisation dans la zone maritime OSPAR, dans le but ultime de parvenir à, et de maintenir, un milieu marin sain, exempt d’eutrophisation anthropique. La procédure permettant d’évaluer les progrès dans le sens de cet objectif prend en compte les causes et les effets directs et indirects de l’eutrophisation. Un enrichissement en nutriments de la mer peut entraîner des problèmes d’eutrophisation s’il a pour résultat des perturbations indésirables telles qu’une croissance excessive de phytoplancton (algues) causant un appauvrissement en oxygène dans les eaux de fond et conduisant à des changements de comportement ou la mort du poisson ou d’autres espèces. Des teneurs élevées en nutriments sont donc un indicateur important de l’endroit ou une eutrophisation risque de se produire.
Les nutriments, tels que l’azote et le phosphore, pénètrent le milieu marin par l’intermédiaire de l’atmosphère, des fleuves, des eaux de ruissellement ou de rejets directs dans la mer. Les activités humaines peuvent être responsables de l’apport de grandes quantités de nutriments dans la mer (Figures 1 et 2). Les données de la surveillance à long terme permettent aux scientifiques de quantifier les effets des activités humaines et d’évaluer le succès des mesures prises afin de réduire les apports en nutriments. La Stratégie eutrophisation d’OSPAR insiste en particulier sur une coopération permettant de déterminer des cibles de réduction des nutriments appropriées pour les zones à problème d’eutrophisation.
Les émissions de nutriments sont règlementées par des Recommandations OSPAR et plusieurs Directives de l’UE. Les émissions atmosphériques sont également règlementées par la Convention sur la pollution atmosphérique transfrontière à longue distance de la CEE-ONU.
Cette évaluation décrit les apports en nutriments d’azote et de phosphore dans la mer du Nord au sens large (aquatiques et atmosphériques) et le golfe de Gascogne et la côte ibérique (aquatiques).
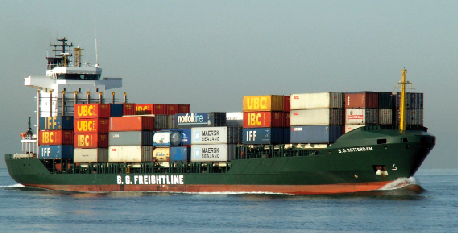
Figure 1: Les émissions d’échappement, notamment de la navigation, sont une source importante de retombées atmosphériques d’azote en mer. ©Alfvan Beem
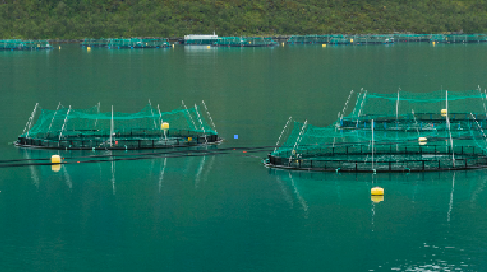
Figure 2: Pisciculture à Torskefjorden, Norvège. Les fermes piscicoles à cages ouvertes sont une source de nutriments pour les eaux avoisinantes. ©Ximonic/Simo Räsänen
Eutrophication is the result of excessive enrichment of water with nutrients. This may cause accelerated growth of algae and / or higher forms of plant life (Council Directive 91/676/EEC). This may result in an undesirable disturbance to the balance of organisms present and thus to the overall water quality. Undesirable disturbances can include shifts in the composition and extent of flora and fauna and the depletion of oxygen due to decomposition of accumulated biomass. Such disturbances then have other effects, such as changes in habitats and biodiversity, blooms of nuisance algae or macroalgae, decrease in water clarity and behavioural changes or even death of fish and other species. Identifying causal links between these disturbances and nutrient enrichment can be complicated by other pressures. Cumulative effects, including climate change, may have similar effects on biological communities and dissolved oxygen, further complicating efforts to demonstrate causal links.
The OSPAR Commission’s strategic objective, with regard to eutrophication, is to combat eutrophication in the OSPAR Maritime Area, with the ultimate aim that by 2020 the OSPAR Maritime Area is a healthy marine environment where anthropogenic eutrophication does not occur (OSPAR, 2010). The OSPAR Eutrophication Strategy requires assessment of eutrophication to be based on the ecological consequences of nutrient enrichment and not just on nutrient enrichment alone, i.e. finding reliable evidence for accelerated growth of algae and / or macrophytes caused by anthropogenic nutrient enrichment, leading to undesirable disturbance. Eutrophication is diagnosed using OSPAR’s harmonised criteria of nutrient inputs, concentrations and ratios, chlorophyll-a concentrations, phytoplankton indicator species, macrophytes, dissolved oxygen levels, incidence of fish kills and changes in zoobenthos (OSPAR, 2010). As there is no single indicator of disturbance caused by marine eutrophication, OSPAR applies a multi-step method using the harmonised criteria OSPAR, 2013). Eutrophication is considered to have occurred if there is evidence for all of the stages shown in Figure a and of causal links between them (ECJ, 2009).
For OSPAR’s Intermediate Assessment 2017, five harmonised criteria have been assessed at a regional scale: nutrient inputs, nutrient concentrations and ratios, chlorophyll-a concentrations, concentrations of the nuisance algae Phaeocystis, and dissolved oxygen levels. These are highlighted in Figure a. The individual assessment results of any one of these five common indicators do not diagnose eutrophication by themselves. However, the assessments provide useful information about trends and are important for informing management measures.
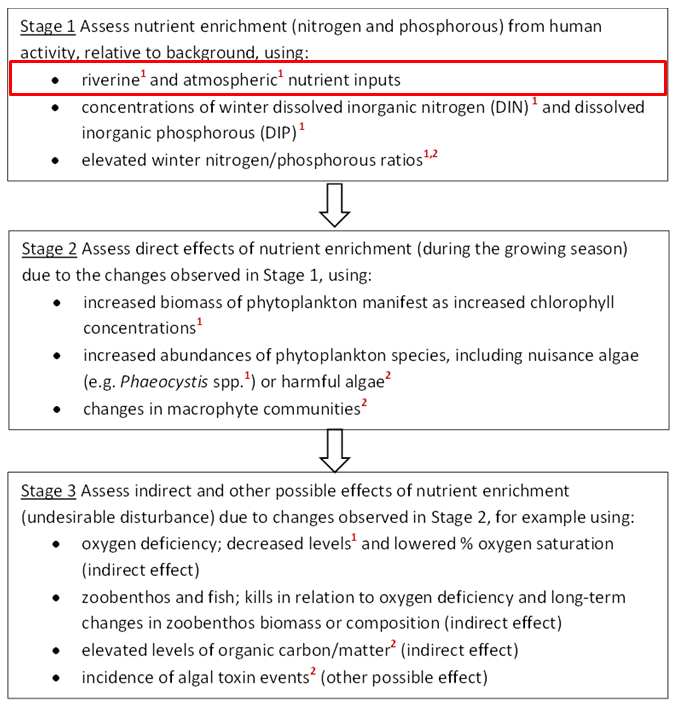
Figure a: Three stages in the identification of eutrophication. The criteria marked ¹ are common indicators for the OSPAR Intermediate Assessment 2017.
The criteria marked ² are not relevant in all countries’ waters. The common indicator assessed here (inputs of nutrients) is outlined in red
This assessment describes inputs of the nutrients nitrogen (via air and water) and phosphorus (via water) to the Greater North Sea, and to the Bay of Biscay and Iberian Coast via water only. Data on waterborne total nitrogen and total phosphorus inputs are collected by the OSPAR countries. Inputs from atmospheric nitrogen deposition are calculated from the sum of oxidised and reduced, wet and dry nitrogen deposition, which in turn comes from modelling by the European Monitoring and Evaluation Programme (EMEP) under the UNECE Convention on Long-Range Transboundary Air Pollution (CLRTAP).
Waterborne inputs enter the Greater North Sea (Figure b) and the Bay of Biscay and Iberian Coast (Figure c) from rivers, point sources (such as factories, fish farms and water-treatment plants discharging directly into estuaries or the sea), and direct deposition from the air. Data on inputs via rivers are from monitoring sites, or are estimated or modelled for unmonitored catchments.
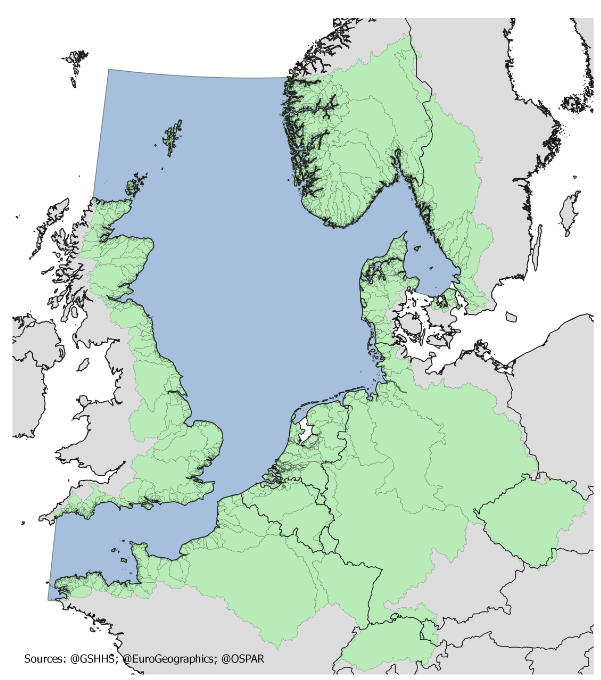
Figure b: Riverine catchment areas supplying nutrients to the Greater North Sea
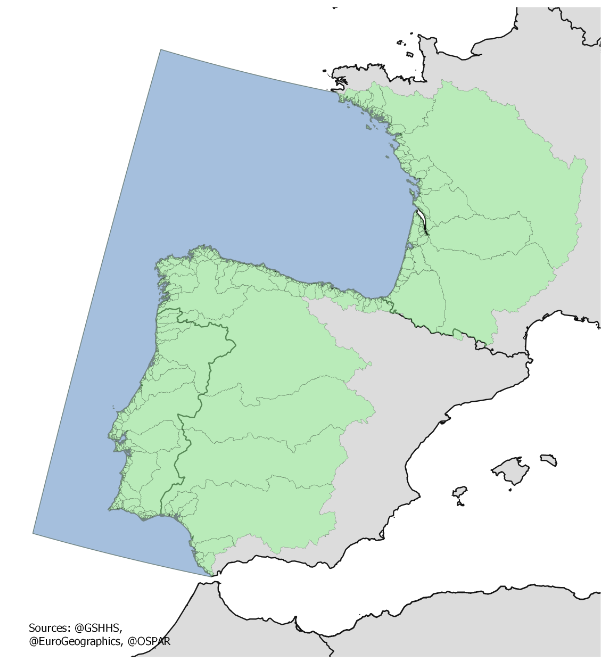
Figure c: Riverine catchment areas supplying nutrients to the Bay of Biscay and Iberian Coast
The aim of the assessment is to show changes in nutrient input from 1990 (1997 in the Bay of Biscay and Iberian Coast) to the present, using the most accurate available data.
The Greater North Sea, and the Bay of Biscay and Iberian Coast are the OSPAR regions assessed as a first step. The aim is to expand the assessment to other OSPAR regions in the future.
The OSPAR Eutrophication Strategy builds on long-standing commitments from countries to reduce inputs of nutrients to eutrophication problem areas (OSPAR, 2010). Countries that are likely to contribute nutrient inputs to eutrophication problem areas are committed to reducing inputs to those areas by 50% relative to inputs in 1985, pending new nutrient reduction targets (OSPAR, 2010).
Data sources
Data sources include riverine, atmospheric and direct inputs. Data are held in the OSPAR rogramme (OSPAR, 2014) database by the data-host (database version 20170127). Data originate from national reporting of monitoring commitments under OSPAR RID and cover riverine inputs (monitored), estimated / modelled inputs from unmonitored catchments and diffuse sources, and point source inputs (industry, sewage treatment plants, fish farming, and urban runoff). The earliest data are from 1989 and the time series extends to 2015. Reporting for some countries began after 1989 and this limits the amount of data available for analysis. Complete reporting for the Bay of Biscay and Iberian Coast did not begin until 1997.
Riverine data are supplemented by atmospheric deposition data provided by EMEP (European Monitoring and Evaluation Programme). EMEP data in this case are from numerical model analyses of nitrogen emissions, which are reported by countries to the UNECE Convention on Long-range Transboundary Air Pollution. All OSPAR countries are also members of EMEP. The EMEP numerical model uses modelled meteorological fields to estimate the spread and deposition of these substances from source to sink, including atmospheric chemical processes. This assessment uses only direct deposition to the sea surface: atmospheric deposition onto land can reach the sea, but would be picked up by the OSPAR RID monitoring programme. A detailed description of the EMEP Nitrogen and Sulphur Model, including the source code, can be found at EMEP. EMEP makes deposition data freely available for the Greater North Sea, with the exception of the Kattegat. Data are available from 1990 and then annually from 1995 using the 2013 model version. From 2000, data from the 2015 model version were used. Data from 2015 were preliminary, being based on emissions for 2014. Deposition to the Kattegat was obtained from the HELCOM Pollution Load Compilation version 5.5. In this way, a complete atmospheric deposition dataset could be obtained for the Greater North Sea. In the Celtic Seas and the Bay of Biscay and Iberian Coast, problem areas with regard to eutrophication are mainly limited to coastal areas, so atmospheric nitrogen inputs have not been assessed here because riverine inputs are the predominant source of nutrients.
Résultats
Les apports d’azote dans la mer du Nord au sens large ont diminué depuis 1990 mais la tendance est faible. Ils varient, allant d’environ 1.400 à 2.000 kilotonnes par an (kt/an) dont environ 500 kt/an proviennent de retombées atmosphériques (24–38% du total). Des apports d’azote particulièrement élevés se sont produits en 1994, 1995 et 2002, liés à des inondations en Europe centrale. Depuis 2003, les apports totaux d’azote dans la mer du Nord au sens large ont été assez constants à environ 1.500 kt/an. Les apports totaux d’azote dans la mer du Nord au sens large ont diminué d’environ 500 kt/an sur 24 ans, dont environ 150 kt/an sont dus aux mesures de réduction de la pollution atmosphérique par l’azote.
Les apports de phosphore dans la mer du Nord au sens large ont diminué de manière significative depuis 1990. Les apports annuels de phosphore dans cette zone ont diminué de moitié depuis 1990 et correspondent maintenant à environ 40 kt/an. Avant 2003, les apports de phosphore variaient entre 70 et 90 kt/an. Les apports les plus élevés se sont produits en 1995 et les plus faibles en 1996 et 2001. Après 2002 des apports de phosphore d’environ 40 kt/an sont devenus typiques. Depuis 2006, les apports aquatiques de phosphore ont diminué d’environ 1,5 kt/an, le taux de réduction étant d’environ 2 kt/an durant l’ensemble de la période de 1990 à 2015.
Dans l’ensemble, les apports aquatiques en nutriments dans le golfe de Gascogne et la côte ibérique sont considérablement inférieurs à ceux dans la mer du Nord au sens large, représentant environ la moitié, et sont plus variables. Les apports totaux d’azote sont d’environ 300 kt/an après 2000, bien qu’en 2000 ils aient dépassé 500 kt. Ceci est probablement dû à des inondations graves qui se sont produites durant l’automne 2000. Les apports d’azote les plus faibles relevés en 2005 (année pour laquelle le Portugal n’a pas notifié de données) étaient d’environ 137 kt. Les apports d’azote sont trop variables pour permettre de déceler une tendance temporelle. Les retombées atmosphériques d’azote dans le golfe de Gascogne et la côte ibérique n’ont pas été évaluées.
Les apports de phosphore dans le golfe de Gascogne et la côte ibérique ont diminué depuis 1997. Les apports de phosphore les plus élevés se sont produits, comme pour l’azote total, en 2000, et ont atteint presque 30 kt/an. Depuis 2004, les apports se sont élevés à environ 10 kt/an, bien qu’ils soient passés à environ 12 kt les années pour lesquelles des données portugaises étaient disponibles.
La notification des données pour le golfe de Gascogne et la côte ibérique a été sporadique. Une série complète de données est importante si on doit déterminer les tendances et les impacts des mesures, étant donné l’extrême variabilité des apports en nutriments dans cette région OSPAR.
Les données et la méthodologie utilisées inspirent une confiance modérée.
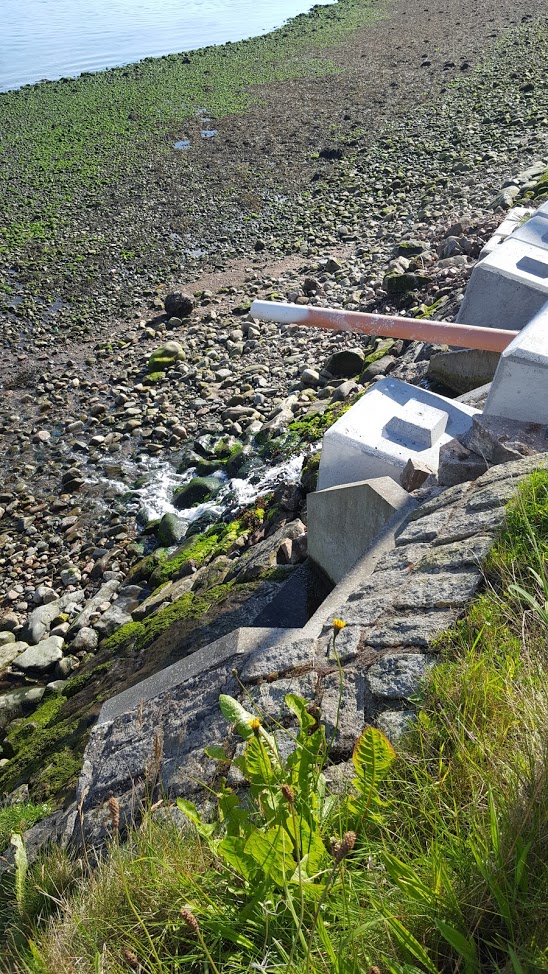
Des nutriments, tels que l’azote et le phosphore, provenant de l’atmosphère, de fleuves, d’eaux de ruissellement ou de rejets directs dans la mer pénètrent le milieu marin © Lucy Ritchie
In the Greater North Sea, the proportionally greater reduction in phosphorus input compared to nitrogen input (Figures d and e) leads to an overall change in the molar nitrogen to phosphorus ratio in the inflowing freshwater from about 45 in 1990 to about 80 in 2015. Changes in the molar ratio can have ecosystem effects such as altering the phytoplankton community composition. Aggregated across the entire region, the molar ratio of nitrogen to phosphorus in inflowing water has also changed in the Bay of Biscay and Iberian Coast, from around 40 (1997) to about 80 (2014).
The area-specific inputs of waterborne nitrogen and phosphorus to the Greater North Sea are just under twice the inputs to the Bay of Biscay and Iberian Coast (Table a, Figures f and g). This probably reflects the different climates across the two regions, but may also reflect differences in agriculture and other nutrient management measures.
Data reporting in the Bay of Biscay and Iberian Coast has been intermittent. Spanish data are unavailable prior to 1997 while data reporting from Portugal has been intermittent in recent years. The extreme variability of nutrient inputs in this region shows the importance of having a complete dataset if trends, flow-normalisation and the impacts of measures are to be determined.
Particularly high nitrogen inputs occurred in 1994, 1995 and 2002, associated with central European flood events (Engel, 1997; Förster, 2008).
| Area (thousand km2) | Annual mean area-specific inputs (tonnes/km2) | ||
|---|---|---|---|
| Nitrogen | Phosphorus | ||
| Greater North Sea (1990-2015) | 975 | 1.03 | 0.04 |
| Bay of Biscay and Iberian Coast (1997-2014) | 658 | 0.68 | 0.02 |
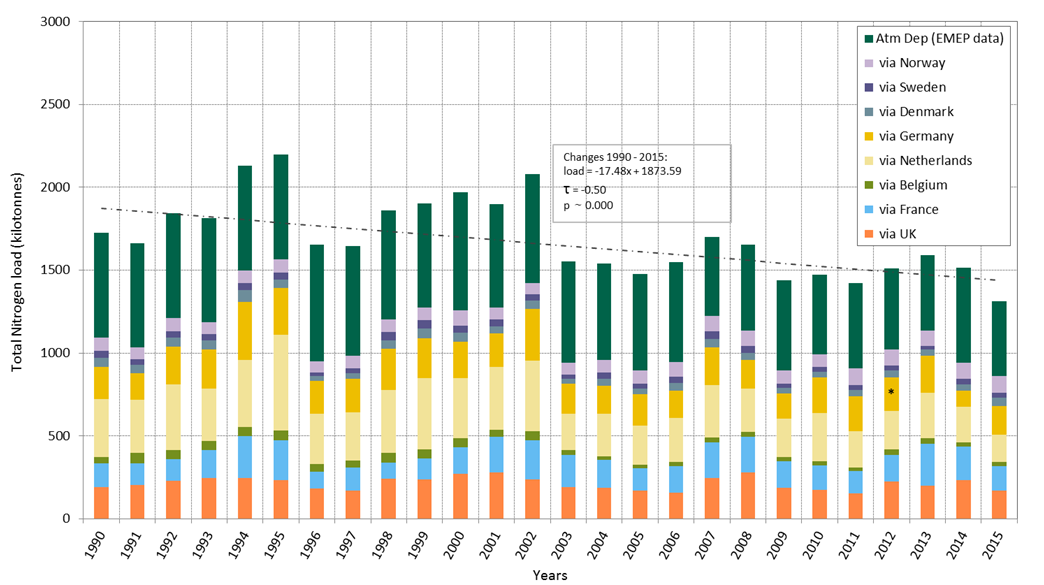
Figure d: Combined airborne (‘Atmos Dep’) and waterborne (by country) nitrogen inputs to the Greater North Sea showing countries of origin
*, missing data. Missing data are replaced by a mean value based on data reported from that country for the period 1990–2014. The dashed line indicates a statistically significant trend (p<0.05; calculated with Scipy.Stats.Kendalltau). (Data for 2015 have yet to be fully quality-controlled)
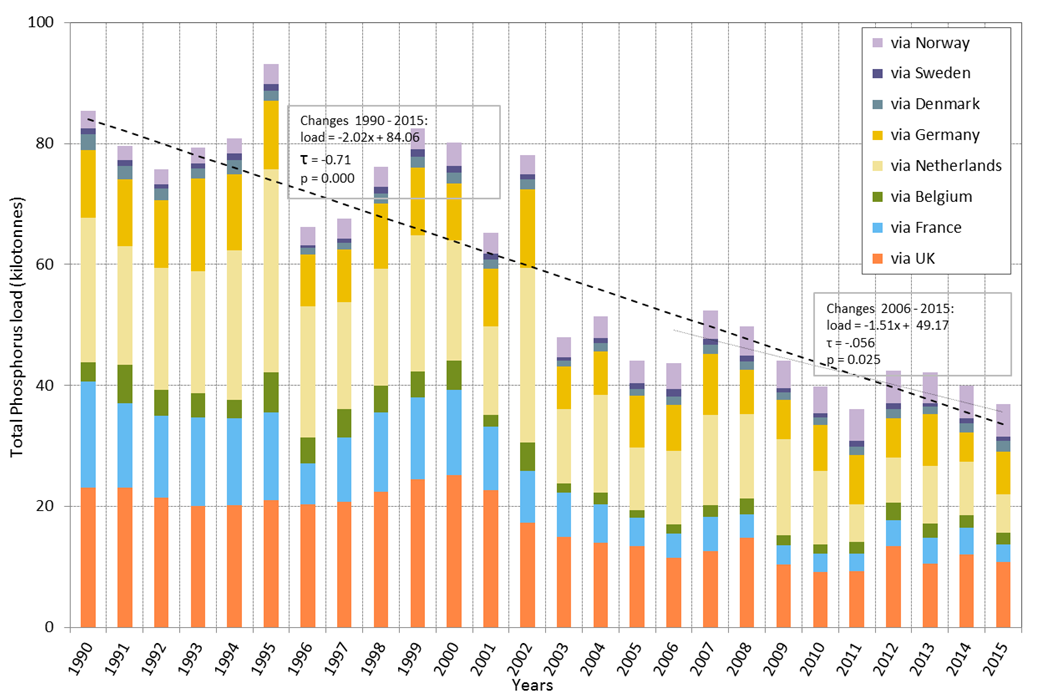
Figure e: Waterborne phosphorus inputs to the Greater North Sea showing countries of origin
*, missing data. Missing data are replaced by a mean value based on data reported from that country for the period 1990–2014. The dashed lines indicate statistically significant trends (p<0.05; calculated with Scipy.Stats.Kendalltau). (Data for 2015 have yet to be fully quality-controlled)
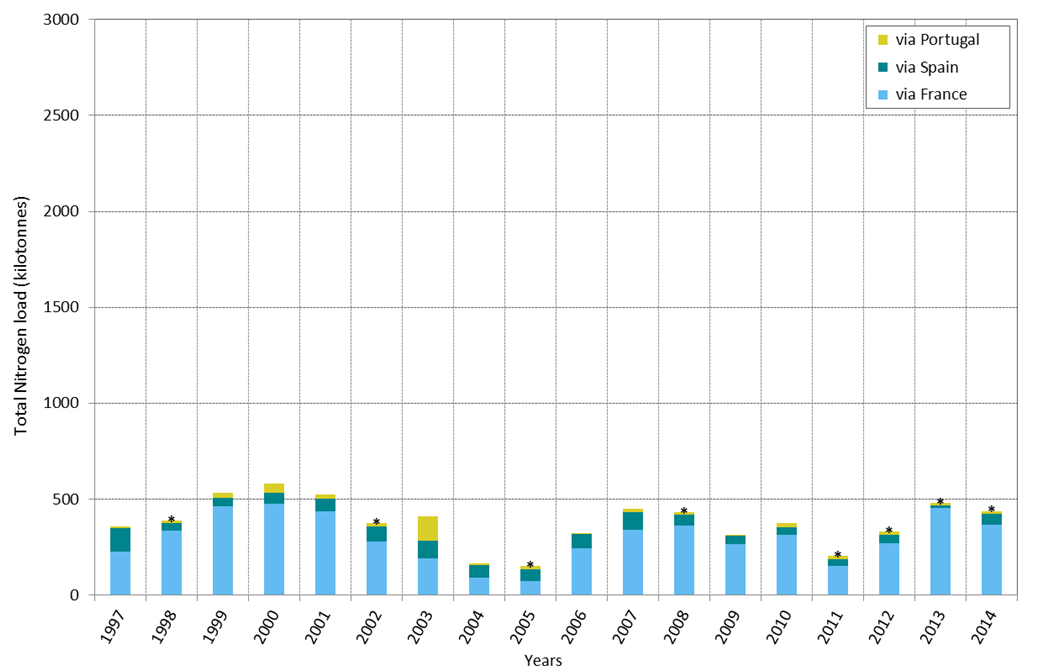
Figure f: Waterborne nitrogen inputs to the Bay of Biscay and the Iberian Coast showing countries of origin
*, missing data. Missing data are replaced by a mean value based on data reported from that country for the period 1997–2014. No statistically significant trend detected. (Data for 2015 not available)
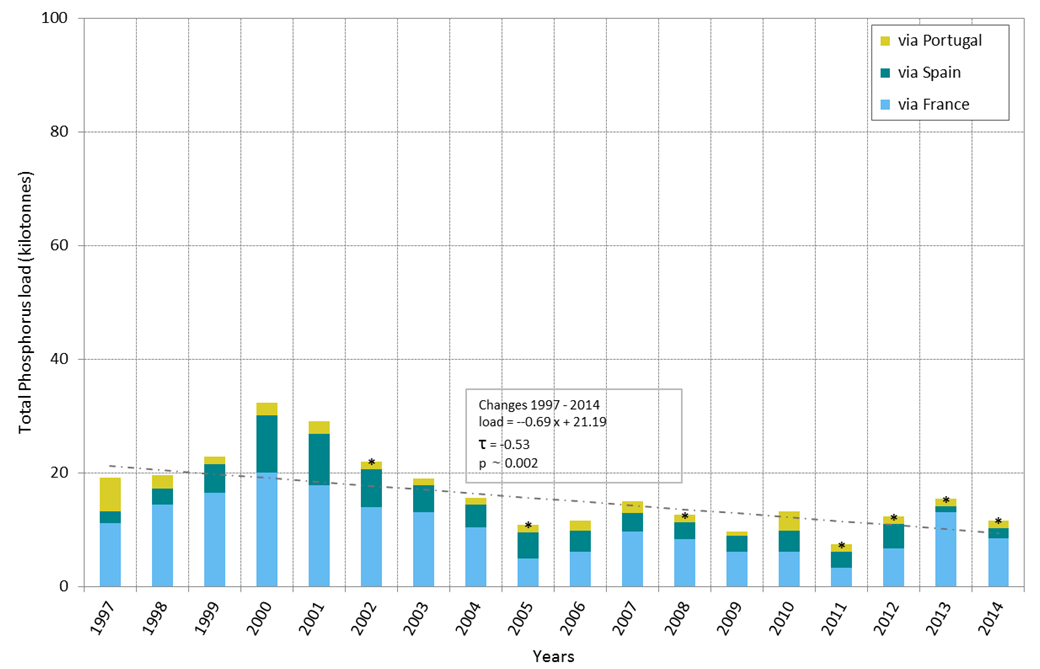
Figure g: Waterborne phosphorus inputs to the Bay of Biscay and the Iberian Coast showing countries of origin
*, missing data. Missing data are replaced by a mean value based on data reported from that country for the period 1997–2014. The dashed line indicates a statistically significant trend (p<0.05; calculated with Scipy.Stats.Kendalltau). (Data for 2015 not available)
Conclusion
Les apports en nutriments dans la mer du Nord au sens large ont diminué de manière significative depuis 1990. Les apports totaux d’azote dans la zone sont variables mais ont diminué de manière significative. La réduction des émissions atmosphériques d’azote a entraîné une réduction d’environ 150 kt/an des apports atmosphériques d’azote. Des modifications de la proportion d’azote par rapport au phosphore pénétrant la mer du Nord au sens large risquent d’affecter la diversité des communautés algales.
Les apports de phosphore dans la mer du Nord au sens large sont moins variables que ceux d’azote et la réduction significative des apports est particulièrement évidente. Depuis 2000, les apports de phosphore ont pratiquement diminué de moitié et s’élèvent actuellement à environ 40 kt/an. Les modifications les plus importantes se sont produites entre 2000 et 2005 environ, toutefois des réductions significatives supplémentaires se sont produites depuis 2006.
Les apports fluviaux dans le golfe de Gascogne et la côte ibérique sont très affectés par les inondations régionales. De plus, les séries temporelles des données disponibles sont plus courtes que pour la mer du Nord au sens large et la notification récente est moins complète, il est donc difficile de tirer des conclusions sur les tendances. Cependant, les apports typiques de phosphore entre 1997 et 1999 sont d’environ 20 kt/an tandis que des apports de phosphore d’environ 13 kt/an sont maintenant relevés. Les analyses révèlent une tendance à la baisse significative statistiquement des apports de phosphore dans le golfe de Gascogne et la côte ibérique, mais pas pour l’azote.
OSPAR countries have agreed three Recommendations to reduce nutrient inputs to the OSPAR Maritime Area. PARCOM (1988) was an Agreement of the coastal states around the Greater North Sea to reduce nutrient inputs by 50% relative to the 1985 levels. PARCOM Recommendations 89/2 (PARCOM, 1989) and 92/7 (PARCOM, 1992) identified measures necessary to reduce inputs, which have since been incorporated and in several cases augmented by European Union Directives covering for example wastewater treatment, nitrates in agriculture, industrial emissions and water and marine management. Furthermore, atmospheric emissions are regulated through the United Nations Economic Commission for Europe (UNECE) Convention on Long-range Transboundary Air Pollution.
The result of these measures is a clear reduction in nutrient inputs to the Greater North Sea, and a reduction in phosphorus inputs to the Bay of Biscay and Iberian Coast.
Lacunes des connaissances
L’évaluation des apports en nutriments se fonde sur une combinaison d’observations, d’analyses statistiques et de modèles numériques dynamiques. Il faudra améliorer les observations des débits fluviaux et des teneurs chimiques en augmentant la fréquence des mesures en particulier dans des conditions de débit élevé. L’évaluation des apports en nutriments provenant de zones non surveillées dépend de la bonne qualité de la notification par les secteurs industriels et agricoles et d’outils de modélisation adaptés aux conditions locales. Les estimations et les voies de pénétration des apports atmosphériques sont sensibles à la résolution des modèles et pourraient être améliorées, par exemple en assimilant les données et en utilisant des données plus détaillées sur les émissions. Les retombées atmosphériques de phosphore sont en fait méconnues car les observations marines sont inexistantes, les observations terrestres sont rares et il n’existe aucune modélisation opérationnelle.
Under the OSPAR Programme countries aim to measure 90% of riverine inputs from their territories. This is achieved through gauging stations to measure discharge with frequent water sampling throughout the year, ideally focussed on periods of high flow. The remaining 10% of inputs originate from ‘unmonitored’ areas downstream of and in between these gauging stations. Estimates of this 10% come from modelling. Discharges from point sources (such as industry and water treatment works) are then added through national and European reporting pathways.
Monitoring and modelling guidelines are well established within OSPAR and consistent monitoring data exists for most countries since 1989. However, identifying periods of high flow and then monitoring before they decline is not always possible and this can result in the estimates from individual rivers being less accurate than desired. This is particularly relevant because extreme weather events with periods of high flow could become more frequent in the future under continued warming.
Atmospheric data rely on emissions data reported under the UNECE Convention on Long-range Transboundary Air Pollution and the European Union Industrial Emissions Directive. While the European Monitoring and Evaluation Programme (EMEP) model is validated against observed deposition, accurate reporting of emissions from all sectors is necessary. Analysing atmospheric nitrogen deposition per country could help identify where to target nitrogen reduction measures.
Engel H. 1997. Destructive Water: Water-Caused Natural Disasters, their Abatement and Control (ed. A J Askew, G H Leavesley, H F Lins, F Nobilis, R S Parker, V R Schneider & F M van de Ven, Proceedings of the Conference held at Anaheim, California, June 1996). IAHS Publ. no. 239. Available from http://hydrologie.org/redbooks/a239/iahs_239_0021.pdf;
ECJ 2009. European Court of Justice Judgment of the Court (Third Chamber) of 10 December 2009. European Commission v United Kingdom of Great Britain and Northern Ireland. Failure of a Member State to fulfil obligations – Environment – Directive 91/271/EEC – Urban waste water treatment - Article 3(1) and (2), Article 5(1) to (3) and (5) and Annexes I and II – Initial failure to identify sensitive areas – Concept of ‘eutrophication’ – Criteria – Burden of proof – Relevant date when considering the evidence – Implementation of collection obligations – Implementation of more stringent treatment of discharges into sensitive areas. Case C-390/07 European Court Reports 2009 I-00214;
Förster S. 2008. An analysis of hydraulic, environmental and economic impacts of flood polder management at the Elbe River. Universität Potsdam Doctoral Thesis. Available from https://publishup.uni-potsdam.de/opus4-ubp/frontdoor/index/index/docId/2539;
OSPAR Agreement 2010-03 The North-East Atlantic Environment Strategy. Strategy of the OSPAR Commission for the Protection of the Marine Environment of the North-East Atlantic 2010–2020;
OSPAR Agreement 2013-08 Common Procedure for the Identification of the Eutrophication Status of the OSPAR Maritime Area;
OSPAR Agreement 2014-04 Riverine Inputs and Direct Discharges Monitoring Programme (RID) applicable from 1 January 2015;
OSPAR Agreement 2016-01 OSPAR Coordinated Environmental Monitoring Programme (CEMP). Revised in 2017;
PARCOM Recommendation 1988/2 on the Reduction in Inputs of Nutrients to the Paris Convention Area;
PARCOM Recommendation 1992/7 on the reduction of nutrient inputs from agriculture into areas where these inputs are likely, directly or indirectly, to cause pollution;
PARCOM Recommendation 1989/4 on a Coordinated Programme for the Reduction of Nutrients