

Third OSPAR Integrated Report on the Eutrophication Status of the OSPAR Maritime Area, 2006-2014
D5 - Eutrophication
D5.1 - Nutrients levels D5.2 - Direct effects of nutrient enrichment D5.3 - Indirect effects of nutrient enrichment
Eutrophication status in the OSPAR Maritime Area has improved since 1990, but eutrophication is still observed in 7% of the assessed area. The areas affected are mainly located in the south-eastern parts of the Greater North sea, and in some coastal waters of the Celtic Sea and Bay of Biscay.
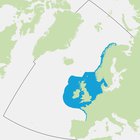
Area assessed
Printable Summary
Background
OSPAR’s strategic objective with regard to eutrophication is to combat eutrophication in the OSPAR Maritime Area, with the ultimate aim to achieve and maintain a healthy marine environment where anthropogenic eutrophication does not occur. OSPAR conducts periodic assessment of eutrophication status because excess nutrients in the marine environment can cause ecosystem problems.( Third OSPAR Integrated Report on the Eutrophication Status of the OSPAR Maritime Area ).
Eutrophication is the result of excessive enrichment of water by nutrients. Excessive enrichment of marine water with nutrients may lead to algal (phytoplankton) blooms, with the possible consequence of undesirable disturbance to the balance of organisms in the marine ecosystem and overall water quality (Figure 1).
Identifying causal links between these disturbances (such as changes in habitats and biodiversity, blooms of nuisance algae or macroalgae, a decrease in water clarity, and behavioural changes or even death of fish and other species) and nutrient enrichment can be complicated by other pressures. Cumulative effects, including climate change, may have similar effects on biological communities and dissolved oxygen, further complicating efforts to demonstrate causal links.
Eutrophication is diagnosed using OSPAR’s harmonised criteria of nutrient inputs, concentration and ratios, chlorophyll-a concentrations, phytoplankton indicator species, macrophytes, dissolved oxygen levels, incidence of fish kills and changes in zoobenthos. As there is no single indicator of disturbance caused by marine eutrophication, OSPAR applies a multi-step method using the harmonised criteria. Eutrophication is considered to have occurred if there is evidence for nutrient enrichment causing direct and indirect effects Figure 1.
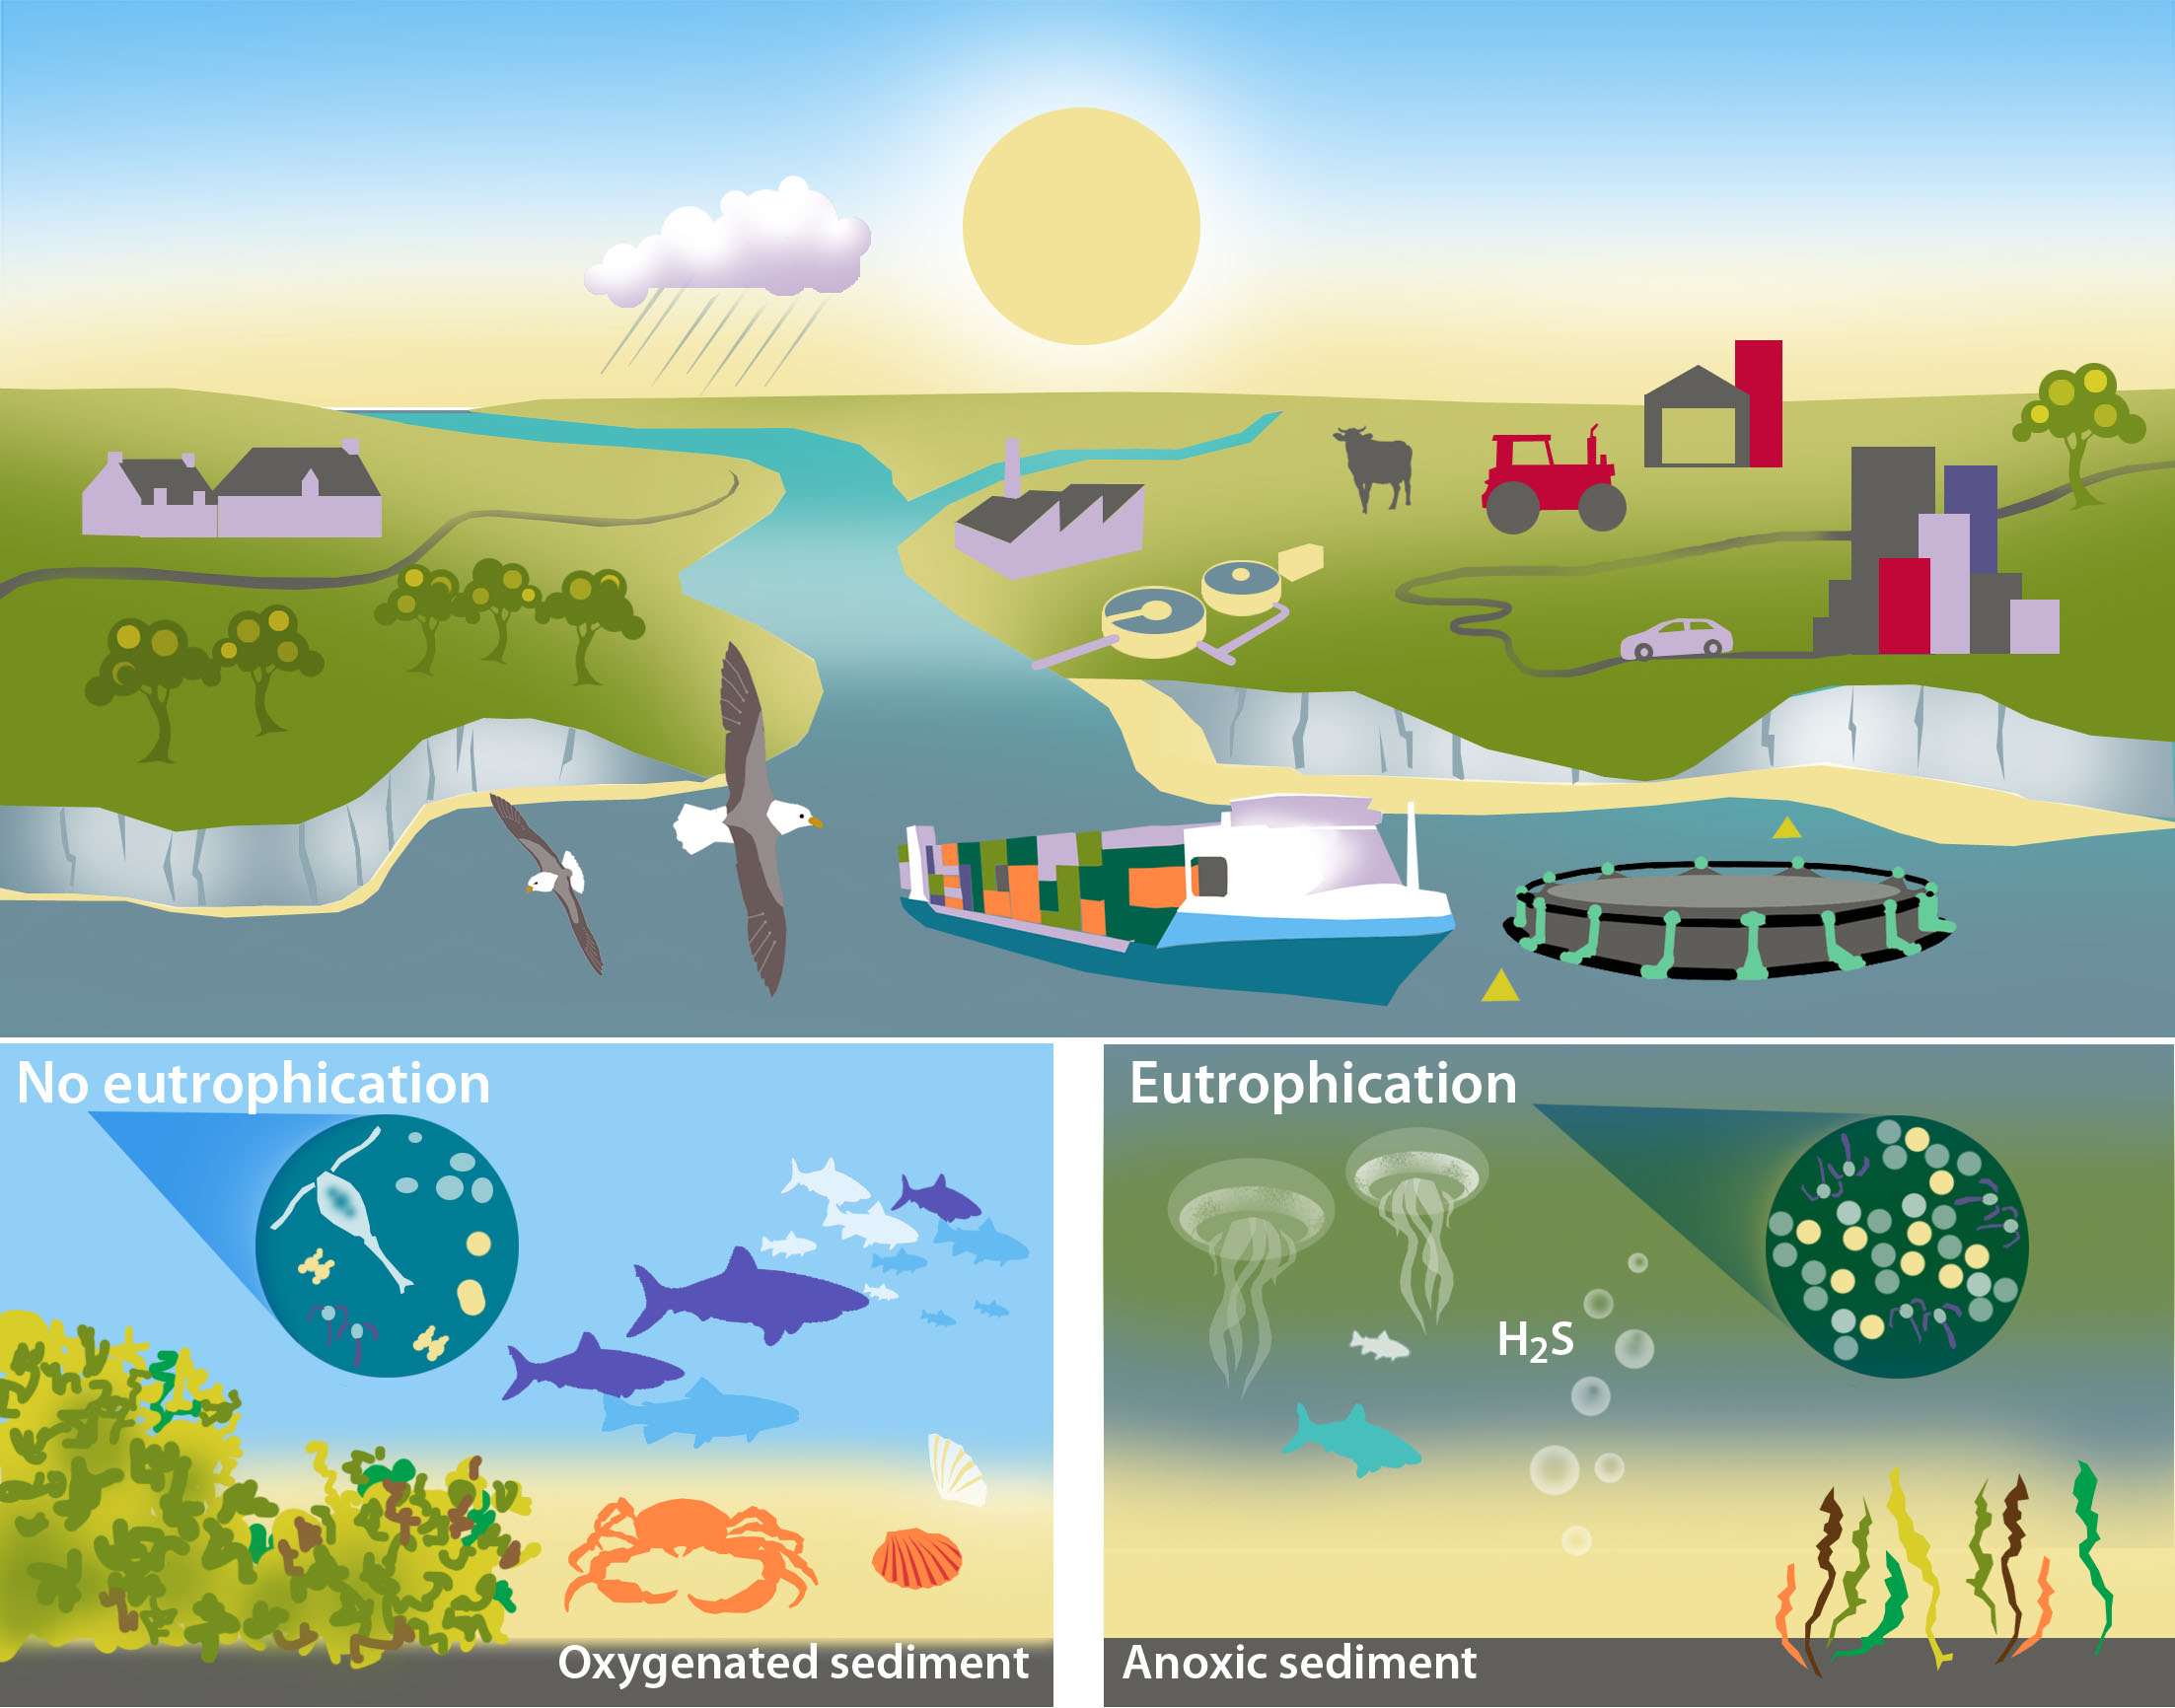
Figure 1: Simplified illustration of eutrophication
Further information can be found in Chapter 3 of the Third OSPAR Integrated Report on the Eutrophication Status of the OSPAR Maritime Area.
Further information can be found in Chapter 2 and Annex 4 of the Third OSPAR Integrated Report on the Eutrophication Status of the OSPAR Maritime Area .
Results
The identification of the eutrophication status of the OSPAR Maritime Area was based on national assessments conducted by nine countries, using the OSPAR Common Procedure. Waters were classified as being problem areas, potential problem areas, and non-problem areas with regard to eutrophication.
In coastal areas, rivers are the main source of nutrients often creating problem areas with regard to eutrophication in connected estuaries, fjords and bights, and in areas affected by river plumes. Some of these areas are especially sensitive to nutrients, stimulating plant (including phytoplankton growth, measured as high concentrations of chlorophyll along many coasts of the North Sea and in the stratified Norwegian coastal current. Atmospheric deposition is also an important source of nitrogen, particularly in the Greater North Sea, although nitrogen deposition decreased by 31% between 1995 and 2014. However, in some parts of the south-western North Sea, high nutrient inputs do not lead to eutrophication effects. This may be due to light limitation in turbid waters, or to vertical mixing of water.
The Norwegian Sea and Barents Sea (Arctic Waters) were classified as non-problem areas with regard to eutrophication. In the Greater North Sea, Celtic Seas, and Bay of Biscay more than 100 assessment areas in inshore and coastal waters were classified as problem areas with regard to eutrophication, with few large offshore waters classified as problem areas.
Problem areas or potential problem areas with regard to eutrophication were found in inshore waters and along the coasts of all countries that reported (Figure 2). The Greater North Sea had the largest surface area classified as a problem area (approximately 98 000 km2) or potential problem area (approximately 19 000 km2) with regard to eutrophication. Extensive problem areas were identified along the coast from Belgium to Denmark in the North Sea and in Danish and Swedish waters in the Kattegat and Sound. Smaller areas classified as problem areas (5–400 km2) or potential problem areas with regard to eutrophication in the Greater North Sea were found along the coast of France, the United Kingdom and Norway (Figure 2).
In the Celtic Seas, many small inland and coastal waters were classified as problem areas (approximately 500 km2) or potential problem areas (approximately 2 100 km2) with regard to eutrophication along the coasts of the United Kingdom and Ireland and on the French coast of Brittany. In the Bay of Biscay two areas were classified as problem areas (approximately 800 km2) and half of the areas classified as potential problem areas (approximately 3 900 km2) with regard to eutrophication.
The results indicate high eutrophication pressure in parts of the Greater North Sea and Celtic Seas.
Nevertheless, atmospheric and riverine nutrient inputs to the OSPAR Maritime Area have declined since 1995. Compared to the second integrated eutrophication status assessment (2001–2005), the spatial extent of problem areas with regard to eutrophication has decreased in the waters of six countries and remained unchanged in two. Only one country observed a small increase in the spatial extent of problem areas. Compared to the first eutrophication assessment (1990–2001), the spatial extent of problem areas in this third application of the Common Procedure has decreased for nearly all countries.

Figure 2: Eutrophication status in areas assessed in Arctic Waters, the Greater North Sea, Celtic Seas, and the Bay of Biscay, 2006–2014
Problem areas (red), potential problem areas (orange) and non-problem areas (green) with regard to eutrophication. For Ireland, Norway and the United Kingdom’s inshore and coastal waters the locations of problem areas and potential problem areas are illustrated with circles, because these assessed areas are too small to be seen if their actual area extent is mapped. White areas, not assessed
Further information can be found in Chapter 4 and Annexes 1, 2 and 3 of the Third OSPAR Integrated Report on the Eutrophication Status of the OSPAR Maritime Area .
Conclusion
The results of the integrated eutrophication assessment for the period 2006–2014 show eutrophication still exists in the OSPAR Maritime Area, particularly in areas sensitive to nutrient inputs, such as estuaries, fjords and bights, and areas affected by river plumes. In particular, there is high eutrophication pressure on the Greater North Sea with some localised coastal problem areas in the Celtic Sea. Although the spatial extent of eutrophication has declined in the OSPAR Maritime Area since 1990, the concerns about atmospheric and riverine inputs of nutrients that were identified in the QSR2010 still remain.
Further information can be found in Chapters 5 and 6 of the Third OSPAR Integrated Report on the Eutrophication Status of the OSPAR Maritime Area .
Knowledge Gaps
There is need for scientifically robust, area-specific assessment levels of the harmonised criteria used in the application of the Common Procedure to identify eutrophication.
Improvements could be made to the assessment and area classification tools to achieve a common understanding of the way they are be applied and interpreted.
Data and information are lacking in some areas on some direct and indirect effects of the eutrophication.
At the present time the common indicators are assessed separately from the application of the Common Procedure. Integration of the indicator assessments into the Common Procedure assessment of eutrophication is desirable
Further information can be found in Chapters 5 and 6 of the Third OSPAR Integrated Report on the Eutrophication Status of the OSPAR Maritime Area .
| Sheet reference | HASEC17/D505 |
|---|---|
| Assessment type | Intermediate Assessment |
| Context (1) | D5 - Eutrophication |
| Context (2) | OSPAR Publication 2003-189. OSPAR integrated report 2003 on the eutrophication status of the OSPAR maritime area based upon the first application of the Comprehensive Procedure; |
| Context (3) | D5 - Eutrophication |
| Context (4) | D5.3 - Indirect effects of nutrient enrichment, D5.1 - Nutrients levels, D5.2 - Direct effects of nutrient enrichment |
| Point of contact | Uli Claussen & Hans Ruiter |
secretariat@ospar.org | |
| Metadata date | 2017-04-20 |
| Title | Third OSPAR integrated report on the eutrophication status of the OSPAR Maritime Area, 2006-2014 |
| Resource abstract | OSPAR’s strategic objective is to combat eutrophication in the OSPAR Maritime Area, with the ultimate aim to achieve and maintain a healthy marine environment where anthropogenic eutrophication does not occur. This periodic assessment found the eutrophication status has improved since 1990, but eutrophication is still observed in 7% of the assessed area. The areas affected are mainly located in the south-eastern parts of the Greater North sea, and in some coastal waters of the Celtic Sea and Bay of Biscay |
| Linkage | https://www.ospar.org/documents?v=6962 |
| Topic category | Environment |
| Countries | BE, DE, DK, FR, IE, NL, NO, SE, UK |
| Start date | 2006-01-01 |
| End date | 2014-12-31 |
| Date of publication | 2017-06-30 |
| Conditions applying to access and use | http://www.ospar.org/site/assets/files/1215/ospar_data_conditions_of_use.pdf |
| Data Source | http://www.ices.dk/marine-data/data-portals/Pages/DOME.aspx |