

Proportion of Large Fish (Large Fish Index)
Background
Fishing mortality constrains the age structure of fish communities, reducing the proportion of larger and older individuals of species impacted. OSPAR currently uses multiple common indicators relating to fish size and species composition to assess impacts of fishing on fish communities within the food web.
The Large Fish Index (LFI) was developed to respond to fishing pressure on the proportion of large fish in demersal fish communities (species living on or near the seafloor) (Rochet et al., 2010). Time series dating back to the 1920s have shown depletion of the proportion of large fish occurred during the 1980s and 1990s in the North Sea (Greenstreet et al., 2011) and Firth of Clyde (Heath and Spiers 2014). Fishing at Maximum Sustainable Yield is expected to lead to a recovery in the indicator (Spence et al., 2021; Spiers et al. 2016;). In contrast, climate change is expected to depress the recovery of the indicator in the long term (Queirós et al., 2018).
The LFI indicator methodology was first applied in the North Sea (Greenstreet et al., 2011) and has subsequently been adapted to expand the indicator to the Celtic Seas (Shephard et al., 2011), Bay of Biscay and Iberian Coast (Modica et al., 2014) and Wider Atlantic (Mindel et al., 2018). Studies within the Mediterranean Sea have also demonstrated the applicability of the indicator (Bitetto et al., 2019).
The LFI uses estimates of fish abundance-at-length provided by international bottom trawl surveys. These are standardised monitoring programmes that occur each year in the same period taking representative samples according to specific guidelines (see CEMP).
Indicator Metric and Data Collection
The Large Fish Index (LFI) was developed for the North Sea (Greenstreet et al., 2011, 2012), and uses estimates of fish biomass density-at-length provided by trawl surveys. The assessment of each survey requires the suite of species constituting the demersal fish community and the length threshold (LT) defining ‘large fish’ to be selected. The LFI is simply:
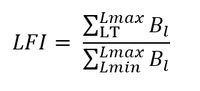
where B is biomass density (as kg/km2), l is length (in cm) of the individual fish size class, Lmin and Lmax are the minimum and maximum length of fish in the dataset.
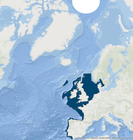
The LFI time series were determined for multiple groundfish surveys carried out across four OSPAR Regions: the Greater North Sea, Celtic Seas, the Bay of Biscay and Iberian Coast, and Wider Atlantic. Multiple LFI time series were derived for each Region (Table a).
| Region | Survey Acronym¹ | Assessment Period | Length threshold (cm) |
|---|---|---|---|
| Bay of Biscay and Iberian Coast | BBIC(n)SpaOT4 | 2011 – 2018 | 35 |
| BBIC(s)SpaOT1 | 2000 – 2020 | 50 | |
| BBIC(s)SpaOT4 | 2002 – 2020 | 45 | |
| BBICPorOT4 | 2002 – 2018 | 35 | |
| BBICFraBT4 | 2011 – 2020 | 40 | |
| BBICFraOT4² | 1997 – 2020 | 35 | |
| Celtic Seas | CSFraOT4² | 1997 – 2020 | 40 |
| CSEngBT1 | 2016 – 2019 | 35 | |
| CSEngBT3 | 1993 – 2019 | 35 | |
| CSEngBT3-Bristol Channel | 1993 – 2000 | 35 | |
| CSIreOT4 | 2003 – 2020 | 30 | |
| CSNIrOT1 | 2008 – 2020 | 45 | |
| CSNIrOT4 | 2009 – 2020 | 40 | |
| CSScoOT1 | 1985 – 2020 | 35 | |
| CSScoOT4 | 1995 – 2020 | 40 | |
| Greater North Sea | GNSEngBT3 | 1990 – 2020 | 45 |
| GNSFraOT4 | 1988 – 2020 | 50 | |
| GNSGerBT3 | 1997– 2020 | 30 | |
| GNSBelBT4 | 2004 – 2020 | 45 | |
| GNSIntOT1 | 1983 – 2020 | 50 | |
| GNSIntOT1-Channel | 2007 – 2020 | 50 | |
| GNSIntOT3 | 1998 – 2020 | 50 | |
| GNSNetBT3 | 1999 – 2020 | 45 | |
| Wider Atlantic | WAScoOT3 | 1999 – 2020 | 35 |
| WASpaOT3 | 2001 – 2020 | 40 | |
| None | None | None | None |
1 Survey acronym convention: First 2 to 4 capitalised letters indicate the OSPAR Region (BBIC: Bay of Biscay and Iberian Coast; CS: Celtic Seas; GNS: Greater North Sea; WA – Wider Atlantic). Next capitalised and lowercase letters signify the country involved (Spa: Spain; Bel: Belgium, Por: Portugal; Fra: France; Eng: England; Ire: Republic of Ireland; Nir: Northern Ireland; Sco: Scotland; Ger: Germany; Int: International; Net: The Netherlands. International refers to the two international bottom trawl surveys carried out in the Greater North Sea under the International Council for the Exploration of the Sea (ICES). In the Bay of Biscay and Iberian Coast Region, Spanish surveys are further delimited by (n) for surveys operating in the northern Iberian Coast area and (s) for surveys operating in the southern Iberian Coast area. Next two capitalised letters indicate the type of survey (OT: otter trawl; BT: beam trawl). Final number indicates the season in which the survey is primarily undertaken (1: January to March; 3: July to September; 4: October to December).
2 This is a single survey that operates across both the Celtic Seas and the Bay of Biscay and Iberian Coast Regions, from the southern coast of the Republic of Ireland and down the western Atlantic coast of France. For indicator assessment purposes, this single survey was split into its two regional components.
Standard data collected on these surveys comprise numbers of each species of fish sampled in each trawl sample, measured to defined length categories (i.e., 1 cm below, so a fish with a recorded length of 14 cm would be between 14,00 cm and 14,99 cm in length). By dividing these species catch numbers-at-length by the area swept by the trawl on each sampling occasion, the catch data are converted to standardised estimates of fish density-at-length, by species, at each sampling location. Summing these trawl-sample species density-at-length estimates across all trawl samples collected within each sampling stratum per year (e.g., ICES statistical rectangles) and dividing by the number of trawl samples within each stratum per year, gives the average estimates of the density (of each species and length category) within each sampling stratum per year (i.e., by statistical rectangle in the North Sea or surveyed depth strata elsewhere, see CEMP). The sample stratum density estimates are then multiplied by the area of the stratum to give estimated Ns,l of fish per stratum. These abundances are converted to biomass data, Bs,l, by applying species weight-at-length relationships (of the form w = alb, where w is weight and a and b are species-specific parameters).
Summing these sample stratum biomass estimates across all sampling strata sampled in each year, provides estimates of the biomass of each species (s) and length category (l), in each year, across the whole area covered by the survey. The biomass in each length category is summed across species to give the estimates (Bl) that are used in the calculation of each survey LFI time series.
Deciding on the species to be included in the analysis is the first step in calculating each survey LFI time series. The FishBase website (www.fishbase.org) provided an ‘ecotype’ classification for all species encountered. The LFI has been designed as an indicator of size composition within demersal fish communities, so species assigned to the Pelagic and Bathypelagic ecotypes were automatically excluded, while species assigned to the Demersal and Bathydemersal ecotypes were automatically included. Species belonging to the Benthopelagic ecotype were generally included, but with the exceptions of Clupea harengus, Dysomma brivirostre, Hyperoplys immaculatus, Ammodytidae (family-level ID code), Salmo (genus-level ID code), Salmo salar and Sarpa salpa, which were all excluded on the basis that these species are relatively poorly sampled by the survey gear.
Various options to set the length threshold have been suggested: a cut-off to represent change in functional groups from piscivores to prey (Rochet et al., 2010) a signal to noise approach to identify the least noisy time series (Greenstreet et al., 2011). The latter approach was used by OSPAR IA2017 to identify length cut-offs (LT) to define ‘large fish’ for surveys in the Greater North Sea and Celtic Seas (IA2017). For surveys that were not previously assessed LT was set to whichever value led to 20% of the total surveyed biomass to fall within the numerator, the LT was then rounded down for consistency with the previous assessments. The full list applied is given in Table a.
Spatial Scope: Assessment Units
LFI time series was derived for each survey and grouped within Regions to determine an overall assessment outcome for each OSPAR Region.
Baselines and threshold values
The published study in the Greater North Sea (Greenstreet et al., 2011) established the early 1980s as the reference period for the LFI derived from the North Sea first quarter (Q1) international bottom trawl survey (GNSIntOT1). This period was selected by Greenstreet et al., (2011) on the basis that this was the last time that ICES advice for setting fish quotas was to maintain status quo; i.e., to carry on fishing at prevailing levels because stocks were not considered to be unduly depleted. Selection of this reference period led to the adoption of an LFI (with LT=40 cm) score of >0,3 as the threshold for the North Sea (Heslenfeld and Enserink, 2008). During OSPAR IA2017, the LT for this survey was raised to 50 cm. This survey is assessed here.
In a study of the Celtic Seas, Shephard et al., (2011) noted a period of relatively stable LFI (with LT=50 cm) values during the late 1980s, which included the six highest LFI values recorded. The stability of the LFI, combined with these high values, led Shephard et al., (2011) to adopt this period prior to 1990 as their reference period for the Celtic Seas. However, the survey these authors studied has been discontinued.
For the Iberian Coast, Modica et al., (2014) investigated the Spanish north coast survey (BBIC(n)SpaOT4) and suggested a baseline of 1989. However, this was prior to the onset of the survey so through extrapolation they suggested targets of 0,34 to 0,41 for the LFI (with LT=35 cm). This survey is assessed here but data were only available publicly from 2011.
Time Series Assessment
The long-term trend in each time series was modelled through the application of a LOESS smoother (i.e., locally weighted scatterplot smoothing) with a simple ‘fixed span’ of one decade. Absolute threshold values for the LFI time series analysed here have been published for GNSIntOT1 and following the approach outlined in IA2017, the average of values between 1983 to 1985 was also used to assess change in GNSIntOT1 and due to the strong correlation between GNSIntOT1 and GNSIntOT3 this threshold was rescaled through regression and applied to the more recent Q3 survey also. For all other surveys, a trends-based approach with statistical detection for shifts in stable periods only was adopted in common with the assessment of Size composition in fish communities (Typical Length). Previously, for surveys in the Celtic Seas Region a baseline was trialled (equal to three times the early 1990s average), but the shift detection approach (below) is considered superior.
Breakpoint analyses uses data to define stable underlying periods (see Probst and Stelzenmüller, 2015). The method makes it possible to say whether there is a significant change in the time series state over time, namely whether the recent period is not significantly different from the historically observed period. The method avoids the arbitrary choice of reference periods for assessment (i.e., how many years to use to calculate an average) which can lead to subjective assessments. The shorter the period chosen, the more likely it is that noise in the data or natural fluctuations in the system are being compared against each other. However, too long a period and it could be that actual changes in state are averaged out. The minimum detectable period is defined in this analysis as six years and is assumed to be appropriate to capture the response of the fish community as opposed to noise and short-term fluctuations. The analysis uses two statistical approaches: First applying the ‘supremum F test’ to establish whether a non-stationary time series or a constant period for the entire time series is more suitable. If the former, then breakpoint analysis is applied to find periods of at least six years’ duration.
Results
North Sea
In the North Sea, both GNSIntOT1 and GNSIntOT3 remain below their threshold values (0,165 and 0,170 respectively) derived from the average LFI from the 1983 to 1985 period.
The longest running survey, i.e., GNSIntOT1, shows a long-term decrease from the early 1980s with a significant shift to a period of low values during the 1990s (Figure 1 and Figure 2). This long-term decrease is prior to the start of the GNSIntOT3 survey and the beam trawl surveys: GNSBelBT3, GNSGerBT3 and GNSNetBT3.

Figure 1. Time series of Large Fish Index by survey, showing LOESS smoothed patterns, where overlapping surveys within Regions are grouped. The horizontal black lines on the North Sea and northern Celtic Seas panes show the threshold values for GNSIntOT1 and CSScoOT1 surveys respectively. The y-axes of these plots are not directly comparable between surveys, subdivisions and regions due to the different fishing gears used between surveys and differing temporal and spatial coverage of the surveys.
.")
Figure 2. Time series of Large Fish Index by survey showing data points, LOESS smoothed patterns and stable periods (black if constant over period assessed and red if a breakpoint is detected, where periods are 6+ years in length).
A recovery from the minimum level is evident in GNSIntOT1 from the early 2000s, and in the shorter time series derived by GNSIntOT3 and GNSBelBT3. Both GNSIntOT1 and GNSIntOT3 approach their assessment thresholds (0,165 and 0,170 respectively) in 2015 and 2016 respectively. However, continued declines are evident in GNSGerBT3 and GNSNetBT3. The LOESS shows distinct falls in the last two datapoints for GNSIntOT1, GNSIntOT3, GNSGerBT3 and GNSNetBT3 indicating that the recovery has potentially reversed in recent years.
In the eastern Channel, ongoing recoveries are evident in two surveys (GNSIntOT1_channel and GNSFraOT4), with no change in GNSEngBT3.
Celtic Seas
The CSScoOT1 survey is the only survey with an assessment value, and it remains below the assessment value (0,508) derived from the average LFI from the 1985 to 1987 period.
In the north of the Region, the longest running survey, i.e., CSScoOT1, shows a long-term decrease from the 1980s with a significant shift to a period of low values during the 1990s (Figure 1 and Figure 2) similar to the North Sea case. This long-term decrease is also prior to the start of the CSScoOT4 and CSIreOT4 surveys. In all three surveys, ongoing recoveries are evident during the 2000s and 2010s with a significant shift in stable state in each (Figure 2). A short-term fall in the last two years is seen in CSScoOT1 only.
There is no survey data available for the 1980s in the south of the Region. However, there is a general pattern of no change until increases begin during the 2010s (Figure 1). A significant shift to a higher long-term state is evident in the Irish Sea for CSEngBT3 only (Figure 2).
Bay of Biscay and Iberian Coast
No long-term change was evident in any survey (Figure 1 and Figure 2).
Wider Atlantic
No long-term change was evident in either survey (Figure 1 and Figure 2).
Conclusion
Where long time series are available (i.e., in the North Sea and northern Celtic Seas), a common pattern of decreases in LFI between the 1980s and 2000 is consistent between surveys. The trend towards recovery, reported in the North Sea and northern Celtic Seas in the Intermediate Assessment 2017, did not continue. However, evidence of continued recoveries in the eastern English Channel and the southern Celtic Seas remain.
Although it remains to be seen if the observed declines in the North Sea and northern Celtic Seas lead to new stable states the evidence would suggest that reductions in fishing pressure are required to allow a return to a recovery trajectory.
No long-term changes were evident in the Bay of Biscay and Iberian Coast or in the Wider Atlantic.
Knowledge Gaps
Gaps focus on: the lack of historical data (for seas other than the North Sea and Firth of Clyde) or appropriate models to inform LFI threshold value setting; the effects of warming sea temperature on LFI threshold values and on demersal fish size composition recovery rates; and, a full understanding of relationships between all human pressures and their impact on the full demersal fish community, not just the commercially fished stocks.
Future development of the indicator should explore the potential of using assessment units which split the OSPAR Regions into smaller areas and the inclusion of fishing pressure metrics.
Bitetto, I., Romagnoni, G., Adamidou, A., Certain, G., Di Lorenzo, M., Donnaloia, M., Lembo, G., Maiorano, P., Milisenda, G., Musumeci, C., Ordines, F., Pesci, P., Peristeraki, P., Pesic, A., Sartor, P., Spedicato M.T. 2019. Modelling spatio-temporal patterns of fish community size structure across the northern Mediterranean Sea: an analysis combining MEDITS survey data with environmental and anthropogenic drivers. Scientia Marina 83S1: 141-151. Available at: https://doi.org/10.3989/scimar.05015.06A
Greenstreet, S.P.R., Rogers, S.I., Rice, J.C., Piet, G.J., Guirey, E.J., Fraser, H.M., Fryer, R.J. 2011. Development of the EcoQO for fish communities in the North Sea. ICES Journal of Marine Science, 68, 1-11.
Greenstreet, S.P.R., Rogers, S.I., Rice, J.C., Piet, G.J., Guirey, E.J., Fraser, H.M., Fryer, R.J. 2012. A reassessment of trends in the North Sea Large Fish Indicator and a re-evaluation of earlier conclusions. ICES Journal of Marine Science, 69, 343-345.
Heath, M.R. and Speirs, D.C. 2012. Changes in species diversity and size composition in the Firth of Clyde demersal fish community, 1927-2009. Proceedings of the Royal Society B. 279, 543–552. Available at: https://doi.org/10.1098/rspb.2011.1015
Heslenfeld, P., Enserink, E. L. 2008. OSPAR Ecological Quality Objectives: the utility of health indicators for the North Sea. ICES Journal of Marine Science, 65, 1392–1397.
Mindel, B. L., Neat, F. C., Webb, T. J., and Blanchard, J. L. Size-based indicators show depth-dependent change over time in the deep sea. ICES Journal of Marine Science, 75: 113–121. Available at: https://doi.org/10.1093/icesjms/fsx110
Modica, L., Velasco, F., Preciado, I., Soto, M., Greenstreet, S.P.R., 2014. Development of the large fish indicator and associated Ecological Quality Objective for a North-East Atlantic fish community. ICES Journal of Marine Science, 71: 2403-2415.
Probst, W.N., & V Stelzenmuller, V. 2015. A benchmarking and assessment framework to operationalise ecological indicators based on time series analysis. Ecological Indicators 55: 94–106. Available at: http://dx.doi.org/10.1016/j.ecolind.2015.02.035
Queirós, A.M., Fernandes, J., Genevier, L., Lynam, C.P. (2018) Climate change alters fish community size‐structure, requiring adaptive policy targets. Fish and Fisheries 2018; 00:1–9. Available at: https://doi.org/10.1111/faf.12278
Rochet M.J., Trenkel V.M., Carpentier A., et al. 2010. Do changes in environmental and fishing pressures impact marine communities? An empirical assessment. Journal of Applied Ecology 47: 741-750. Available at: https://doi.org/10.1111/j.1365-2664.2010.01841.x
Shephard, S., Reid, D.G., Greenstreet, S.P.R. 2011. Interpreting the Large Fish Indicator for the Celtic Sea. ICES Journal of Marine Science, 68, 1963-1972. Available at: https://doi.org/10.1093/icesjms/fsr114
Spence, M.A., Griffiths, C.A., Waggitt, J.J., Bannister, H.J., Thorpe, R.B., Rossberg, A.G. and Lynam, C.P. (2021) Sustainable fishing can lead to improvements in marine ecosystem status: an ensemble-model forecast of the North Sea ecosystem. Marine Ecology Progress Series 680:207-221. Available at: https://doi.org/10.3354/meps13870
Spiers, D.C., Greenstreet, S.P.R., Heath, M.R. 2016. Modelling the effects of fishing on the North Sea fish community size composition. Ecological Modelling. 321, 35-45.
ter Hofstede, R., Hiddink, J.G., Rijnsdorp, A.D. 2010. Regional warming changes fish species richness in the eastern North Atlantic Ocean. Marine Ecology Progress Series, 414, 1–9.
Contributors
Lead Authors: Chris Lynam and GerJan Piet.
Supported by: Intersessional Correspondence Group on the Coordination of Biodiversity Assessment and Monitoring (ICG-COBAM), OSPAR Biodiversity Committee (BDC)
Citation
Lynam. C.P. and Piet. G.J. 2023. Proportion of Large Fish (Large Fish Index). In: OSPAR, 2023: The 2023 Quality Status Report for the Northeast Atlantic. OSPAR Commission, London. Available at: https://oap.ospar.org/en/ospar-assessments/quality-status-reports/qsr-2023/indicator-assessments/proportion-lfi/
| Assessment type | Indicator Assessment |
|---|---|
| Indicator Code | largefishindicatorqsr23-ospar |
| Summary Results | https://odims.ospar.org/en/submissions/ospar_lfi_msfd_2022_06_001/ |
| SDG Indicator | 14.2 By 2020, sustainably manage and protect marine and coastal ecosystems to avoid significant adverse impacts, including by strengthening their resilience, and take action for their restoration in order to achieve healthy and productive oceans |
| Thematic Activity | Biological Diversity and Ecosystems |
| Relevant OSPAR Documentation | OSPAR Agreement 2018-05 CEMP Guideline – FW3: |
| Date of publication | 2023-06-30 |
| Conditions applying to access and use | https://oap.ospar.org/en/data-policy/ |
| Data Snapshot | https://odims.ospar.org/en/submissions/ospar_lfi_snapshot_2022_06_001/ |
| Data Results | https://odims.ospar.org/en/submissions/ospar_lfi_results_2022_06_001/ |