

Plastic particles in fulmar stomachs in the North Sea
D10 - Marine Litter
D10C1 - Litter (excluding micro-litter) D10C2 - Micro-litter D10C3 - Litter ingested
Currently 56% of beached North Sea fulmars have more than 0.1 g of plastics in their stomachs, exceeding the OSPAR long-term goal of 10%. This reflects the abundance of floating litter and provides an indication of harm. The amounts of ingested plastics have decreased significantly over the past ten years.
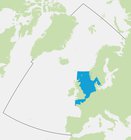
Area assessed
Background
Litter is widespread in the marine environment and is harmful to wildlife and the ecosystem. OSPAR and the European Commission aim to substantially reduce the amount marine litter in the OSPAR Maritime Area by 2020 to levels where properties and quantities do not cause harm to the marine environment. The quantity of plastics ingested by marine wildlife mainly reflects the abundance of floating litter in their environment.
OSPAR monitors and assesses plastics in the stomachs of northern fulmars as one of its indicators of environmental quality. Fulmars are abundant and widespread seabirds known to regularly ingest litter, with nearly all individuals having at least some plastic in their stomachs. Although fulmars forage near the water surface, their stomachs may also contain items from deeper water or items that may be indirectly ingested through their prey.
The fulmar Indicator Assessment approach is based on a previous OSPAR Ecological Quality Objective (EcoQO). The monitoring program uses corpses of beached birds or individuals accidentally killed. OSPAR has a long term goal of less than 10% of fulmars exceeding a level of 0.1 gram of plastic in their stomachs. Research methods and results have been published in reports and peer-reviewed scientific literature and dedicated OSPAR Guidelines. Whilst this indicator is currently only used in the North Sea it is also suitable for implementation in the Greater North Sea, Arctic and Celtic Seas, and has already been used in fulmar studies elsewhere in the North Atlantic and North Pacific.
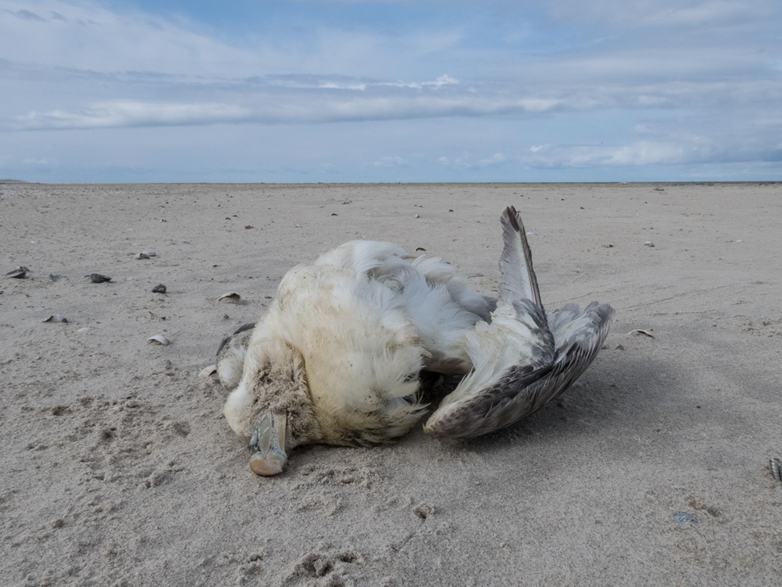
The monitoring system for plastics in stomachs of seabirds uses beached northern fulmars. The fulmar in this photograph had beached on Texel, the Netherlands, on 28 April 2016.
(Photo by J.A. van Franeker.)
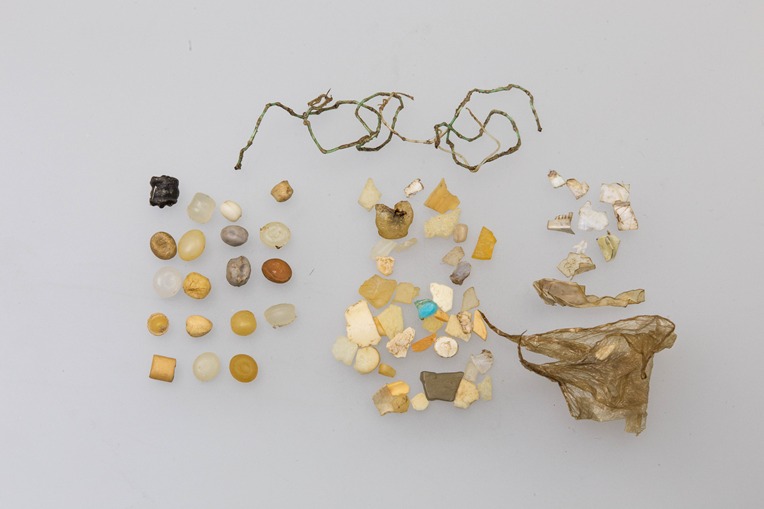
Plastics from a fulmar stomach with industrial granules (left) and a mix of threadlike (top), fragmented (centre), and sheet-like (right) consumer plastics
Size indicated by the spherical industrial granules which are of 4 to 5 mm diameter. (Fulmar sample NET-2016-031 photo by J.A. van Franeker)
Introduction
Many marine organisms, including seabirds, turtles, marine mammals, fish, crustaceans, shellfish and zooplankton ingest man-made debris that they encounter in their marine environment (Kühn et al. 2015). The quantity of litter ingested and found in animal stomachs or intestines, in particular that of persistent materials such as plastics, reflects the abundance of marine litter, the associated harm to wildlife and the marine ecosystem, and socio-economic harm.
Policy
Within its system of Common Indicators, OSPAR has agreed to the monitoring of plastic abundance in stomachs of seabirds as an indicator for levels and trends in marine litter floating at the surface of the North Sea. Northern fulmars (Fulmarus glacialis) forage near the water surface, but stomachs may additionally contain items from deeper water or the seabed. These items could be indirectly ingested through prey or directly when litter is transported vertically from the deeper parts of the North Sea to the surface. The indicator has been implemented through long term monitoring of plastic abundance in stomach contents of the northern fulmar (OSPAR EcoQO no. 3.3) (OSPAR 2009, 2010a,b; 2014a,b). The fulmar EcoQO approach has been taken up as an OSPAR Common Indicator Assessment for the Intermediate Assessments 2017 and 2019.
The European Commission, in its European Marine Strategy Framework Directive (MSFD) refers to marine litter policies under its Descriptor 10 which states that ‘Properties and quantities of marine litter do not cause harm to the coastal and marine environment’ (EC 2008, 2010, 2017). Monitoring of plastic ingestion by marine wildlife is currently described under the criteria D10C3 (EC 2017).
Monitoring
Within the European MSFD, the OSPAR Common Indicator for the Fulmar has been presented as a species relevant in criteria D10C3 for the Greater North Sea, Arctic Waters, and Celtic Seas (EC 2008; EC 2010; Galgani et al. 2010; EC 2017). Plastic objects ingested by fulmars may range in size from few mm to several cm, and can be considerably larger for flexible items. Fulmars thus monitor both the litter and microlitter described under D10C3 (EC 2017). In addition, because fulmar feeding is largely restricted to surface feeding, the indicator has also relevance for the criteria D10C1 and D10C2 for litter and micro-litter, respectively, in the surface layer of the water column. The fulmar approach has been taken as example for other biota indicators. The purpose of such monitoring of plastic abundance ingested by wildlife is
- to obtain a quantitative measure for spatial and temporal patterns in the abundance and composition of marine litter, in particular plastics, mainly floating at the surface and;
- to provide an indication of ecological harm caused by such litter.
In its recent wording (EC 2017) the MSFD has broadened its monitoring scope to ingestion of litter and micro-litter by marine species, and the earlier concept (OSPAR and EC 2010) of ecological harm has been redefined as ‘a level that does not adversely affect the health of the species concerned’. Fulmar monitoring methods and results have been published in regular reports and peer-reviewed scientific literature (Van Franeker et al. 2011; Van Franeker & Law 2015). Dedicated OSPAR guidelines have been published in 2015 to guarantee consistent monitoring methods and uniform submission of data by all OSPAR contracting parties (OSPAR 2015a,b; http://www.ospar.org/convention/agreements?q=fulmar).
Suitability of fulmars for monitoring marine litter
Fulmars are pelagic (open sea) seabirds that belong to the large group of the tubenoses (Procellariiformes) of which the albatrosses are the best known representatives. These birds forage exclusively at sea and never on land, and rarely forage close to shore. The fulmar is a poor diver, and thus feeds of what is available at or within a few meters from the water surface. Like most tubenosed seabirds, fulmars regularly ingest a variety of marine debris, probably mostly taken directly and intentionally because resembling prey, or unintentionally when mixed with attractive food wastes. But indirect ingestion will also occur, e.g. through preying on fish with ingested plastics or scavenging on guts of other dead animals. Size details of plastics ingested indicated that roughly 90% of ingested plastic items (not threads or soft sheets) found in the first glandular stomach of fulmars is 10mm or less in size, and over 50% is 5mm or less (Bravo Rebolledo 2011). The definition for micro-plastics as items smaller than 5mm was introduced by an international expert workshop (Arthur et al. 2009), and this definition has been copied into particle size definitions used in the Marine Strategy Framework Directive (MSFD). MSFD defines litter smaller than 5mm as micro-particles, between 5mm and 25mm as meso-particles, and items over 25mm as macro-debris (MSFD-TSGML 2011). Thus, litter ingested by fulmars is mostly in the micro- and meso-size ranges. Unlike most gulls, fulmars normally do not regurgitate indigestible components of their diet, but gradually grind these in their muscular stomach (gizzard) until particles are worn or broken into sizes small enough to pass into the intestines and be excreted (which appears to happen at particle size of roughly 2mm to 3mm (Bravo Rebolledo 2011)). As a consequence, fulmar stomach contents integrate litter abundance encountered during feeding for a number of days to weeks (Van Franeker & Law 2015).
Previous assessments
OSPAR’s Quality Status Report (OSPAR 2010a) included an assessment of the North Sea EcoQO on plastic particles in seabird stomachs. The percentage of fulmars in the Greater North Sea with more than 0.1 g of plastic in the stomach ranged from 45% to over 60%. The English Channel area was the most heavily polluted area while the Scottish Islands were the ‘cleanest’ with a mean mass for plastics in fulmars of about a third of the level encountered in the English Channel. Data from the Faroe Islands (Arctic Waters) were included for comparison. The EcoQO was probably only achieved in Arctic populations. A long monitoring series from the Netherlands showed a significant reduction in plastic abundance from 1997 to 2006, mainly through a reduction in raw industrial plastics.
In OSPARs first intermediate assessment (OSPAR 2017) among 525 fulmar stomachs analysed over the period 2010-2014, 93% had some ingested plastic, 58% contained more than 0.1 g of plastic, and average values per bird were 33 particles and 0.31g. Fulmars from the English Channel had the highest plastics load, slightly lower levels being observed further north. No significant increases or decreases in ingested plastic mass were observed in the North Sea as a whole or in any of the five sub-regions.
The Fulmar EcoQO methodology is also being used elsewhere in the North Atlantic and North Pacific areas (e.g. Provencher et al. 2009; Avery-Gomm et al. 2012, 2018; Kühn & Van Franeker 2012; Bond et al. 2014; Trevail et al., 2015; Herzke et al. 2016; Mallory 2008; Nevins et al. 2011; Donnely-Greenan et al. 2014; Bond et al. 2014; Poon et al. 2017; Terepocki et al. 2017) allowing wide spatial comparisons of marine litter in European waters and other north Atlantic and Pacific regions.
Long term monitoring in the Netherlands
In the Dutch sector of the North Sea, changes in stomach contents of fulmars have been monitored since the 1980s. Although overall abundance of plastics in stomachs have shown unexplained changes over time (Figure a.A), rapid reductions in abundance of industrial plastic within one to two decades (Figure a.B) have shown that fulmar stomach contents rapidly reflect changes in source specific plastic abundances in their environment (Van Franeker et al. 2011; Van Franeker & Law 2015), and are thus an effective way to assess the success of policy measures, reflecting the improved environmental quality for marine organisms and the pelagic marine environment. The early rapid reduction of industrial plastic litter is believed to reflect a response from industry and transport sectors to media attention for omnipresent industrial plastic debris in the 1980s in combination with the economic incentive to reduce loss of valuable source materials. Lack of similar incentives for consumer types of plastic debris is believed to explain the different trend in these materials.
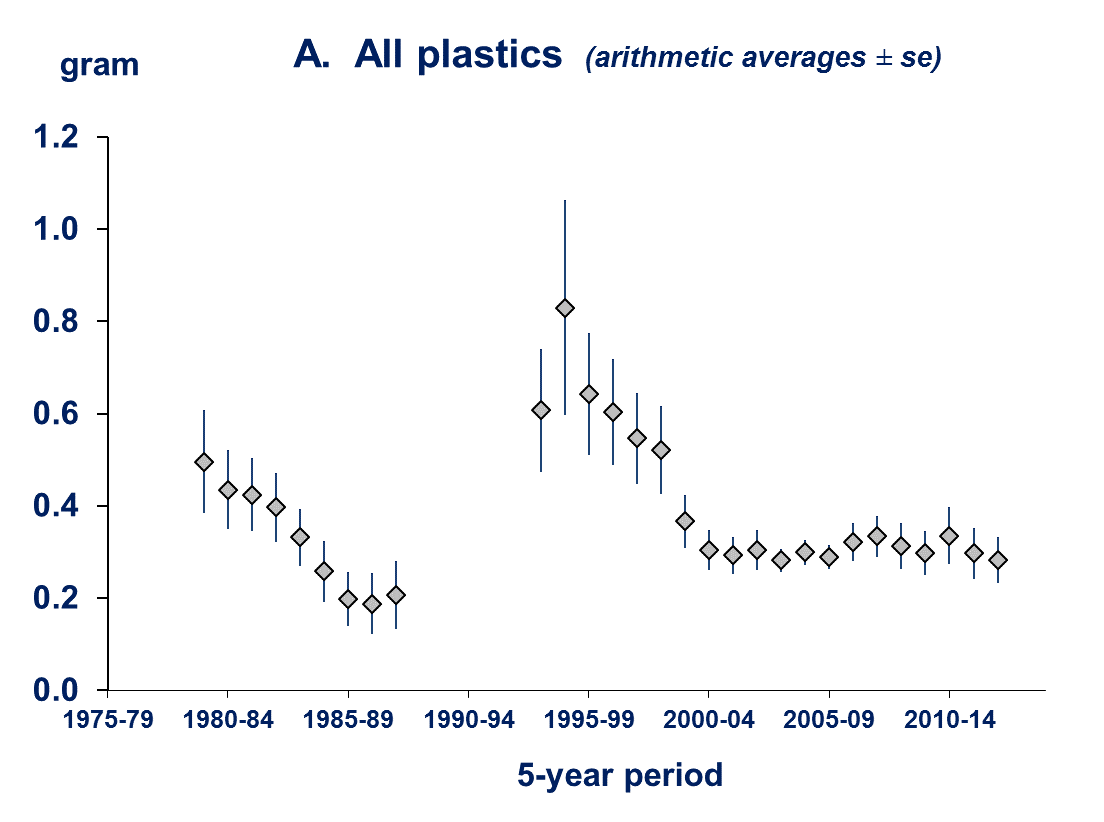
Figure a.(A) : Plastic mass in stomachs of fulmars recorded in the Netherlands between 1980 and 2016, for all plastics combined.
Data are shown by arithmetic average ± standard error of the mean for mass in running five year averages (i.e. data points shift one year ahead at a time). It should be noted that this data visualisation does not represent a statistical trend analysis. [source: Van Franeker et al. 2017]
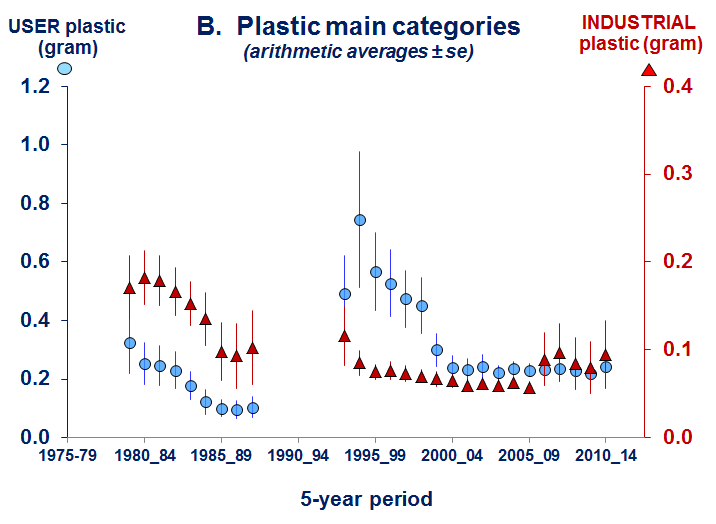
Figure a.(B) Plastic mass in stomachs of fulmars recorded in the Netherlands between 1980 and 2016 for separate consumer plastics (blue circles, left y-axis) and industrial plastic (red triangles, right y-axis).
Data are shown by arithmetic average ± standard error for mass in running five year averages (i.e. data points shift one year ahead at a time). It should be noted that this data visualisation does not represent a statistical trend analysis. [source: Van Franeker et al. 2017]
At this point in time, OSPAR IA 2019 indicator assessment values are not necessarily to be considered as equivalent to proposed EU MSFD criteria threshold values, but can be used for the purposes of their MSFD obligations by those Contracting Parties that wish to do so.
Full details of methods have been provided in the OSPAR Guidelines for Monitoring of plastic particles in stomachs of fulmars in the North Sea area ( http://www.ospar.org/convention/agreements?q=fulmar ) and repeated here only in a descriptive summary.
Corpses of dead beached birds or accidentally killed specimens are collected mostly by volunteer networks, but processed at experienced laboratories. At dissection, in addition to date, the finding location is specified by a system of area codes and geographical coordinates for the area or more detailed location. Based on several internal and external anatomical characters, birds are classified as either adult or non-adult age group. The pilot study for fulmar monitoring (Van Franeker & Meijboom 2002) showed that age is a relevant variable as younger birds generally have more plastics in the stomach than adults. Thus, in cases where samples to be compared have strongly different age compositions, analyses may need to be specified for separate age groups. Because age characters are sex specific, data recording includes sex, although there is currently no evidence for a relevant influence of gender on plastic abundance in stomachs.
Stomach contents are carefully rinsed in a sieve with a 1mm mesh and then transferred to a petri dish for sorting under a binocular microscope. The 1mm mesh is used because smaller meshes become easily clogged with mucus from the stomach wall and with food remains. Analyses using smaller meshes were found to be extremely time consuming and particles smaller than 1mm are very rare in the stomachs (Bravo Rebolledo 2011) and thus contribute little to numerical abundance of particles and even much less to plastic mass.
Two main plastic categories are distinguished in the OSPAR Common Indicator. Industrial plastic granulate (‘pellets’) are separated from consumer debris such as sheets, foams, threadlike materials, hard fragments etc. For each of these categories the number of particles and mass (in gram to 4th decimal) is recorded. The final assessment is based only on total weight of plastic in stomachs, but industrial and consumer waste plastics have different sources and backgrounds and as such provide very useful information for the interpretation of the monitoring data and thus for priorities in policy measures to be considered.
Data thus collected can be used to calculate for specified samples:
• the frequency of occurrence (%FO) the proportion of birds having plastic in the stomach (also referred to as ’incidence’ or ‘prevalence’)
• arithmetic average and standard error (avg±se) of the mean for number or mass of plastic
• EcoQO performance (EcoQO%), being the percentage of birds exceeding the level of 0.1g of ingested plastic as defined in the OSPAR EcoQO long term goal
The reference level for presence of plastics in stomachs of northern fulmars (or any marine organism) is zero, as synthetic materials are solely manmade, and were only introduced into the marine environment since about the mid-1900s.
However, accepting that incidental losses are unavoidable OSPAR (2008, 2009), has defined an (undated) long term goal for the fulmar EcoQO 3.3 in the North Sea as:
“There should be less than 10% of northern fulmars (Fulmarus glacialis) having more than 0.1 g plastic particles in the stomach in samples of 50 to 100 beach-washed fulmars from each of 4 to 5 areas of the North Sea over a period of at least five years”.
Thus, from this definition, the basic monitoring information required is the total mass of plastic in individual stomachs, and the percentage of stomachs exceeding the 0.1g level (referred to as ‘EcoQO performance’ or ‘EcoQO%’).
The OSPAR Assessment for abundance of plastics in stomachs of northern fulmars is therefore calculated as percentage of investigated birds exceeding the 0.1g level of plastics in the stomach (EcoQO Performance in %) over the most recent 5-year period of available data.
In this second Intermediate Assessment (IA-2), this is the 5-year period of 2012 to 2016. It is important to emphasize that all data on average ingested debris or EcoQO performances are so called ‘population averages’, meaning that clean birds without any plastic in the stomachs are included in all the calculations. Analyses in the pilot study by Van Franeker & Meijboom (2002) have shown that about 40 stomachs are the recommended minimum sample size to obtain a reliable figure for plastic ingestion representative for a selected area and period of time. This recommended sample size should be taken into account when spatial aggregations of data are being made.
For the fulmar indicator, OSPAR has sub-divided the Greater North Sea into 5 sub-regions: Significant differences between part of these regions existed, with highest level of pollution in the Channel area, gradually decreasing to more northern regions within the North Sea and beyond (Van Franeker et al. 2011; Van Franeker & Law 2015).
 and additional locations named in text.")
Figure b. The five fulmar EcoQO sub-regions within the Greater North Sea (OSPAR Region II) and additional locations named in text.
1) Scottish Islands (Orkney and Shetland), 2) East England (includes incidental data east Scotland), 3) Channel, 4) south-eastern North Sea (Belgium, Netherlands, Germany), 5) Skagerrak (Denmark, Norway, Sweden).
OSPAR has set the same long term goal for all these North Sea areas, however the timeline for reaching this long term goal is not specified, but is certainly relevant for policies under the European Marine Strategy Framework Directive (MSFD) in Descriptor 10. Good Environmental Status (GES) has to be achieved by 2020 (EC 2008, 2010, 2017). However, OSPARs Regional Action Plan for marine litter (OSPAR 2014a) has not yet identified regional or overall targets to be achieved by 2020. It appears that current national ambitions vary widely from the original OSPAR EcoQO long term goal to unspecified rates of change (Van Acoleyen et al. 2014). Tendency seems a wording which requires by 2020 a significant change in the direction of the long-term OSPAR target. Power analyses of Dutch data in the pilot study by Van Franeker & Meijboom (2002) indicated that fulmar monitoring data may be expected to be able to detect statistically significant trends (p<0.05) over time periods of at least 4-8 years depending on the type of plastics considered: periods of significant change indeed have been observed in early monitoring years, for consumer plastics, but for industrial plastics in particular (Van Franeker et al. 2011; Van Franeker & Law 2015). Trends in quantities of plastics ingested can be visually illustrated as the annual updates of running 5-year averages in plastic mass or the five year figures for EcoQO performance. In such graphs, each data point thus overlaps with four years of data from the previous data point. This ‘smoothens’ most ad-hoc variability in the data and emphasizes longer-term trends. However, these are only graphic illustrations without statistical meaning. As agreed in OSPAR and published in scientific peer-reviewed literature, the method to statistically evaluate trends of increase or decrease in plastic ingestion, use linear regression analysis of log transformed mass of plastics in individual birds against the year of sampling over a period of the most recent ten years. An additional less detailed way to test for change is a GLM approach (Generalized Linear Modelling), in which annual data for sample size and proportions of birds with over 0.1g of plastic in the stomach are evaluated in a logistic analysis dedicated for binomial distributions and using logit transformed data.
For evaluation of regional differences, plastic data were fitted in a negative binomial generalized linear model with region included as a factor, and the test statistic is a t-score based on residual variance for the region (Van Franeker et al. 2011). Data for the current analyses were stored in Oracle. Graphs were made up in Microsoft Excel and statistical analyses for time trends or regional differences were conducted in Genstat, 19th Edition (VSN International 2017). Frequencies of occurrence between two data sets (time periods, or regions) were tested using the 2-sample z-test to compare sample proportion according to Brown et al. (2001) using http://epitools.ausvet.com.au/content.php?page=z-test-2 .
Results
Assessment 2012 - 2016:
Over the five year period 2012-2016, the OSPAR long term goal in terms of plastic litter ingestion by seabirds was not reached anywhere in the North Sea. Among 514 fulmar stomachs analysed over the 2012-2016 period, 56% contained more than 0.1g of plastic, whereas OSPAR’s long term goal is to reduce this EcoQO% to less than 10%. Of all birds analysed, 95% had some ingested plastic, and average values per individual were 31 particles and 0.28g per bird. Regionally the EcoQO% ranged from 50% in the Skagerrak to 75% in the Channel. Within the North Sea the earlier tendency for decreasing plastic loads further north has become less clear due to increased levels of plastic ingestion on the Scottish Islands. The latter increase cannot be explained at present. However, on the larger scale of the Northeast Atlantic, a latitudinal pattern remains evident. Figure 1 shows the sub-regional differences in ingested plastics in the North Sea. Only in the far north-western Atlantic (the Canadian Arctic), plastic ingestion levels come really close to the long-term OSPAR EcoQO target. In the North Sea, during the 2007-2011 5-year period preceding the current assessment, 63% of North Sea fulmars exceeded the 0.1g plastic level (average 0.37 g per bird). In the first assessment period 2010-2014 these decreased to 58% and 0.31 g. The 56% and 0.28 g calculated for the IA2 period 2012-2016 suggest a continued decrease, that however has to be evaluated in the agreed statistical approach.
Trends 2007 - 2016
Time related trends in the fulmar monitoring program are tested over periods of 10 years. The first Intermediate assessment 2005-2014 had not revealed any change. However, over all North Sea sub-regions combined, the current 2007-2016 analyses show significant declines in both the ingested plastic mass (p<0.001) and the annual percentage of birds with over 0.1g of plastic (p=0.002). Statistical significant progress in the direction of the long-term target, as an informal provisional aim for MSFD is thus achieved. The data for the separate five sub-regions (Figure 1) showed no statistically significant changes except for a decline in EcoQO% for the fulmars from east England (Figure 2). This illustrates for this indicator the statistical advantage of the regional North Sea assessment, due to the analysis of more samples.
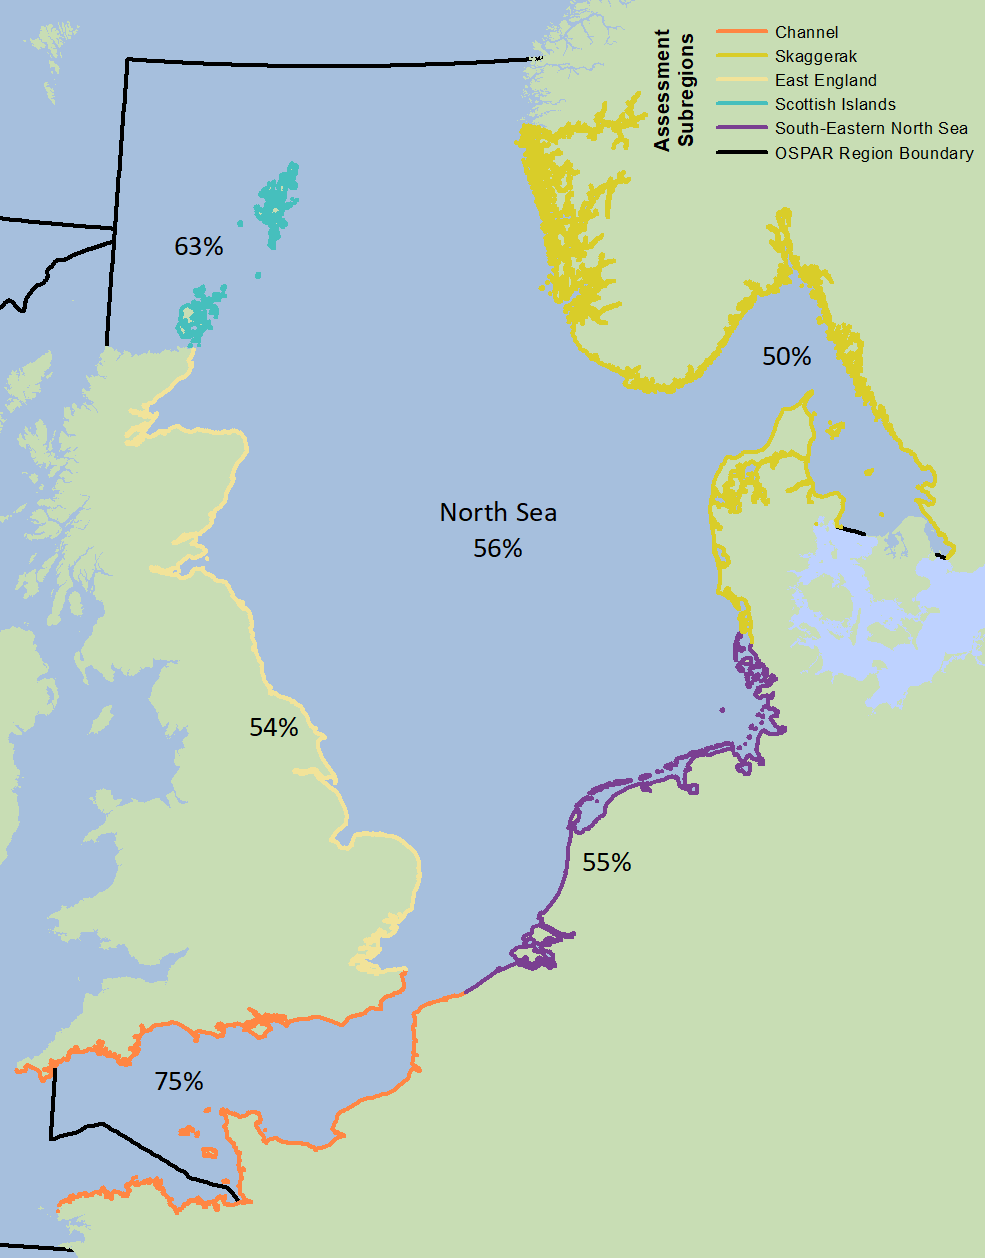
Figure 1 Proportions of fulmars having more than 0.1g plastic in the stomach (EcoQO performance) in different sub-regions of the North Sea over the period 2012 to 2016.
Details on sample sizes and average number and mass of ingested plastics are shown in Extended Results Table a.
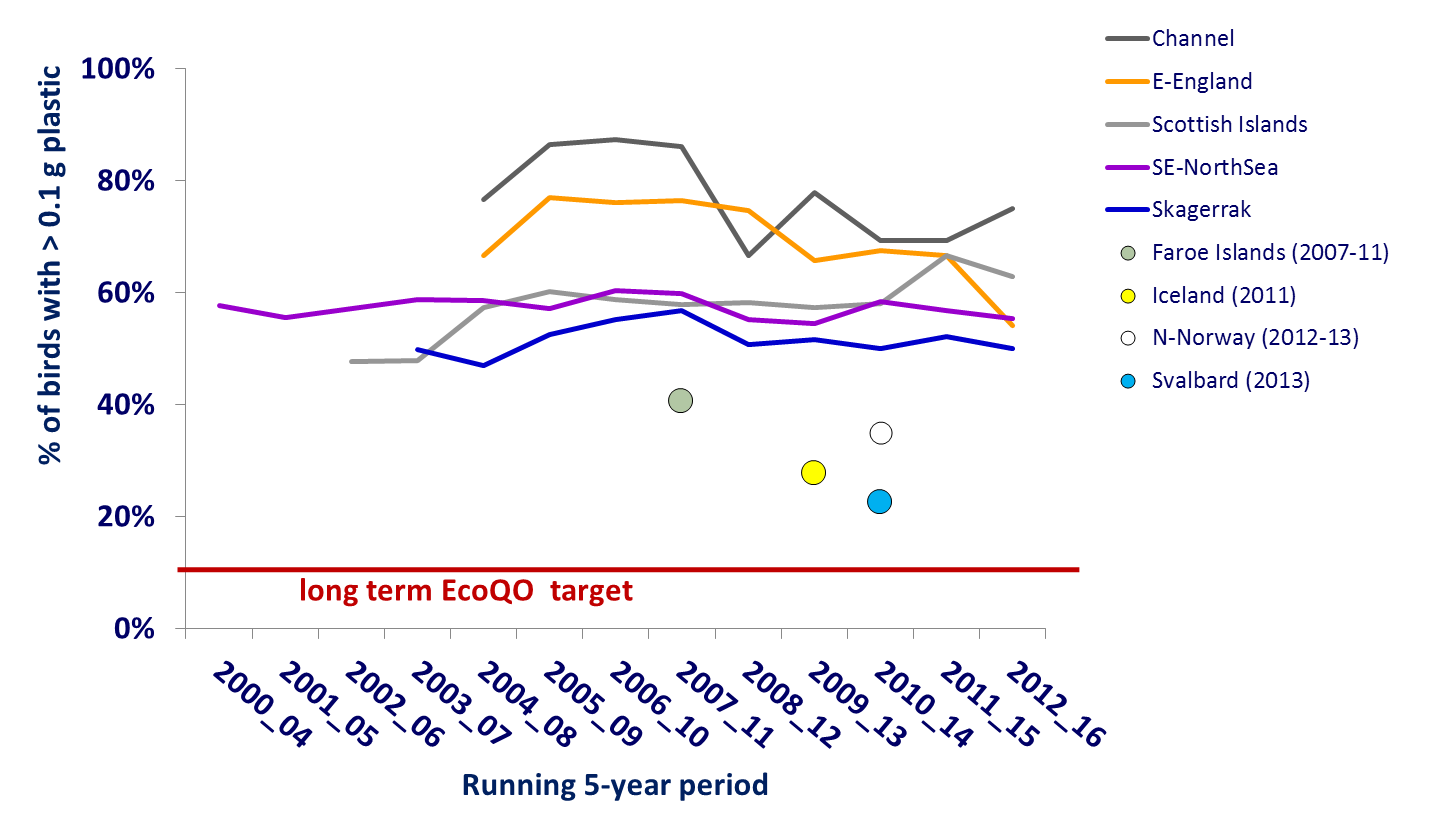
Figure 2. Running 5-year averages for the percentage of fulmars having more than 0.1g of plastic in the stomach since the year 2000 and / or the start of sub-regional participation in the monitoring program.
Incidental data published for Faroe Islands, Iceland, North Norway and Svalbard have been inserted to illustrate lower levels of ingested plastic further north in the OSPAR area, but all still well above the OSPAR long-term goal. Please note that this graph is just a visual aid, and not a statistical analysis.
There is high confidence in both the methodology and data availability.
Within the North Sea an earlier tendency of decreasing levels of ingested plastics in fulmar stomachs when going from south (Channel sub-region) to north has not proven to be consistent. Along the eastern board the pattern persisted with decreasing plastic levels from Channel to Skagerrak. However, along the western board, increased levels of plastic in fulmars from the Scottish Islands showed an opposite pattern. An explanation for the increased level of plastic ingestion in the Scottish Islands is currently lacking. Over the larger scale of the northeast Atlantic, the pattern is consistent, with significant lower plastic abundance on Faroe Islands, Iceland, northern Norway and Svalbard than in the North Sea (Figure c and Table a).
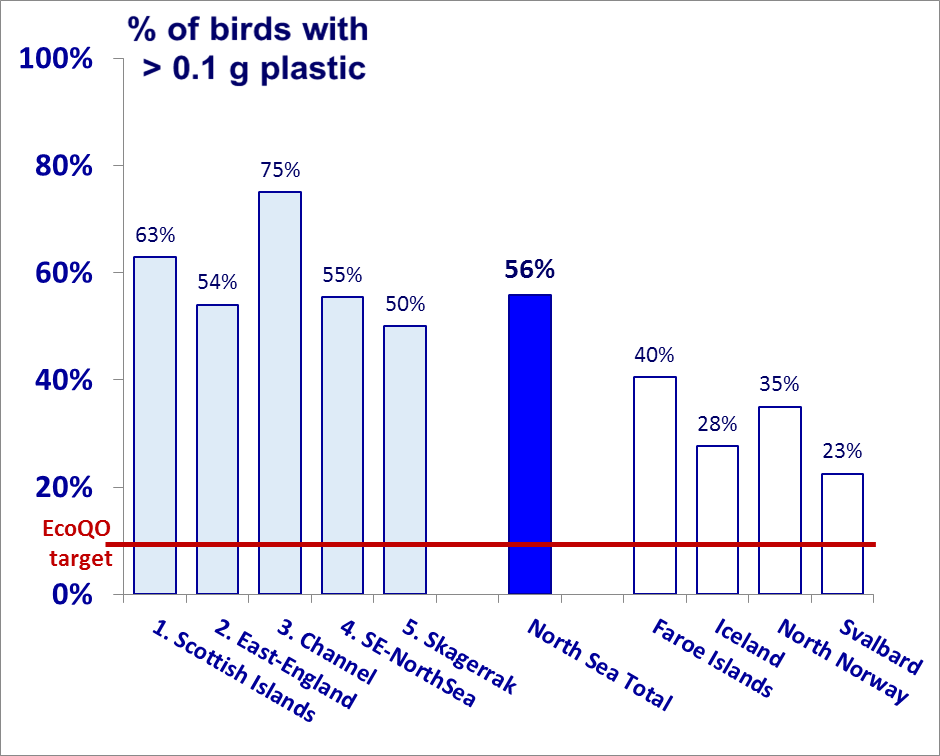
Figure c. Proportions of fulmars having more than 0.1g plastic in the stomach (EcoQO performance) in different sub-regions of the North Sea (light blue bars) over the period between 2012 and 2016.
Details shown in Table a. The overall value for the North Sea (dark blue bar) is compared to more incidental data (white bars) published for OSPAR areas to the north of the North Sea: Faroe Islands (Van Franeker & the SNS Fulmar Study Group 2013), Iceland (Kühn & van Franeker 2012) , North Norway (Herzke et al. 2016) and Svalbard (Trevail et al. 2015) Please note that this graph is just a visual aid, and not a statistical analysis.
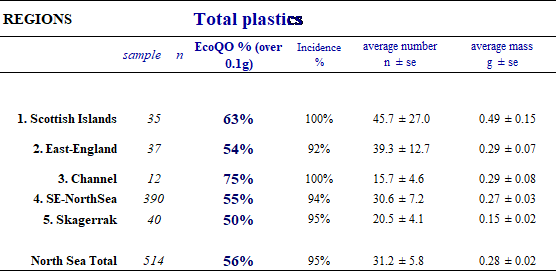
Table a. Plastic ingestion by fulmars in the Greater North Sea in the assessment period 2012-2016.

Table b. Linear regression analyses for time trends between 2007 and 2016 in plastic abundance in stomachs of fulmars in sub-regions assessed and in the total North Sea.
Analysis by linear regression, fitting ln-transformed litter mass values for individual birds on the year of collection. By standard, analyses are conducted over the most recent 10 years of data. The regression line is described by y = constant + slope*x in which y is the calculated value of the regression-line for year x. Negative values for slope and t-value indicate plastics decrease, but a trend is considered significant when the probability (p) of misjudgement of data is less than 5% (p<0.05).
Over the period of the first intermediate assessment (2005 to 2014) no significant increases or decreases in ingested plastic mass were observed in the North Sea as a whole or in any of the five sub-regions. However, now two years later, over the decade 2007-2016 the trend measured over the whole North Sea is that of a significant decline in ingested plastics (Table b). Regression lines showed negative slopes in 4 out of 5 subregions, nearly significant in East England and SE North Sea. The regression slope was positive in the Scottish Islands, suggesting increased plastic ingestion, but not at a statistically valid level. Similar results are found when running GLM tests for binomial proportions on the annual figures for EcoQO% over the 2007-2016 period. Those confirm significant decrease in ingested plastics for the combined North Sea (p=0.002). That analysis also indicates significant decrease in the fulmars from East England (p=0.011), negative slopes for Channel, SE North Sea and Kattegat, but positive slope for the Scottish Islands.
Trends over time differ between industrial plastic granules and consumer plastic waste. Industrial plastics are often referred to as ‘pre-production or resin pellets’, ‘nurdles’ or ‘mermaids tears’ and are the raw granular stock from which consumer objects are made by melting the granules, with additives giving the plastic its desired characteristics. Most industrial pellets are either cylindrical or spherical in shape, with diameter about 4mm to 5mm, and mass usually around 25mg per particle. Consumer plastics are often fragments of larger objects, the remains of consumer products discarded or lost to the environment. They range from parts of bottles to car-bumpers, and from fishing nets to plastic shopping bags or styrofoam packaging materials. See photo 2 for an illustration of both types of plastics recovered from a fulmar stomach.
In long term data for the Netherlands, industrial plastics were significantly reduced within one to two decades during 1980s and 1990s. That reduction was counteracted by increased consumer waste. These important and rapid changes cannot be documented for the other sub-regions in the North Sea because data collection started only after the period of major changes. However, the early Dutch data have been supported by very similar results in various other seabird studies around the world, as has been detailed in Van Franeker & Law (2015). The rapid reduction in industrial plastic granules was not only seen in source areas such as the North Sea, but was followed by similar reductions in densities of industrial plastic granules in the large oceanic gyres. Rapid reductions were probably achieved because the industrial pellets represent raw feedstock with economic value. Considerable publicity in the 1970s and 1980s on losses of industrial pellets to the marine environment (Colton et al. 1974; Wong et al. 1974; Gregory 1978; Shiber 1979; Morris 1980; Shiber 1982) and their ingestion by a wide range of marine wildlife (e.g. Bourne and Imber 1982; Connors and Smith 1982; Day et al. 1985; Van Franeker 1985) have led to measures reducing losses around factories, processing plants and during transport. Although no published information on dedicated measures by industry or transport sectors is known from the 1980’s, industrial concern was flagged in 1991 by the dedicated Ocean Clean Sweep campaign (U.S. EPA 1993). Because of these early changes, it is important to continue to make a distinction in monitoring of industrial as opposed to consumer plastics, as they have provided evidence that rapid improvements in environmental quality are a realistic possibility if input of debris is effectively reduced.
Currently (Table c), industrial plastic granules are found in 58% of fulmar stomachs from the North Sea, with an average number of 2.4 granules and mass of 0.05g. This is less than half the quantity observed in the 1980s. User plastic particles occur in 94% of the birds and average at a number of 28.8 particles and mass of 0.23g.
Although the rapid early decrease in industrial plastic granules in the North Sea was not continued at the same rate into the 2000s, a further reduction at a slow rate is emerging. No strong patterns are visually evident in Figure d and no significant changes were identified in the first assessment over the period 2005-2014. However, over the 2007-2016 decade, as measured over the whole of the North Sea, Table d provides evidence for slow but statistical significant declines in ingested mass of both industrial (p=0.008) and user plastics (P<0.001). For separate subregions, the test are sometimes also statistically significant and illustrated for the total North Sea in Figure e.
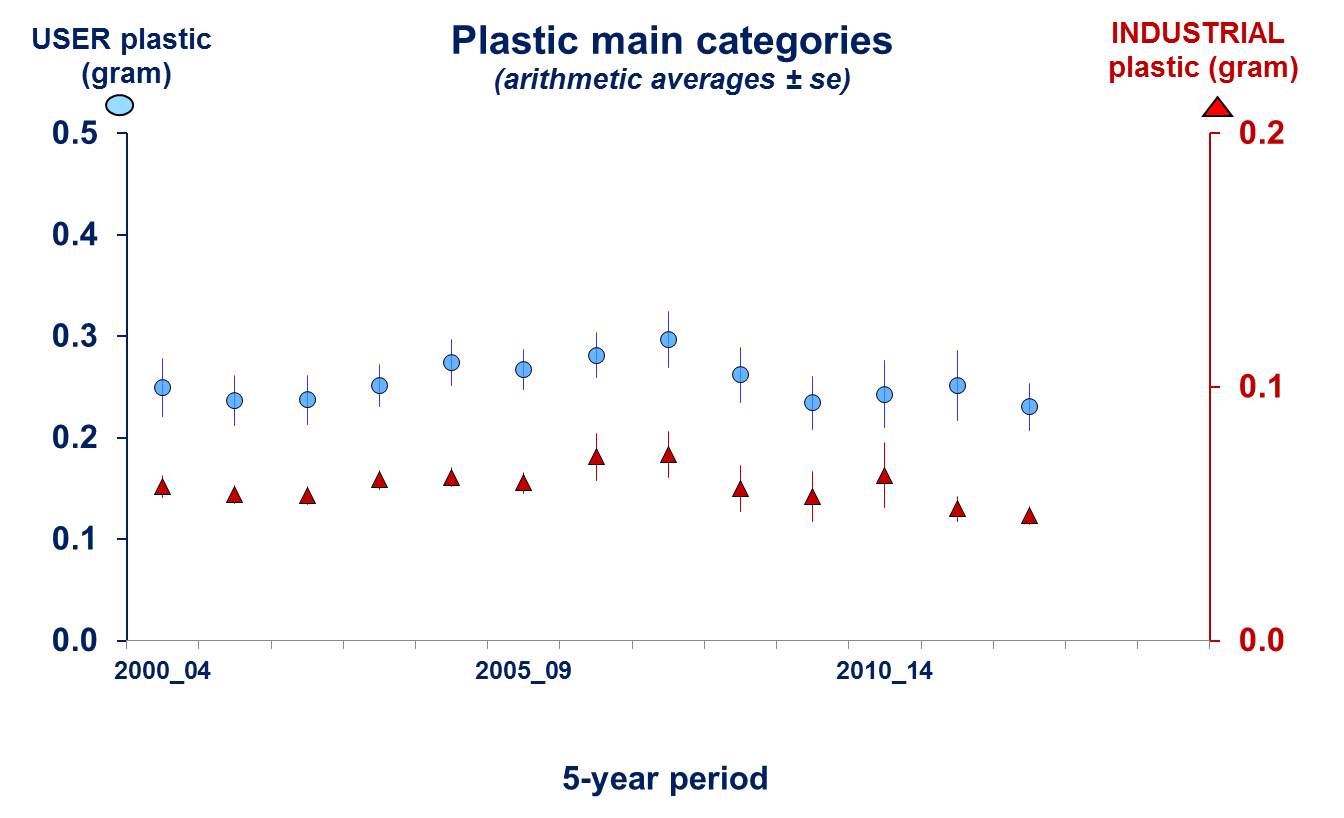
Figure d. Plastic mass in stomachs of fulmars in the North Sea (all five sub-regions combined) since the year 2000, for separate consumer plastics (blue circles, left y-axis) and industrial plastic (red triangles, right y-axis).
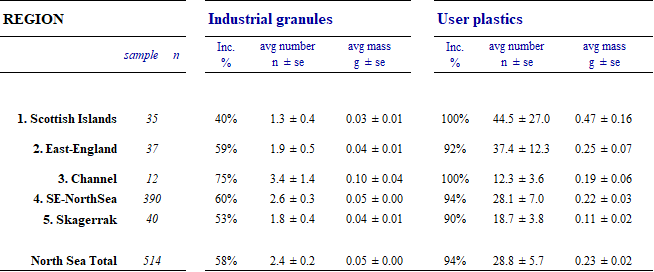
Table c. Details of plastic ingestion for industrial and consumer categories by fulmars in the Greater North Sea in the assessment period 2012-2016.
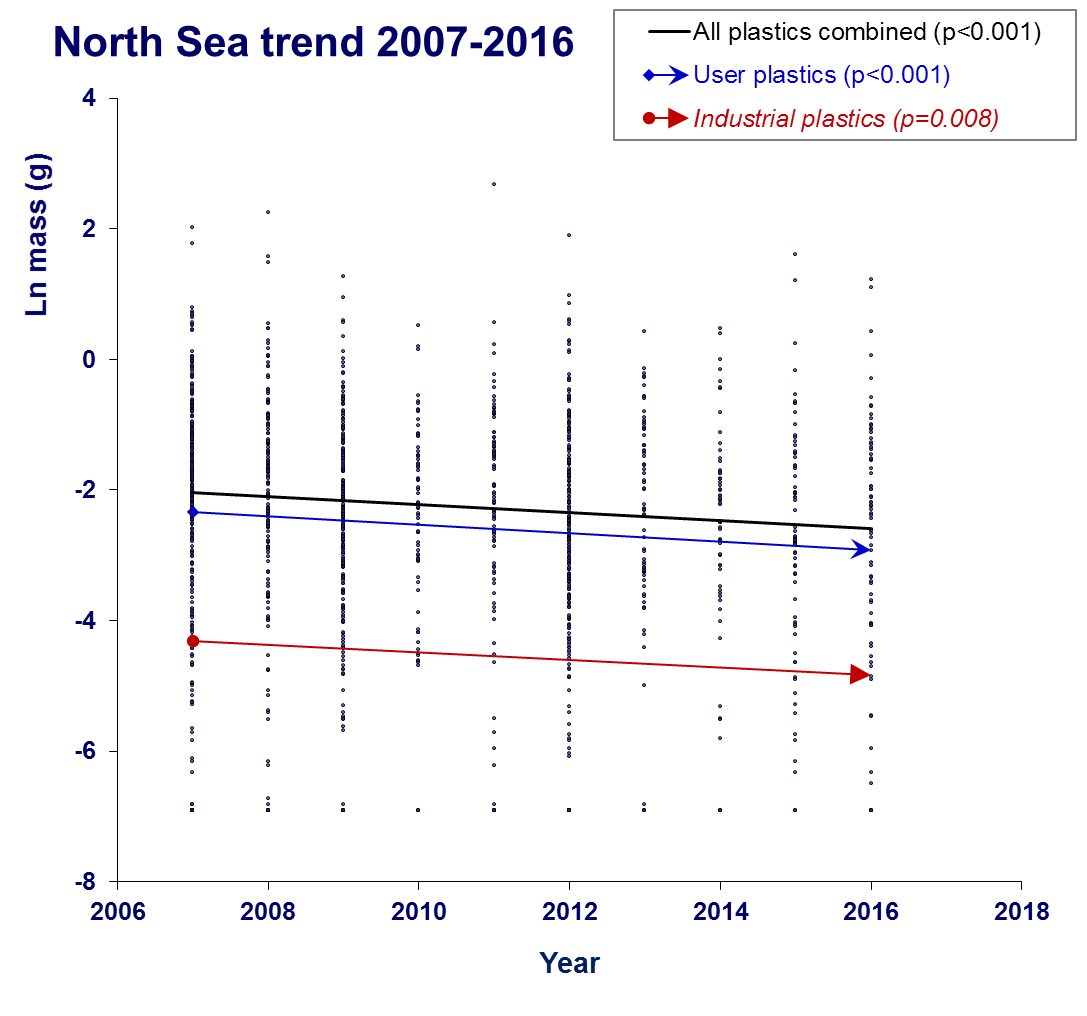
Figure e. Trends in plastic mass in stomachs of fulmars in the North Sea over the most recent ten year period (2007-2016).
Graphs show ln transformed mass data for industrial plastic and consumer plastic in stomachs of individual fulmars, plotted against year, and linear regression lines for industrial (lower, red line), consumer (middle blue line) and total plastics (top black line). Trendlines are drawn as continuous lines when the regression is significant, and as dashed lines when a regression was not significant (n.s.) For a more simple expression of changes over time, see Figure a.B with five year running averages of mass for the two main categories of plastic.
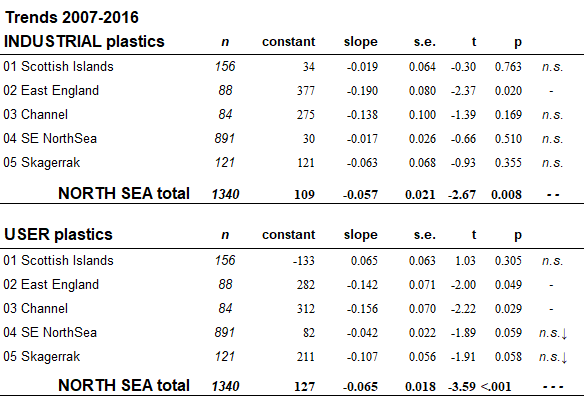
Table d. Linear regression analyses for time related trends between 2007 and 2016 in industrial and consumer plastic abundance in stomachs of fulmars in the EcoQO subregions and in the total North Sea.
Conclusion
This assessment shows that the OSPAR long term goal of less than 10% of northern fulmars exceeding 0.1g of plastic in their stomachs, was not reached in the North Sea. During the 2012-2016 period, 95% of North Sea fulmars had some plastic in the stomach, with 56% exceeding the 0.1g level. On average each fulmar contained 31 plastic particles weighing 0.28g. Over the past 10 years there has been a significant reduction in the mass of plastic in fulmar stomachs and in the annual frequency of stomachs with more than 0.1g of plastic. In the 2007-2011 period preceding the current assessment, 63% of fulmars exceeded the 0.1g level of plastic, with an average of 0.37g per bird. The conclusion is that we appear to move in the direction of less plastics in the North Sea marine environment, but that we are still far above the OSPAR long term ecological target. The North Sea fulmar populations has suffered substantial decline over the past decades. Although evidence for the causes of decline is not available, the ingestion of plastic litter is considered a potential contributing factor, because sub-lethal effects of reduced body condition and health affect almost all individuals in the population. Measures in the OSPAR Regional Action Plan aim to reduce litter and are expected to lead to a reduction of litter ingested.
Responsiveness of the indicator
Since the early 2000s, plastic ingestion levels by fulmars in the North Sea appeared to stabilise around a level of roughly 60% of individuals exceeding the 0.1g critical level of plastic ingestion that is used in the OSPAR long term goal definition. Only recently it has become clear that the ingestion of plastics in very slowly reducing. When considering the growth in marine activity and the increasing proportion of plastics in wastes, these observations should be viewed positively. Fulmars in the North Sea currently have an average of about 31 plastic particles in the stomach with a combined mass of 0.28g. However, less than one out of ten fulmars has no plastic in the stomach at the moment of death, so sub-lethal impacts may affect virtually the whole population. About 20% of plastic mass is industrial plastic pellets, the remainder being consumer plastic waste. In the early 1980’s that ratio was about fifty-fifty, so plastic composition has undergone a substantial change, even if total mass of plastic in stomachs has not dramatically changed compared to the 1980s. The early rapid changes in different subcategories of plastic are important to emphasize, as they provide evidence that effective measures to reduce loss of plastics to the marine environment have a rapid effect, not only close to the source as evidenced by fulmars in the North Sea, but also in the main oceanic gyres at great distance from sources (Van Franeker & Law 2015).
Validity of the OSPAR long term goal
The OSPAR long term goal of no more than 10% of fulmars exceeding the 0.1g of plastic in the stomach could be seen as a global background level because this level currently does exist in relatively clean arctic marine environments such as the Canadian Arctic (Van Franeker et al. 2011; Kühn & Van Franeker 2012, compiled from Mallory et al. 2006, Mallory 2008 and Provencher et al. 2009 with additional information from the authors; Poon et al. 2017). Pessimistically seen, this global background level can only change on the long term, however the results by Van Franeker & Law (2015) indicated that even the global levels could change relatively fast if input of new debris is effectively stopped.
Harm to biota
The 0.1 gram level of plastic mass in the stomach, in combination with a percentage of fulmars not allowed to exceed that level is not based on a quantitative assessment of harm to fulmars. Without doubt, individual fulmars and other wildlife can die and suffer severely from the ingestion of excessive quantities of plastic. But such effects are hard to quantify in terms of reductions in populations or species. However, in that sense, the sub-lethal effects of many individuals may have population effects, even if they are difficult to quantify for fulmars, as well as for other species in the ecosystem. Further research to document such individual effects are therefore warranted.
Descriptor 10 of the European Marine Strategy Directive states that levels of marine litter should ‘not cause harm’ to the marine and coastal environment. The concept of ‘harm’ to wildlife is a very complicated concept, which in spite of various dedicated publications (Rochman et al. 2016; Browne et al. 2015; Werner et al. 2016) cannot be unambiguously defined. Some will define individual suffering or death of animals as evident harm, where others interpret it that ‘large numbers’ of individuals must suffer or die, or even more extreme that populations must be in serious decline before being harmed, including the firm evidence that it is specifically marine litter that causes such decline.
By principle one should oppose the idea that an indicator species in the MSFD should be in decline before it gives evidence of harm. Species are chosen as useful indicators because of their abundance, which usually also means they are ‘strong’ species. Other more vulnerable and/or threatened (e.g. IUCN red-listed) species may become threatened to extinction because of marine litter even in a situation that the indicator species such as the fulmar is still abundant.
However it is of use to mention that the fulmar population after two centuries of growth is not doing well in recent years. In Europe, the population of fulmars is estimated to have declined by more than 40% since about the mid-1980s. Within the EU, the population status is considered as being of status ‘Threatened’. In most other, more distant areas, population trends are poorly known (Birdlife International 2015). Conservation actions proposed in the BirdLife population assessment are identification and protection of important sites at sea, as well as for prey species and continued monitoring of marine litter ingestion, and increased efforts for the removal of plastic from oceans (Birdlife International 2015, 2017). Although hard evidence for cause(s) of decline is impossible to obtain, the ingestion of plastic debris is thus considered a potential contributing threat to the fulmar population that needs to be addressed. It is also important to bear in mind that the fulmar is a single indicator species. To understand the full extent of the problem in a wider context further development of other indicator species will be necessary. For more information on harm, please see Werner et al. (2016).
Measures
Globally, it has been estimated that 80% of marine plastic debris originates from land (Faris & Hart 1994). Indeed, huge masses of plastics are estimated to enter the sea from land based sources (Jambeck et al. 2015) but proper estimates for sea based litter are lacking. In the North Sea, at least for macro-debris on beaches, sea based sources (shipping, fisheries, aquaculture, offshore industry) are thought to be a dominant source (van Franeker 2005; Fleet et al. 2009). Similar results have been found in the Ocean Cleanup surveys in the Great Pacific Garbage Patch, where sea-based sources dominated mass of plastics, e.g. over 52% of mass were ropes and nets, and much fisheries related items were in other categories. Sources of smaller marine plastic debris in the North Sea are less clear. It is to be expected that all (collective) measures in the OSPAR Regional Action Plan will contribute to a reduction of floating litter and thus to a reduction of debris ingested by fulmars.
Knowledge Gaps
The OSPAR Common Indicator on Plastic Particles in Fulmar Stomachs intends to reflect litter floating at the surface, and potential harm from marine litter in the environment to pelagic (open sea) marine organisms. However, the fulmar monitoring effort does not give direct information on ‘harm’ or ‘damage’ but simply quantifies spatial and temporal patterns in abundance of plastics in fulmar stomachs as an indirect measure of harm. Dedicated experimental laboratory research into evidence of harm to fulmars from specified levels and types of plastics, as a specific example of harm, is urgently needed to strengthen the role of the OSPAR Common Indicator.
Arthur, C., Baker, J., Bamford, H. (eds), 2009. Proceedings of the International Research Workshop on the Occurrence, Effects and Fate of Microplastic Marine Debris. Sep 9-11, 2008. NOAA Technical Memorandum NOS-OR&R-30. NOAA Silver Spring 530pp.
Avery-Gomm, S., O'Hara, P.D., Kleine, L., Bowes, V., Wilson, L.K., Barry, K.L., 2012. Northern fulmars as biological monitors of trends of plastic pollution in the eastern North Pacific. Marine Pollution Bulletin 64: 1776-1781.
Avery-Gomm, S., Provencher, J.F., Liboiron, M., Poon, F.E., Smith, P.A., 2018. Plastic pollution in the Labrador Sea: An assessment using the seabird northern fulmar Fulmarus glacialis as a biological monitoring species. Marine Pollution Bulletin 127: 817-822. https://doi.org/10.1016/j.marpolbul.2017.10.001
BirdLife International, 2015. European Red List of Birds. Office for Official Publications of the European Communities. Luxembourg. http://www.birdlife.org/datazone/info/euroredlist downloaded 26-Feb-2016.
BirdLife International, 2017. Fulmarus glacialis. The IUCN Red List of Threatened Species. http://dx.doi.org/10.2305/IUCN.UK.2017-1.RLTS.T22697866A110669972.en .
Bond, A.L., Provencher, J.F., Daoust, P.-Y., Lucas, Z.N., 2014. Plastic ingestion by fulmars and shearwaters at Sable Island, Nova Scotia, Canada. Marine Pollution Bulletin 87: 68-75
Bourne, W.R.P., Imber, M.J., 1982. Plastic Pellets Collected by a Prion on Gough Island, Central South Atlantic Ocean. Marine Pollution Bulletin 13: 20-21.
Bravo Rebolledo, E., 2011. Threshold levels and size dependent passage of plastic litter in stomachs of Fulmars. MSc Thesis. Wageningen University, Aquatic Ecology and Water Quality Management group Report no. 008/2011. 32pp.
Brown, L.D., Cai, T.T., DasGupta, A., 2001. Interval estimation for a binomial proportion. Statistical Science 16: 101-133.
Browne, M.A., Underwood, A.J., Chapman, M.G., Williams, R., Thompson, R.C., Van Franeker, J.A., 2015. Linking effects of anthropogenic debris to ecological impacts. Proceedings Royal Society B 282: 20142929 (11pp).
Colton, J.B. Jr, Knapp, F.D., Burns, B.R., 1974. Plastic particles in surface waters of the northwestern Atlantic. Science 185(4150): 491-497.
Connors, P.G., Smith, K.G., 1982. Oceanic Plastic Particle Pollution: Suspected Effect on Fat Deposition in Red Phalaropes. Marine Pollution Bulletin 13: 18-20.
Day, R.H., Wehle, D.H.S., Coleman, F.C., 1985. Ingestion of plastic pollutants by marine birds. In: R.S. Shomura and H.O. Yoshida (Eds.), Proceedings of the workshop on the fate and impact of Marine debris, 26-29 November 1984, Honolulu, Hawaii. U.S. Dep. Commerce, NOAA Tech. Memo. NMFS, NOAA-TM-NMFS-SWFC-54. pp. 344-386.
Donnelly-Greenan, E.L., Harvey, J.T., Nevins, H.M., Hester, M.M., Walker, W.A., 2014. Prey and plastic ingestion of Pacific Northern Fulmars (Fulmarus glacialis rodgersii) from Monterey Bay, California. Marine Pollution Bulletin 85: 214-224. http://dx.doi.org/10.1016/j.marpolbul.2014.05.046.
EC, 2000. Directive 2000/59/EC of the European Parliament and of the Council of 27 November 2000 on port reception facilities for ship-generated waste and cargo residues. Official Journal of the European Communities L 332: 81-90 (28 Dec 2000).
EC, 2008. Directive 2008/56/EC of the European Parliament and of the Council of 17 June 2008 establishing a framework for community action in the field of marine environmental policy (Marine Strategy Framework Directive). Official Journal of the European Union L 164: 19-40 (25 Jun 2008).
EC, 2010. Commission Decision of 1 September 2010 on criteria and methodological standards on Good Environmental Status of marine waters (notified under document C (2010) 5956) (Text with EEA Relevance) (2010/477/EU). Official Journal of the European Union L232:14-24.
EC, 2017. Commission Decision (EU) 2017/848 of 17 May 2017 laying down criteria and methodological standards on good environmental status of marine waters and specifications and standardised methods for monitoring and assessment, and repealing Decision 2010/477/EU. Official Journal of the European Union L125: 43-74 (18 May 2017) https://publications.europa.eu/en/publication-detail/-/publication/a7523a58-3b91-11e7-a08e-01aa75ed71a1/language-en .
Fleet, D., Van Franeker, J., Dagevos, J., Hougee, M., 2009. Marine Litter. Thematic Report No. 3.8. in: Marencic, H., de Vlas, J. (Eds), 2009. Quality Status Report 2009. Wadden Sea Ecosystem No. 25. Common Wadden Sea Secretariat, Trilateral Monitoring and Assessment Group, Wilhelmshaven, Germany, 11pp.
Galgani, F., Fleet, D., van Franeker, J., Katsanevakis, S., Mouat, J., Oosterbaan, L., Poitou, I., Hanke, G., Thompson, R., Amato, E., Birkun, A., Janssen, C., 2010. Properties and quantities of marine litter do not cause harm to the coastal and marine environment. Report on the identification of descriptors for the Good Environmental Status of European Seas regarding marine litter under the Marine Strategy Framework Directive. MSFD GES Task Group 10, final report 19/04/2010, 50 pp.
Gregory, M.R., 1978. Accumulation and distribution of virgin plastic granules on New Zealand beaches. New Zealand Journal of Marine and Freshwater Research 12: 399-414.
Herzke, D., Anker-Nilssen, T., Nøst, T.H., Götsch, A., Christensen-Dalsgaard, S., Langset, M., Fangel, K., Koelmans, A.A., 2016. Negligible impact of ingested microplastics on tissue concentrations of persistent organic pollutants in Northern fulmars off the Norwegian coast. Environmental Science & Technology 50: 1924-1933.
Jambeck, J.R., Geyer, R., Wilcox, C., Siegler, T.R., Perryman, M., Andrady, A., Narayan, R., Law, K.L., 2015. Plastic waste inputs from land into the ocean. Science 347(6223): 768-771.
Kühn, S., Bravo Rebolledo, E.L., Van Franeker, J.A., 2015. Deleterious effects of litter on marine life. pp 75-116 In: Bergmann, M., Gutow, L., and Klages, M. (eds). Marine Anthropogenic Litter. Springer, Berlin.
Kühn, S., Van Franeker, J.A., 2012. Plastic ingestion by the Northern Fulmar (Fulmarus glacialis) in Iceland. Marine Pollution Bulletin 64: 1252-1254. http://dx.doi.org/10.1016/j.marpolbul.2012.02.027
Lebreton, L., Slat, B., Ferrari, F., Sainte-Rose, B., Aitken, J., Marthouse, R., Hajbane, S.: Cunsolo, S., Schwarz A., Levivier, A.,Noble, K.Debeljak, P., Maral, H., Schoeneich-Argent, R., Brambini, R., Reisser, J., 2018. Evidence that the Great Pacific Garbage Patch is rapidly accumulating plastic. Scientific Reports 8: 4666. https://doi.org/10.1038/s41598-018-22939-w.
Mallory, M.L., 2008. Marine plastic debris in northern fulmars from the Canadian High Arctic. Marine Pollution Bulletin 56: 1486-1512. https://doi.org/10.1016/j.marpolbul.2008.04.017
Mallory, M.L., Roberston, G.J., Moenting, A., 2006. Marine plastic debris in northern fulmars from Davis Strait, Nunavut, Canada. Marine Pollution Bulletin 52: 813-815.
Morris, R.J., 1980. Plastic debris in the surface waters of the South Atlantic. Marine Pollution Bulletin 11: 164-166.
MSFD-TSGML, 2011. Marine Litter - Technical recommendations for the implementation of MSFD requirements. Joint Research Centre - Institute for Environment and Sustainability Report EU 25009 EN. Publications Office of the EU, Luxembourg, 91pp. doi: 10.2788/91406
Nevins, H., Donnelly, E., Hester, M., Hyrenbach, D., 2011. Evidence for Increasing Plastic Ingestion in Northern Fulmars (Fulmarus glacialis rodgersii) in the Pacific. Fifth International Marine Debris Conference, Honolulu Hawaii 20-25 Mar 2011. Oral Presentation Extended Abstracts 4.b.3. 140-144.
OSPAR, 2008. Background Document for the EcoQO on plastic particles in stomachs of seabirds. OSPAR Commission, Biodiversity Series Publication Number: 355/2008. OSPAR, London, 18pp.
OSPAR, 2009. EcoQO Handbook - Handbook for the application of Ecological Quality Objectives in the North Sea. Second Edition - 2009. OSPAR Biodiversity Series Publication 307/2009. OSPAR Commission London, 65pp.
OSPAR, 2010a. Quality Status Report 2010. OSPAR Commission, London. 175pp.
OSPAR, 2010b. The OSPAR system of Ecological Quality Objectives for the North Sea: a contribution to OSPAR's Quality Status Report 2010. OSPAR Publication 404/2009. OSPAR Commission London and Rijkswaterstaat VenW, Rijswijk. 16pp. (Update 2010).
OSPAR, 2014a. Regional Action Plan for Prevention and Management of Marine Litter in the North-East Atlantic. OSPAR Agreement 2014-1.
OSPAR, 2014b. Litter in the Marine Environment - Plastic Particles in Fulmar Stomachs - 2014. OSPAR, EIHA14/AS02. OSPAR, London, 2pp.
OSPAR, 2015a. Explanatory note for the data reporting format for the OSPAR common indicator on plastic particles in fulmars' stomachs. OSPAR Commission Agreement 2015-09ef 2pp.
OSPAR, 2015b. Guidelines for Monitoring of plastic particles in stomachs of fulmars in the North Sea area. OSPAR Commission Agreement 2015-03e (Source: EIHA 15/5/12 Add.1). 26pp.
OSPAR-ICG-MAQ, 2015a. Nested system of geographic reporting units. Intersessional correspondence group to manage preparation and publication of the Intermediate Assessment 2017 and the QSR21 (ICG MAQ) Document ICG MAQ(3) 15/02/01rev.01. OSPAR, London, 14pp.
OSPAR-ICG-MAQ, 2015b. Assessment sheet structure and associated metadata and information. Intersessional correspondence group to manage preparation and publication of the Intermediate Assessment 2017 and the QSR21 (ICG MAQ)
OSPAR, 2017. OSPAR Intermediate Assessment 2017. Plastic Particles in Fulmar Stomachs in the North Sea. OSPAR Assessment Portal OAP online document: https://oap.ospar.org/en/ospar-assessments/intermediate-assessment-2017/pressures-human-activities/marine-litter/plastic-particles-fulmar-stomachs-north-sea/
Poon, F.E., Provencher, J.F., Mallory, M.L., Braune, B.M., Smith, P.A., 2017. Levels of ingested debris vary across species in Canadian Arctic seabirds. Marine Pollution Bulletin 116: 517-520. http://dx.doi.org/10.1016/j.marpolbul.2016.11.051
Provencher, J.F., Gaston, A.J., Mallory, M.L., 2009. Evidence for increased ingestion of plastics by northern fulmars (Fulmarus glacialis) in the Canadian Arctic. Marine Pollution Bulletin 58: 1092-1095.
Provencher, J.F., Gaston, A.J., Mallory, M.L., 2009. Evidence for increased ingestion of plastics by northern fulmars (Fulmarus glacialis) in the Canadian Arctic. Marine Pollution Bulletin 58: 1092-1095.
Rochman, C.M., Browne, M.A., Underwood, A.J., Van Franeker, J.A., Thompson, R.C., Amaral-Zettler, L., 2016. The ecological impacts of marine debris: unravelling the demonstrated evidence from what is perceived. Ecology 97: 302–312.
Shiber, J.G., 1979. Plastic pellets on the coast of Lebanon. Marine Pollution Bulletin 10: 28.
Shiber, J.G., 1982. Plastic Pellets on Spain's 'Costa del Sol' Beaches. Marine Pollution Bulletin 13: 409-412.
Terepocki, A.K., Brush, A.T., Kleine, L.U., Shugart, G.W., Hodum, P., 2017. Size and dynamics of microplastic in gastrointestinal tracts of Northern Fulmars (Fulmarus glacialis) and Sooty Shearwaters (Ardenna grisea). Marine Pollution Bulletin 116: 143-150. https://doi.org/10.1016/j.marpolbul.2016.12.064
Trevail, A.M., Gabrielsen, G.W., Kühn, S., Van Franeker, J.A., 2015. Elevated levels of ingested plastic in a high Arctic seabird, the northern fulmar (Fulmarus glacialis). Polar Biology 38: 975-981. http://dx.doi.org/10.1007/s00300-015-1657-4
U.S. EPA, 1993. Plastic pellets in the aquatic environment - sources and recommendations. A summary. United States Environmental Protection Agency EPA 842-S-93-001. http://water.epa.gov/type/oceb/marinedebris/upload/2009_11_23_oceans_debris_plasticpellets_plastic_pellets_summary.pdf.
Van Acoleyen, M., Laureysens, I., Lambert, S., Raport, L., Van Sluis, C., Kater, B., Van Onselen, E., Veiga, J., Ferreira, M., 2014. Marine Litter study to support the establishment of an initial quantitative headline reduction target - SFRA0025. Final Report to European Commission DG Environment Project number BE0113.000668. Arcadis, Brussels 315pp.
Van Franeker, J.A., 1985. Plastic ingestion in the North Atlantic Fulmar. Marine Pollution Bulletin 16: 367-369. https://doi.org/10.1016/0025-326X(85)90090-6
Van Franeker, J.A., Meijboom, A., 2002. Litter NSV - Marine litter monitoring by Northern Fulmars: a pilot study. ALTERRA-Rapport 401. Alterra, Wageningen, 72pp. http://edepot.wur.nl/45695
Van Franeker, J.A., 2005. Schoon strand Texel 2005: onderzoeksresultaten van de schoonmaakactie van het Texelse strand op 20 april 2005 . Alterra speciale uitgave 2005/09. Alterra, Texel. 23pp . http://edepot.wur.nl/19515
Van Franeker, J.A., Heubeck, M., Fairclough, K., Turner, D.M., Grantham, M., Stienen, E.W.M., Guse, N., Pedersen, J., Olsen, K.O., Andersson, P.J., Olsen, B., 2005. 'Save the North Sea' Fulmar Study 2002-2004: a regional pilot project for the Fulmar-Litter-EcoQO in the OSPAR area . Alterra-rapport 1162. Alterra, Wageningen. 70pp . http://edepot.wur.nl/35175
Van Franeker, J.A., Blaize, C., Danielsen, J., Fairclough, K., Gollan, J., Guse, N., Hansen, P.L. , Heubeck, M., Jensen, J.-K., Le Guillou, G., Olsen, B., Olsen, K.O., Pedersen, J., Stienen, E.W.M., Turner, D.M., 2011. Monitoring plastic ingestion by the northern fulmar Fulmarus glacialis in the North Sea. Environmental Pollution 159: 2609-2615.
Van Franeker, J.A., the SNS Fulmar Study Group, 2013. Fulmar Litter EcoQO monitoring along Dutch and North Sea coasts - Update 2010 and 2011. IMARES Report C076/13. IMARES, Texel. 61pp. http://edepot.wur.nl/258764
Van Franeker, J.A., Law, K.L., 2015. Seabirds, gyres and global trends in plastic pollution. Environmental Pollution 203: 89-96.
Van Franeker, J.A., Kühn, S., Meijboom, A., 2017. Fulmar Litter EcoQO monitoring in the Netherlands - Update 2016. Wageningen Marine Research report C053/17 & RWS Centrale Informatievoorziening BM 17.23 (WMR, Den Helder, 52pp). https://doi.org/10.18174/423968
VSN International, 2017. Genstat for Windows 19th Edition. VSN International, Hemel Hempstead, UK. https://www.vsni.co.uk/
Werner, S., Budziak, A., Van Franeker, J., Galgani, F., Maes, T., Matiddi, M., Nilsson, P., Oosterbaan, L., Priestland, E., Thompson, R.,
Veiga, J., Vlachogianni, T., 2016. Harm caused by marine litter. MSFD GES TG Marine Litter - Thematic Report. JRC Technical Report EUR 28317, Publications Office of the European Union, Luxembourg, 89pp. http://dx.doi.org/10.2788/19937
Wong, C.S., Green, D.R.,, Cretney, W.J., 1974. Quantitative tar and plastic waste distribution in the Pacific Ocean. Nature 247: 30-32.
| Sheet reference | . |
|---|---|
| Assessment type | Thematic Assessment |
| Context (1) | Biological Diversity and Ecosystems - Targeted actions for the protection and conservation of species, habitats and ecosystem processes |
| Context (2) | OSPAR-relevant Decision, Publication, Recommendation or Other Agreement. OSPAR Commission, Biodiversity Series 355/2008. Background Document for the EcoQO on plastic particles in stomachs of seabirds. OSPAR Biodiversity Series Publication 307/2009. EcoQO Handbook - Handbook for the application of Ecological Quality Objectives in the North Sea. Second Edition - 2009. . OSPAR Commission London, 65pp. http://www.ospar.org/v_publications/download.asp?v1=p00307. OSPAR Publication 404/2009. The OSPAR system of Ecological Quality Objectives for the North Sea: a contribution to OSPAR's Quality Status Report 2010. OSPAR-EIHA 14/5/8-E Assessment Sheet and Data Management for the Common indicator for plastic particles in seabirds stomachs (D10 in Fulmar). OSPAR, EIHA14/AS02. Litter in the Marine Environment - Plastic Particles in Fulmar Stomachs OSPAR Agreement 2014-1. Regional Action Plan for Prevention and Management of Marine Litter in the North-East Atlantic. OSPAR Agreement 2015-03e. Guidelines for Monitoring of plastic particles in stomachs of fulmars in the North Sea area. http://www.ospar.org/convention/agreements?q=fulmar OSPAR Agreement 2015-09ef. Explanatory note for the data reporting format for the OSPAR common indicator on plastic particles in fulmars' stomachs. |
| Context (3) | D10 - Marine Litter |
| Context (4) | D10.1 - Characteristics of litter in the marine and coastal environment, D10.2 - Impacts of litter on marine life |
| Point of contact | SNS Fulmar Study Group, Dr. J.A. van Franeker |
secretariat@ospar.org | |
| Metadata date | 2018-10-01 |
| Title | Monitoring of plastic particles in stomachs of fulmars in the North Sea area |
| Resource abstract | Plastic debris in stomachs of beached Northern fulmars is used to monitor abundance of man-made marine litter and provides a proxy of harm to wildlife. All OSPAR countries around the North Sea except Sweden participate in the fulmar monitoring program and submit data to OSPAR annually. |
| Linkage | http://www.ospar.org/convention/agreements?q=fulmar |
| Topic category | Environment |
| Indirect spatial reference | L1.2 |
| N Lat | 62.0000000002998 |
| E Lon | 13.0665752428532 |
| S Lat | 48.0001153807203 |
| W Lon | -5.00036207944635 |
| Countries | BE, DE, DK, FR, NL, NO, UK |
| Start date | 2000-01-01 |
| End date | 2016-12-31 |
| Conditions applying to access and use | http://www.ospar.org/site/assets/files/1215/ospar_data_conditions_of_use.pdf |
| Conditions applying to access and use | Major parts of data collection for this assessment have been a non-funded effort by volunteer groups as well as professionals. They kindly request that within 5 years of the End-date of the assessment, usage of raw data for formal reports and scientific articles is not done without consultation of the groups point of contact as given above. |
| Data Snapshot | https://odims.ospar.org/en/submissions/ospar_fulmar_ca_data_snapshot_2019_01/ |