

Production de jeunes phoques gris
D1 - Diversité Biologique
D1.3 - État des populations
Message clé:
Le nombre annuel de naissances de phoques gris dans la mer du Nord au sens large et dans des parties des mers Celtiques a nettement augmenté depuis 1992 et a continué à augmenter ces dernières années (2009–2014).
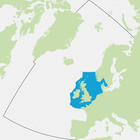
Area Assessed
Printable Summary
Contexte
Cet indicateur évalue les tendances du nombre de naissances de jeunes phoques gris dans les sites de reproduction de la mer du Nord au sens large et dans la partie des mers Celtiques dans les eaux britanniques. Les phoques gris se rassemblent pour se reproduire dans des colonies établies de longue date situées sur des îles, des bancs de sable et des lignes côtières continentales d’Europe.
Le phoque est un prédateur supérieur et peut être utilisé comme indicateur de l’état des écosystèmes marins. La production de jeunes phoques gris subit l’influence de nombreux facteurs, tels que les maladies, la concurrence avec d’autres espèces, les modifications de la répartition et de l’abondance des proies, les perturbations et les interactions avec la pêche. La chasse au phoque gris s’est poursuivie jusqu’au XXe siècle et il a donc totalement disparu de certaines zones mais il est désormais protégé dans la plupart des zones d’Europe.
La chasse au phoque, aussi bien illicite que licite, existe de longue date et il est impossible de connaître l’état normal, sans perturbation, ou la capacité de charge naturelle actuelle pouvant être obtenue de front avec la protection contre la chasse illicite. Aucun lien évident n’a encore été identifié, à l’exception de la chasse, entre la production de jeunes phoques et les activités humaines, bien que plusieurs activités humaines risquent, tout au moins en partie, de modifier la production de jeunes phoques. Si des modifications sont décelées, il faut en envisager la cause et déterminer si des mesures de gestion sont nécessaires.
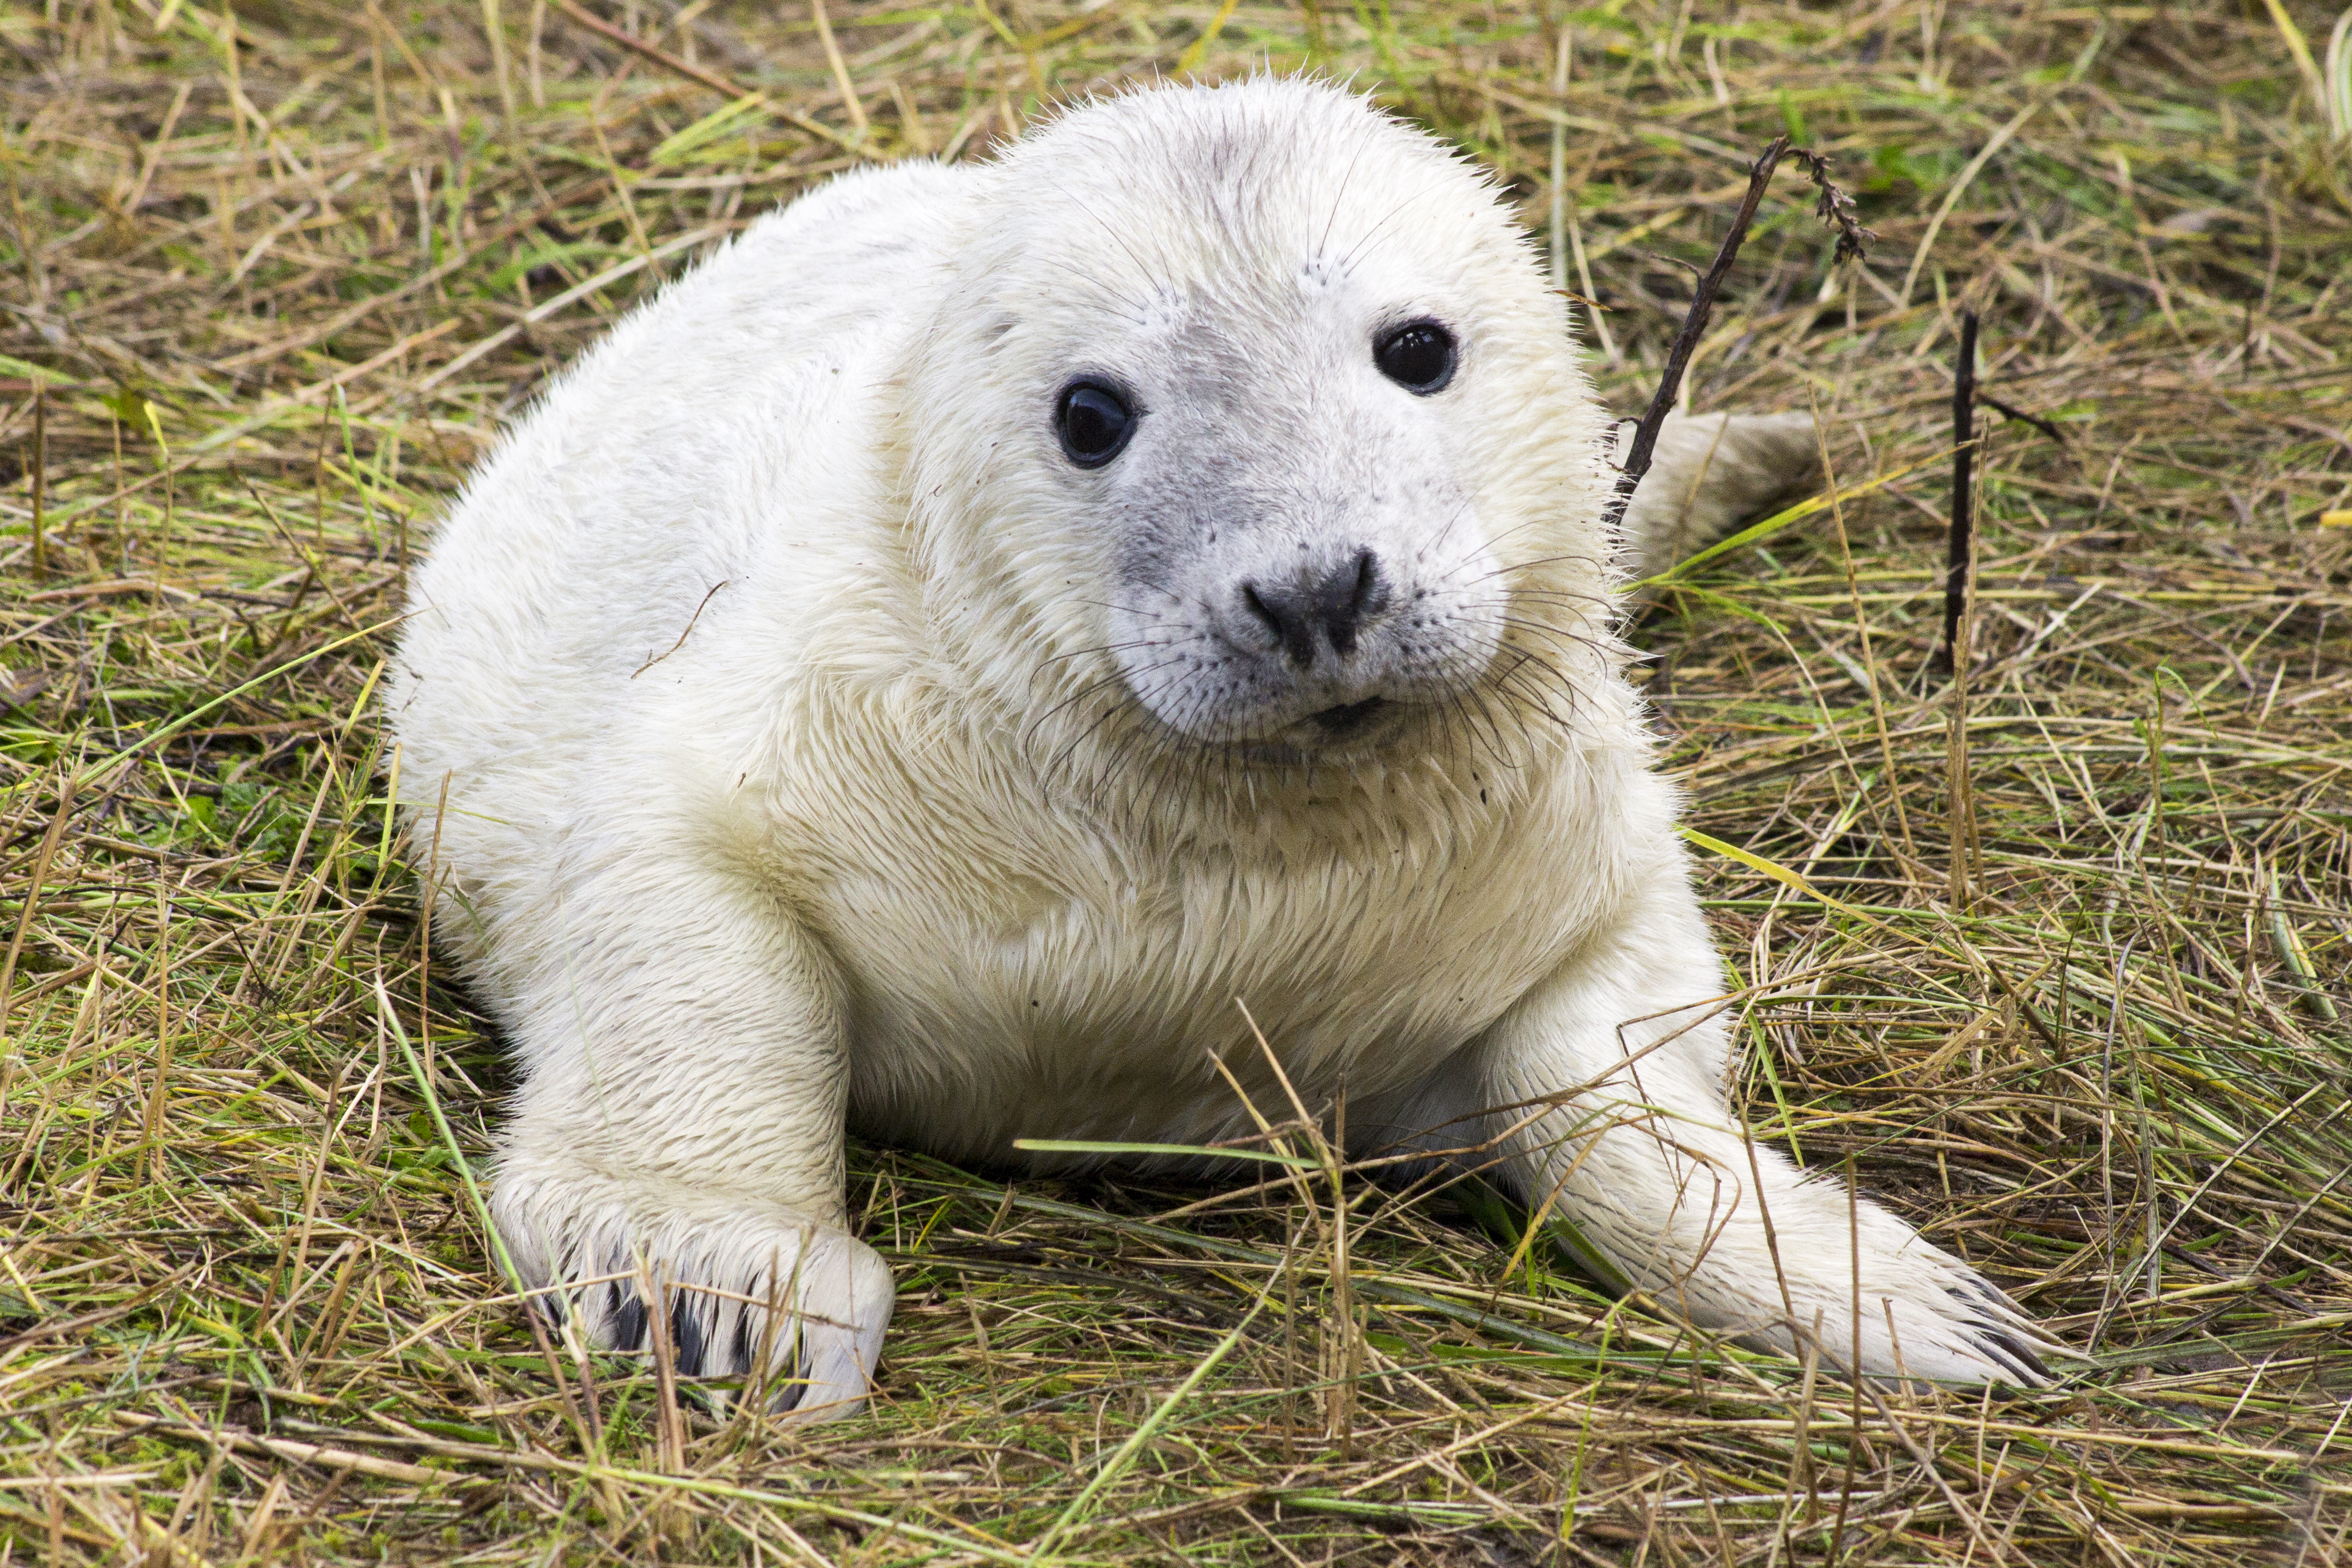
Jeune phoque gris de l’Atlantique (Halichoerus grypus) (avec la permission d’Arran Bee)
Grey seal pup production was assessed in the OSPAR Quality Status Report (QSR) 2010 by means of an OSPAR Ecological Quality Objective (EcoQO) in the Greater North Sea. The EcoQO for no decline of greater than 10% in grey seal pup production over a five-year running mean was assessed as met in all areas of the Greater North Sea with relevant populations and where data were reported.
The data used to construct this Indicator were also used in part, to estimate grey seal abundance for the Indicator on Seal Abundance and Distribution. As such, these two indicators are to some extent related.
Methods
Indicator metric and data collection
Grey seal (Halichoerus grypus) pups are counted at major breeding sites (‘colonies’) usually using aerial photography survey methods (Figure a); where these are not possible, ground counts or boat-based counts may be used instead (e.g. Stringell et al., 2014). Multiple counts per colony are generated, spread across the breeding season (September to February, depending on colony location).
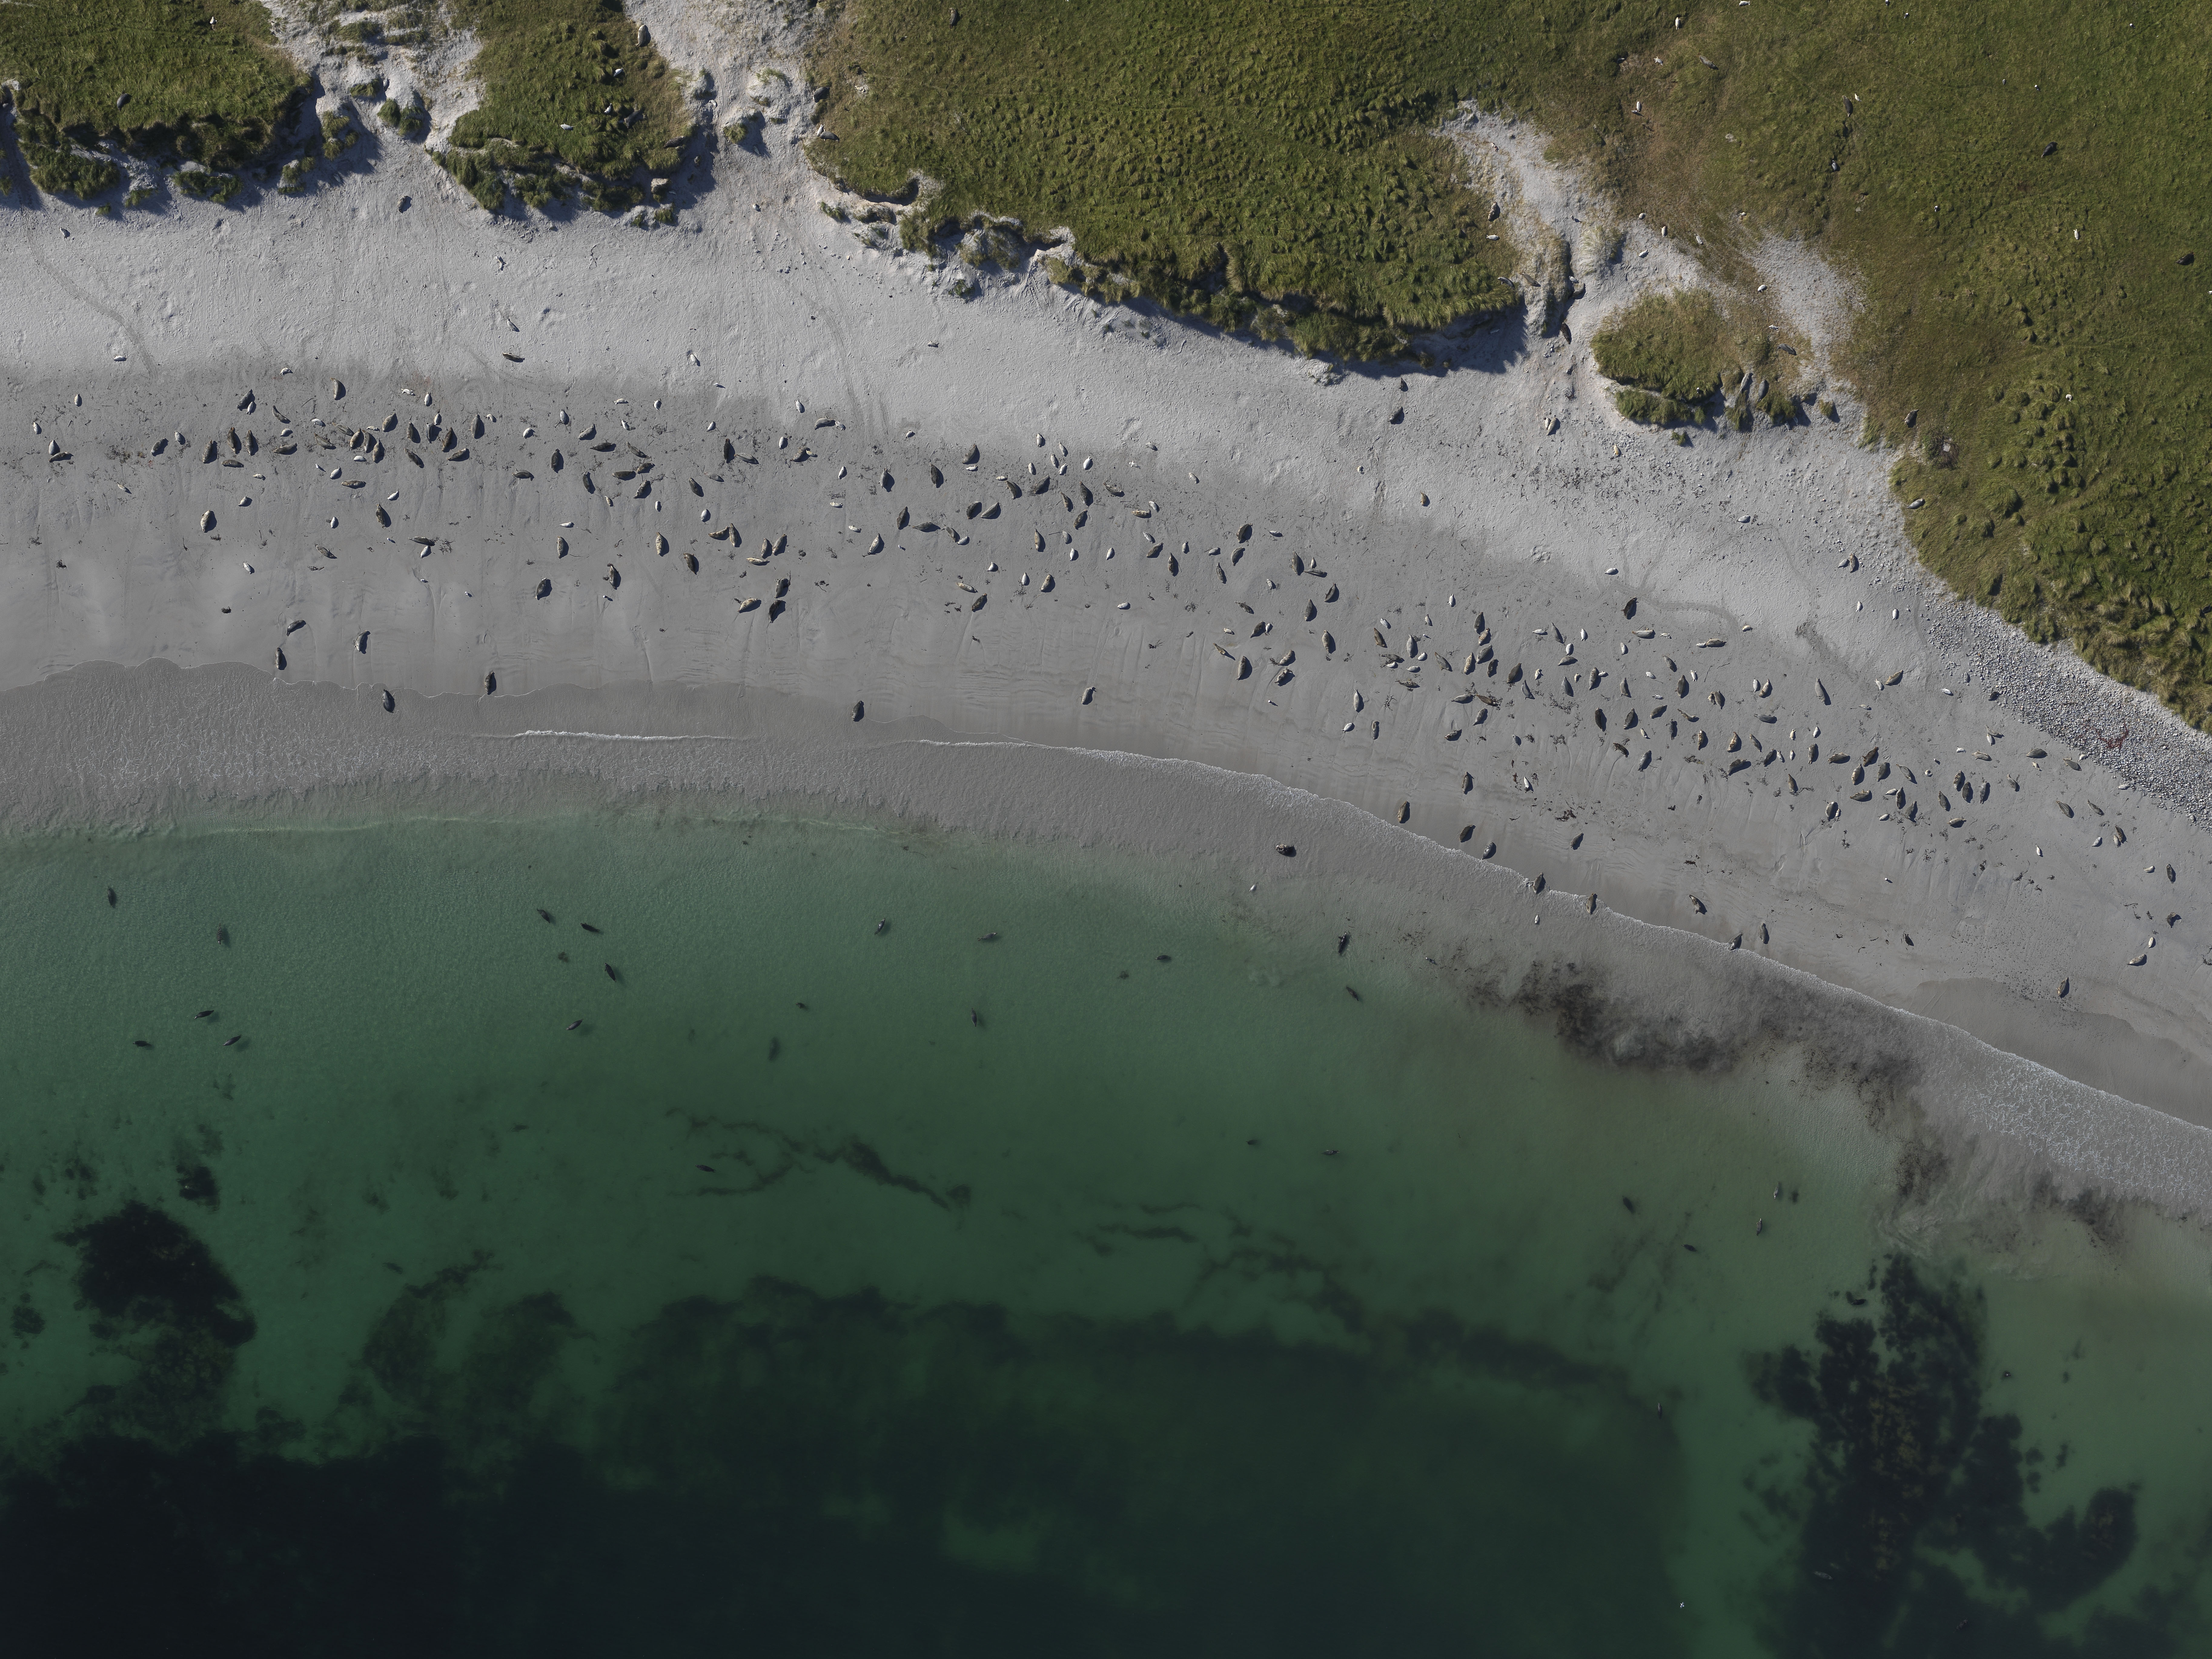
Figure a: Aerial survey image of grey seal colony (courtesy of Sea Mammal Research Unit)
Most Contracting Parties count pups several times during the pupping season and the maximum count is taken as a minimum estimate of ‘pup production’, that is, the total number of pups produced over the season as a whole. The maximum pup count will always under-estimate pup production because pups are born and leave the colony at different times. In the United Kingdom, pup counts are converted to total pup production at each colony. This is carried out using an established statistical model that describes how the number of pups at the site varies over the season (SCOS, 2014). Both types of estimate (i.e. maximum count and modelled pup production) are used in this assessment. From calculations across Scottish colonies, maximum pup counts represent 0.82 (95% confidence interval, 0.81–0.83) of total pup production. Hereafter, both types of estimate are referred to collectively as ‘pup production’.
The assessment in the Celtic Seas did not include Ireland because the density of Irish data available was not sufficient to enable a comprehensive assessment of change in abundance. In Ireland, the status of the grey seal is considered to be ‘Favourable’ given the current knowledge of population size, distribution, ecology and prevailing pressures on these species (NPWS, 2013).
Colony survey frequency varies by ‘Assessment Unit’ (AU) (Figure A) and ranges from annual to about five-yearly. Details of seal monitoring programmes for each AU are given in Table a.
| OSPAR indicator | Seal abundance and distribution | Grey seal pup production | ||||
|---|---|---|---|---|---|---|
| Species | Grey seals (ALL AGES) | Harbour seals (ALL AGES) | Grey seals (PUPS) | |||
| Metric | August counts (in conjunction with harbour seal moult counts) | Moult counts (spring) | August moult counts | Pup Counts (number of pups present at any one time) | Pup production (total number of pups produced during entire breeding season) | |
| UK | Northern Ireland | Single aerial survey approx every 5 years | Single aerial survey approx every 5 years | SMRU partial survey 2002, 2005; Boat-based monthly surveys of Strangford Lough | ||
| Southwest Scotland | Single aerial survey approx every 5 years | Single aerial survey approx every 5 years | No formal monitoring as population very low | |||
| West Scotland | Single aerial survey approx every 5 years | Single aerial survey approx every 5 years | Repeat aerial survey, annual to 2010 biennial thereafter | |||
| Western Isles | Single aerial survey approx every 5 years | Single aerial survey approx every 5 years | Repeat aerial survey, annual to 2010 biennial thereafter | |||
| Orkney & North coast | Single aerial survey approx every 5 years | Single aerial survey approx every 5 years | Repeat aerial survey, annual to 2010 biennial thereafter | |||
| Shetland | Single aerial survey approx every 5 years | Single aerial survey approx every 5 years | Ground count, annual since 2004 | |||
| Moray Firth | Repeat aerial survey, annual | Repeat aerial survey, annual | Repeat aerial survey, annual to 2010 biennial thereafter | |||
| East coast Scotland | Single aerial survey, annual | Single aerial survey, annual | Repeat aerial survey, annual to 2010 biennial thereafter | |||
| Northeast England | No formal monitoring as population very low | No formal monitoring as population very low | Ground count, annual | |||
| Southeast England | Repeat aerial survey, annual | Repeat aerial survey, annual | Ground count, annual | |||
| South England | ||||||
| Southwest England | ||||||
| Wales | ||||||
| Northwest England | ||||||
| France | French North Sea & Channel coasts | Combination aerial and land surveys, approx 2-3 per month | Combination aerial and land surveys, approx 2-3 per month | Combination aerial and land surveys, approx 2-3 per month | Monthly ground surveys | |
| Denmark | Wadden Sea | Repeat aerial survey, annual | Repeat aerial survey, annual | Repeat aerial survey, annual | Repeat aerial survey, annual from 2008 | |
| Limfjord | Repeat aerial survey, annual | Repeat aerial survey, annual from 2015 | Repeat aerial survey, annual | Repeat aerial survey, annual from 2015 | ||
| Kattegat | Repeat aerial survey, annual | Repeat aerial survey, annual | Repeat aerial survey, annual | |||
| Netherlands | Wadden Sea | Repeat aerial survey, annual | Repeat aerial survey, annual | Repeat aerial survey, annual | Repeat aerial survey, annual from 2001 | |
| Dutch Delta | Monthly aerial survey | Monthly aerial survey | Monthly aerial survey | Monthly aerial surveys have not yeilded a credible pup production in the area | ||
| Germany | Wadden Sea (inc Helgoland) | Repeat aerial survey for harbour seals with recording of incidental grey seal sigthings,annual | Repeat aerial survey, annual | Repeat aerial survey, annual | Repeat aerial (Lower Saxony + Hamburg, from 2016 onwards also Schleswig-Holstein) or ground/ship based (Schleswig-Holstein, Helgoland) survey, annual from 2008 | |
| Norway | Norwegian west coast, south of 62N | Single aerial survey approx every 5 years | Ground count at least every 5 years | |||
| Northern Skagerrak and Oslo Fjord | Aerial survey, annual | |||||
Spatial scope: assessment units (AUs)
Despite their ability to travel long distances, individual mature grey seals of both sexes are usually faithful to particular breeding sites, and may return to within 10–100 m of individual breeding locations (Pomeroy et al. 2000). The Greater North Sea and UK parts of the Celtic Seas were divided into 21 AUs to provide a description of changes in pup production at a ‘local’ scale (Figure b). Direct impacts on pup production, such as disturbance, persecution and food availability may be more detectable at these smaller scales.
It is important to consider that AUs do not represent demographically independent populations. Additionally, survey coverage and monitoring effort is higher where breeding grey seals are most abundant. In many AUs monitoring is undertaken in specific areas by local organisations and does not form part of synoptic surveys. See Table a for details of monitoring programmes in each AU.
The AUs are the same as those used for the harbour seal abundance and distribution assessment under the indicator on Seal Abundance and Distribution . The assessment units in the Greater North Sea are broadly similar to those previously defined as OSPAR EcoQO sub-units.
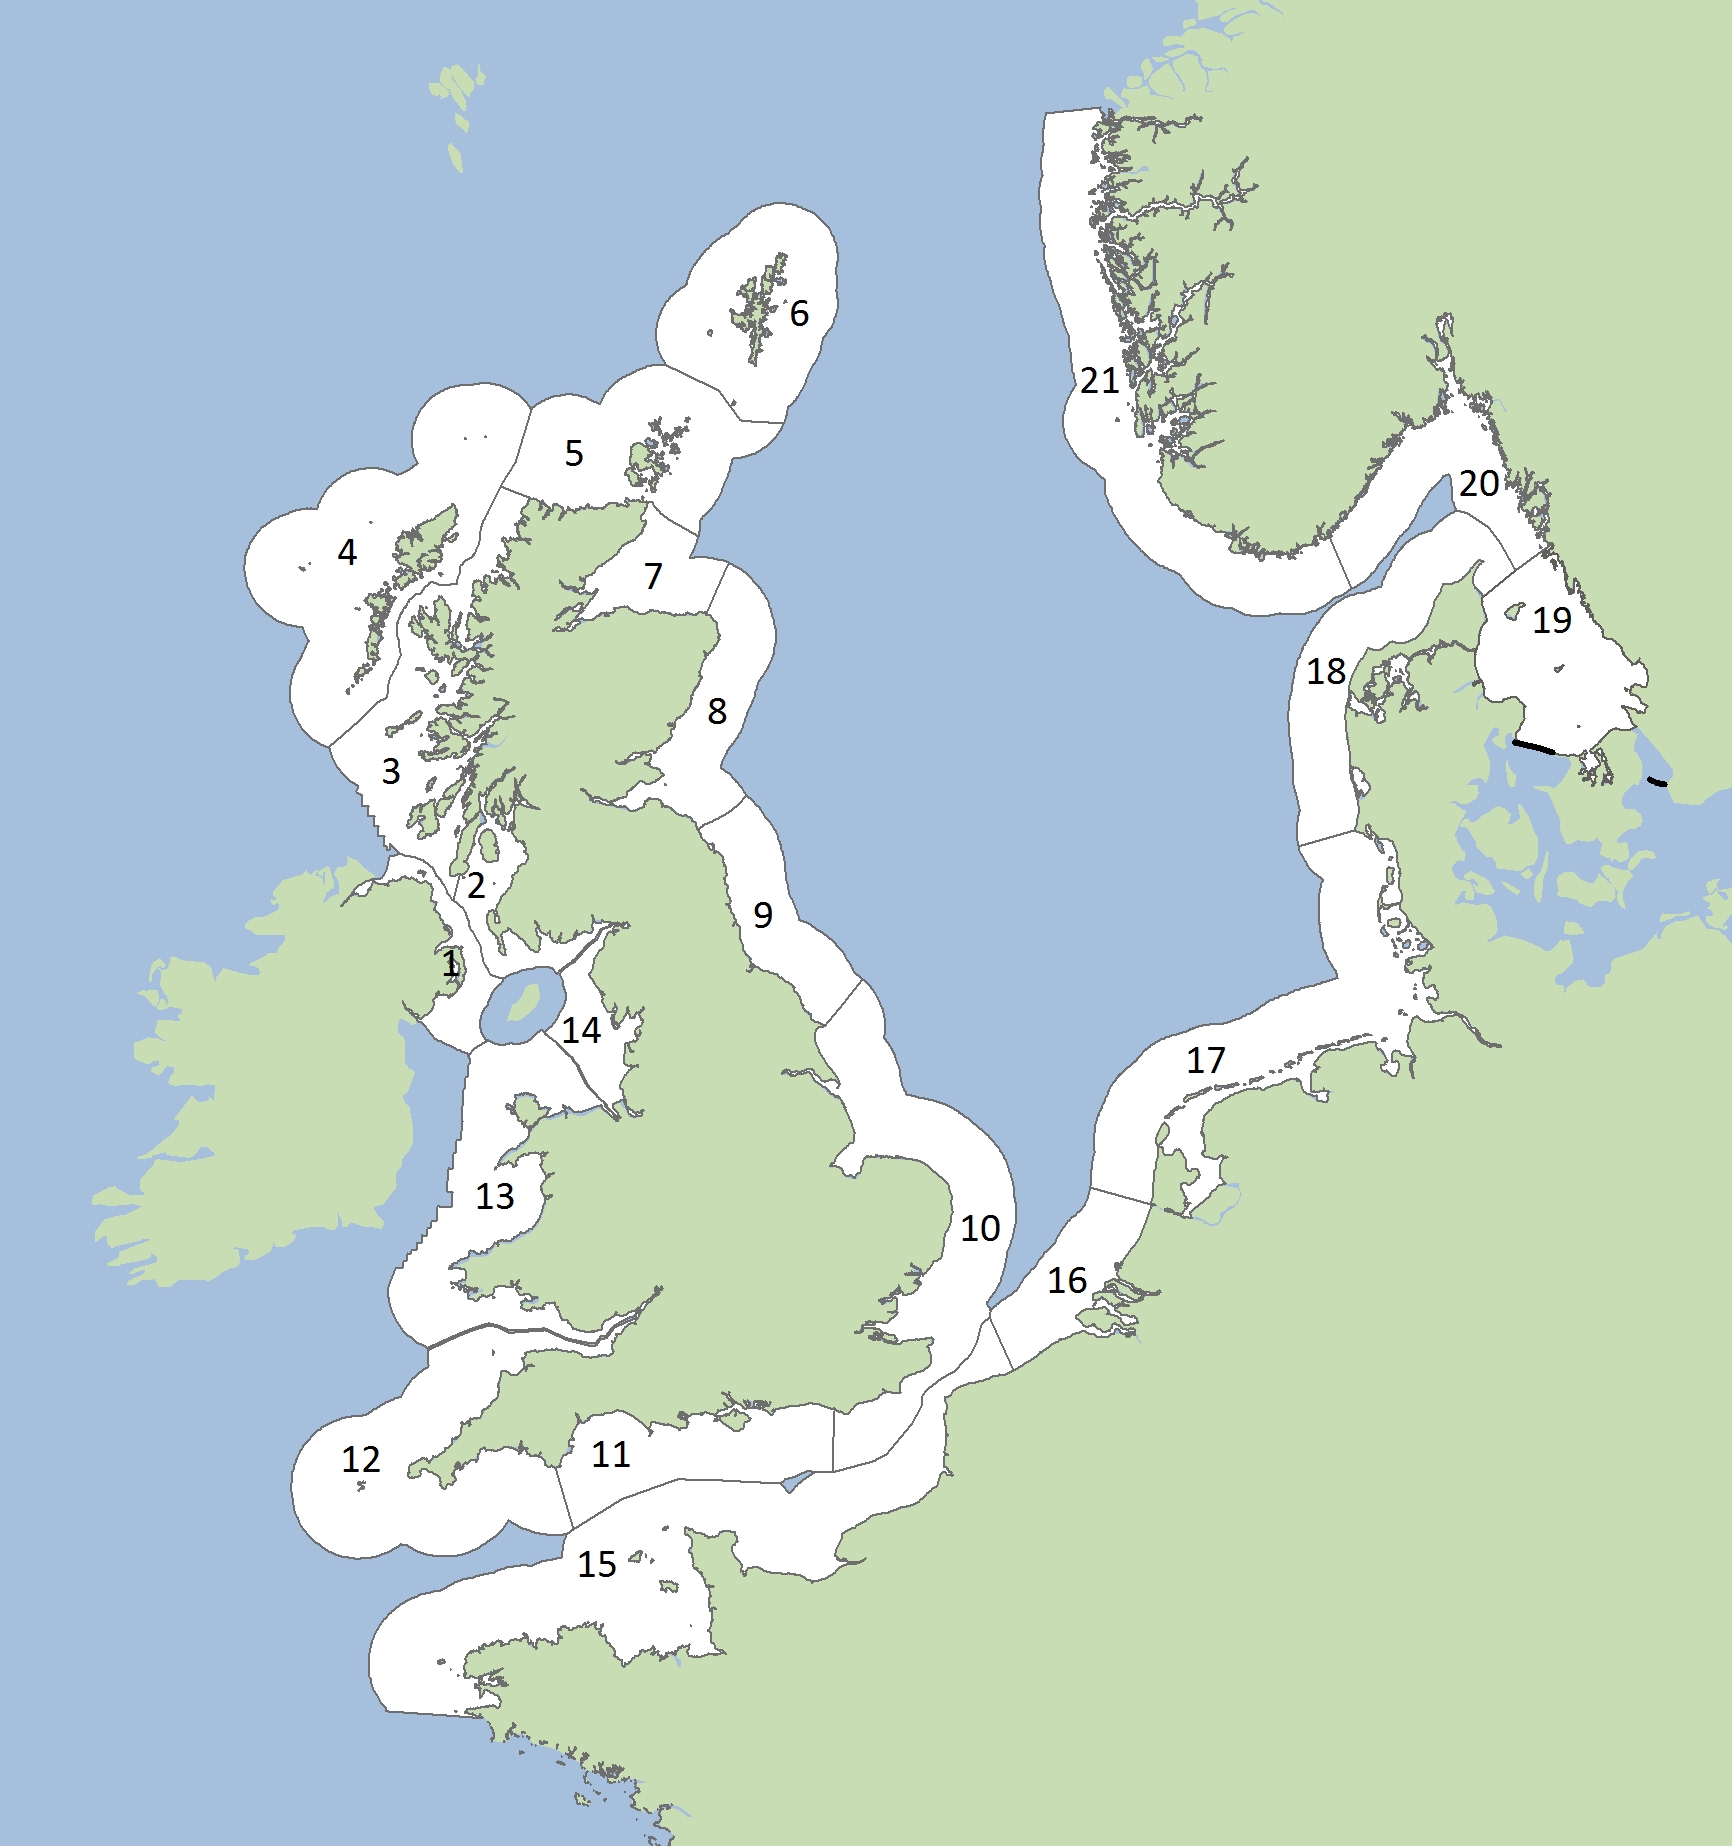
Figure b: Assessment units for grey seal pup production.
Key: 1 Northern Ireland, 2 South-west Scotland, 3 West Scotland, 4 Western Isles, 5 North coast and Orkney, 6 Shetland, 7 Moray Firth, 8 East Scotland, 9 North-east England, 10 South-east England, 11 South England, 12 South-west England, 13 Wales, 14 North-west England, 15 French North Sea and English Channel Coast, 16 Belgian coast and Dutch Delta, 17 Wadden Sea, 18 Limfjorden, 19 Kattegat, 20 Northern Skagerrak and Oslo Fjord, 21 Norwegian west coast, south of 62°N.
Baselines
Seals have been hunted both illegally and legally for a long time and it is not possible to know the undisturbed state, nor the current carrying capacity that could be attained alongside protection from illegal hunting. Time series data for grey seal pup production do not provide an indication of a time when seal populations were not impacted or what the values would have been. It is therefore not possible to identify a baseline representing un-impacted conditions. The method adopted for this assessment assesses grey seal pup production data using both a fixed baseline and a rolling baseline with associated assessment values.
A fixed-baseline year of 1992 was used, which is the baseline year used by some European Union Member States for seals under the Habitats Directive (Council Directive 92/43/EEC). For AUs where grey seal pup production data for 1992 were not available, the start of the time series was used as the baseline.
Bearing in mind that the arbitrarily assigned baseline does not necessarily reflect a state without impacts, it is not possible to assess the status of seals in relation to the concept of ‘favourable conservation status’ under the European Union Habitats Directive. Instead, trends in the seal population are assessed. A short-term rate-based assessment value was also adopted that uses a rolling baseline (Method 1; OSPAR, 2012). Here, the average annual rate of population change over consecutive six-year periods (the reporting cycle for the European Union Marine Strategy Framework Directive; MSFD) was assessed against the next period. The rolling baseline provides a means to indicate change in population size compared with the previous six-year assessment period, rather than relying solely on an historical fixed baseline, which probably reflects a point in time when the population is already depleted due to anthropogenic pressures.
A potential issue with this type of quantitative trend thresholds, known as ‘shifting baselines’ is that each successive assessment uses a different starting point as the basis for comparison. This could result in a substantial cumulative decrease occurring over more than one six-year assessment period not being flagged as a problem, because in each six-year period the rate of decline remained below the assessment value (OSPAR, 2012).
Use of the two types of baseline and associated assessment values seeks to provide an indicator that would warn against both a slow but long-term steady decline (the problem of ‘shifting baselines’ associated with only having a rolling baseline) and against a recovery followed by a subsequent decline (potentially missed with a fixed baseline set below reference conditions).
Assessment values
OSPAR Intermediate Assessment 2017 Indicator Assessment values are not to be considered as equivalent to proposed European Union MSFD criteria threshold values, however they can be used for the purposes of their MSFD obligations by those Contracting Parties that wish to do so.
Indicator assessment values were set as a percentage deviation from the baseline value (Method 3; OSPAR, 2012).
Associated with the above baselines, two assessment values were used to assess grey seal pup production in each AU:
- Assessment value 1: No decline in grey seal pup production of >1% per year in the previous six-year period (a decline of approximately 6% over six years).
- Assessment value 2: No decline in grey seal pup production of >25% since the fixed baseline in 1992 (or closest year).
For assessment value 2: in cases where a shorter timescale than the period to 1992 is assessed, a 25% decline since the baseline is therefore not equivalent to a 25% decline in those AUs where data do extend to 1992. For example, a 25% decline since 2003 describes a more rapid contraction in population size than a 25% decline since 1992.
Using the two assessment values together would provide a means to identify a need for management measures to promote population growth (i.e. recovery) and to identify subsequent slowing of population growth as carrying capacity is approached.
Assessing change in pup production
Pup production estimates from all colonies within a given AU were summed to generate an overall assessment for that area. Quantitative assessments of trends in pup production were only completed for those AUs where three or more annual data points were available.
In addition to the assessment of the Wadden Sea (AU17), a separate assessment was conducted on the Dutch part of the Wadden Sea, where the time series began in 2001, compared to 2008 for other parts of the Wadden Sea. Earlier data exist, both for Dutch and German waters, but these were collected using different methods and so are difficult to compare with data collected subsequently.
Grey seal pup production estimates were assessed in relation to a baseline set at 1992 (or the start of the time series where this was after 1992), and by calculating the average rate of annual population change within the last reporting round (2009–2014).
To determine the change in pup production since the baseline year, generalised linear models or generalised additive models were fitted to the sum of pup production data within an AU with a quasi-Poisson error distribution and log link using all available annual survey data for the period 1992–2014. The percentage change in pup numbers since the baseline year (Formula A; Δabundance) and 80% confidence intervals were calculated from fitted values. Although no formal hypothesis testing was conducted, 80% confidence intervals were calculated to reflect the choice to set the significance level, α, equal to 0.20 or 20%.
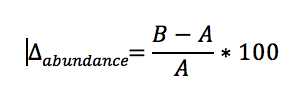
Formula A: Calculation of long term trend in abundance
where A is the count fitted by the model in the baseline year and B is the count fitted by the model in the most recent survey year.
To estimate the annual change in pup production over the previous six-year reporting round, a linear trend was fitted to the sum of all available data in each AU for the reporting round 2009–2014. GLMs were fitted to the sum of pup production data within an AU with a quasi-Poisson error distribution and log link. Annual growth rate (%) and 80% confidence intervals were estimated for each of the AUs. Although no formal hypothesis testing was conducted, 80% confidence intervals were calculated to reflect the choice to set the significance level, α, equal to 0.20 or 20%.
Indicator metrics and associated confidence intervals were assessed against two thresholds: the average annual growth rate (%) and 80% confidence intervals within the last reporting round were less than -1% per year, and the percentage change in abundance since baseline year (Δbaseline) and 80% confidence intervals were less than -25%. If the 80% confidence intervals encompassed the threshold, the assessment was classified as ‘inconclusive’.
Statistical power of detecting change in pup production
There are many reasons why pup counts could vary, aside from representing true changes in pup production, These include variation in weather and a recent disturbance at a colony. It is therefore advisable to examine the variability in survey counts and to incorporate this variability into trend estimates. The International Council for the Exploration of the Sea (ICES) Working Group for Marine Mammal Ecology (WGMME) (ICES, 2014) provided general advice on the need to understand the statistical power of monitoring programmes. In the present context, statistical power is the percentage confidence in not missing a significant decline. Statistical power depends on the sample size (number of surveys), the level of statistical significance set (α-level), variance in the counts, and the magnitude of the trend, that is, -1% and -25%. The ICES WGMME (ICES, 2014) recommended that monitoring should achieve a minimum of 80% power – which equates to a 20% chance of making a Type II error (i.e. the frequency with which a true decline would not be detected). The same group also recommended that the threshold for detection of a statistically ‘significant’ trend be relaxed from the traditional α=0.05 to α=0.20. The α parameter, or statistical significance level, equates to the probability of concluding that a statistically significant trend exists when it does not (Type I error). A α value of 0.2 and power of 80% means there is equal probability of making an incorrect conclusion (either Type I or Type II error) about the detection of a trend.
Current monitoring programmes vary in the level of statistical power achievable. To carry out a full study of retrospective power to detect changes in the observed population trends, detailed information about the between- and within-year variability in all survey counts would be necessary. A full assessment of power was not undertaken here but confidence intervals (CIs) provide a measure of confidence in the assessment. Simply said, they describe the frequency with which the true, unobservable, population parameter (here, the mean count) could be expected to fall within the intervals described by an upper and lower confidence limit. Where the confidence intervals encompass the assessment value the data do not provide conclusive evidence for the calculated value being above or below the assessment value.
Résultats
Dans la mer du Nord au sens large et dans des parties des mers Celtiques, la production de jeunes phoques gris a augmenté, à long et court terme, dans toutes les zones évaluées où il existe des sites de reproduction et pour lesquelles on dispose de données suffisantes pour réaliser l’évaluation (Figures 1 et 2). La production de jeunes phoques n’a pas diminué dans ces zones, ce qui correspond aux deux valeurs d’évaluation. Bien que les données disponibles pour les îles Shetland (AU6) ne soient pas suffisantes pour permettre une évaluation, le nombre de jeunes phoques semble indiquer un déclin à long terme de leur production durant la période de 2004 à 2014.
La production de jeunes phoques gris a augmenté rapidement dans les unités d’évaluation (AU) de la mer du Nord au sens large au cours de la période de 2009 à 2014. Il est probable que cette augmentation de la production de jeunes dans les AU de l’Europe continentale (par exemple mer des Wadden, AU17) soit influencée par l’immigration d’animaux provenant de grandes colonies au nord du Royaume-Uni.
Les taux de croissance de la production de jeunes sont plus bas à l’ouest de l’Ecosse (AU3) et dans les îles occidentales de l’Ecosse (AU4). Ceci peut être dû au fait que ces zones sont proches de la capacité de charge naturelle.
Les modifications de la production de jeunes phoques gris ont été évaluées jusqu’en 2014 dans la mer du Nord au sens large et dans des parties des mers Celtiques dans les eaux britanniques. Le phoque gris se reproduit le long de la côte d’Irlande mais les données correspondantes ne sont pas disponibles car leur densité ne convient pas à une évaluation.
Les modifications à long terme ont été évaluées à partir de la ligne de base de 1992 (ou plus tard pour certaines séries temporelles). Les modifications à court terme portent sur la période de 2009 à 2014. L’analyse s’est penchée sur l’ampleur du déclin à long ou court terme. Aucun déclin n’a été décelé.

Figure 1: Modification de la production de jeunes phoques gris durant la période de 2009 à 2014, évaluée par rapport à une situation d’aucun déclin supérieur à 1% par an
Le chiffre figurant dans chaque cercle fait référence à l’unité d’évaluation correspondante (Voir la légende)
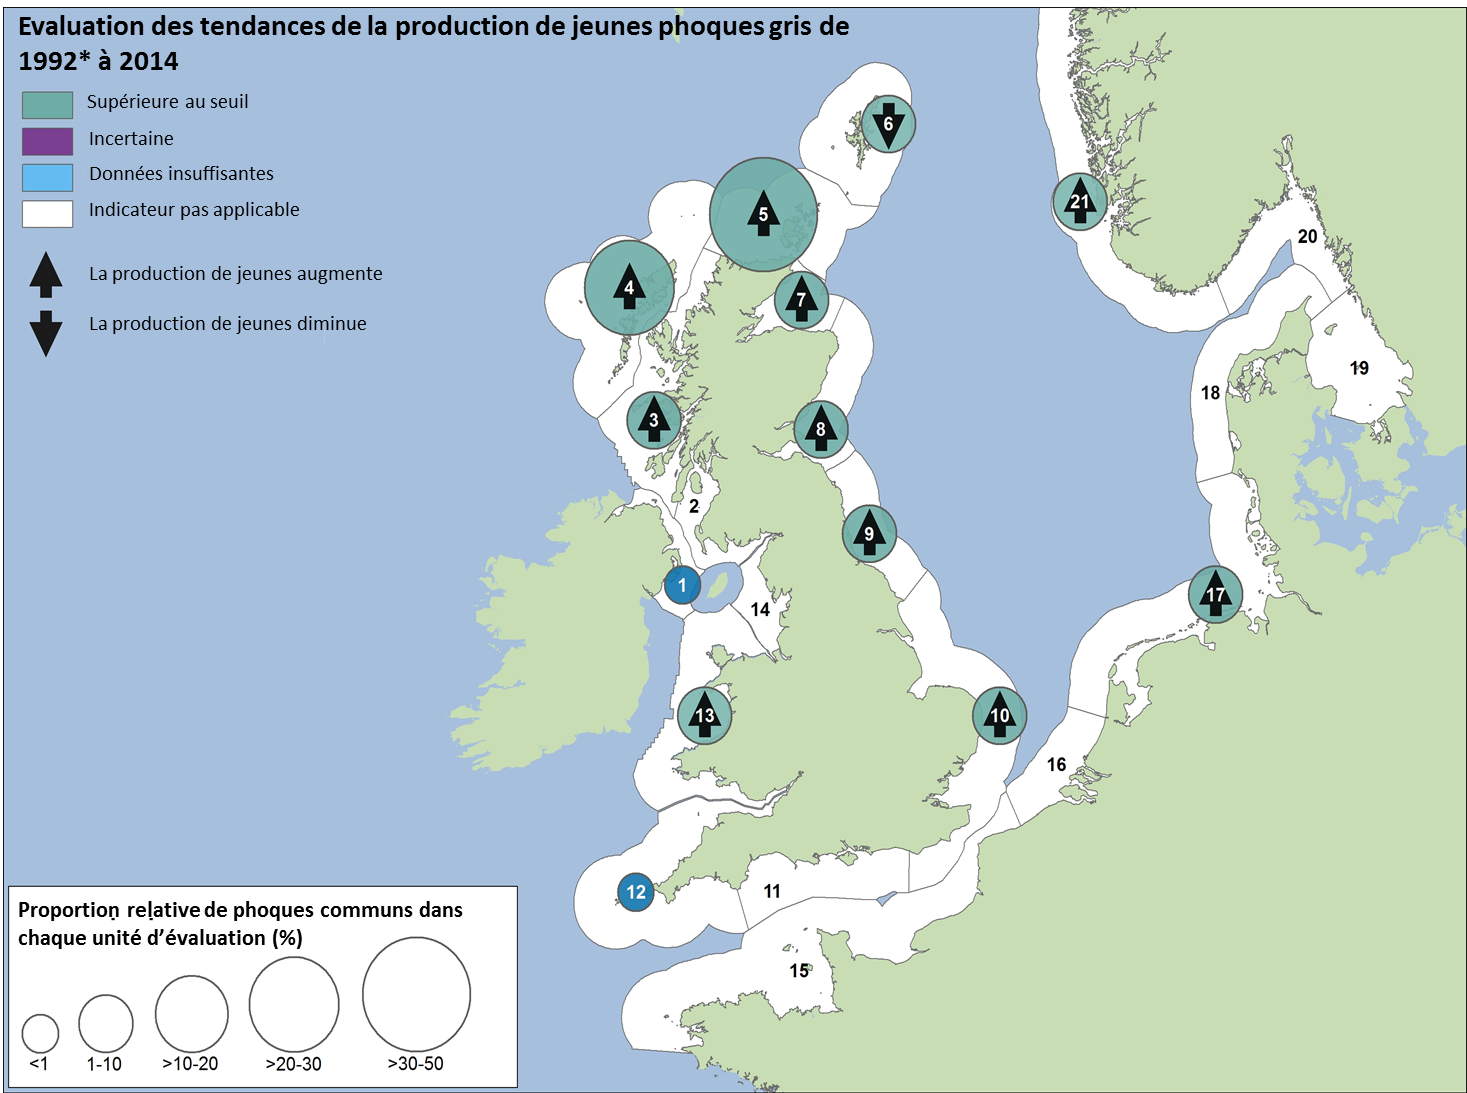
Figure 2: Modification de la production de jeunes phoques gris durant la période de 1992 à 2014, évaluée par rapport à une situation d’aucun déclin supérieur à 25%.
Le chiffre figurant dans chaque cercle fait référence à l’unité d’évaluation correspondante (Voir la légende). Bien que l’année de base utilisée soit 1992, une année plus récente a été utilisée pour certaines unités d’évaluation (indiquées entre parenthèses ci-après).
Unités d’évaluation: 1 Irlande du Nord, 2 Sud-ouest de l’Ecosse, 3 Ouest de l’Ecosse, 4 Iles occidentales, 5 Côte septentrionale et les Orcades, 6 Shetland (2004), 7 Moray Firth (1997), 8 Est de l’Ecosse, 9 Nord-est de l’Angleterre, 10 Sud-est de l’Angleterre, 11 Sud de l’Angleterre, 12 Sud-ouest de l’Angleterre, 13 Pays de Galles, 14 Nord-ouest de l’Angleterre, 15 Partie française de la mer du Nord et de la côte de la Manche, 16 Côte belge et delta néerlandais, 17 Mer des Wadden (2001 pour les Pays-Bas et 2008 pour l’Allemagne et le Danemark), 18 Limfjorden, 19 Kattegat, 20 Skagerrak du nord et Fjord d’Oslo, 21 Côte ouest norvégienne, sud du 62°N (2000).
On considère que la méthodologie inspire une confiance modérée/faible et que la disponibilité des données inspire une confiance modérée.
The assessment results presented in Figure 1 and Figure 2 are derived from the values for rates of change in pup production presented in Table b.
Table b: Short-term (2009–2014) and long-term (baseline–2014) change in grey seal pup production in each Assessment Unit
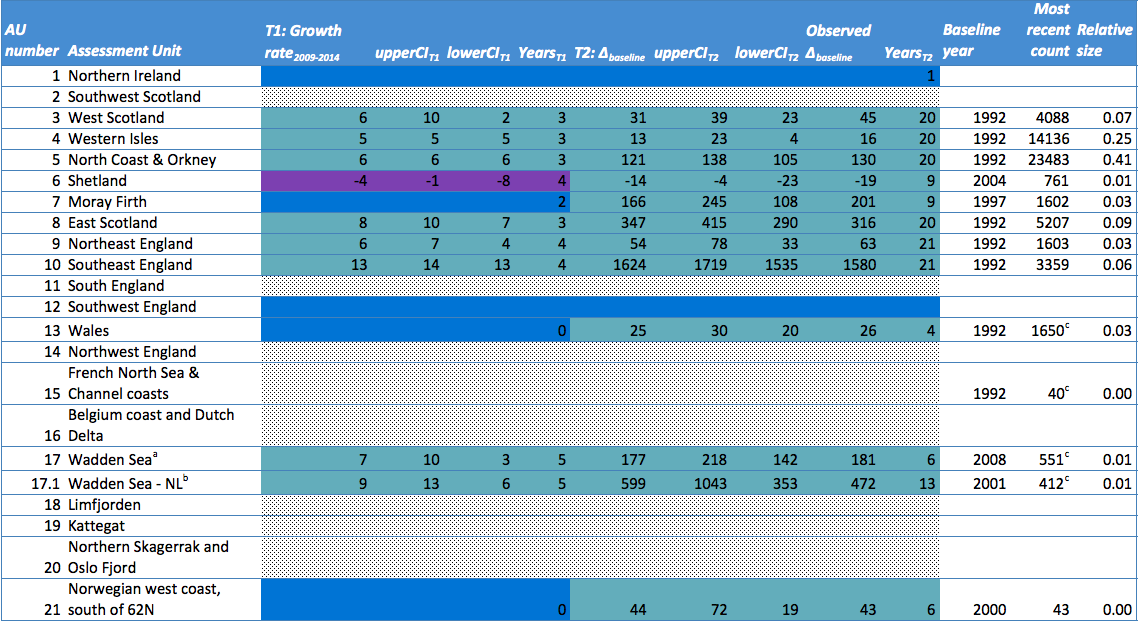
Table B Key: T1: Growth rate 2009–2014 refers to the annual growth (%) in counts between 2009 and 2014. T2: Δbaseline refers to the change in numbers since the baseline year. Upper and lower 80% confidence intervals with upper and lower limits are given for both assessment values based on modelled growth rates (upper CIT1, lowerCIT1 and upper CIT2, lowerCIT2 respectively). YearsT1 and YearsT2 refers to the number of years of pup count data in the periods 2009–2014 and 1992–2014 respectively. Observed change in pup production since the baseline year, not from modelled data, is denoted by Observed Δbaseline. The baseline year refers to 1992 or the start of the time series. ‘Most recent count’ refers to the most recent estimate of total pup production (and is not necessarily in 2014). ‘Relative size’ refers to the most recent estimate of total pup production expressed as a proportion of the total for all AUs. aInformation collated by the Wadden Sea Secretariat includes pups born in the Netherlands and Germany (very few pups born in Denmark); bDutch portion of Wadden Sea only (longer data series); cNumbers represent maximum number of pups counted; in other AUs the number given is modelled pup production (i.e. the total number of pups born in the season).
The values in Table b were estimated from trend models that were fitted to observed annual pup production within each Assessment Unit (AU), where there were sufficient time series data to do so (see Methods section). The observed and modelled estimates of annual pup production are plotted for each AU in Figure b.
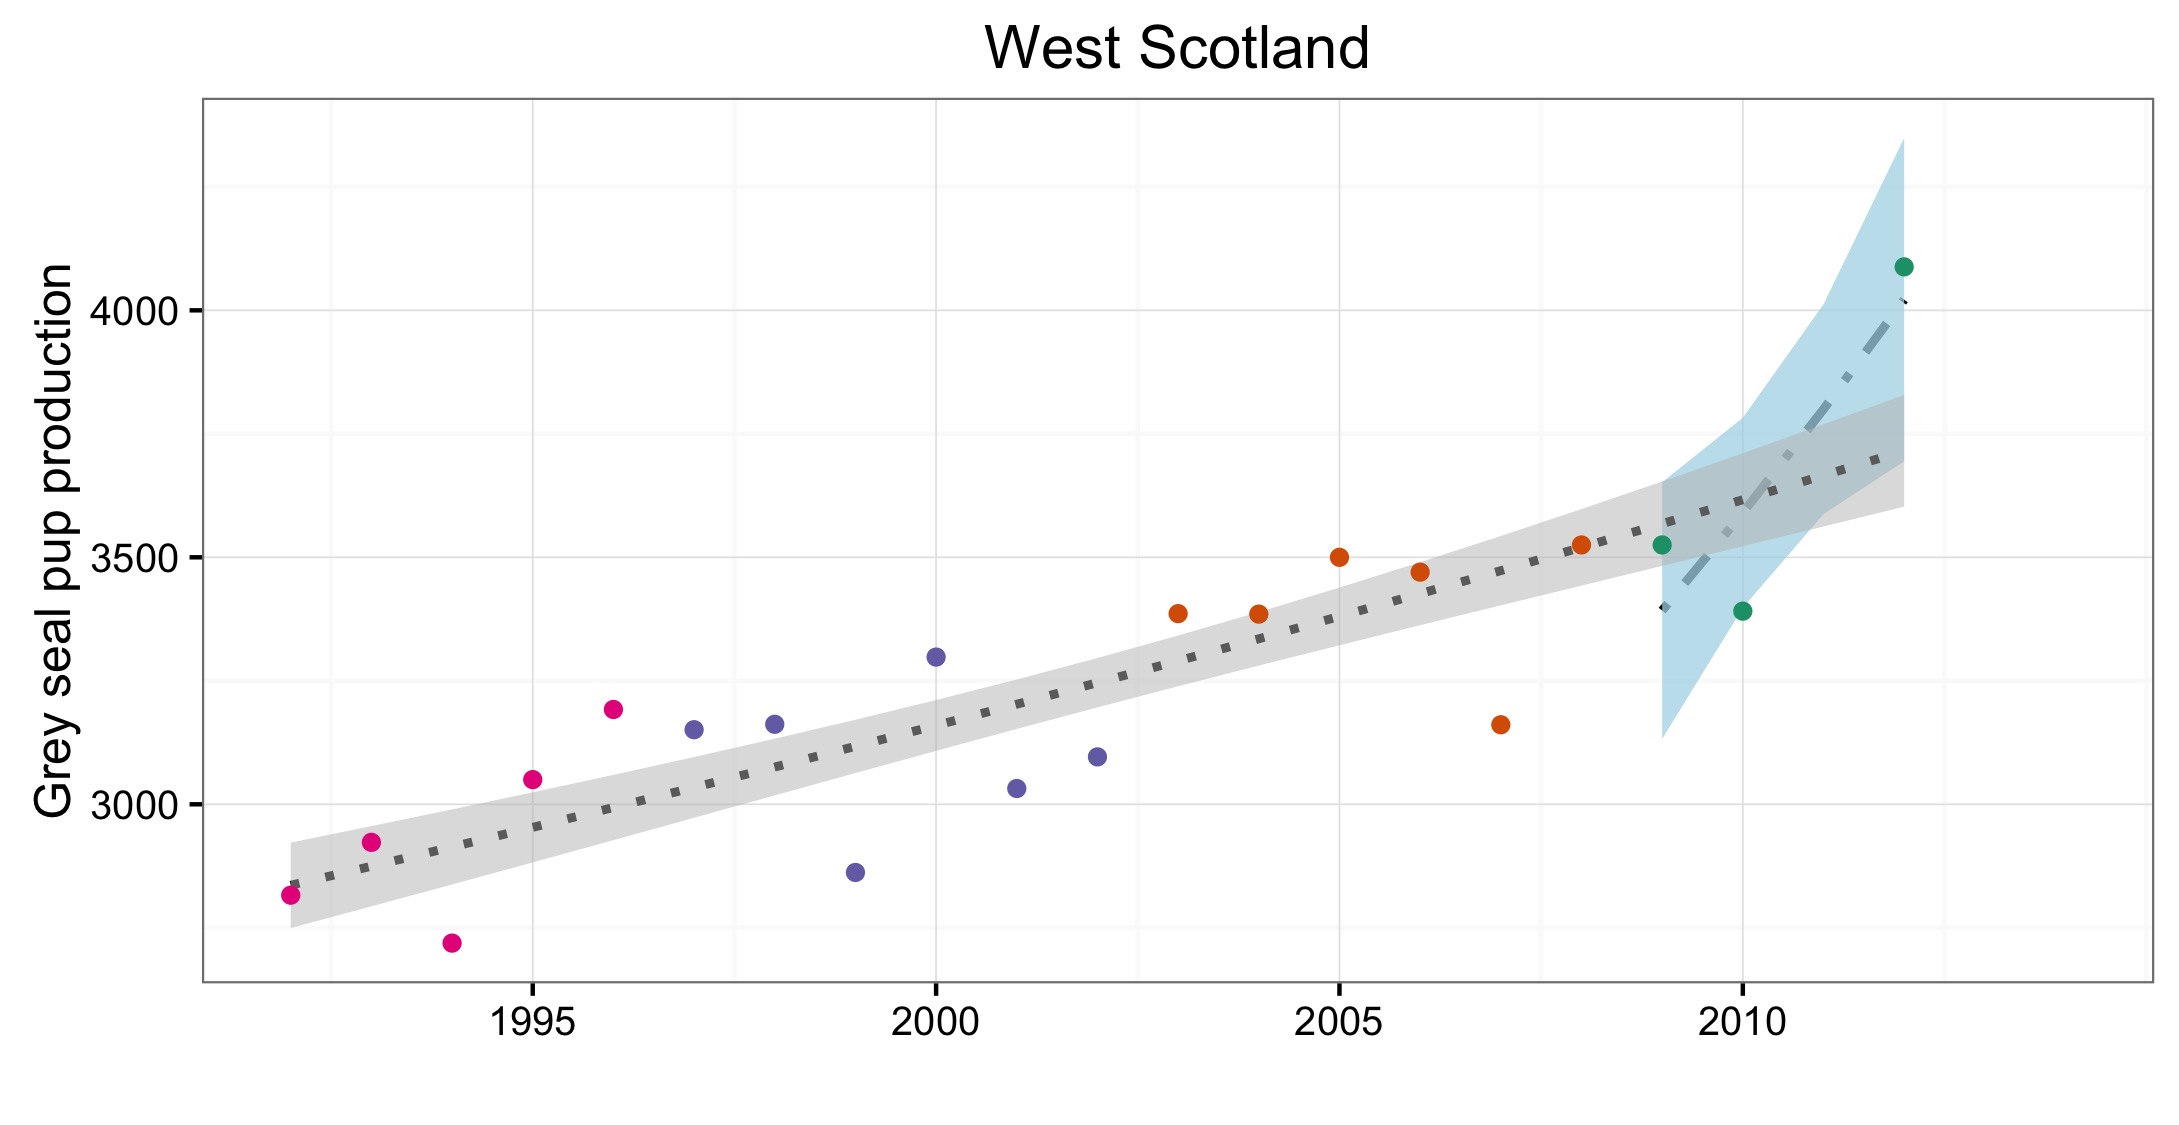
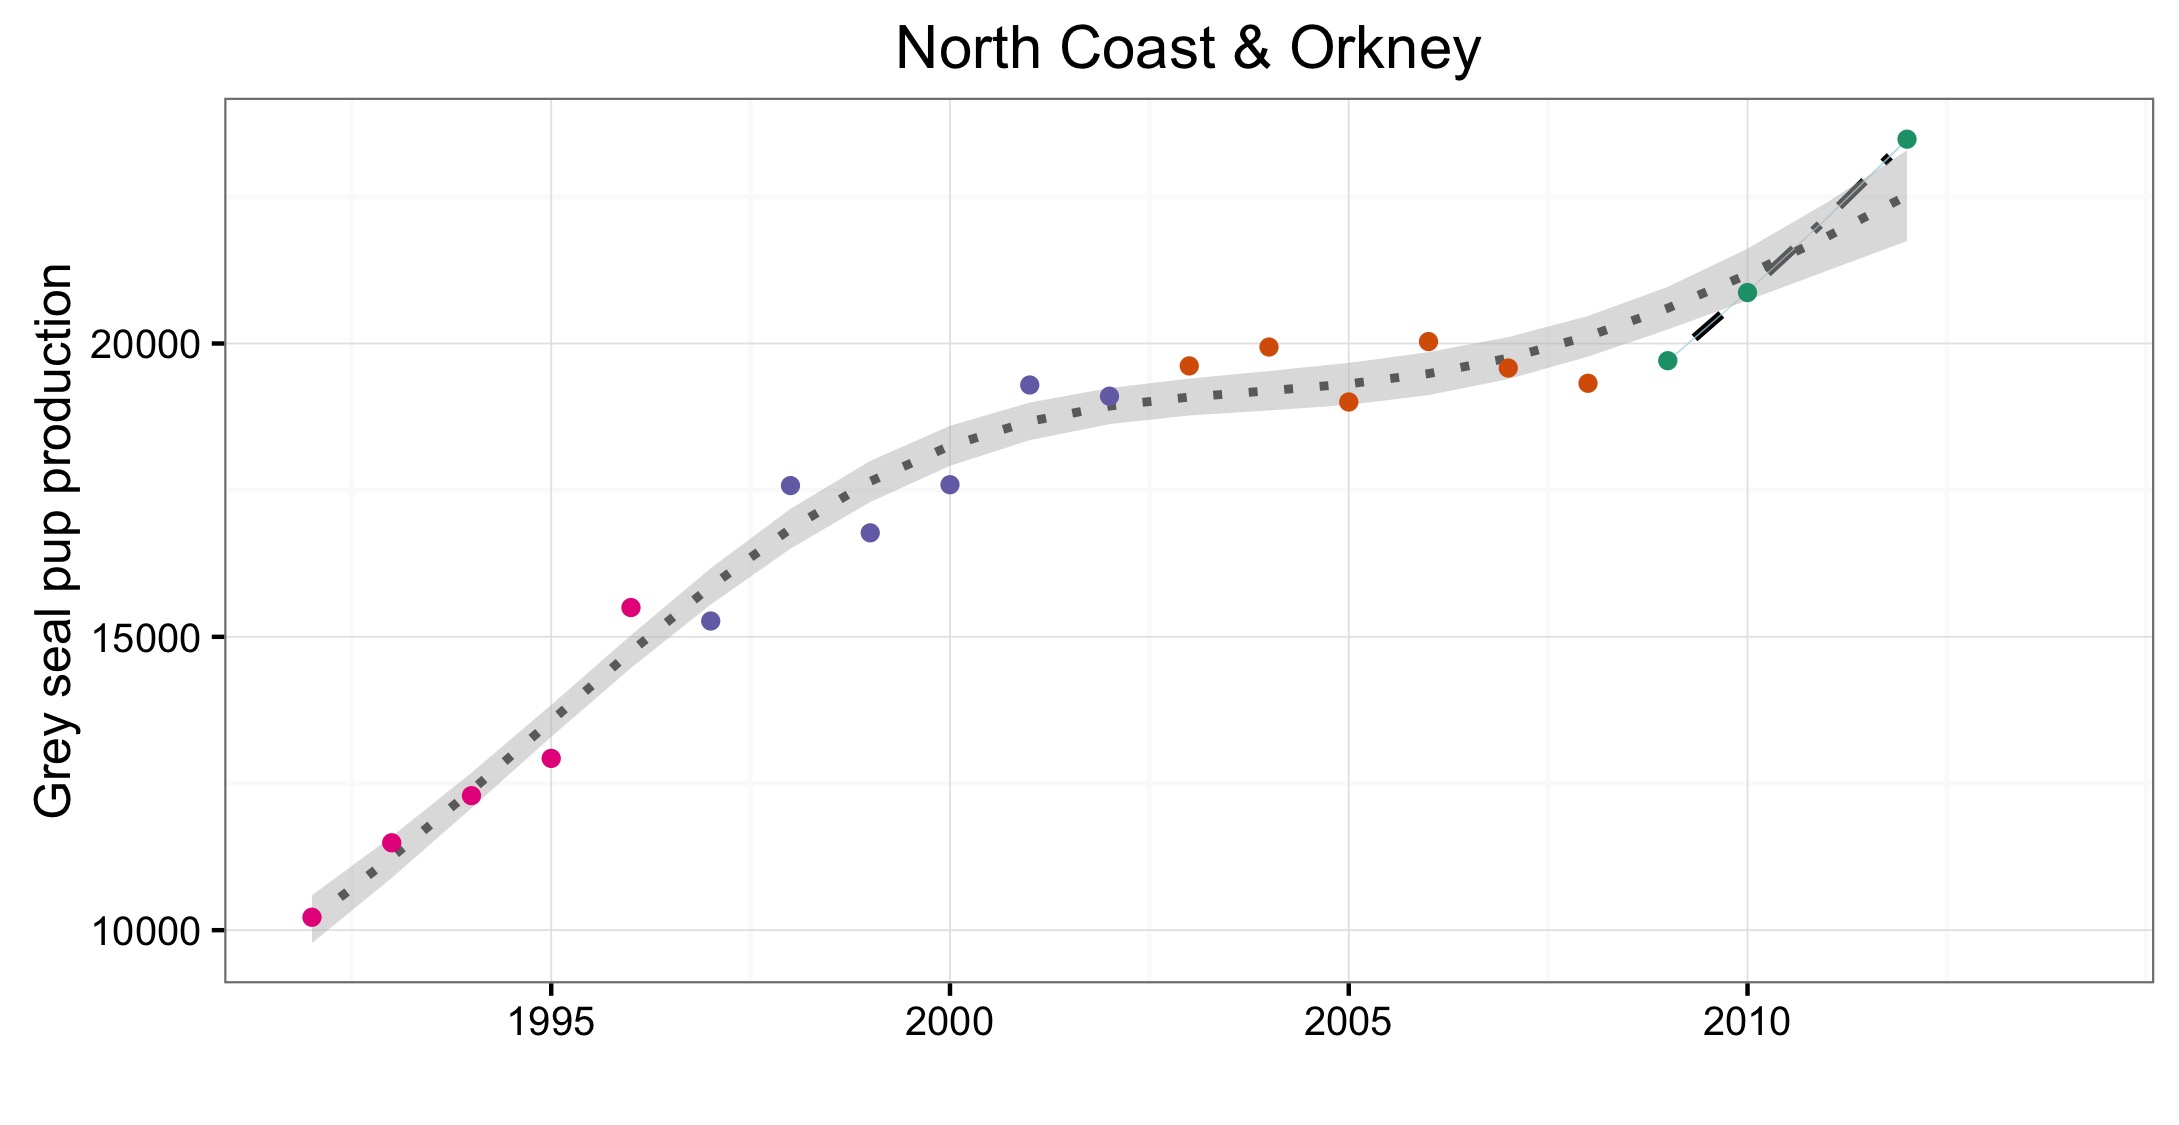
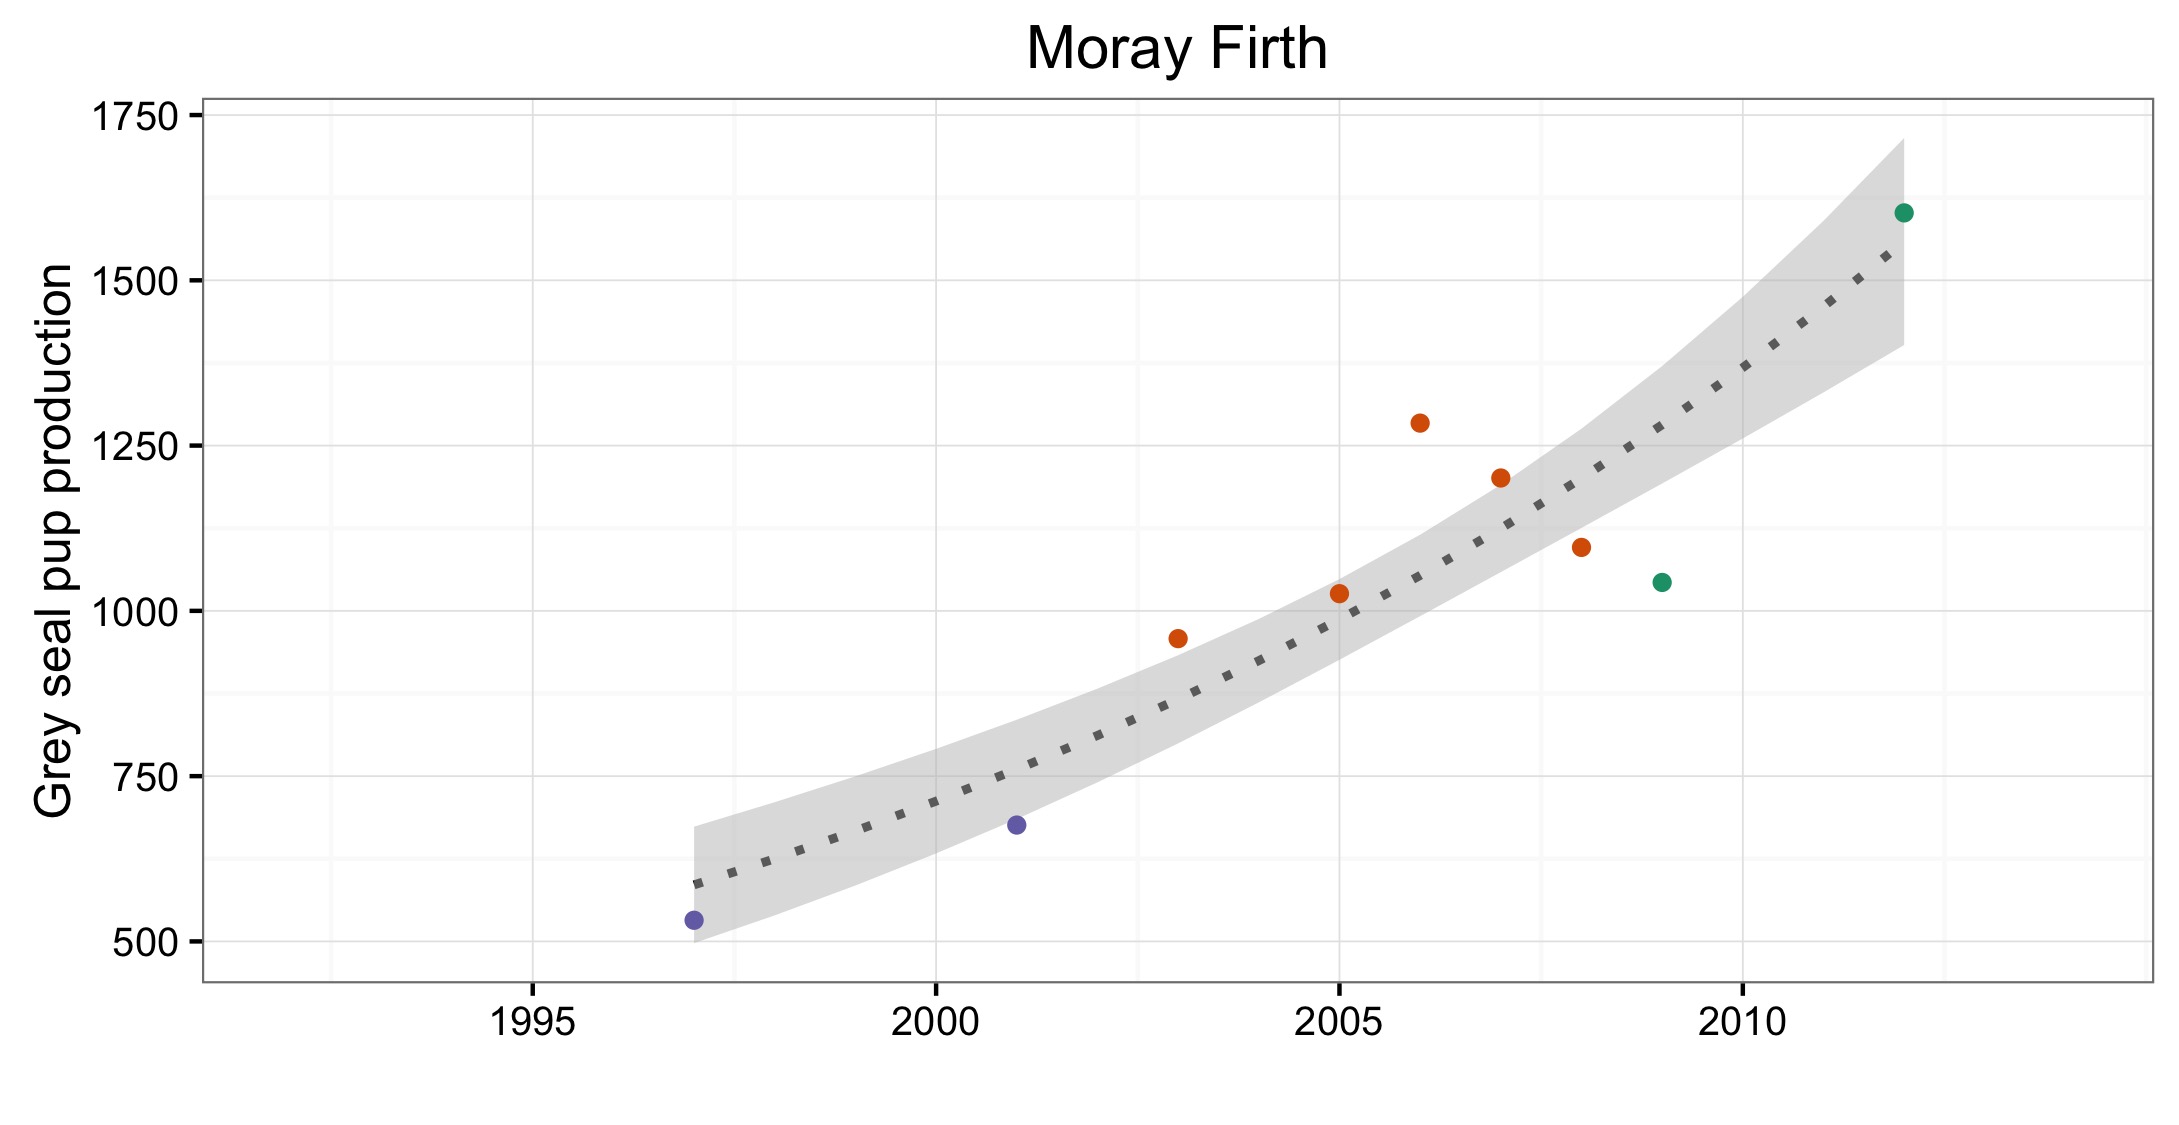
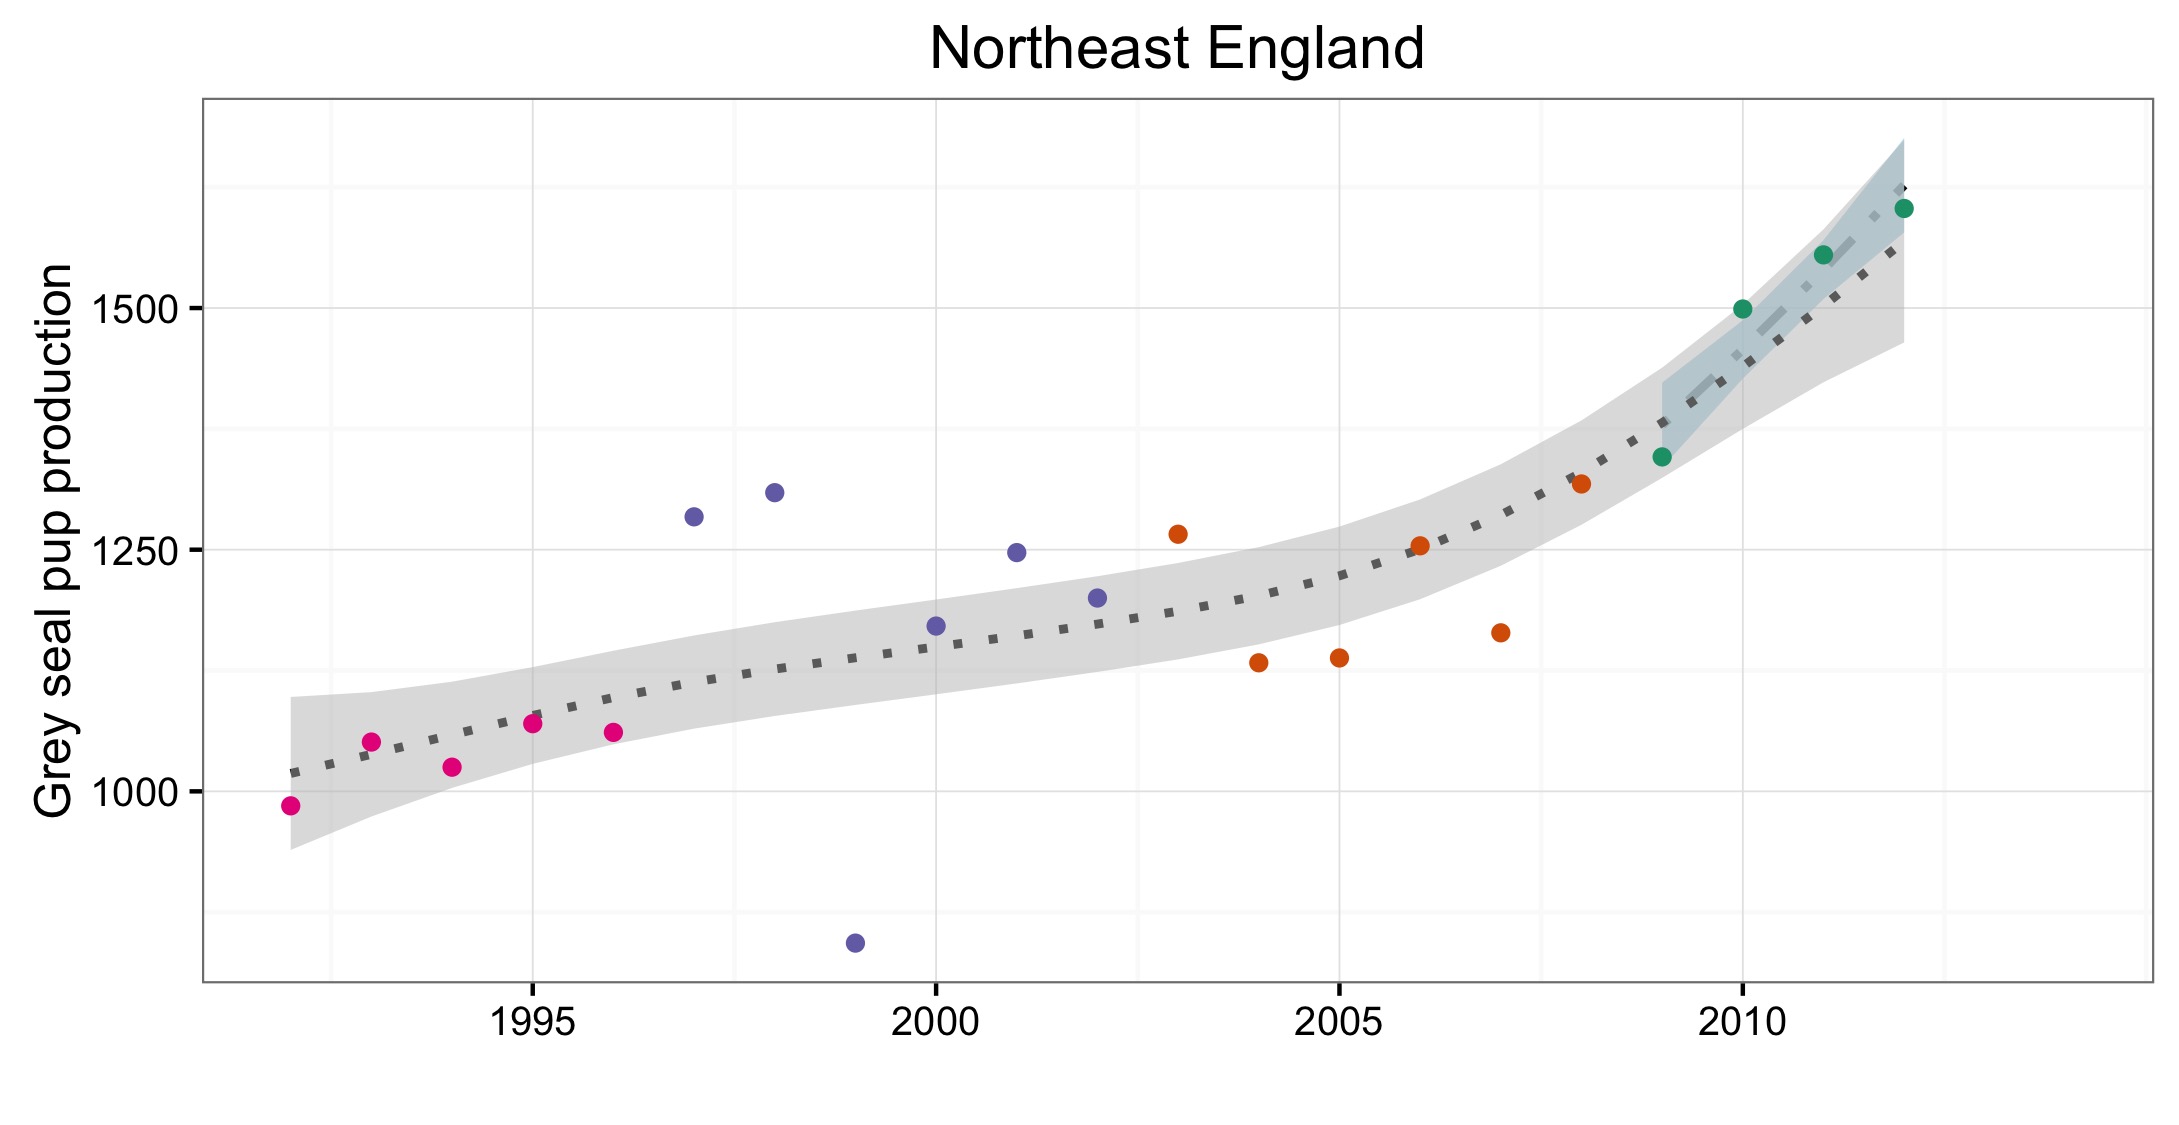
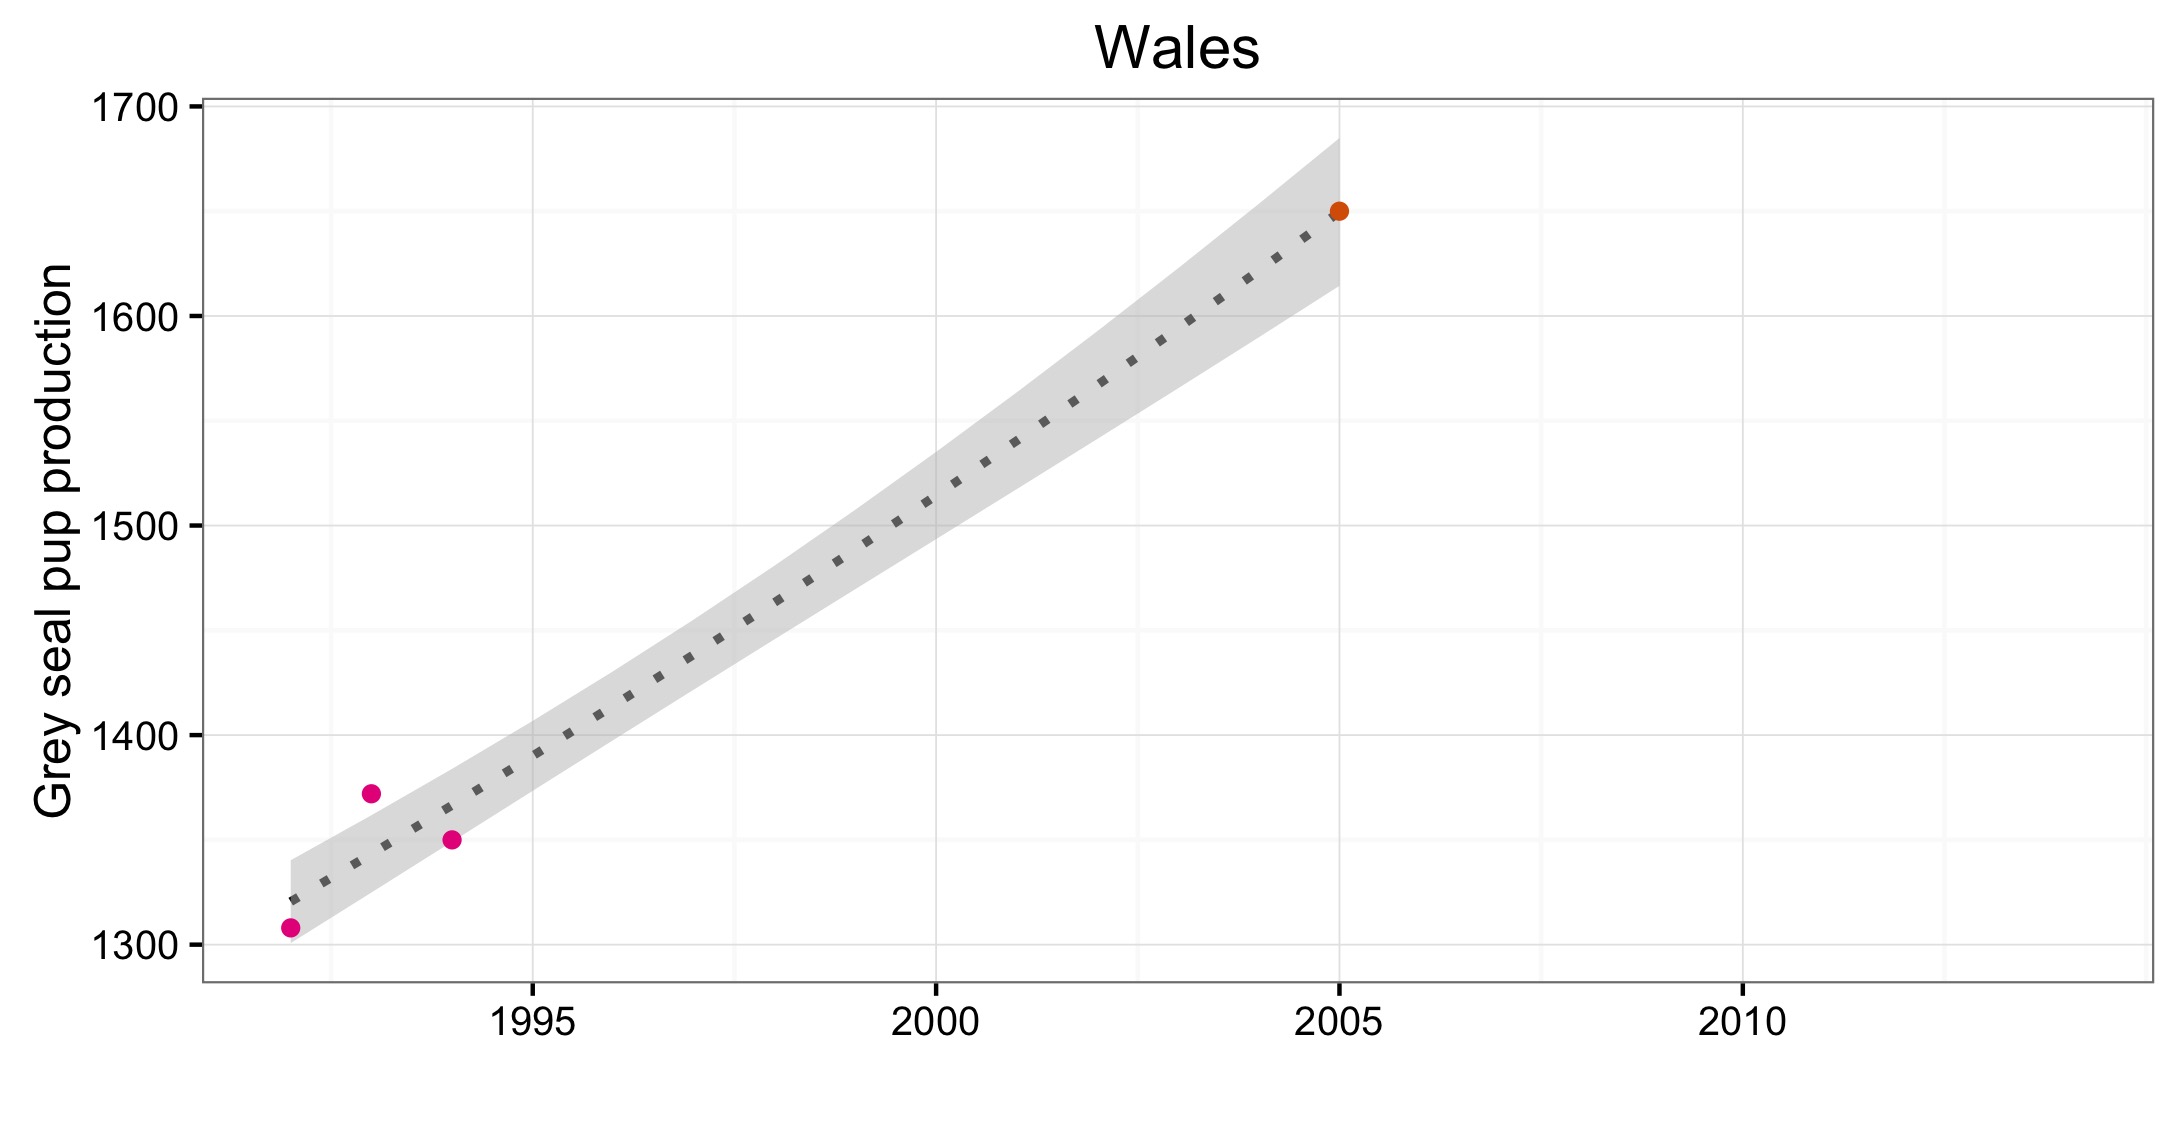
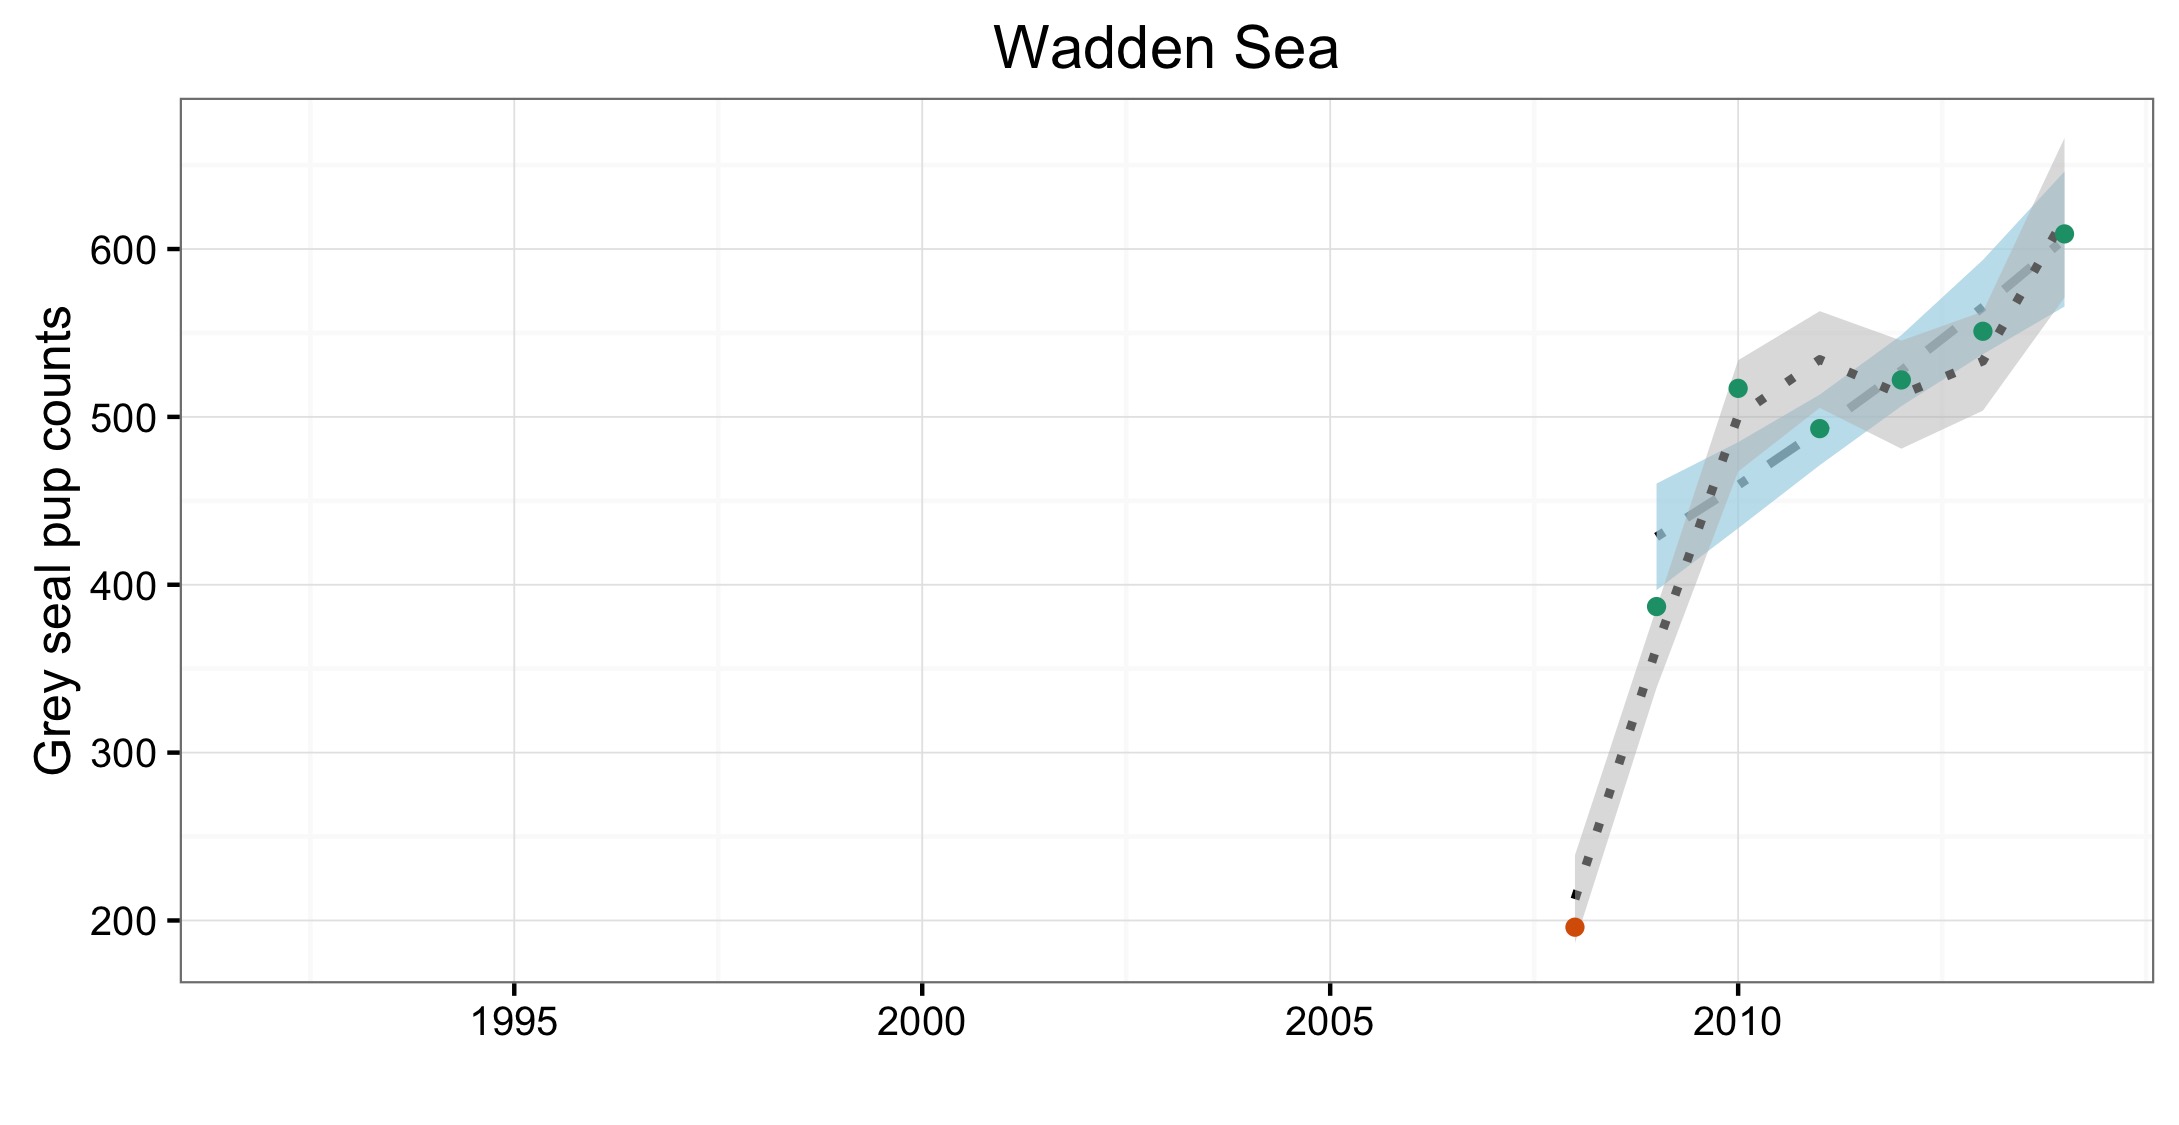
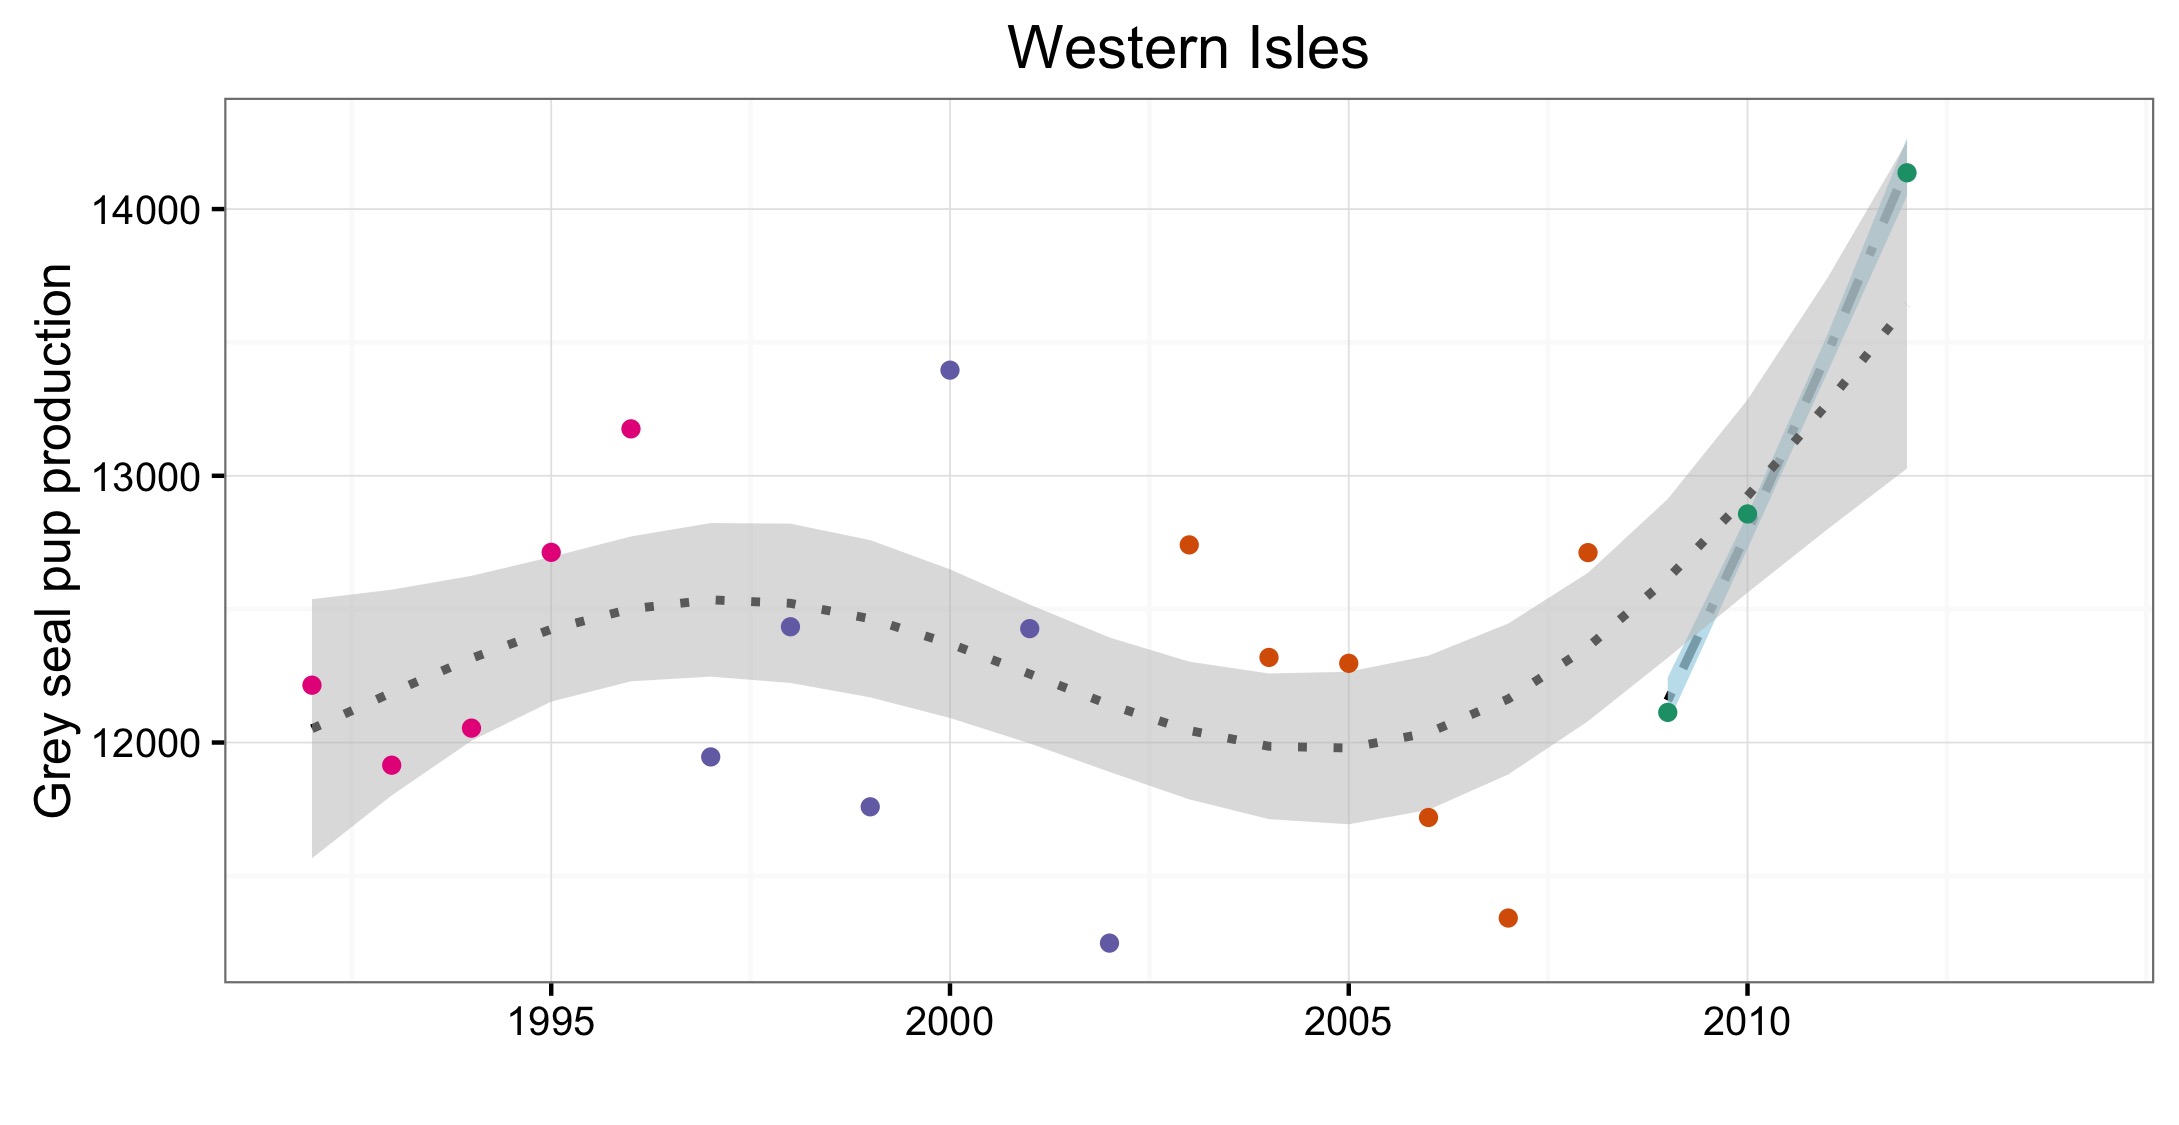
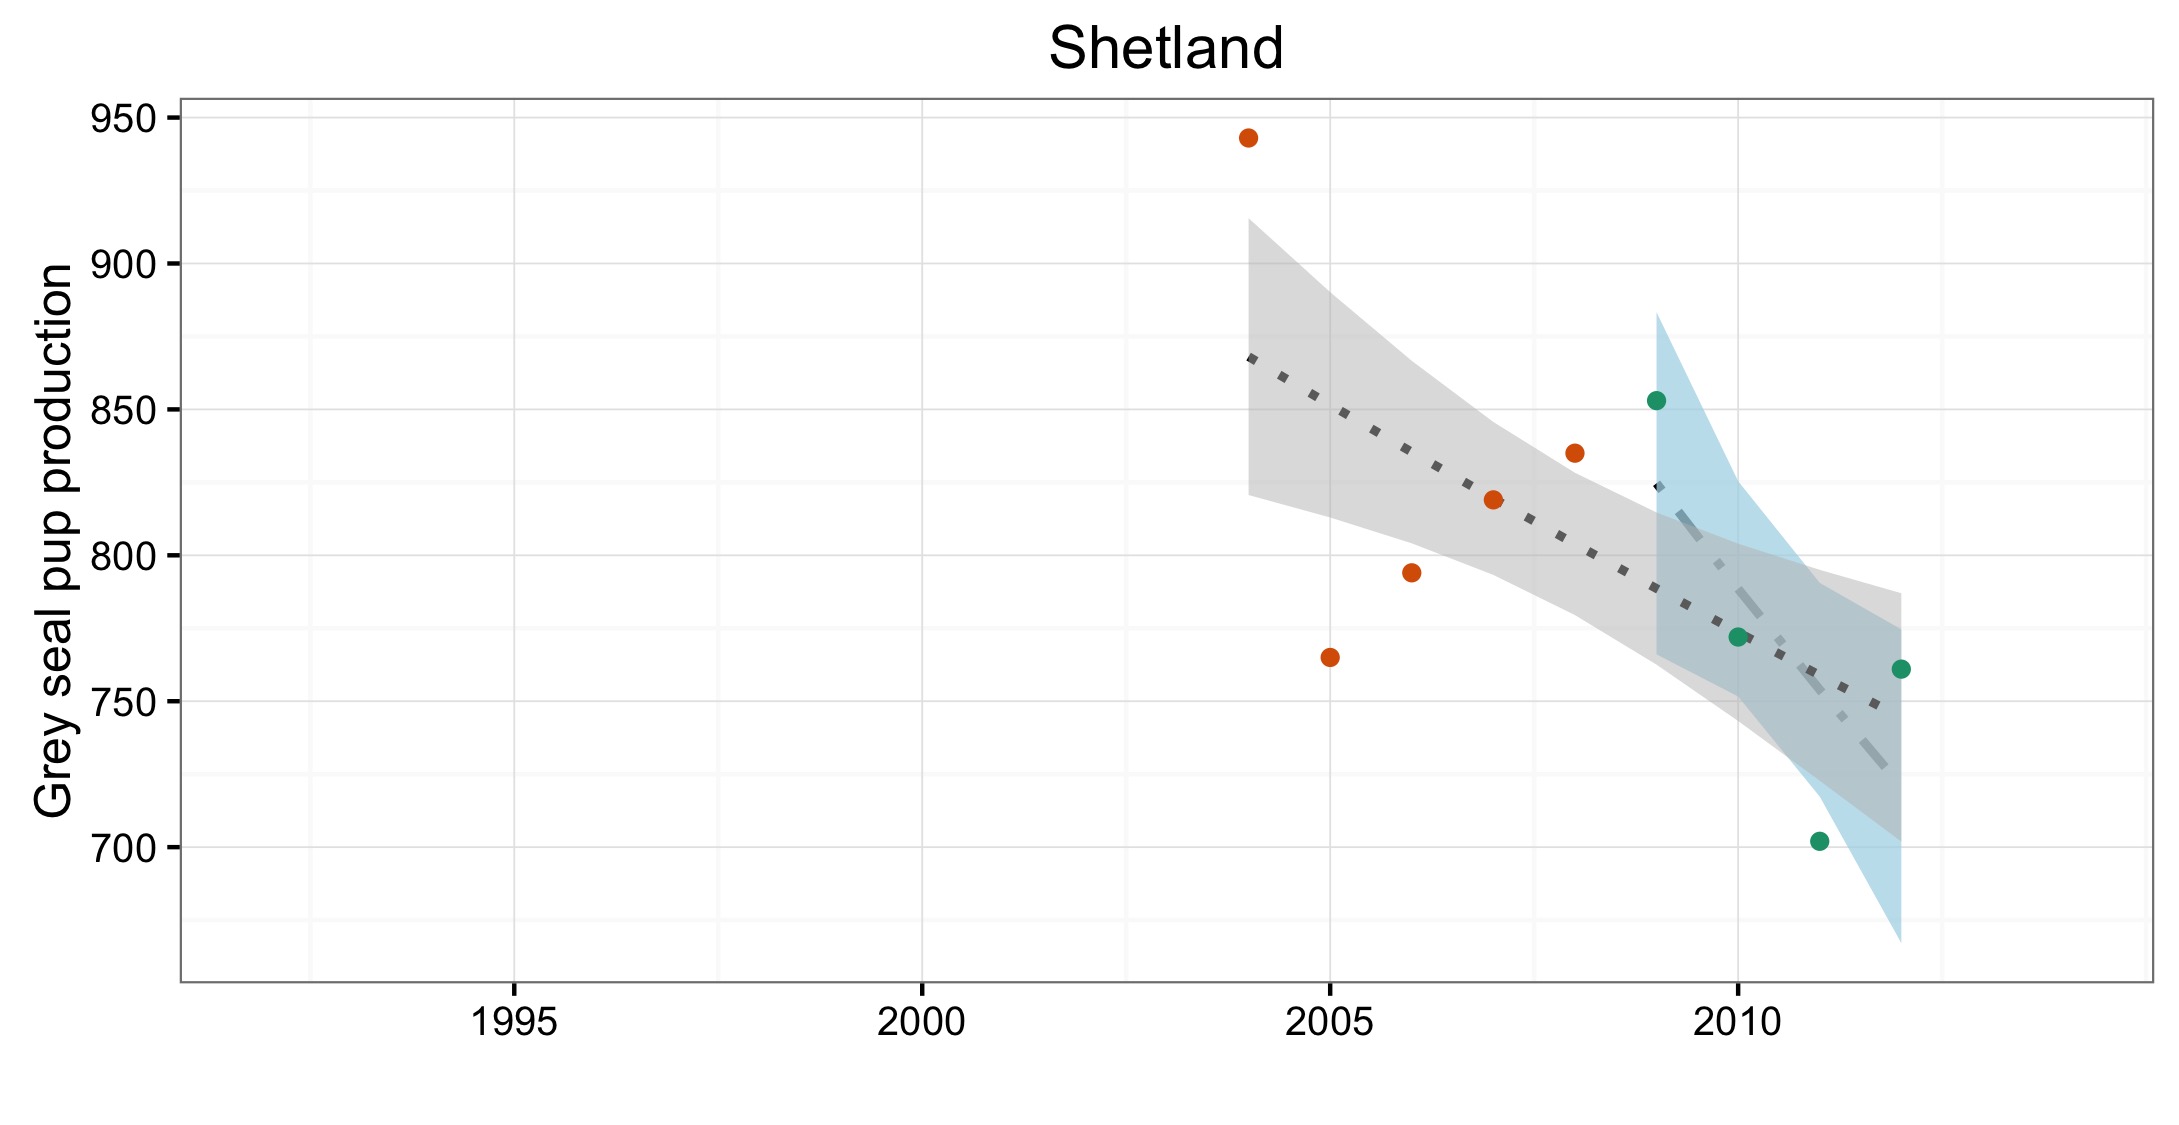
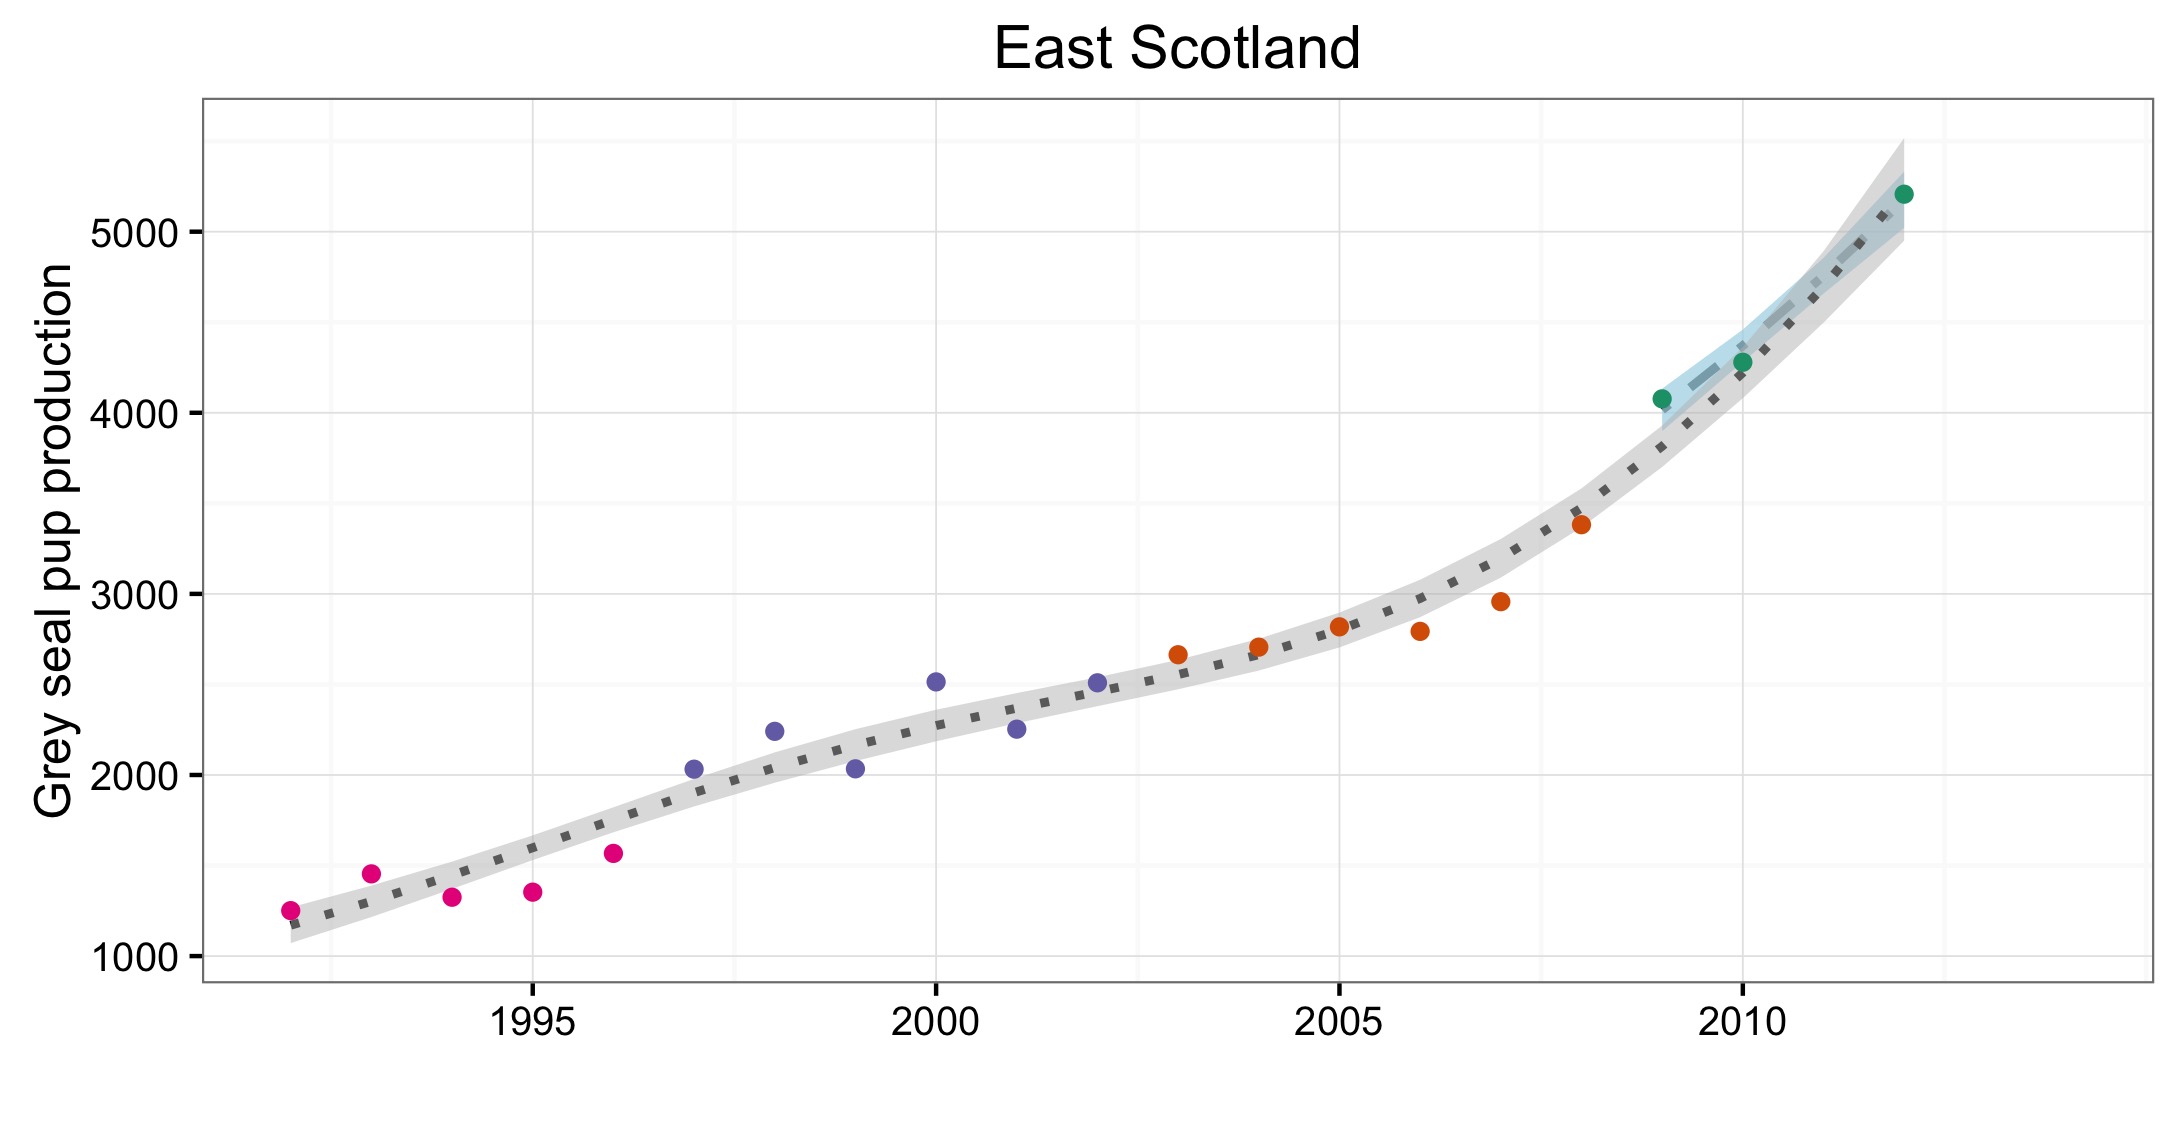
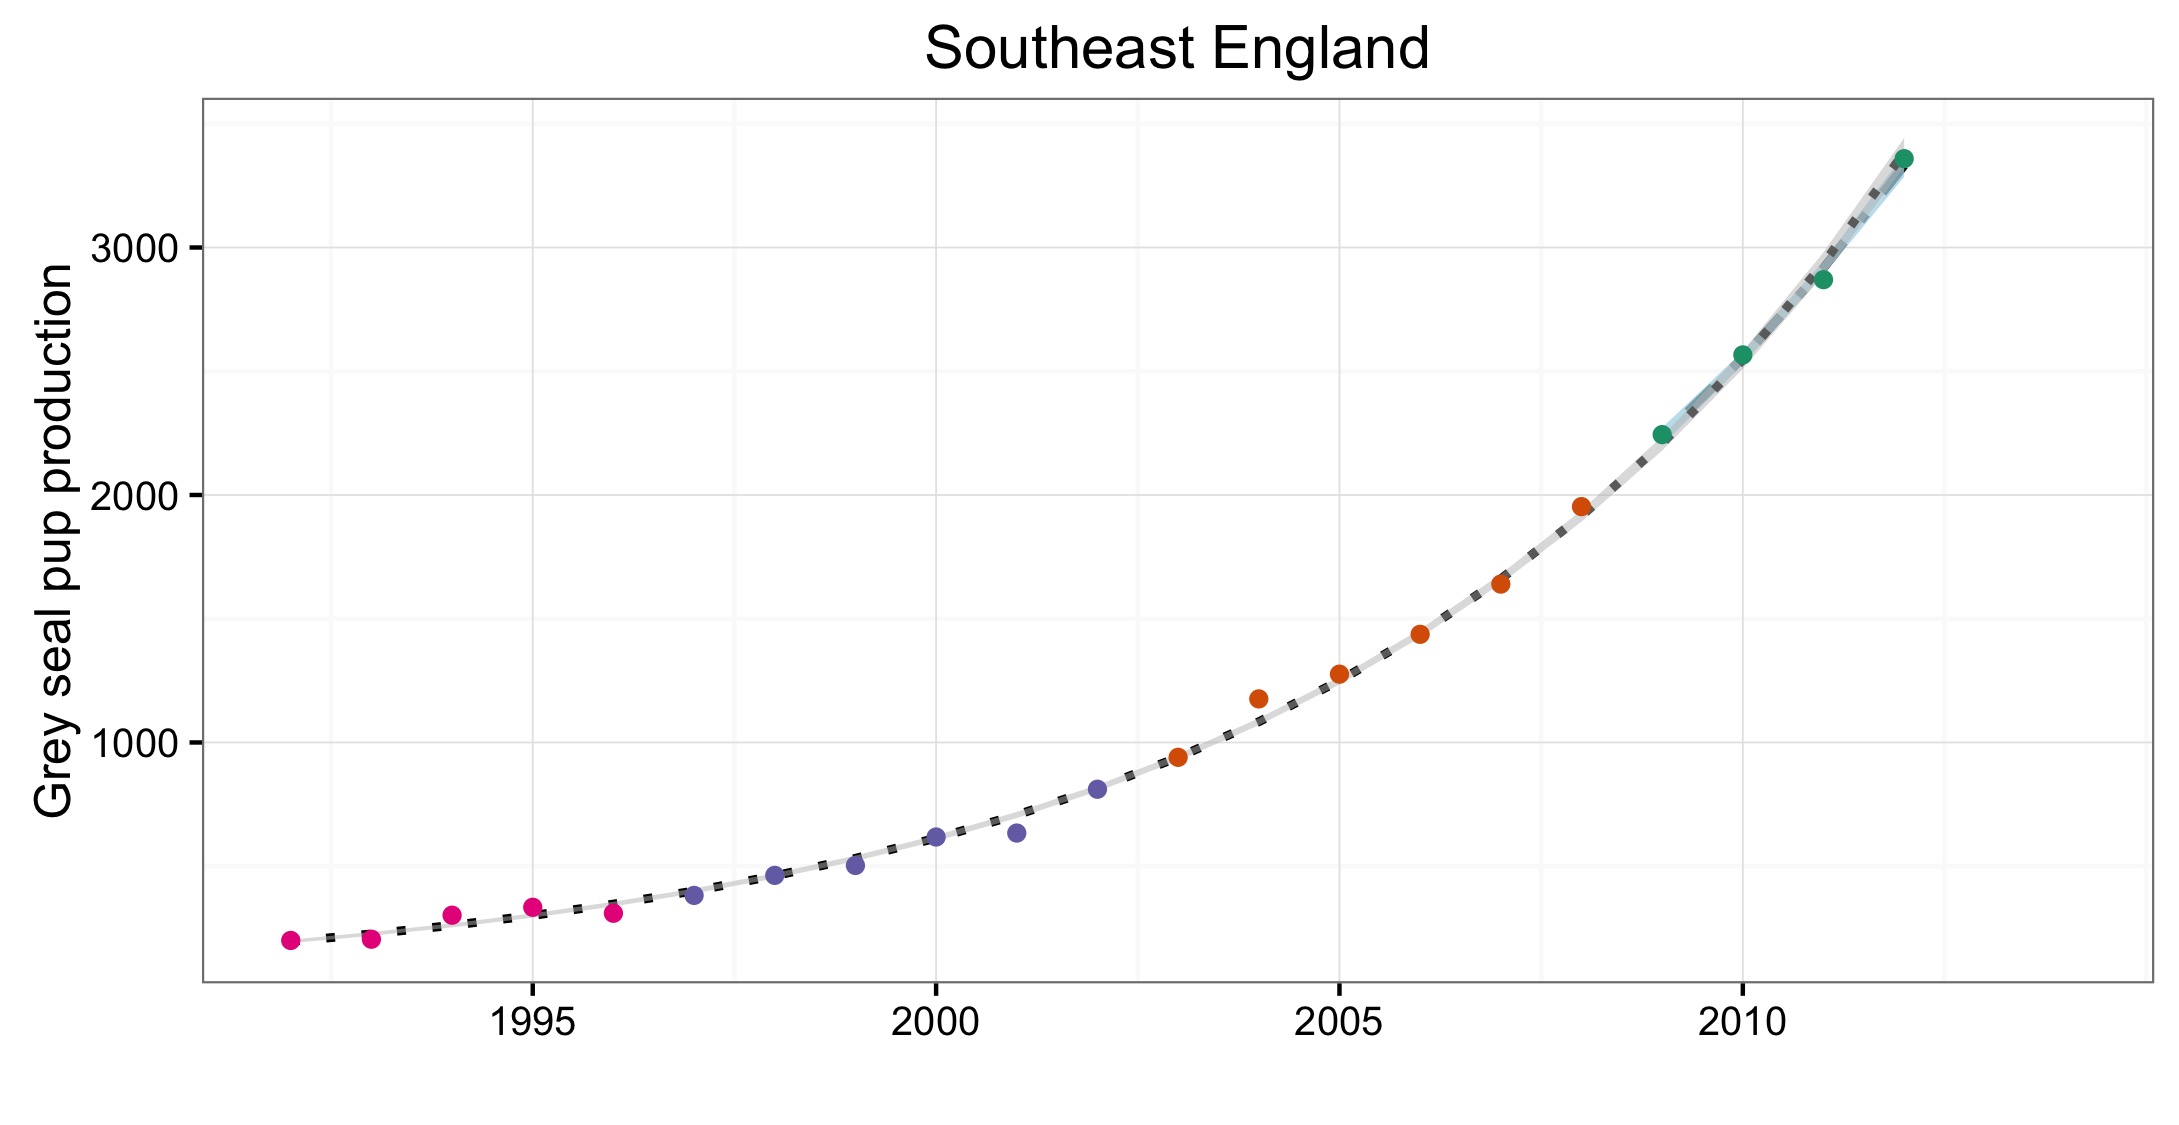
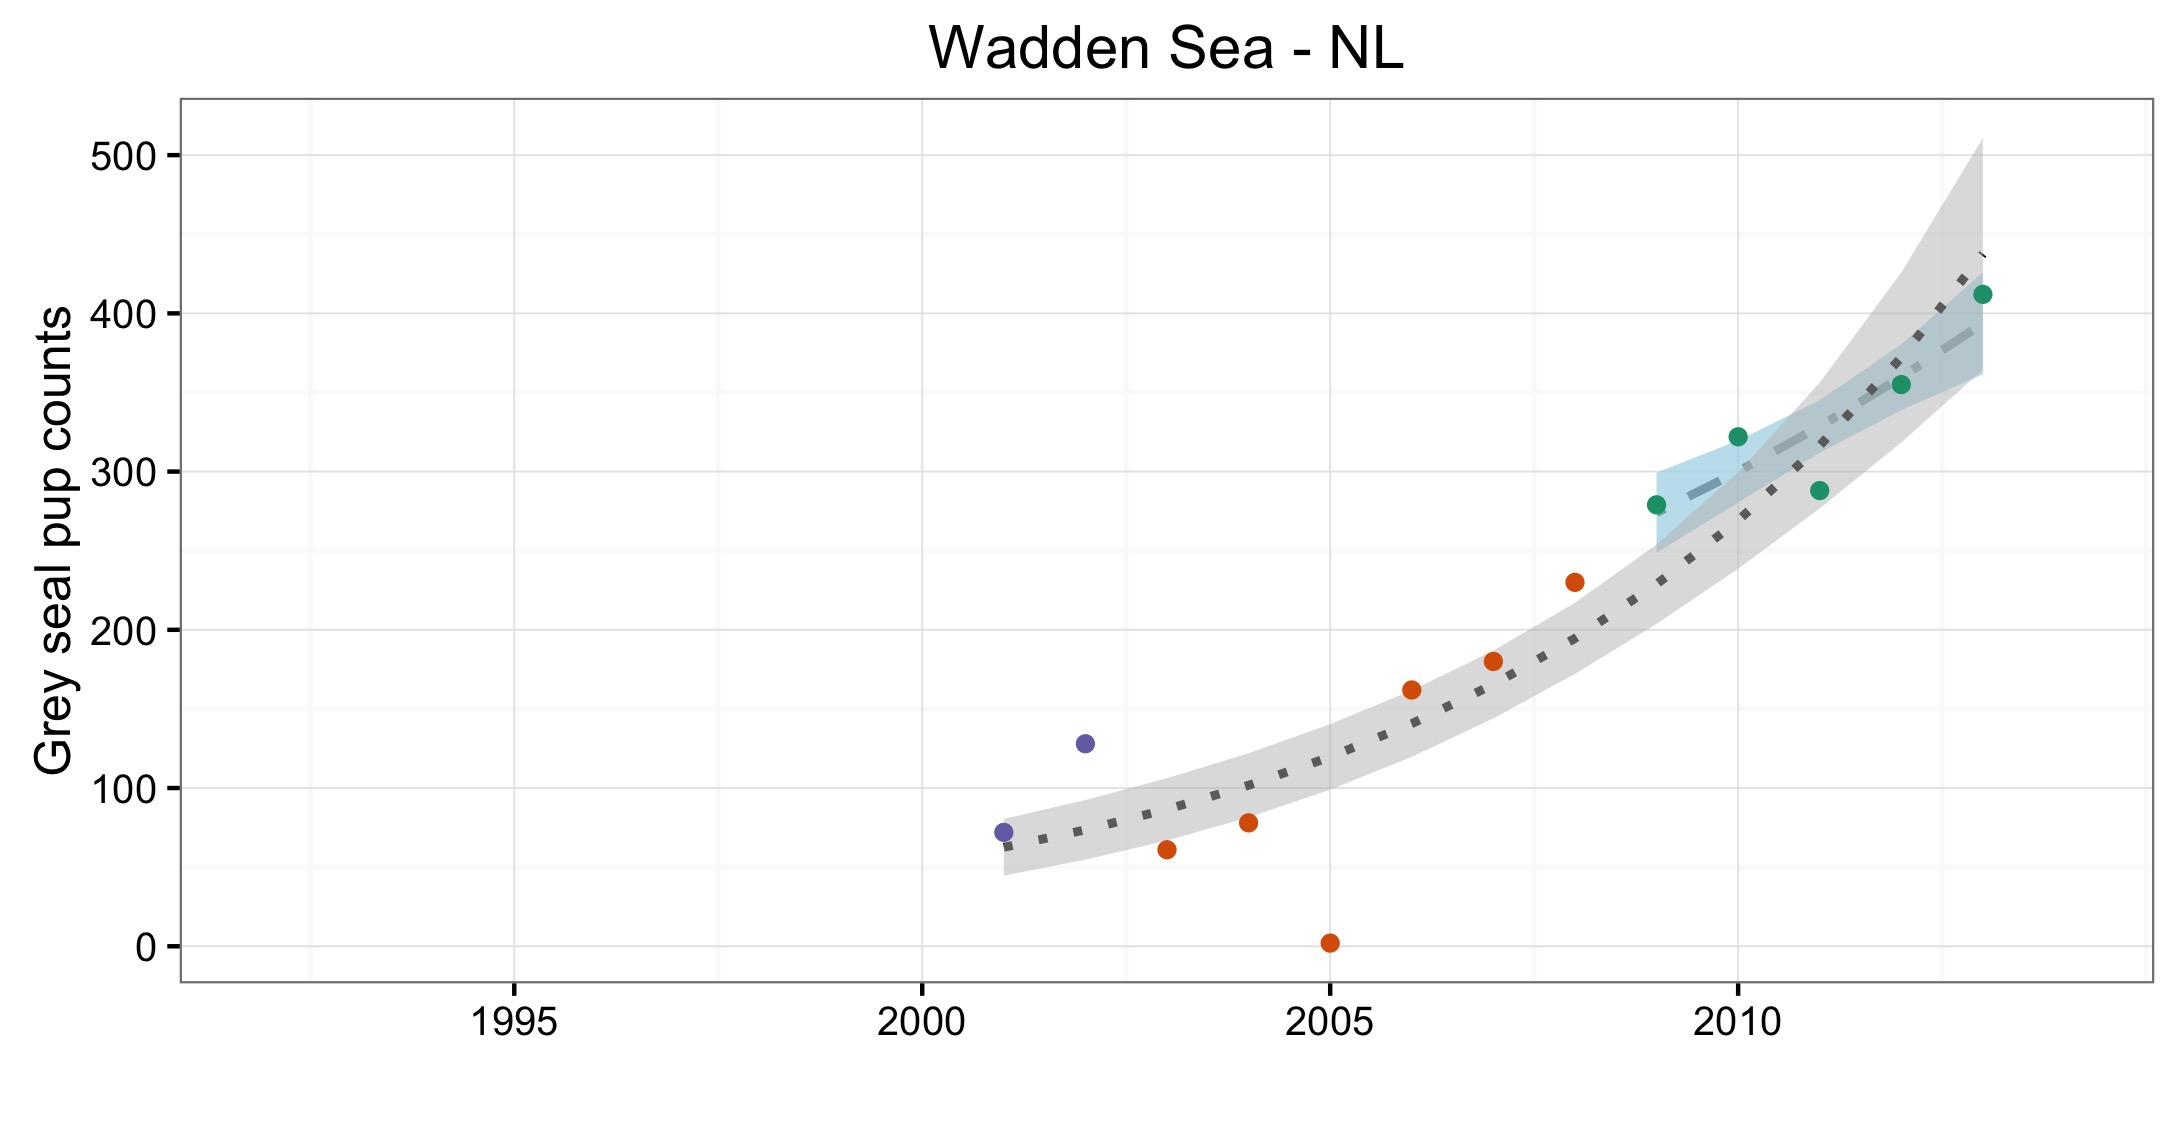
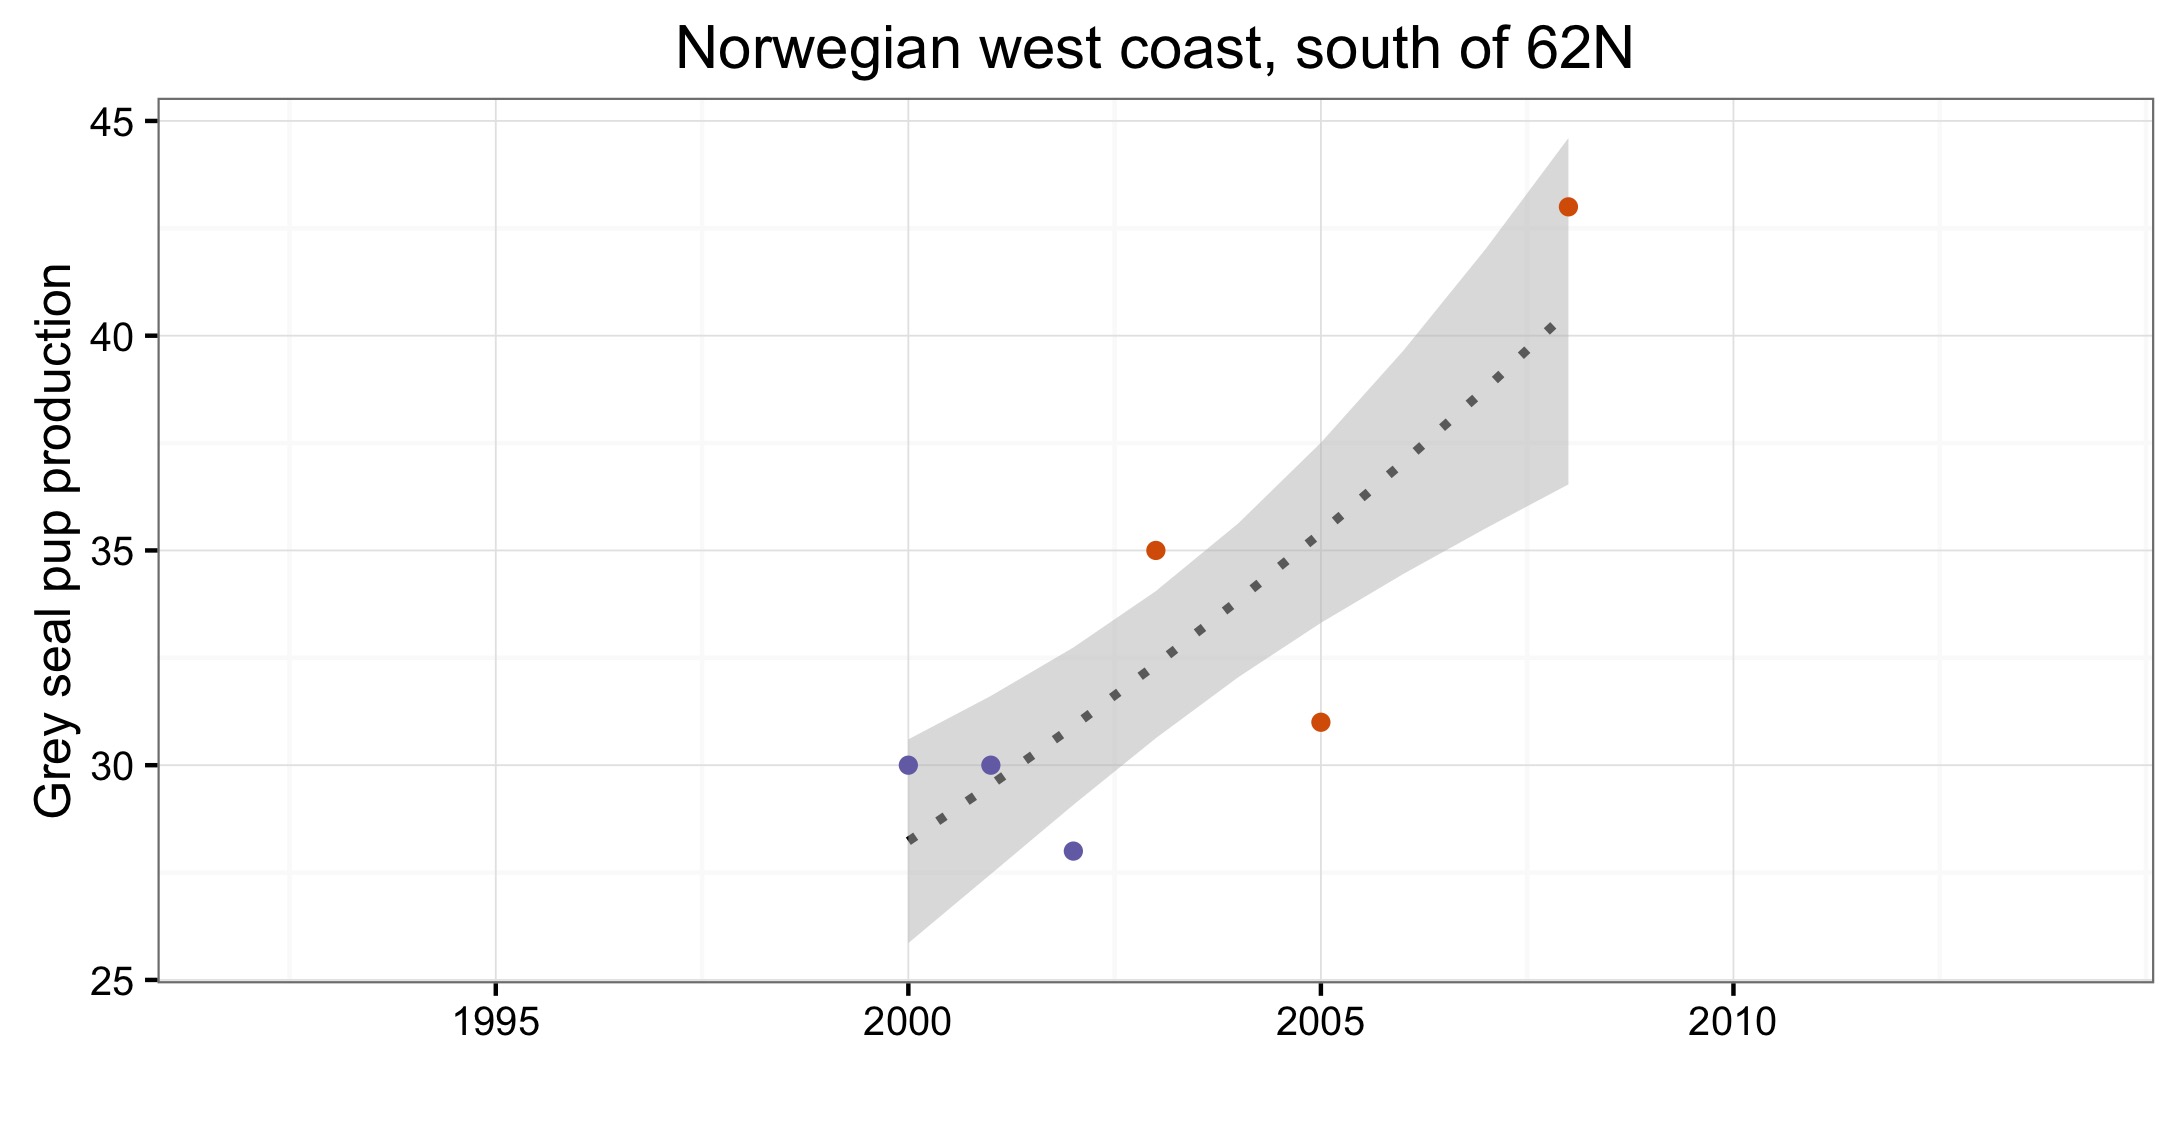
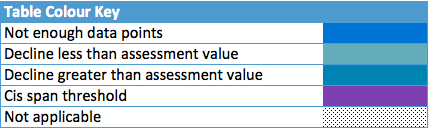
Figure c: Modelled trends in grey seal pup production in each Assessment Unit.
Points denote observed annual pup production, coloured according to four periods between 1992 and 2014: 1992–1996 (pink), 1997–2002 (purple), 2003–2008 (orange), 2009–2014 (green). Modelled trends in annual pup production are shown for the period from start of the time series (baseline year) to 2014 (dash line) and for 2009–2014 (dotted and dashed line); the 80% confidence interval around each trend is shown as a greyed area on the plot. Assessment Units: 3 West Scotland, 4 Western Isles, 5 North coast and Orkney, 6 Shetland, 7 Moray Firth, 8 East Scotland, 9 North-east England, 10 South-east England, 13 Wales, 17 Wadden Sea, 17a Wadden Sea – Netherlands only (longer time series), 21 Norwegian west coast, south of 62°N.
Perhaps most striking of the trends in Figure c was the continued rapid growth in grey seal pup production in Greater North Sea AUs. Here, it was also apparent that while total pup production in mainland AUs (e.g. the Wadden Sea, AU17) is small compared to that in the major areas to the northwest of the United Kingdom, they are also experiencing rapid growth similar to those areas in the Western North Sea (Figure c). Brasseur et al. (2015) described the recovery and continued growth of the largest grey seal population in mainland Europe (Wadden Sea, AU17) in more detail, noting that recolonisation was most likely by animals from the western North Sea colonies. The slower growth rates of colonies the Celtic Seas (e.g. West Scotland, AU3; Western Isles, AU4) has also been observed in more detailed analyses of United Kingdom grey seal pup production data and it has been suggested that these areas may be approaching carrying capacity (SCOS, 2014).
Assessment of confidence
There is moderate/low confidence in the methodology used in this assessment. There is consensus within the scientific community regarding this methodology therefore the confidence could be considered moderate, however as the method has been developed specifically for this assessment and not been more widely used it is considered moderate/low.
The assessment is undertaken using data with a spatial coverage and temporal extent that is mostly sufficient for the area assessed but gaps are apparent in certain areas. As such, confidence in data availability is moderate.
Conclusion
La production de jeunes phoques gris a augmenté, à long et court terme, dans toutes les zones évaluées de la mer du Nord au sens large (à l’exception des îles Shetland) et dans les parties des mers Celtiques couvertes par cette évaluation.
Il faut considérer les résultats de la production de jeunes phoques en même temps que ceux de l’indicateur commun de l’abondance et de la répartition des phoques. Les deux indicateurs révèlent une amélioration de la condition des populations de phoque gris dans l’Atlantique du Nord-Est mais il est probable que les populations se soient rétablies par rapport à une époque où elles étaient très appauvries par les activités humaines. Il est fort probable que la chasse, la pollution et la surpêche soient responsables de la réduction des populations ces dernières années et qu’elles continuent à les affecter. On ne connaît pas la capacité de charge naturelle pour le phoque gris dans l’Atlantique du Nord-Est. Il est évident que la production de jeunes phoques, même sans les pressions exercées par les activités humaines, ne peut augmenter indéfiniment et ralentira en même temps que la capacité de charge naturelle est atteinte.
Lacunes des connaissances
Plusieurs lacunes des connaissances doivent être abordées afin d’améliorer cette évaluation avant sa prochaine version. Actuellement, les données ne sont pas suffisantes dans certaines unités d’évaluation (AU) (Figure 1). La production de jeunes n’est qu’un indicateur partiel de l’état des populations, qui est également affecté par la fécondité des femelles, la survie et l’état physique des jeunes et cet aspect de l’indicateur pourrait être développé plus avant. Les informations concernant les impacts anthropiques sur la production de jeunes et le déplacement des phoques gris adultes entre AU, y compris l’impact de ce déplacement sur les populations, sont absentes.
It was not possible to make a quantitative assessment in all 21 Assessment Units (AUs) for several reasons. One being that grey seals may not breed in sufficient numbers in all AUs to warrant regular monitoring; in such cases the assessment area was considered ‘not applicable’ to this assessment (Figure 1). The remaining assessment gaps were due to a lack of sufficient annual data points to perform a quantitative assessment of the time series. Infrequent monitoring may be because there are relatively few animals breeding there and / or may be related to the difficulty in assessing breeding sites during the autumn and winter. Continued support for the long-term seal monitoring programmes in place within Contracting Parties will ensure that sufficient data are collected to provide quantitative assessments of grey seal pup production for those areas. The aggregation of data across national programmes in the North-East Atlantic provides a possibility for meta-analyses that place regional / national population trends into the wider regional context.
Pup production when used on its own is not a meaningful indicator of population condition. An ideal measure of population condition would include information on female fecundity and pup survival. Such demographic parameters are only available where long-term and detailed monitoring of colonies exists (e.g. Isle of May in Scotland). Another good indicator of population condition would be changes in body condition (e.g. blubber thickness).
From the present data it is not possible to exclude human influence on pup production. Even without pressure from human activities it is clear that pup production cannot keep increasing indefinitely and will reduce as the natural carrying capacity is reached. Further demographic studies could help predict the natural carrying capacity for the number of grey seals in the North-East Atlantic and provide an indication of likely future trends in pup production, with and without impacts from human pressures.
A demographic link between AUs is possible, but the extent of movement of adults between colonies and how this influences local pup production is at present poorly understood. Further international studies on the movements of individual seals could help better understand this and even prevent unintended disturbance of these inter-colony exchanges.
ICES 2014. Report of the working group on Marine Mammal Ecology (WGMME). 10-13 March, 2014 Woods Hole, Massachusetts, USA. ICES CM 2014/ACOM: 27, 230pp
NPWS (2013). The Status of Protected EU Habitats and Species in Ireland Overview Volume 1. Unpublished Report National Parks & Wildlife Services. Department of Arts, Heritage and the Gaeltacht Dublin Ireland.)
OSPAR, 2012. MSFD Advice Manual and Background Document on Biodiversity. Version 3.2. OSPAR Biodiversity Series. Available at: http://www.ospar.org/documents/dbase/publications/p00581/p00581_advice%20document%20d1_d2_d4_d6_biodiversity.pdf
Pomeroy, P. P., Twiss, S. D. and Redman, P. 2000. Philopatry, site fidelity and local kin associations within grey seal breeding colonies. Ethology: 899–919.
SCOS. 2014. Scientific advice on matters related to the management of seal populations, 2014. Currently available on the SCOS website at http://www.smru.st-and.ac.uk/documents/2259.pdf
Stringell, T., Millar, C., Sanderson, W., Westcott, S. and McMath, M. 2014. When aerial surveys will not do: grey seal pup production in cryptic habitats of Wales. Journal of the Marine Biological Association of the United Kingdom. 94: 1155-1159.
Brasseur, S., van Polanen Petel, T., Gerrodette, T., Meesters, E., Reijnders, P., Aarts, G. 2015. Rapid recovery of Dutch grey seal colonies fuelled by immigration. Marine Mammal Science. 31: 405-426.
SCOS. 2014. Scientific advice on matters related to the management of seal populations, 2014. Currently available on the SCOS website at http://www.smru.st-and.ac.uk/documents/2259.pdf