

Evaluation pilote de la production de phytoplancton
D4 - Réseau trophique marin
D4.1 - Productivité (production par unité de biomasse) des espèces ou groupes trophiques
Message clé:
Cette évaluation pilote étudie comment la production primaire de phytoplancton évolue au fil du temps. Les résultats révèlent des modifications propres à des sites mais ne permettent pas une conclusion généralisée pour toutes les régions OSPAR sur la base de la série de données actuelles. A l’avenir, cet indicateur pourrait permettre de comprendre les effets des mesures de gestion et fournir des informations sur les dynamiques de la production primaire, qui est fondamentale au soutien des réseaux trophiques marins.
Zone Évaluée
Récapitulatif Imprimable
Contexte
Le phytoplancton comprend des organismes microscopiques végétaux photosynthétiques. Les deux principaux groupes des systèmes côtiers sont les diatomées et les dinoflagellés. La production primaire de phytoplancton est fondamentale pour les écosystèmes marins et représente le premier flux d’énergie disponible dans les écosystèmes (Figure 1).
La production primaire de phytoplancton (c’est-à-dire la formation de matière organique) peut être mesurée sur place en utilisant des traceurs d’oxygène et de dioxyde de carbone ou diverses techniques fluorimétriques.
Diverses pressions, notamment l’enrichissement en nutriments, la disponibilité de la lumière, le broutage, les contaminants, les hydrodynamiques et le changement climatique affectent la production primaire de phytoplancton. La production primaire de phytoplancton est un indicateur utile des pressions exercées sur le réseau trophique marin. La capacité de récupération d’un écosystème à la suite de perturbations est un processus complexe; les informations sur la production primaire de phytoplancton, ainsi que les indicateurs des habitats pélagiques (par exemple biomasse, abondance et diversité du plancton) peuvent permettre de comprendre ce processus. Il n’existe actuellement aucune surveillance coordonnée de la production primaire de phytoplancton dans l’Atlantique du Nord-est. Cet indicateur est en cours de développement et l’évaluation actuelle démontre comment il pourrait fonctionner en utilisant les données disponibles.
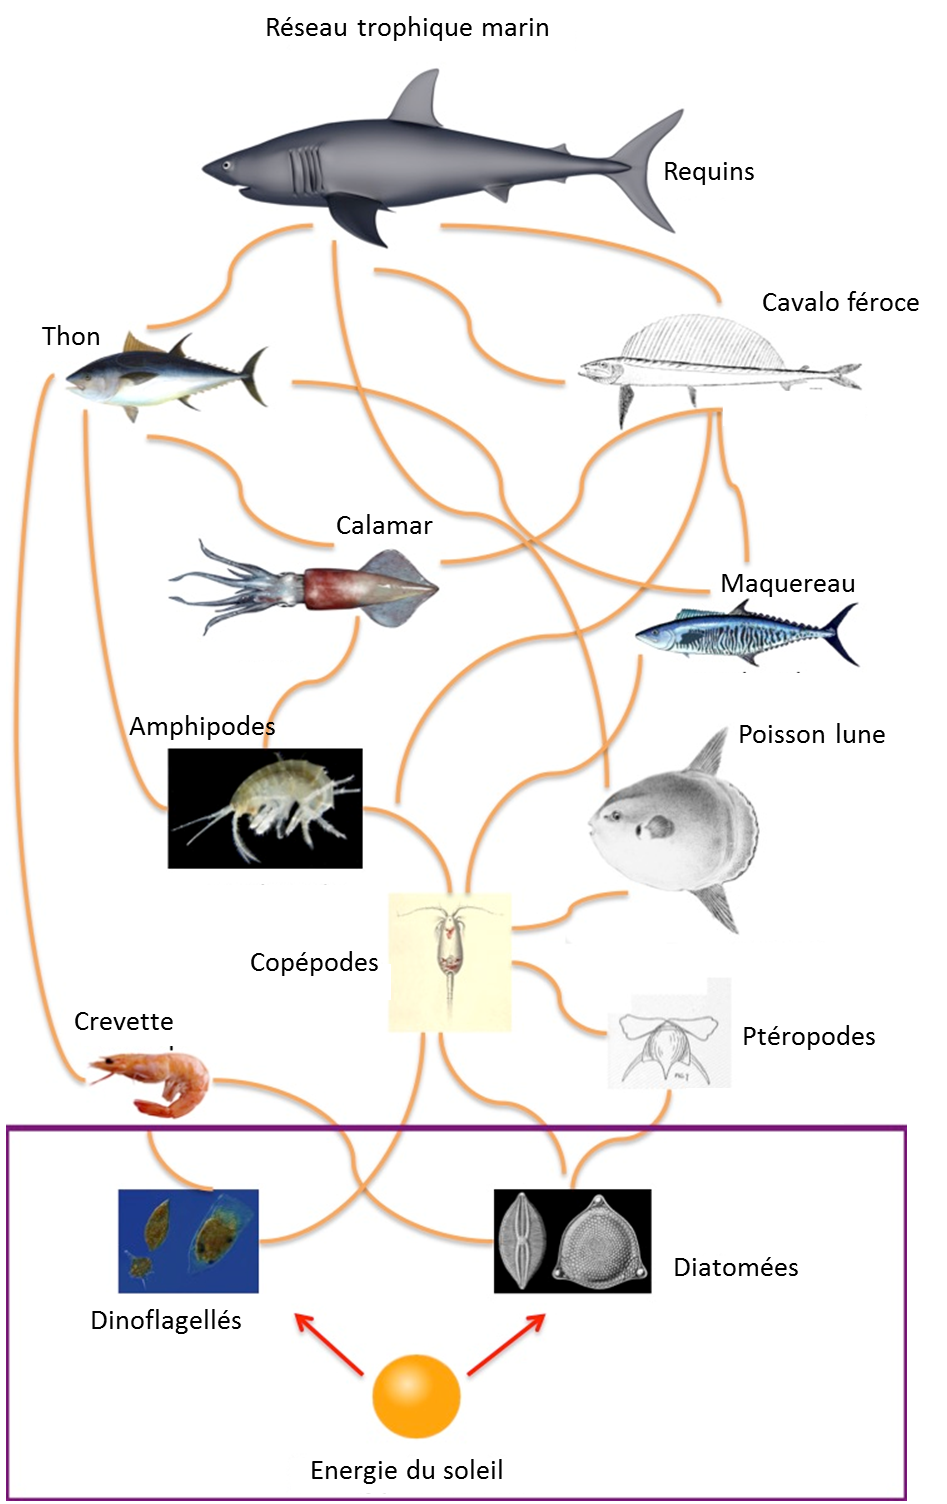
Figure 1: Représentation d’un réseau trophique marin (les encadrés mauves représentent la production primaire de phytoplancton)
Primary production is the synthesis of organic matter from inorganic compounds – carbon dioxide (CO2) and water (H2O) – with light as the energy source. Primary production principally occurs through the process of photosynthesis:
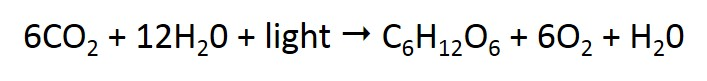
Figure a: Formula for the photosynthesis reaction.
Phytoplankton primary production represents the main production source of organic matter in the oceans. This production is a key process in the marine food webs since it represents the first input/flux of organic matter in the food web and fuels the microbial loop.
Phytoplankton micro-organisms are able, by the uptake of essential nutrients (e.g. nitrates, ammonia and phosphates), to synthesise lipids, proteins, nucleic acids and other major compounds.
In the marine environment, primary producers are represented by microalgae such as unicellular phytoplankton and phytobenthos, macroalgae and phanerogams (Houliez, 2012; Napoléon, 2012). Phytoplankton do not fit neatly into one taxonomic group and represent ten different classes from five to seven different kingdoms. Unicellular phytoplankton varies in size from less than one micrometre (μm) to approximately one millimetre in length or more (colonial forms). There is also diversity in the shape, pigments, and cell wall of phytoplankton. The two major groups in coastal systems are diatoms and dinoflagellates.
Phytoplankton primary production is an important indicator in ecosystem assessment (Nixon, 1995; Tett et al., 2007; Gaichas et al., 2009) and varies from area to area (e.g. coastal versus offshore). Technical advice from the International Council for the Exploration of the Sea (ICES) recognises phytoplankton primary production as a promising indicator in ecosystem assessment for implementing the European Union Marine Strategy Framework Directive (MSFD) (ICES 2014a,b,c; Rogers et al., 2010). In 2004, ICES held a workshop on the revision of the 2010 European Union Commission Decision on criteria and methodological standards on good environmental status (GES) of marine waters; advice from the workshop included using phytoplankton primary production as an indicator for food webs (ICES 2014c).
Phytoplankton primary production is a highly sensitive indicator that may respond to multiple pressures. For example (in no order of priority): changes in the physical conditions of the water column, such as hydrodynamics, light, and climate (Cole and Cloern, 1987), anthropogenic nutrient enrichment (e.g. eutrophication, Cadee and Hegeman, 2002; land-use management), grazing (e.g. marine aquaculture, Prins et al., 1997), contaminants (e.g. wastewater, herbicides, anti-foulants, and heavy metals, Fitzwater et al., 1982; Pinto et al., 2003), non-indigenous species (e.g. the Ctenophora Mnemiopsis leidyi, Oguz et al., 2001) and climate change. As phytoplankton can grow and reproduce quickly, they can respond and acclimate their productivity in response to natural and human-induced pressures. Indeed the large plasticity of phytoplankton physiology could lead to high variations in carbon fixation efficiency (Ayata et al., 2014). Hence, phytoplankton primary production can act as a warning signal providing complementary information to other indicators, and allowing for a broader and more holistic view of the state of the ecosystem, as well as informing and supporting science, policy, and management (Shephard et al., 2015). However, ascribing changes in phytoplankton primary production directly to anthropogenic pressures is difficult.
Phytoplankton primary production can be measured in situ using oxygen and carbon dioxide tracers or various fluorometric techniques. On a global scale, phytoplankton primary production can be estimated with models calibrated with in situ data and using satellite data. The case studies used for the scientific development of this assessment are based on these different methods. Although primary production estimates can vary between methods, Regaudie-de-Gioux et al. (2014) have shown that estimates of production obtained from different techniques can, to some extent, be converted one into another and integrated.
As primary production is affected by different environmental conditions, it is expected to vary from one region to another (Gaichas et al., 2009; OSPAR, 2000; Cloern et al., 2014). Therefore, assessment values should be specifically defined for each pilot area.
Phytoplankton primary production can be measured using different methods, sampling strategies and sampling design (see OSPAR, in prep., Kromkamp et al., 2017). The method adopted to measure production should not affect the assessment as long as the result (Annual Primary Production-APP) is expressed in common units (i.e. gC/m2/y).
Assessment Data
Phytoplankton primary production is monitored at both spatial and temporal scales:
- spatial scale: local (fixed stations), along lines (transects, mobile data collection), large area (satellites, models)
- temporal scale: seasonal, annual and multiannual, long time series.
The datasets used for this pilot assessment have been collated from different research projects carried out by experts from the OSPAR food web expert group and from peer-reviewed scientific publications. The techniques that were used to estimate primary production varied, for example carbon or oxygen isotope techniques or fluorometric techniques. The datasets have different temporal and spatial scales, some representing time series of regular phytoplankton primary production measurements carried out at specific sites, with others based on annual, seasonal or episodic studies.
The assessment method has been developed to integrate heterogeneous datasets from scientific case studies through a step-by-step approach (OSPAR, in prep.). There was a need to identify existing monitoring and to propose a coordinated approach for OSPAR in order to progress toward a full assessment for the next cycle.
Assessment Criteria
Although assessment criteria were not applied in this pilot assessment, it should be noted that assessment criteria of primary production in a full; assessment would depend on the data availability.
Assessment Methodology
Assessing Temporal Trends
1 to 2 years: no model is fitted as there are not enough years available for a statistical analysis
3 to 6 years: calculation of mean but no trend assessment (not enough years of data)
6+ years: linear trend to assess status and evidence of temporal change.
Assessment Scale
Station and transect datasets are scaled up to the ecohydrodynamic regions when relevant. For the North Sea, the ecohydrodynamic regions were defined according to van Leeuwen et al. (2015) and for the English Channel according to Gailhard-Rocher et al. (2012).
Assessment Study Sites
Table a lists the time series locations and the relevant techniques and methodologies used.
| Study site | Technique | Sampling Design | |
|---|---|---|---|
| North Sea | Semi-empirical algorithm | Ecohydrodynamic zones | |
| Skaggerak Coast | ¹⁴C | Station | |
| Sylt-Rømø Bight | Oxygen | Station | |
| Central and Western English Channel | Portsmouth-Ouistreham transects | PAM, ¹³C | Transect |
| Baie des Veys | ¹⁴C | Station | |
| Roscoff-Plymouth transects | PAM, ¹³C | Transect | |
| Western English Channel Plymouth L4 Station | Absorption based algorithm model | Station | |
| Celtic Sea Shelf Break | ¹⁴C | Station | |
| Liverpool Bay | Chla based model | Station | |
| Eastern English Channel Wimereux and the Strait of Dover | ¹⁴C, PAM | Station and Transect | |
14C: method measuring the fixation of radioactive 14CO2 by phytoplankton; 13C: method measuring the fixation of non-radioactive 13CO2; Oxygen: incubation of light/dark bottles, changes in the ambient pO2, changes in the 02/Ar – ratio, triple isotope method; PAM (Pulse Amplitude Modulated): method quantifying the variation of fluorescence emitted by phytoplankton after being excited with light pulses of saturation or increasing light levels, Absorption based model: method measuring the absorption at the red Chlorophyll a absorption peak, Chla based model: method based on Chlorophyll a biomass, Semi-empirical algorithm is based on chlorophyll a concentrations, photic depth and surface irradiance (Kromkamp et al., 2017).
Résultats
Les mesures de plusieurs sites d’étude (Figure 2) ont été analysées et utilisées pour étayer l’évaluation pilote de cet indicateur. On peut relever, pour chacun d’entre eux, les variations de la production primaire annuelle (APP) au fil du temps.
Les résultats des neuf sites d’étude analysés dans l’évaluation pilote figurent dans le tableau 1.
La différence entre la variabilité naturelle d’un état stable et une modification de l’état a été étudiée grâce à une analyse statistique. On ne peut pas généraliser, pour tous les sites inclus dans cette étude pilote, le lien qui existe entre la variation des tendances, qu’elles soient à la baisse ou à la hausse, et les pressions exercées sur les écosystèmes.
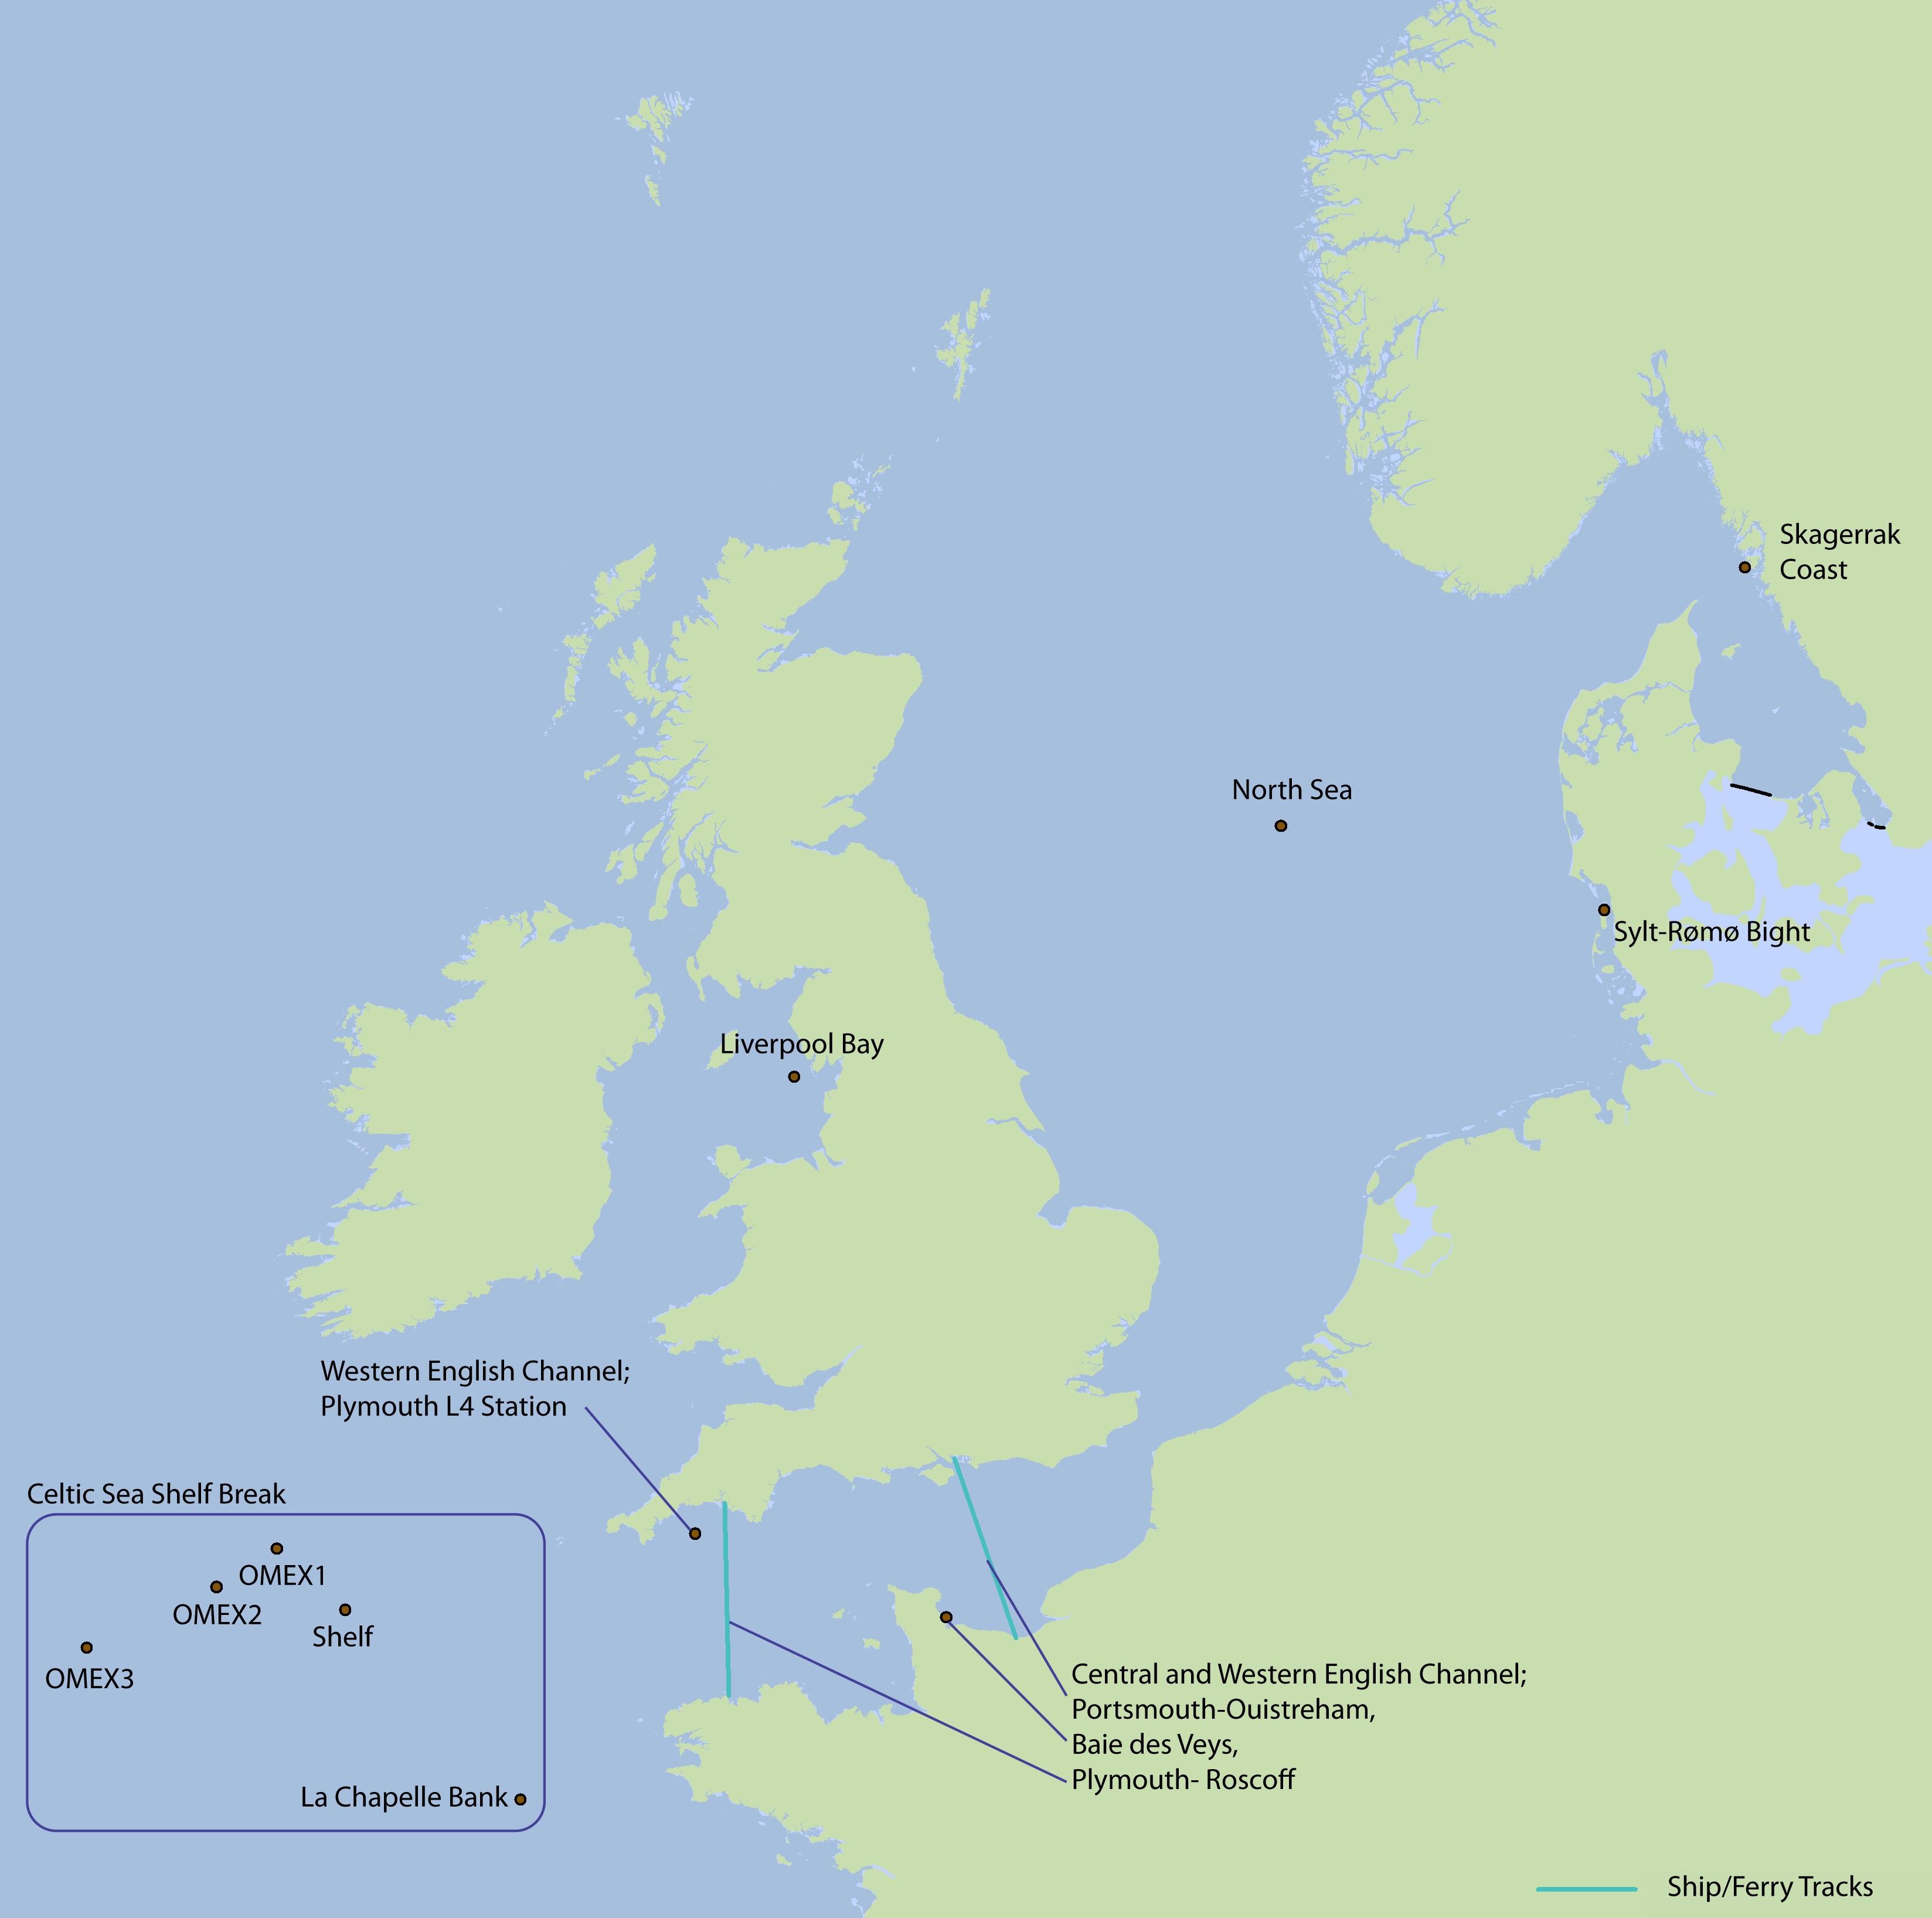
Figure 2: Carte indiquant l’emplacement des sites d’étude
OMEX: Projet Ocean Margin Exchange (OMEX).
| Site d’étude | Résultats | |
|---|---|---|
| Mer du Nord | La région écohydrodynamique UNC (non répertoriée pour la stratification de la colonne d’eau) révèle une tendance à la baisse de la production annuelle de phytoplancton à partir du début de la série temporelle (1988-2013); on ne sait pas encore ce qui cause ces modifications. | |
| Côte du Skagerrak | La tendance à long terme de la production primaire a décliné entre 1985 et 2012 mais on relève une tendance à la hausse de 1992 à 1996. | |
| Baie de Sylt-Rømø (Allemagne, Danemark) | On ne relève aucune tendance durant la période de 1994 à 2014 et les pressions exercées par les activités humaines ont peu d’impact sur la production primaire. | |
| Manche centrale et occidentale | Transects Portsmouth-Ouistreham | Les estimations annuelles (côtières et au large) révèlent un gradient décroissant pour la production primaire de la côte française au large, qui pourrait être dû aux apports côtiers en nutriments provenant de la Seine. |
| Baie des Veys | Les estimations annuelles révèlent une production primaire côtière élevée liée aux apports fluviaux en nutriments ce qui étaye à son tour la conchyliculture. | |
| Transects Roscoff-Plymouth | La comparaison des estimations annuelles au large des deux transects (Portsmouth-Ouistreham et Roscoff-Plymouth) révèle une stabilité interannuelle du large permettant de caractériser ces zones hydrodynamiques du large (c’est-à-dire les masses d’eau). | |
| Station Plymouth L4 Manche occidentale | On ne relève aucune tendance pour la période de 2003 à 2010. | |
| Rebord du plateau de la mer Celtique | L’estimation annuelle n’est disponible que pour 2001. | |
| Baie de Liverpool | On ne relève aucune tendance pour la période de 2003 à 2009. | |
This section presents detailed information concerning the nine study sites used to support the pilot assessment.
The Greater North Sea
North Sea
Time series of annual primary production (APP) at different ecohydrodynamic regions of the North Sea (based on van Leeuwen et al., 2015) were calculated by an empirical model (Cloern, 1987) using observations of chlorophyll, Kd (light attenuation coefficient) and surface irradiance (Capuzzo et al., in prep.). Results showed that APP has varied widely over the past 25+ years, over time and between ecohydrodynamic regions. For example, the fresh water influence region (FWI) showed the highest level of production while the seasonally stratified (SSR) and permanently mixed (PMX) regions showed the lowest (Figure c). The unclassified (UNC) ecohydrodynamic region showed a decreasing trend in APP from the start of the time series. These changes in primary production are likely to be driven by different causes/pressures, such as changes in the light climate (Capuzzo et al., 2015), and are currently under investigation (Capuzzo et al., in prep.).
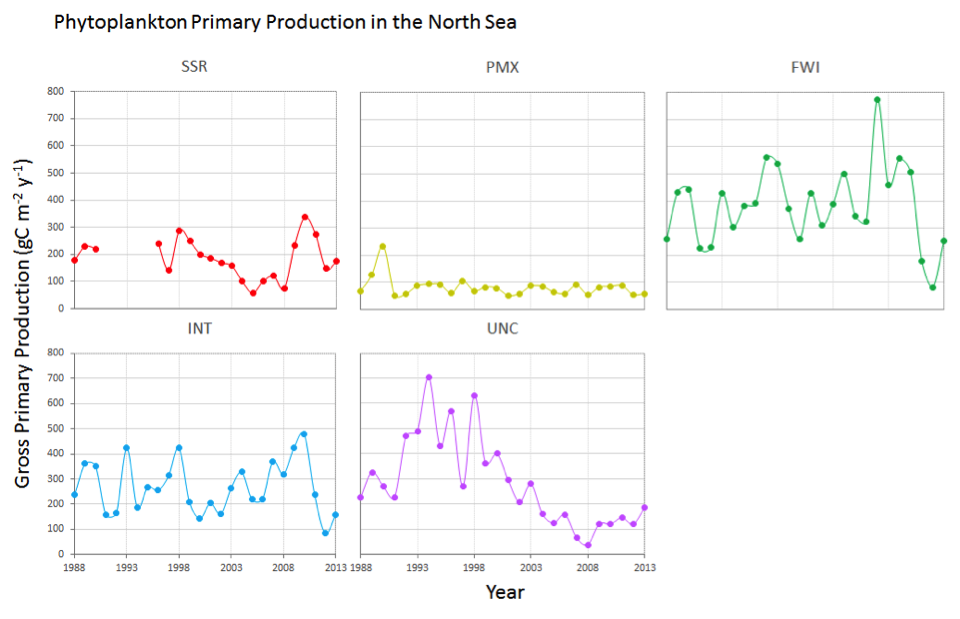
Figure c: Annual primary production at five ecohydrodynamic regions in the North Sea (based on van Leeuwen et al., 2015)
SSR = seasonally stratified region; PMX = permanently mixed region; FWI = freshwater influence region; INT = intermittently stratified region; UNC = unclassified region
Skagerrak Coast
The study site on the Skagerrak coast is located at the entrance of Gullmar Fjord on the Swedish coast. The data set spans the period 1985–2012. APP showed a significant long-term trend over this period (Figure d), but with a tendency for increased rates between 1992 and 1996 (Tiselius et al., 2015).
In the Sylt-Rømø Bight, APP shows interannual variability and no long-term trend (Figure e). This site is relatively unimpacted by human pressures at the local scale. The interannual variability is thus due to natural environmental variability (Baird et al., 2011).
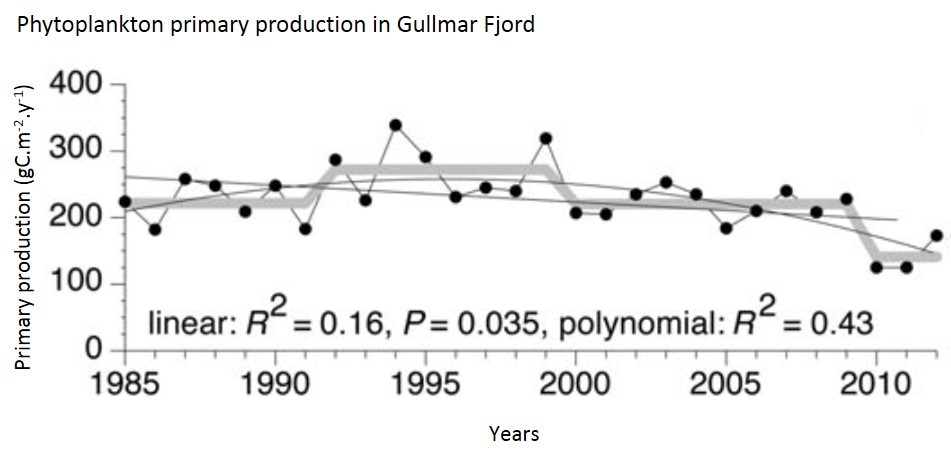
Figure d: Annual primary production in the Skagerrak
(based on Tiselius et al., 2015) Sylt-Rømø Bight, Germany and Denmark.
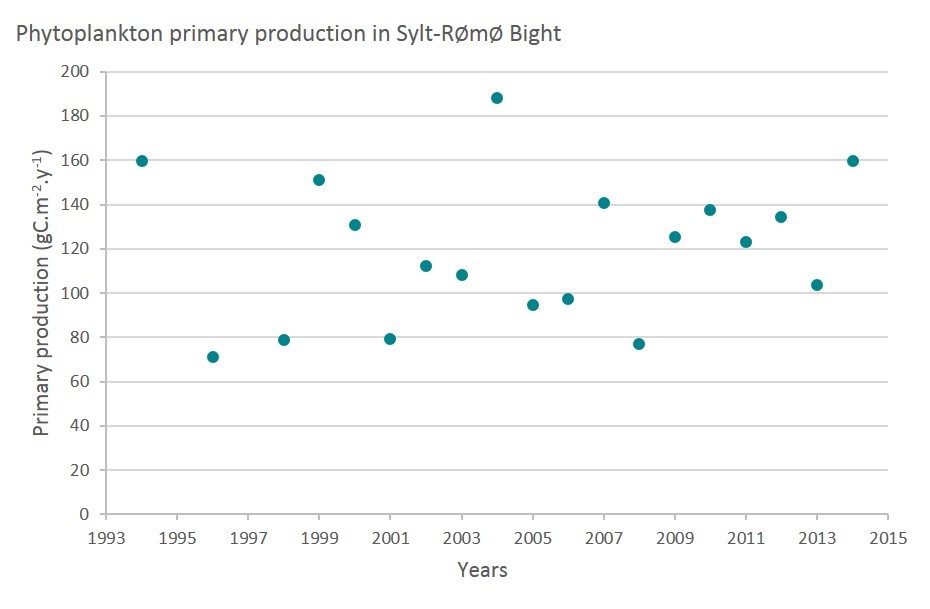
Figure e: Annual primary production at Sylt-Rømø Bight, Germany and Denmark.
Central and Western English Channel – Ship Track Portsmouth-Ouistreham, Ship Track Roscoff-Plymouth and Baie Des Veys
Annual primary production was measured at five water bodies in the Central and Western English Channel over three periods of time. The five water bodies correspond to five different water masses according to Gailhard-Rocher et al. (2012) (Figure f). Data were collected on ship (ferry) tracks between Portsmouth and Ouistreham (water bodies 1, 2 and 3) and Plymouth and Roscoff (water body 5) and from a coastal area (water body 4) known as Baie des Veys.
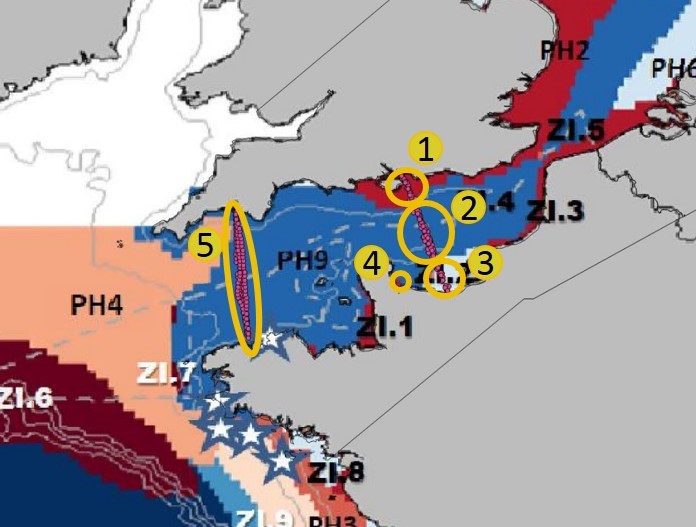
Figure f: Water bodies in the Western and Central English Channel corresponding to five different hydrodynamic zones according to Gailhard-Rocher et al. (2012)
Data were collected first in 2002/2003 in Baie des Veys (Figure g).
Five stations were monitored in Baie des Veys (Estuary, East, North, West, South) (Jouenne et al., 2005). The APP was highest in the estuary (approximately 400 gC/m2/y), characterising a zone with high levels of nutrients inputs. At the other stations, APP was approximately 180–250 gC/m2/y. These high APP values are consistent with large riverine nutrient inputs to a shallow ecosystem. The high APP supports an important local shellfish fishery.
In 2009/2010, data were collected during one year on a ship track between Portsmouth (United Kingdom) and Ouistreham (France). Based on the hydrodynamic regions defined by Gailhard-Rocher et al. (2012), the dataset was subdivided to generate one APP value per ecohydrodynamic region.
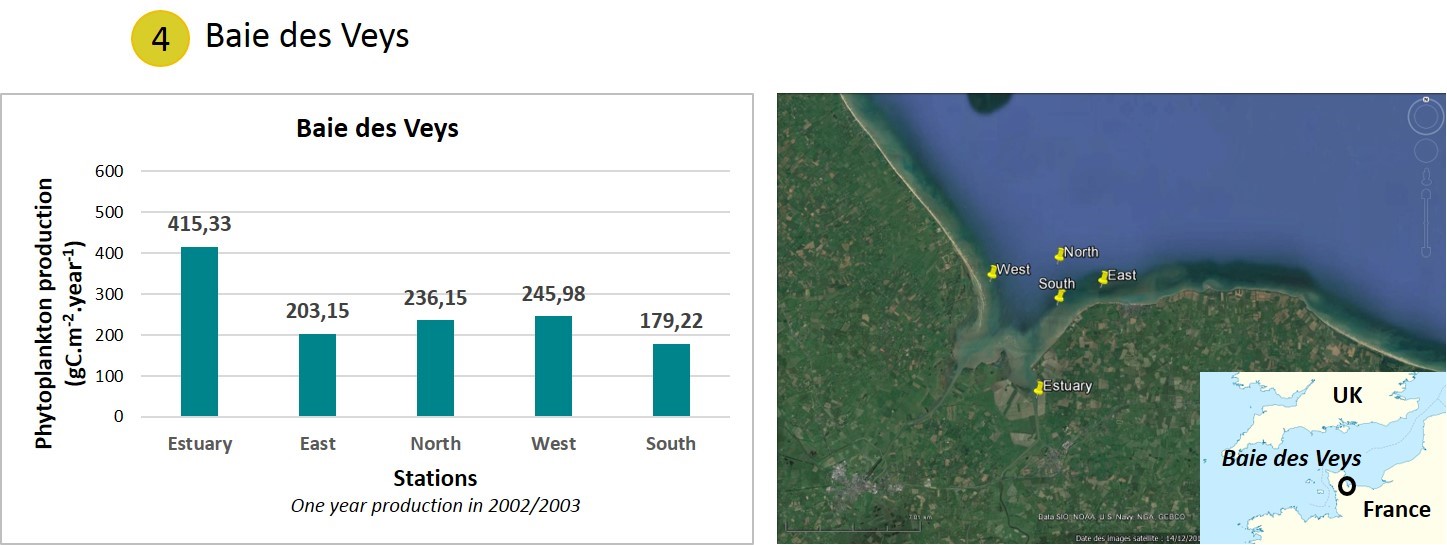
Figure g: Annual phytoplankton production in Baie de Veys (France) measured during one year in 2002/2003.
The French coastal region (Figure h, water body 3) had a higher APP value than either the United Kingdom coastal region (Figure h, water body 1) or the central English Channel (Figure h, water body 2). These values are representative of a gradient in nutrient concentrations from the Seine river (water body 3) to offshore areas (water body 2). The phytoplankton primary production at water body 3 is mainly light-limited because nutrients from the Seine are abundant whereas production at water bodies 2 and 3 is mainly nutrient-limited. When comparing the two coastal areas (water bodies 1 and 3), the lower phytoplankton primary production at water body 1 can be explained by the absence of a large river input on this part of the United Kingdom coast in contrast to the situation on the French coast (Napoléon et al., 2012; Napoléon and Claquin, 2012).
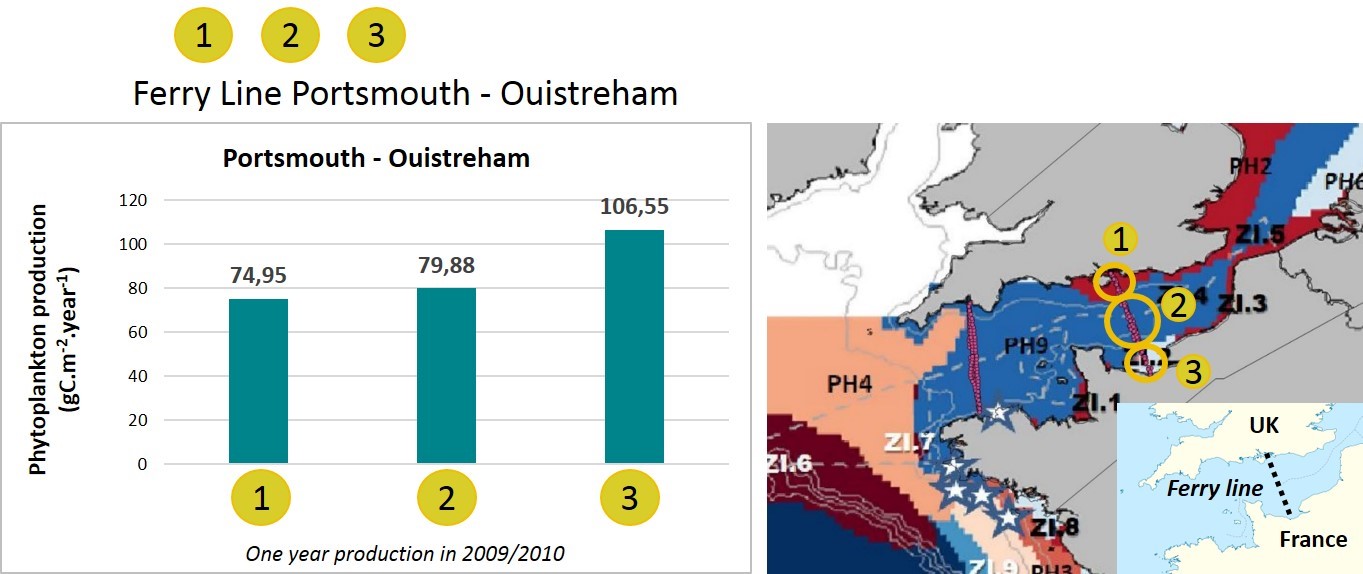
Figure h: Annual phytoplankton production in three different water masses measured on a ship track between Portsmouth (United Kingdom) and Ouistreham (France) in 2009/2010.
In 2010/2011, data were collected during one year on a ship track between Roscoff (France) and Plymouth (United Kingdom). This ship track covered one hydrodynamic region based on Gailhard-Rocher et al., (2012) (Figure i, water body 5). This water body can be compared to the English Channel offshore area (water body 2) from the Portsmouth-Ouistreham transect. Phytoplankton primary production is also nutrient-limited in this area.
This dataset indicated the consistency of the indicator in the offshore area (blue zone on the map, Figure i). The phytoplankton primary production values are consistent over the two years of monitoring (2009/2010 and 2010/2011) in the two different zones (water body 2 and 5, Figure i) of the same hydrodynamic region.
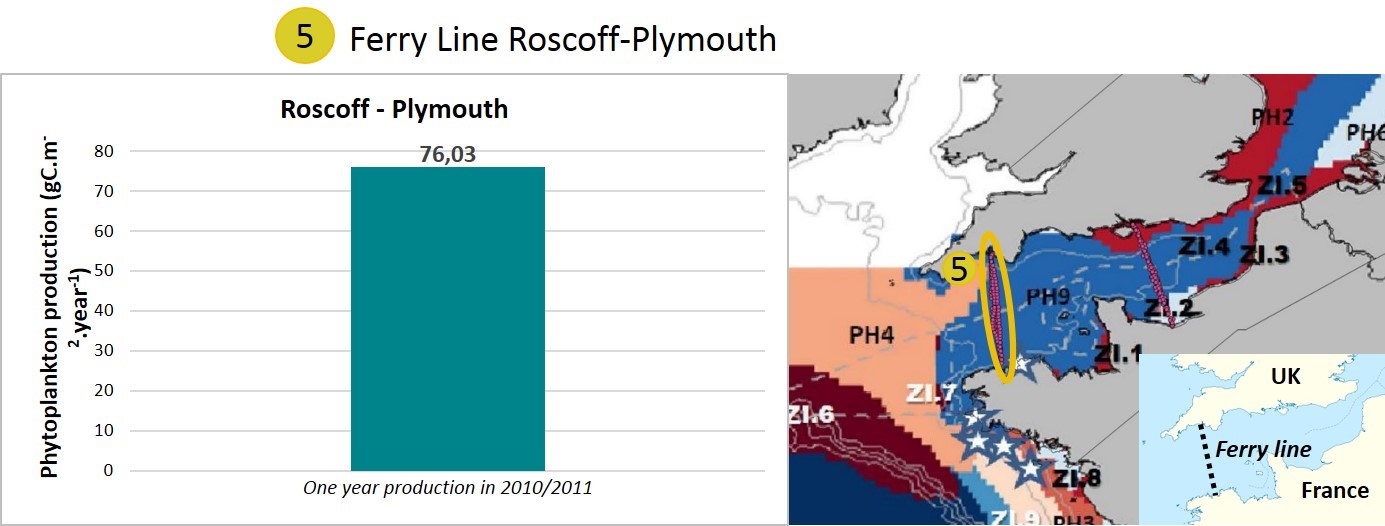
Figure i: Annual phytoplankton production in one water mass measured on a ship track between Plymouth (United Kingdom) and Roscoff (France) in 2010/2011.
Western English Channel – Plymouth L4 Station
The study site from Barnes et al. (2015) is located in the Western English Channel, at a coastal station (L4). Observations were conducted between 2009 to 2011 (Barnes et al., 2014) and during 2001 (Woods, 2003).
Using a recently developed absorption-based algorithm, APP was estimated for the period 2003–2010 (Figure j). No trend was observed over this period, with APP values varying between about 90 and 130 gC/m2/y.
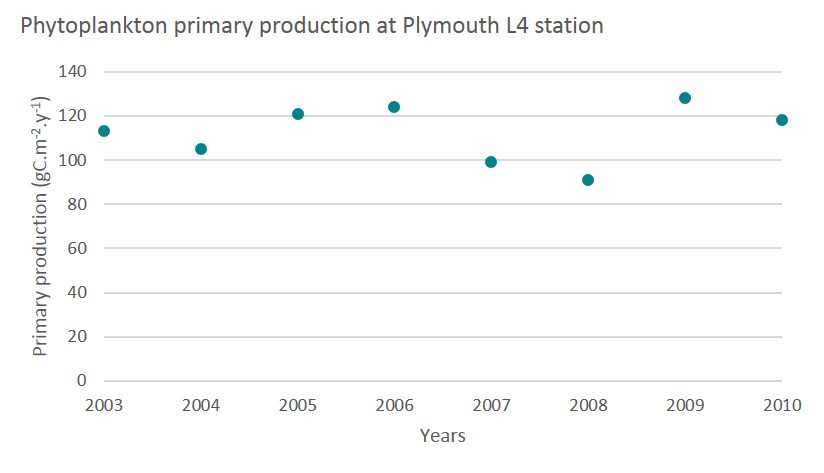
Figure j: Annual phytoplankton primary production at Plymouth L4 station. (adapted from Barnes et al., 2015)
Celtic Seas
Celtic Seas Shelf Break - Goban Spur and La Chapelle Bank
The study from Joint et al. (2001) focused on two areas of the Celtic Sea shelf break: the Goban Spur (four sites) and La Chappelle Bank (1 site). The data were collected over the period 1993–1995.
| Location | APP, gC/m2/y |
|---|---|
| Goban Spur (Shelf) | 163 |
| Goban Spur (OMEX 1, 2, 3) | 163 |
| La Chapelle Bank | 245 |
Liverpool Bay (United Kingdom)
The study site from Greenwood et al. (2012) is the Liverpool Bay SmartBuoy. APP estimates were derived over the period 2003–2009 based on two models, using the high frequency measurements from the SmartBuoy.
The long-term average of APP shows a mean value of 223 gC/m2/y with a range from 167 (2006) to 296 (2003) m gC/m2/y.
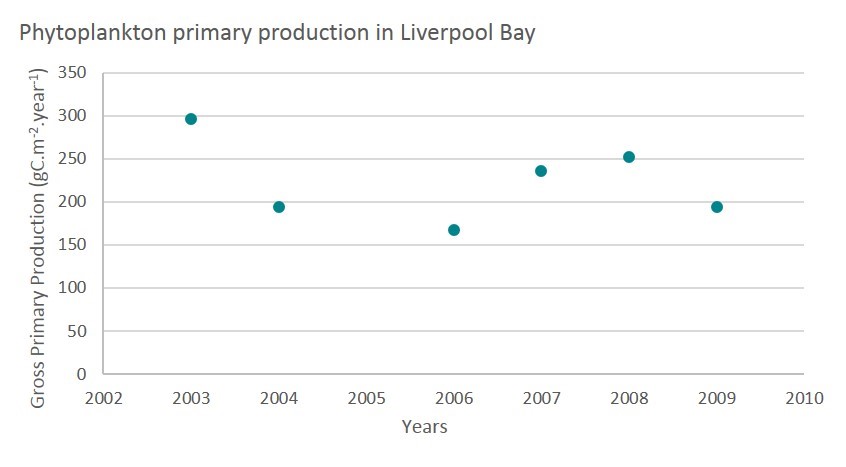
Figure k: Annual primary production calculated from chlorophyll measured at the SmartBuoy in Liverpool bay (united Kingdom) (adapted from Greenwood et al., 2012) (Figure_k_Liverpool.jpg)
Additional Information
Impact of Temporal Variability in Photosynthetic Parameters on Phytoplankton Primary Production
Information on temporal variability in photosynthetic parameters is useful for understanding monthly depth and variability of phytoplankton primary production. It has not been possible to include this time series in the present assessment cycle and this information has been provided to illustrate one aspect of the indicator that needs further development in future assessment cycles.
Figure l shows a weekly time series of photosynthetic parameters in Wimereux, France, littoral waters in the Eastern English Channel based on the 14C technique. The main issue addressed within this study is the importance of calculating annual primary production based on regular measurements, at a frequency, which in coastal waters, should reflect the important temporal variability of photosynthetic parameters. This was recently addressed in the same area (Wimereux and strait of Dover) in a multi-scale and interannual study using the PAM variable induced fluorometry method (Houliez et al., 2015).
The impact of temporal variability in the two photosynthetic parameters investigated on phytoplankton primary production rates (monthly and annual), were studied considering all dates where photosynthetic parameters were determined (Technique 1). Moreover, two random walk sampling strategies were applied in order to define two series of photosynthetic parameters averaged by month. These were used to calculate two different annual production rates (Techniques 2 and 3) corresponding to two different sampling strategies (at a fortnightly scale).
The range in percentage difference between the three techniques applied for estimating phytoplankton primary production rates was greater for monthly primary production (5–70%) than annual primary production (5–25%).
It can be concluded from these sensitivity analyses on photosynthetic parameters frequency measurements that large errors can be made if sampling strategy and frequency is too low. Particularly in coastal waters and in some cases if vertical variability in the water column (due to photoacclimation) is not considered in the sampling strategy. Vertical variability in the English Channel has been studied from field measurements (Lizon et al., 1995) and by modelling (Lizon et al., 1998).
Complementary assessments of photosynthetic parameters (Houliez et al., 2013a,b, 2015) have been carried out, by using the Fluorescence PAM technique at different frequencies, (2008 – Present) in the Eastern English Channel. These have covered littoral to offshore waters in the Strait of Dover in order to address and to better characterise the variability in photosynthetic parameters of natural phytoplankton communities at different time scales, as a mean for better understanding and estimating primary production assessments.
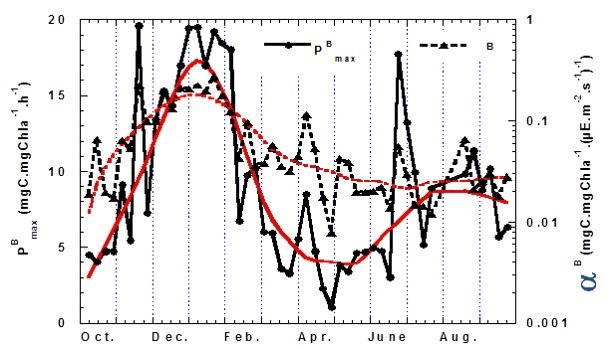
Figure l: Photosynthetic parameters (photosynthetic specific capacity – PB max and photosynthetic efficiency αB) time series in Wimereux, France, littoral waters (2000–2001)
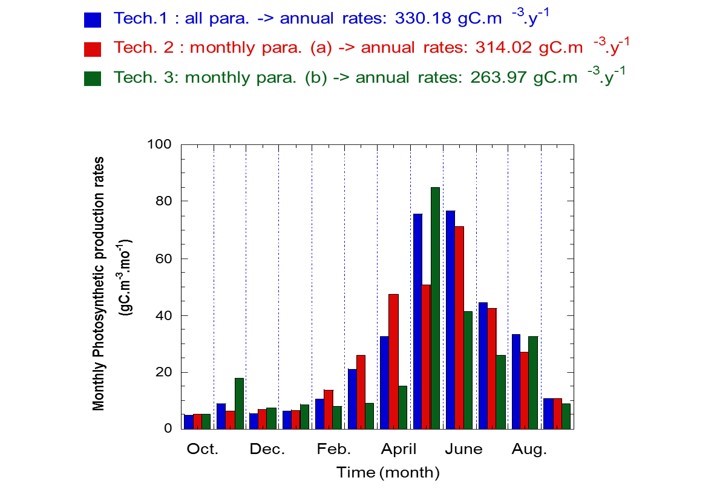
Figure m: Photosynthetic production rates using three techniques, based on Wimereux data (2000-2001)
Conclusion
Cette étude pilote révèle des modifications propres à des sites mais la base de données actuelle ne permet pas une conclusion généralisée pour l’ensemble des régions OSPAR. Cette évaluation montre que l’indicateur peut potentiellement révéler des modifications de la production primaire de phytoplancton et fournit des informations fondamentales sur les dynamiques de la production primaire.
Cette évaluation pilote démontre également la variabilité interannuelle au sein des sites d’étude et la variabilité d’un site à l’autre. Ceci indique qu’il importe de recueillir des données pour un nombre suffisant d’années pour pouvoir comprendre la gamme de variabilité et les causes probables. De plus, la production primaire de phytoplancton dans les eaux côtières révèle une variabilité supérieure à celle des zones du large et doit donc être surveillée plus fréquemment que dans les zones du large afin de détecter les tendances. Une surveillance à long terme des zones du large devrait pouvoir expliquer les modifications plus fondamentales du fonctionnement des écosystèmes car elles sont moins soumises aux variations locales (par exemple par les apports en nutriments).
Il semble que cet indicateur puisse contribuer à une évaluation plus étendue en se fondant sur les études de cas présentées. La première évaluation réalisée peut également constituer une ligne de base pour des évaluations supplémentaires. Des méthodes, stratégies et conceptions d’échantillonnage différentes peuvent étayer le développement ultérieur de l’évaluation. Ce processus permet aux Parties contractantes de posséder, avec une certaine flexibilité, des programmes de surveillance divergents tout en fournissant encore une évaluation coordonnée.
Une approche plus coordonnée, appliquée à la surveillance spatiale et temporelle (stratégie d’échantillonnage), est nécessaire pour réaliser une évaluation complète de cet indicateur. L’Union européenne a financé le projet EcApRHA qui a abouti à de nombreux développements méthodologiques et scénarios permettant d’améliorer la surveillance et de promouvoir le développement de cet indicateur.
The assessment results were site-specific and do not allow for a generalised conclusion. An increasing, decreasing trend or absence of trend can happen both in a desired state or an undesirable state.
The EcApRHA project contributed to this assessment. It was a co-financed European Union project coordinated by OSPAR to address gaps in biodiversity indicator development.
This pilot assessment demonstrates the potential for this indicator to show changes in phytoplankton primary production. The dynamics of APP (significant decrease / increase or no change) could be associated with ecosystem changes (e.g. nutrient inputs, turbidity, temperature). Changes in dynamics can reflect ecosystem responses to anthropogenic pressures or management measures. No significant change in dynamics indicates that the system is stable. This can happen in a desirable state (a ‘healthy’ functioning ecosystem) or in an undesirable state (e.g. when in stable but too eutrophic conditions). An example of a stable situation is the situation in the Sylt-Rømø Bight on the German / Danish border. Production of phytoplankton (significant decrease / increase or no change) should be interpreted in the light of other indicators and pressures. In the Baie des Veys (France) pilot area, phytoplankton primary production has been linked to nutrient inputs.
In addition, this pilot assessment provides key information on the dynamics of phytoplankton primary production. It demonstrates the presence of interannual variability at the study sites, indicating the importance of collecting enough years of data to establish the range in variability that can be expected at a given site. It also shows the variability between locations as each result is site-specific, which indicates that the factors driving this variability are also likely to be site-specific. Nutrient enriched areas, which are often coastal, show a greater range of variability than oligotrophic areas (generally offshore areas). Phytoplankton primary production in coastal waters is less stable than offshore area and needs monitoring at higher frequency in order to determine trends. The long term monitoring of offshore zones should provide answers on more fundamental changes in ecosystems functioning because they are less susceptible to local variations.
Based on the case studies presented, it appears that this indicator can contribute to a broader assessment. The first assessment carried out can also provide a baseline for further assessments.
Different methods, sampling strategy and sampling design (OSPAR CEMP Guidelines, in prep) can support the further development of the assessment. This process allows flexibility for Contracting Parties to have their monitoring programme and provide a coordinated assessment.
A more coordinated approach to spatial and temporal monitoring (sampling strategy) is necessary for a full assessment of this indicator. The European Union funded EcApRHA project provided further information on existing methodologies and suggestions for a common approach (Kromkamp et al., 2017).
Assessment values could be defined depending on data availability and as a function of water masses, however further work is needed. A first approach has been discussed and is under development within the EcApRHA project.
Lacunes des connaissances
Le rapport entre les pressions et la production primaire de phytoplancton n’est pas très clair et devra être évalué en même temps que d’autres indicateurs et jugements d’experts.
Il faudra étudier plus avant la gamme des variations naturelles et les valeurs d’évaluation pour la production primaire de phytoplancton.
Pour définir les échelles d’évaluation on pourrait utiliser les régions hydrodynamiques mais cette démarche devra être mieux validée pour cet indicateur de la production primaire de phytoplancton.
L’évaluation pilote permet d’aborder des lacunes des travaux prévus à l’avenir dans le cadre de la surveillance nationale existante sans devoir réaliser une coordination supplémentaire. Il y a lieu cependant de développer une stratégie de surveillance cohérente, prenant en compte les techniques disponibles pour les évaluations de la production primaire de phytoplancton, afin de faire progresser la réalisation d’une évaluation complète au cours du prochain cycle. Le projet EcApRHA permet de proposer des scénarios différents pour une surveillance optimisée.
A better understanding of the driving forces behind annual variability in annual primary production is needed. As well as nutrients, light availability and hydrodynamics, other factors such as zooplankton dynamics could also be important. For example, Wiltshire et al. (2009) showed the relationship between winter temperature and zooplankton grazing: high winter / early spring temperatures mean zooplankton are active earlier in the year, resulting in high grazing rates relatively early in the season which will make it harder for phytoplankton to develop a strong spring bloom. Phytoplankton dynamics are also related to the autumn and winter conditions preceding the spring bloom, as well as freshwater nutrient loads, which can be directly affected by human activities.
The phytoplankton primary production indicator responds well to nutrient input and can be used to show the difference in phytoplankton primary production from coastal to offshore areas. It would be interesting in future work to develop further the indicator sensitivity regarding the coastal-vs-offshore nutrient gradient. This would allow a better understanding of coastal natural variability due to high nutrient input compared to the primary production in offshore areas. This could guide help adaptations to monitoring programmes that covers both coastal and offshore areas. For example, by reducing the number of monitoring sites in offshore areas where phytoplankton primary production is more stable to focus on coastal areas that show higher variability.
There is a need to identify a consistent monitoring strategy depending on the area considered, by taking into account the techniques available and the best temporal frequency that can be applied to primary production assessments. A combination of reference (14C, 13C, O2) incubation and semi-automated or automated (PAM: pulse amplitude modulated, FRRF: fast-repetition-rate-fluorometry) techniques, together with estimates for continuous measurements (on fixed automated stations or moorings, or ships), remote sensing and modelling assessments, will need to be considered, as well as recommendations by experts within current European networks such as the JERICO-Next H2020 project.
Phytoplankton primary production is regularly monitored in the Baltic Sea (HELCOM, 2014). There is no coordinated regional monitoring for phytoplankton primary production within OSPAR. The EcApRHA project helped in proposing different scenarios for an optimised monitoring for a full assessment.
Primary production is partly related to changes in phytoplankton diversity (see assessments of the other plankton indicators: “Changes of plankton functional types”, “Plankton biomass and/or abundance” and “Changes in biodiversity index”) owing to photosynthesis efficiency, photo acclimation capacities, growth rate etc.
Ayata, S-D., Lévy, M., Aumont, O., Resplandy, L., Tagliabue, A., Sciandra, A., Bernard, O. 2014. Phytoplankton plasticity drives large variability in carbon fixation efficiency. Geophysical Research Letters 41(24): 8994-9000.
Baird, D., Asmus, H., Asmus, R. 2011. Carbon, nitrogen and phosphorus dynamics in nine sub-systems of the Sylt-Rømø Bight ecosystem, German Wadden Sea. Estuarine, Coastal and Shelf Science 91(1): 51-68.
Barnes, M.K., Tilstone, G.H., Smyth, T.J., Suggett, D.J., Astoreca, R., Lancelot, C., and Kromkamp, J.C. 2014. Absorption-based algorithm of primary production for total and size- fractionated phytoplankton in coastal waters. Marine Ecology Progress Series 504: 73-89.
Barnes, M.K., Tilstone, G.H., Suggett, D.J., Widdicombe, C.E., Bruun, J., Martinez-Vicente, V., and Smyth, T.J. 2015. Temporal variability in total, micro- and nano-phytoplankton primary production at a coastal site in the Western English Channel. Progress in Oceanography 137: 470-483.
Cadee, G. and Hegeman, J. 2002. Phytoplankton in the Marsdiep at the end of the 20th century; 30 years monitoring biomass, primary production, and Phaeocystis blooms. Journal of Sea Research 48: 97–110.
Capuzzo, E., Lynam, C., Stephens, D., Barry, J., Forster, R., Greenwood, N., Silva, T., and Engelhard, G. In prep. Decline in primary production of the North Sea.
Capuzzo, E., Stephens, D., Silva, T., Barry, J., Forster, R.M. 2015. Decrease in water clarity of the southern and central North Sea during the 20th century. Global Change Biology 21(6): 2206-2214.
Cloern, J.E. 1987. Turbidity as a control on phytoplankton biomass and productivity in estuaries. Continental Shelf Research 7(11/12): 1367-1381.
Cloern, J.E., Forster, S.Q., and Kleckner, A.E. 2014. Phytoplankton primary production in the world’s estuarine-coastal ecosystems. Biogeosciences 11: 2477–2501.
Cole, B. and Cloern, J. 1987. An empirical model for estimating phytoplankton productivity in estuaries. Marine Ecology Progress Series 36: 299–305.
Fitzwater, S.E., Knauer, G.A., Martin, J.H. 1982. Metal contamination and its effect on primary production measurements. Limnology and Oceanography 27(3): 544-551.
Gaichas, S., Skaret, G., Falk-Petersen, J., Link, J.S., Overholtz, W., Megrey, B.A., Gjøster, H., Stockhausen, W.T., Dommasnes, A., Friedland, K.D., and Aydin, K.Y. 2009. A comparison of community and trophic structure in five marine ecosystems based on energy budgets and system metrics. Progress in Oceanography 81:47–62.
Gailhard-Rocher, I., Huret, M., Lazure, P., Vandermeirsch, F., Gatti, J., Garreau, P., and Gohin, F. 2012. Identification de « paysages hydrologiques » dans les eaux marines sous juridiction française (France métropolitaine). Ministère de l'Ecologie et du développement durable, Directive cadre stratégie pour le milieu marin (DCSMM). 48pp.
Greenwood, N., Forster, R.M., Créach, V., Painting, S.J., Dennis, A., Cutchey, S.J., Silva, T., Sivyer, D.B., Jickells, T. 2012. Seasonal and interannual variation of the phytoplankton and copepod dynamics in Liverpool Bay. Ocean Dynamics 62(2): 307-320.
HELCOM. 2014. Manual for Marine Monitoring in the COMBINE Programme of HELCOM. HELCOM, Helsinki. 414 pp.
Houliez, E. 2012. Contrôle de l’activité photosynthétique du phytoplankton en milieu côtier – Utilisation de la fluorescence spectrale et de la fluorimétrie modulée. Université de Lille. 367 pp.
Houliez, E., Lizon, F., Artigas, L.F., Lefebvre, S., and Schmitt, F.G. 2013a. Spatio-temporal variability of phytoplankton photosynthetic activity in a temperate macrotidal ecosystem: a novel use of Pulse Amplitude Modulated (PAM) fluorometry. Estuarine, Coastal and Shelf Science 129: 37-48.
Houliez, E., Lizon, F., Lefebvre, S., Artigas, L.F., and Schmitt, F.G. 2013b. Short-term variability and control of phytoplankton photosynthetic activity in a macrotidal ecosystem (the Strait of Dover, eastern English Channel). Marine Biology 160: 1661-1679.
Houliez, E., Lizon, F., Lefebvre, S., Artigas, L.F., and Schmitt, F.G. 2015. Phytoplankton photosynthetic activity dynamics in a temperate macrotidal ecosystem (the Strait of Dover, eastern English Channel): Time scales of variability and environmental control. Journal of Marine Systems 147: 61–75.
ICES. 2014a. Report of the Workshop to develop recommendations for potentially useful Food Web Indicators (WKFooWI), 31 March–3 April 2014, ICES Headquarters, Copenhagen, Denmark. ICES CM 2014\ACOM:48. 75 pp.
ICES. 2014b. Report of the Working Group on the Ecosystem Effects of Fishing Activities (WGECO), 8–15 April 2014, Copenhagen, Denmark. ICES CM 2014/ACOM:26. 174 pp.
ICES. 2014c. Report of the Workshop to review the 2010 Commission Decision on criteria and methodological standards on good environmental status (GES) of marine waters; Descriptor 4 Foodwebs, 26-27 August 2014, ICES Headquarters, Denmark. ICES CM 2014\ACOM:60. 23 pp.
Joint, I., Wollast, R., Chou, L., Batten, S., Elskens, M., Edwards, E., Hirst, A., Burkill, P., Groom, S., Gibb, S., Miller, A., Hydes, D., Dehairs, F., Antia, A., Barlow, R., Rees, A., Pomroy, A., Brockmann, U., Cummings, D., Lampitt, R., Loijens, M., Mantoura, F., Miller, P., Raabe, T., Alvarez-Salgado, X., Stelfox, C., and Woolfenden, J. 2001. Pelagic production at the Celtic Sea shelf break. Deep-Sea Research II 48: 3049–3081.
Jouenne, F., Lefebvre, S., Véron, B., and Lagadeuc, Y. 2005. Biological and physicochemical factors controlling short-term variability in phytoplankton primary production and photosynthetic parameters in a macrotidal ecosystem (eastern English Channel). Estuarine, Coastal and Shelf Science 65: 421-439.
Kromkamp, J., Capuzzo, E., Philippart, C.J.M. 2017. Measuring phytoplankton primary production: review of existing methodologies and suggestions for a common approach. As a contribution to the EU Co-financed EcApRHA project (Applying an ecosystem approach to (sub) regional habitat assessments), deliverable No. 3.2.
Lizon, F., Lagadeuc, Y., Brunet, C., Aelbrecht, D., and Bentley, D. 1995. Primary production and photoadaptation of phytoplankton in relation with tidal mixing in coastal waters. Journal of Plankton Research 17: 1039-1055.
Lizon, F., Seuront, L., and Lagadeuc, Y. 1998. Photoadaptation and primary production study in tidally mixed coastal waters using a Lagrangian model. Marine Ecology Progress Series 169: 43-54.
Napoléon, C. 2012. Evolution spatio-temporelle de la production primaire et des communautés phytoplanctoniques en Manche. Université de Caen. 256 pp.
Napoléon, C. and Claquin, P. 2012. Multi-Parametric Relationships between PAM Measurements and Carbon Incorporation, an In Situ Approach. PLoS ONE 7(7): e40284.
Napoléon, C., Raimbault, V., Fiant, L., Riou, P., Lefebvre, S., Lampert, L., and Claquin, P. 2012. Spatiotemporal dynamics of physicochemical and photosynthetic parameters in the central English Channel. Journal of Sea Research 69: 43-52.
Nixon, S.W. 1995. Coastal marine eutrophication: a definition, social causes, and future concerns. Ophelia 41: 199–219.
Oguz, T., Ducklow, H.W., Purcell, J.E. and Malanotte-Rizzoli, P. 2001. Modeling the response of top-down control exerted by gelatinous carnivores on the Black Sea pelagic food web. Journal of Geophysical Research 106(C3): 4543–4564.
OSPAR. 2000. Quality Status Report 2000. OSPAR Commission, London. 176 pp.
OSPAR. In prep. CEMP Guidelineson Phytoplankton Monitring and Assessment
Pinto, E., Sigaud-kutner, T.C.S., Leitão, M.A.S., Okamoto, O.K., Morse, D., Colepicolo, P. 2003. Heavy metal-induced oxidative stress in algae. Journal of Phycology 39(6): 1008-1018.
Prins, T.C., Smaal, A.C. and Dame, R.F. 1997. A review of the feedbacks between bivalve grazing and ecosystem processes. Aquatic Ecology 31(4): 349-359.
Regaudie-de-Gioux, A., Lasternas, S., Agustí, S. and Duarte, C.M. 2014. Comparing marine primary production estimates through different methods and development of conversion equations. Frontiers in Marine Science. 1:19.
Rogers, S., Casini, M., Cury, P., Heath, M., Irigoien, X., Kuosa, H., Scheidat, M., Skov, H., Stergiou, K., Trenkel, V., Wikner, J., and Yunev, O. 2010. Marine Strategy Framework Directive - Task Group 4 Report Food webs. European Commission, Joint Research Centre & International Council for the Exploration of the Sea. EUR 24343 EN. 55 pp.
Shephard, S., Greenstreet, S.P.R., Piet, G.J., Rindorf, A., and Dickey-Collas, M. 2015. Surveillance indicators and their use in implementation of the Marine Strategy Framework Directive. ICES Journal of Marine Science 72 (8):2269-2277.
Tett, P., Gowen, R., Mills, D., Fernandes, T., Gilpin, L., Huxham, M., Kennington, K., Read, P., Service, M., Wilkinson, M., and Malcolm, S. 2007. Defining and detecting undesirable disturbance in the context of marine eutrophication. Marine Pollution Bulletin 55: 282-297.
Tiselius, P., Belgrano, A., Andersson, L., and Lindahl, O. 2015. Primary productivity in a coastal ecosystem: a trophic perspective on a long-term time series. Journal of Plankton Research 38(4): 1092–1102.
van Leeuwen, S., Tett, P., Mills, D., and van der Molen, J. 2015. Stratified and non-stratified areas in the North Sea: long-term variability and biological and policy implications. Journal of Geophysical Research 120(7): 4670-4676.
Wiltshire, K.H., Kraberg, A., Bartsch, I., Boersma, M., Franke, H-D., Freund, J., Gebühr, C., Gerdts, G., Stockmann, K., and Wichels, A. 2009. Helgoland Roads, North Sea: 45 Years of Change. Estuaries and Coasts 33(2): 295-310.
Woods, K. 2003. Development and assessment of novel techniques to measure primary production in the Celtic Sea and English Channel. School of Earth and Ocean Science, University of Southampton. 228pp.