

Etat et tendances des polychlorobiphényles (PCB) dans le poisson et les mollusques et crustacés
D8 - Teneurs en contaminants
D8.1 - Teneurs en contaminants
Message clé:
Les polychlorobiphényles (PCB) ont été interdits dans de nombreux pays au milieu des années 1980. Dés lors, des problèmes locaux subsistent mais les teneurs en PCB dans les mollusques et crustacés et le poisson ont diminué dans la plupart des zones d’évaluation des contaminants OSPAR. Les teneurs dans le milieu vivant, à l’exception de celles du congénère le plus toxique (CB118), sont inférieures au niveau susceptible de présenter un risque intolérable pour le milieu marin.
Zone Évaluée
Récapitulatif Imprimable
Contexte
La Stratégie substances dangereuses OSPAR a pour but, en dernier ressort, de parvenir à des teneurs dans l’environnement marin qui soient proches des teneurs ambiantes dans le cas des substances présentes à l'état naturel et proches de zéro dans celui des substances de synthèse.
Les polychlorobiphényles (PCB) sont des composés chimiques de synthèse qui ont été interdits au milieu des années 1980, leur toxicité, leur persistance et leur bioaccumulation potentielle dans l’environnement causant des préoccupations. Depuis les années 1980, des mesures mondiales ont entraîné des réductions importantes des rejets et les stocks restants ont été supprimés progressivement. En dépit des mesures européennes et mondiales cependant les rejets se poursuivent par l’intermédiaire d’émissions diffuses dans l’air et l’eau provenant de chantiers et de matériaux industriels. Les sources restantes sont notamment le matériel électrique et hydraulique contenant des PCB, l’élimination des déchets, la redistribution des sédiments marins contaminés par le passé et les sous-produits de processus thermiques et chimiques.
Les PCB ne se dégradent pas facilement dans l’environnement et ne sont pas métabolisés aisément par l’homme ou les animaux. Les PCB s’accumulent dans les animaux marins, des teneurs plus élevées étant présentes dans les niveaux trophiques supérieurs. Les composés des PCB sont extrêmement toxiques pour les animaux et l’homme, ils entraînent des problèmes de reproduction et de développement, endommagent le système immunitaire, perturbent les hormones et peuvent causer le cancer. Les PCB « de type dioxine » sont un sous-groupe plus toxique que d’autres congénères des PCB.
Sept congénères des PCB ont été sélectionnés comme indicateurs de la contamination d’ensemble par les PCB étant donné leurs teneurs et effets toxiques relativement élevés.
Polychlorinated biphenyls (PCBs) (Figure a) are industrial compounds with multiple industrial and commercial uses. It has been estimated that globally 1.3 million tonnes of PCB compounds have been produced (Breivik et al., 2007). PCBs have been used as coolants and lubricants in transformers, capacitors, and other electrical equipment. PCBs have also been used in adhesives, paints, inks and as plasticisers and sealing agents in products such as rubber and especially in polyvinyl chloride plastics used to coat electrical wiring.

Figure a: Chemical structure of polychlorinated biphenyls
Although usage of PCBs was banned in most forms over 30 years ago (PARCOM, 1992), they still exist in old electrical equipment and environmental media to which humans can be exposed. PCBs are expected to be present in electronic waste streams from which they can leach into the environment (Menad et al., 1998). Humans are exposed mainly via food, mostly from contaminated animal fats. Indoor air can also contribute to human exposure. Worldwide monitoring programmes have shown that PCBs are present in most samples of human breast milk (Pietrzak-Fiecko et al., 2005).
PCBs do not burn easily and are good insulators (Bergman et al., 2012). These properties contribute greatly to PCBs having become environmental contaminants, which are regulated by the Stockholm Convention on Persistent Organic Pollutants (2004, amended 2009). The chemical inertness and heat stability properties that make PCBs desirable for industry also enable PCB residues to persist in the environment for long periods and to be transported worldwide associated with particulate matter as this is dispersed through waters, precipitation, wind, and other physical forces (Jaward et al., 2004; Eckhardt et al., 2007; Gioia et al., 2008).
All PCBs can induce formation of reactive oxygen species, genotoxic effects, immune suppression, an inflammatory response, and endocrine effects, to various extents and through different pathways (Sepulveda et al., 2010; Lauby-Secretan et al., 2013). Of the 209 PCB congeners, the most toxic are the so-called ‘dioxin-like’ PCBs (DL-PCBs). These are the four non-ortho PCBs (CB77, CB81, CB126, CB169) and eight mono-ortho PCBs (CB105, CB114, CB118, CB123, CB156, CB157, CB167, CB189).
Owing to their persistence, potential to bioaccumulate (Figure 1) and toxicity they have been included on the OSPAR List of Chemicals for Priority Action (OSPAR, 2007). Six PCB congeners were recommended for monitoring by the European Commission (2001). As the most toxic PCB, CB118 is also monitored. As per the OSPAR Coordinated Environmental Monitoring Programme (CEMP) (OSPAR, 2016) Contracting Parties are required to monitor the seven PCB congeners CB28, CB52, CB101, CB118, CB138, CB153, and CB180 (OSPAR, 1997) on a mandatory basis in biota (fish and mussels) and sediments for temporal trends and spatial distribution. Marine sediments, in particular those with a high organic carbon content, may accumulate hydrophobic compounds like PCBs to considerably higher concentrations than surrounding waters. The sampling strategy is defined by the purpose of the monitoring programme and the natural conditions of the region to be monitored (OSPAR, 1997). Typically sampling approaches include fixed-site sampling, stratified random sampling, or stratified fixed sampling.
In assessing contaminants both ‘relative’ and ‘absolute’ aspects have been analysed:
• ‘Trend assessment’ or spatial distribution assessment to focus on relative differences and changes on spatial and temporal scales – provides information about the rates of change and whether contamination is widespread or confined to specific locations; and
• ‘Status’ assessment of the significance of the (risk of) pollution, defined as the status where chemicals are at a hazardous level, usually requires assessment criteria that take account of the possible severity of the impacts and hence requires criteria that take account of the natural conditions (background concentrations) and the ecotoxicology of the contaminant. For example, Environmental Assessment Criteria (EAC) are tools in this type of assessment.
OSPAR has clarified that in assessing the Coordinated Environmental Monitoring Programme (CEMP) data the primary assessment value used in the assessment of contaminant concentrations in sediment and biota, “corresponds to the achievement, or failure to achieve, statutory targets or policy objectives for contaminants in these matrices” (OSPAR, 2009a). This set of assessment criteria was specifically compiled for the assessment of CEMP monitoring data on hazardous substances contributing to the QSR 2010. The use of this set was considered an interim solution for the purposes of the QSR 2010 until more appropriate approaches to defining assessment criteria could be agreed upon and implemented. These criteria have also been used in the annually recurring CEMP assessments since 2010 and will be used until OSPAR agrees on the adoption of improved assessment criteria and subject to the conditions set out in the agreement.
Two assessment criteria are used to assess PCB concentrations in biota: background assessment concentrations (BACs) and environmental assessment criteria (EACs).
OSPAR IA 2017 Indicator Assessment values are not to be considered as equivalent to proposed European Union Marine Strategy Framework Directive (MSFD) criteria threshold values, however they can be used for the purposes of their MSFD obligations by those Contracting Parties that wish to do so.
Provenance and limitations of BACs
BACs were developed by OSPAR for testing whether concentrations are near background levels for naturally occurring substances and close to zero synthetic substances, the ultimate aim of the OSPAR Hazardous Substances Strategy. Mean concentrations significantly below the BAC are said to be near background (naturally occurring concentrations). BACs are statistical tools defined in relation to the background concentrations or low concentrations, which enable statistical testing of whether observed concentrations could be considered to be near background concentrations.
Background concentrations (BCs) are assessment tools intended to represent the concentrations of hazardous substances that would be expected in the North-East Atlantic if certain industrial developments had not happened. They represent the concentrations of those substances at ‘remote’ sites, or in ‘pristine’ conditions based on contemporary or historical data respectively, in the absence of significant mineralisation and/or oceanographic influences. In this way, they relate to the background values referred to in the OSPAR Hazardous Substances Strategy. BCs for synthetic, man-made substances should be regarded as zero. It is recognised that natural processes such as geological variability or upwelling of oceanic waters near the coast may lead to significant variations in background concentrations of contaminants, for example trace metals. The natural variability of background concentrations should be taken into account in the interpretation of CEMP data, and local conditions should be taken into account when assessing the significance of any exceedance.
Low concentrations (LCs) are values used to assist the derivation of BACs where there have been difficulties in assembling a dataset on concentrations in remote or pristine areas from which to derive BCs. LCs have been prepared by on the basis of datasets from areas that could generally be considered remote but which could not be guaranteed to be free from influence from long-range atmospheric transport of contaminants. LCs have also been used to assess concentrations in sediments from Spain due to the specific bulk composition of sediments from the coasts of the Iberian Peninsula. It is recognised that natural background concentrations may be lower than the LCs and that they may not be directly applicable across the entire Convention area.
BACs are calculated according to the method set out in Section 4 of the CEMP Assessment Manual (OSPAR, 2008). The outcome is that, on the basis of what is known about variability in observations, there is a 90% probability that the observed mean concentration will be below the BAC when the true mean concentration is at the BC. Where this is the case, the true concentrations can be regarded as ‘near background’ (for naturally occurring substances) or ‘close to zero’ (for man-made substances).
BACs are calculated on the basis of variability within the CEMP dataset currently available through databases held by the ICES Data Centre and will be refined by the relevant assessment group as further CEMP monitoring data are collected.
Provenance and limitations of EACs
Environmental Assessment Criteria were developed by OSPAR and ICES for assessing the ecological significance of sediment and biota concentrations. Some EAC values were specifically compiled for the assessment of CEMP monitoring data on hazardous substances contributing to the QSR 2010 (OSPAR Agreement 2009-2). EACs do not represent target values or legal standards under the OSPAR Convention and should not be used as such. The EAC values were set so that hazardous substance concentrations in sediment and biota below the EAC should not cause chronic effects in sensitive marine species, including the most sensitive species, nor should concentrations present an unacceptable risk to the environment and its living resources. However, the risk of secondary poisoning is not always considered. EACs continue to be developed for use in data assessments.
As concentrations below the EAC are considered to present no significant risk to the environment, in most cases EAC are considered analogous to the Environmental Quality Standards applied to concentrations of contaminants in water or biota, for example under the European Union Water Framework Directive.
For PCBs in biota, equilibrium concentrations were calculated from sediment concentrations and partition coefficients based on the assumption of equilibrium between PCBs in lipids of biota and in sediment (OSPAR, 2009a,b). Thus, the EACs for PCBs in sediment were used to calculate concentrations of PCBs in fish liver (on a lipid weight basis) and in mussels, in equilibrium with sediment containing PCB concentrations equal to the EAC in sediment. These calculated values (termed EACpassive) were used in the assessment of PCBs in fish liver and mussels.
Caution should be exercised in using these generic environmental assessment criteria in specific situations. Their use does not preclude the use of common sense and expert judgement when assessing environmental effects and/or the potential for them. Furthermore, the EACs do not take into account specific long-term biological effects such as carcinogenicity, genotoxicity and reproductive disruption due to hormone imbalances, and do not include combination toxicology.
Assessment method
For each PCB compound at each monitoring site, the time series of concentration measurements was assessed for trends and status using the methods described in the contaminants online assessment tool (http://dome.ices.dk/osparmime2016/main.html). The results from these individual time series were then synthesised at the assessment area scale in a series of meta-analyses.
Trend assessments included those monitoring sites that were representative of general conditions, and excluded those monitoring sites impacted due to a point source as well as baseline monitoring sites where trends would not be expected. Analysis was also restricted to assessment areas where there were at least three monitoring sites with trend information and where those monitoring sites had reasonable geographic spread.
The trend in each congener at each monitoring site was summarised by the estimated annual change in log concentration, with its associated standard error. The annual change in log concentration was then modelled by a linear mixed model with a fixed effect:
~ OSPAR contaminants assessment areas
and random effects:
~ congener + congener: OSPAR contaminants assessment area + monitoring site + congener: monitoring site + within-series variation
The choice of fixed and random effects was motivated by the assumption that the PCB congeners would have broadly similar trends, since they have similar sources. Thus, the fixed effect measures the common trend in PCB congeners in each OSPAR contaminants assessment area and the random effects measure variation in trends:
- between congeners common across OSPAR contaminants assessment areas (congener);
- between congeners within OSPAR contaminants assessment areas (congener: contaminants assessment area);
- between monitoring sites common across congeners (monitoring site); and
- residual variation (congener: monitoring site + within-series variation).
There are two residual terms. Within-series variation is the variation associated with the estimate of the trend from the individual time series and is assumed known (and given by the square of the standard error). Congener: monitoring site allows for any additional residual variation.
Evidence of trends in PCB concentration at the assessment area scale was then assessed by plotting the estimated fixed effects with point-wise 95% confidence intervals. Differences between congeners were explored by plotting the predicted trend for each congener and for each congener / assessment area combination with point-wise 95% confidence intervals.
Similar analyses explored status at the assessment area scale. Two summary measures were considered: the log ratio of the fitted concentration in the last monitoring year to the EAC; and the log ratio of the fitted concentration in the last monitoring year to the BAC. Baseline monitoring sites were also included in these analyses.
Finally, concentration profiles across congeners at the assessment area scale were explored using the fitted log concentration in the last monitoring year.
BACs and EACs are available for the following PCBs in biota (Table a).
| BAC | EAC | ||
|---|---|---|---|
| Mussels and Oysters (μg/kg dw) | Fish (μg/kg ww) | all biota (μg/kg dw) | |
| CB28 | 0.75 | 0.10 | 67 |
| CB52 | 0.75 | 0.08 | 108 |
| CB101 | 0.70 | 0.08 | 121 |
| CB105 | 0.75 | 0.08 | |
| CB118 | 0.60 | 0.10 | 25 |
| CB138 | 0.60 | 0.09 | 317 |
| CB153 | 0.60 | 0.10 | 1585 |
| CB156 | 0.60 | 0.08 | |
| CB180 | 0.60 | 0.11 | 469 |
Table a notes: Dw, dry weight; ww, wet weight; lw, lipid weight. BACs and EAC are converted to other bases (ww, dw or lw) using species-specific conversion factors (Table b); and the EACs are based on partitioning theory and are sometimes known as EACpassive.
| Species | Common name | % lipid weight in muscle | % lipid weight in liver | % dry weight in soft body | % lipid weight in soft body |
|---|---|---|---|---|---|
| Clupea harengus | Herring | 4.5 | 6.2 | ||
| Gadus morhua | Cod | 45 | |||
| Lepidorhombus whiffiagonis | Megrim | 23 | |||
| Limanda limanda | Common dab | 16 | |||
| Melanogrammus aeglefinus | Haddock | 65 | |||
| Merlangius merlangus | Whiting | 45 | |||
| Merluccius merluccius | Hake | 44 | |||
| Molva molva | Common ling | 54 | |||
| Platichthys flesus | Flounder | 13 | |||
| Pleuronectes platessa | Plaice | 10 | |||
| Zoarces vivparus | Eelpout | 0.6 | |||
| Crassostrea gigas | Pacific oyster | 19 | 1.8 | ||
| Mya arenaria | Softshell clam | 14 | 0.6 | ||
| Mytilus edulis | Blue mussel | 17 | 1.3 | ||
| Mytilus galloprovincialis | Mediterranean mussel | 19 | 2.0 | ||
| Ostrea edulis | Native oyster | 22 | 1.8 | ||
| Nucella lapillus | Dog whelk | 34 |
The number of monitoring sites used to assess trends and status by OSPAR region and assessment area are shown in Tables c and d.
| OSPAR assessment areas | Monitoring sites | CB28 | CB52 | CB101 | CB118 | CB138 | CB153 | CB180 |
|---|---|---|---|---|---|---|---|---|
| Barents Sea | 9 | 5 | 5 | 6 | 9 | 9 | 9 | 5 |
| Norwegian Sea | 3 | 2 | 3 | 3 | 3 | 3 | 3 | 2 |
| Norwegian Trench | 24 | 20 | 22 | 25 | 25 | 25 | 25 | 18 |
| Northern North Sea | 38 | 14 | 16 | 32 | 32 | 31 | 40 | 19 |
| Skagerrak and Kattegat | 29 | 27 | 28 | 31 | 30 | 30 | 30 | 23 |
| Southern North Sea | 34 | 27 | 29 | 35 | 33 | 30 | 35 | 30 |
| English Channel | 30 | 25 | 28 | 30 | 30 | 28 | 30 | 29 |
| Irish and Scottish West Coasts | 34 | 20 | 23 | 26 | 32 | 26 | 31 | 20 |
| Irish Sea | 52 | 39 | 45 | 50 | 54 | 53 | 53 | 41 |
| Celtic Sea | 11 | 9 | 8 | 9 | 9 | 9 | 11 | 9 |
| Northern Bay of Biscay | 16 | 14 | 16 | 16 | 16 | 16 | 16 | 16 |
| Iberian Sea | 41 | 27 | 27 | 40 | 40 | 41 | 41 | 36 |
| Gulf of Cadiz | 1 | 1 | 1 | 1 | 1 | 1 | 1 | 1 |
| OSPAR assessment areas | Monitoring sites | CB28 | CB52 | CB101 | CB118 | CB138 | CB153 | CB180 |
|---|---|---|---|---|---|---|---|---|
| Barents Sea | 1 | 0 | 0 | 0 | 1 | 1 | 1 | 0 |
| Norwegian Sea | 1 | 1 | 1 | 1 | 1 | 1 | 1 | 1 |
| Norwegian Trench | 12 | 8 | 8 | 13 | 13 | 13 | 13 | 8 |
| Northern North Sea | 29 | 6 | 6 | 16 | 22 | 25 | 30 | 13 |
| Skagerrak and Kattegat | 15 | 13 | 14 | 17 | 16 | 16 | 16 | 10 |
| Southern North Sea | 29 | 18 | 21 | 30 | 28 | 27 | 29 | 25 |
| English Channel | 29 | 23 | 27 | 29 | 29 | 28 | 29 | 29 |
| Irish and Scottish West Coasts | 17 | 10 | 14 | 11 | 16 | 15 | 16 | 11 |
| Irish Sea | 44 | 28 | 29 | 40 | 44 | 40 | 44 | 28 |
| Celtic Sea | 4 | 3 | 2 | 3 | 3 | 4 | 4 | 3 |
| Northern Bay of Biscay | 16 | 13 | 16 | 16 | 16 | 15 | 16 | 16 |
| Iberian Sea | 25 | 15 | 16 | 25 | 25 | 25 | 25 | 21 |
| Gulf of Cadiz | 1 | 1 | 1 | 1 | 1 | 1 | 1 | 1 |
Differences in methodology used for the IA 2017 compared to the QSR 2010
For the IA 2017, a meta-analysis is used to synthesise the individual time series results and provide an assessment of status and trend at the assessment area level. Meta-analyses take into account both the estimate of status or trend in each time series and the uncertainty in that estimate. They provide a more objective regional assessment than was possible in the QSR 2010, where a simple tabulation of the trend and status at each monitoring site was presented.
Résultats
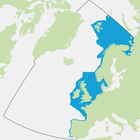
Les teneurs en polychlorobiphényles (PCB) sont mesurées dans le foie de poisson et les mollusques et crustacés. Des échantillons sont prélevés tous les ans (ou à quelques années d’intervalle) de sites principalement sur les côtes de la mer du Nord au sens large, des mers Celtiques, de la côte ibérique et du golfe de Gascogne et dans quelques sites de surveillance côtiers des eaux Arctiques (Figure 1).
Les séries temporelles utilisées pour informer cette évaluation ont débuté en 1995. Les données permettent d’étudier les tendances des teneurs en PCB au cours de la période de 1995 à 2015 et de comparer les teneurs par rapport à deux séries de valeurs d’évaluation: les teneurs ambiantes d’évaluation (BAC) et les critères d’évaluation environnementale (EAC). Les teneurs inférieures aux EAC ne devraient pas avoir des effets chroniques sur les espèces marines sensibles et ne devraient donc présenter aucun risque significatif pour l’environnement. Les BAC permettent d’évaluer si les teneurs sont proches de zéro pour les substances de synthèse, but ultime de la Stratégie substances dangereuses OSPAR.
Evaluation de l’état
Les teneurs de six des sept congénères des PCB dans le milieu vivant sont inférieures aux EAC dans toutes les zones d’évaluation des contaminants OSPAR (Figure 2) au cours de la période de 1995 à 2015. Il existe cependant des différences entre les congénères, les teneurs en CB118, l’un des PCB les plus toxiques, dans le milieu vivant étant proches des, ou supérieures aux, EAC dans huit des onze zones d’évaluation (mer du Nord septentrionale, fosse norvégienne, Manche, mer du Nord méridionale, Skagerrak et Kattegat, mer d’Irlande, mer Ibérique et golfe de Gascogne septentrional), indiquant des effets négatifs possibles sur le milieu vivant marin dans ces zones. Les teneurs en CB118 dans le milieu vivant sont inférieures aux EAC dans trois zones d’évaluation (mer Celtique, côtes ouest irlandaise et écossaise et mer de Barents).
Les teneurs en PCB dans le milieu marin sont encore supérieures aux BAC dans la plupart des zones d’évaluation OSPAR. Les teneurs moyennes en CB28 sont inférieures aux BAC sur les côtes ouest irlandaise et écossaise, dans la mer Ibérique et le golfe de Gascogne septentrional. Les teneurs en d’autres congénères, inférieures aux BAC, sont celles en CB52 (côtes ouest irlandaise et écossaise et mer Ibérique) et en CB180 (côtes ouest irlandaise et écossaise).
Evaluation des tendances
Toutes les zones évaluées possèdent encore une contamination historique par les PCB mais les teneurs dans le milieu vivant diminuent lentement (1995–2014) dans neuf des dix zones et ne révèlent aucune modification significative statistiquement dans l’autre (mer Celtique).

Figure 1: Sites de surveillance utilisés pour l’évaluation des teneurs en PCB dans le milieu vivant par zone d’évaluation des contaminants OSPAR (lignes blanches)
déterminés selon des principes hydrogéographiques et des connaissances d’expert plutôt que des limites internes OSPAR
La méthodologie d’évaluation et d’échantillonnage et les données utilisées inspirent une confiance élevée.
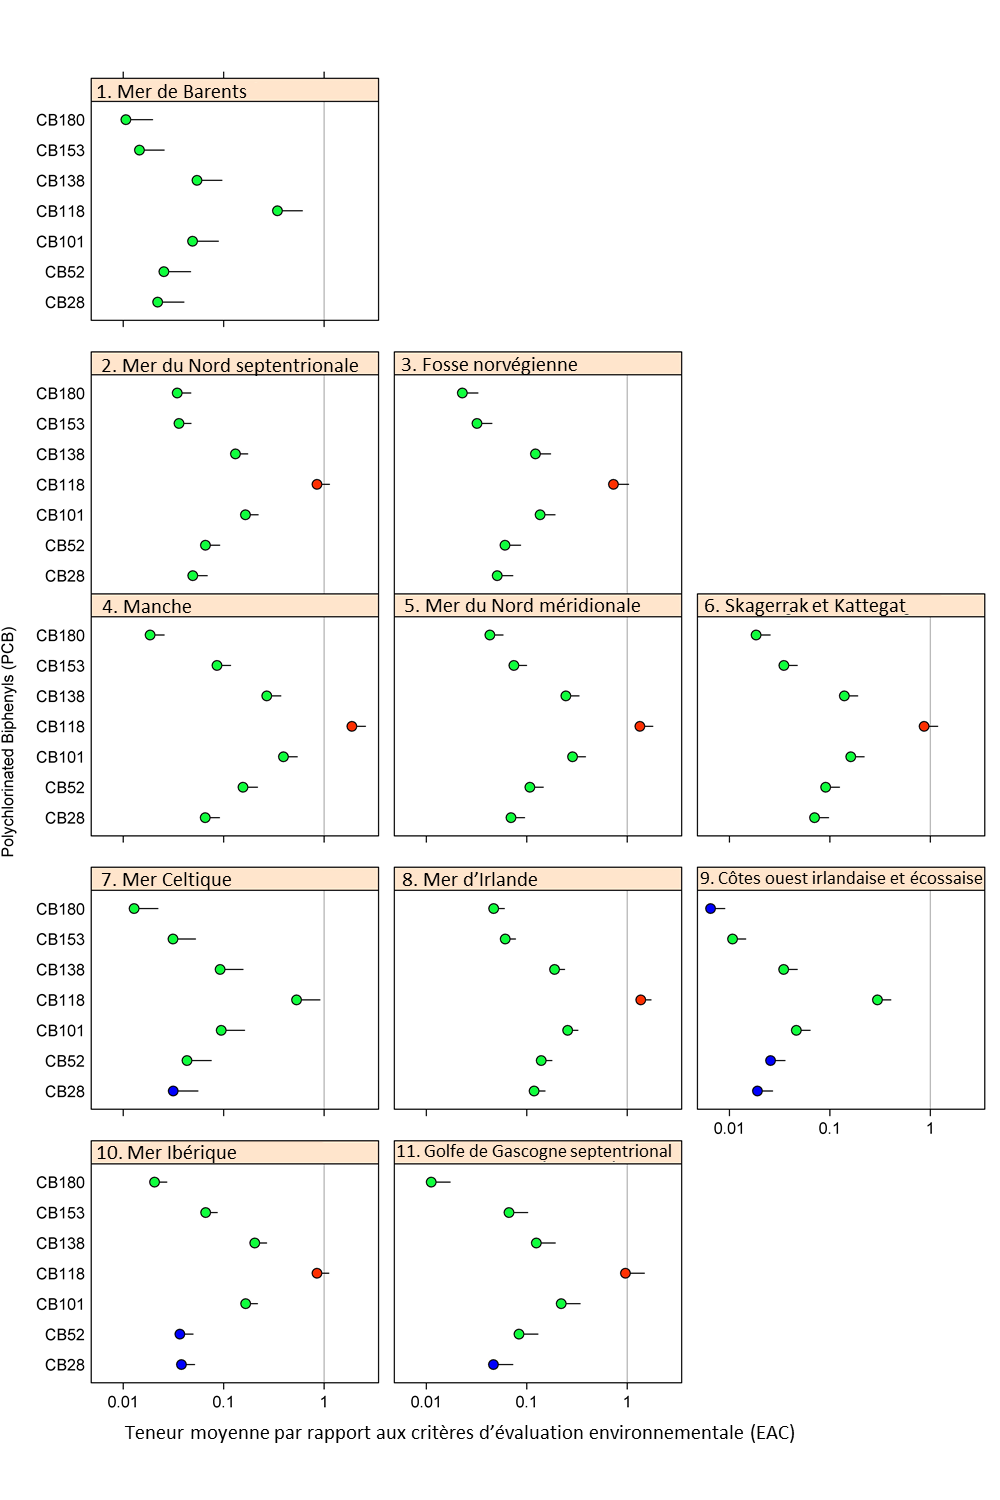
Figure 2: Teneur moyenne en PCB dans le milieu vivant par congénère (1995–2015) dans chaque zone d’évaluation des contaminants OSPAR, par rapport aux EAC (avec des limites de confiance supérieures de 95%)
lorsque la valeur 1 signifie que la teneur moyenne est égale aux EAC. Bleu: teneur moyenne nettement inférieure statistiquement (p <0,05) aux teneurs ambiantes d’évaluation (BAC). Vert: teneur moyenne supérieure aux BAC significative statistiquement mais inférieure aux critères d’évaluation environnementale (EAC). Rouge: teneur moyenne nettement inférieure statistiquement aux EAC
Regional Assessment Results
The majority of polychlorinated biphenyl (PCB) concentrations are above the Background Assessment Concentration (BAC) but below the Environmental Assessment Criteria (EAC) in all assessment areas (Figures c and 2). However, there are differences between congeners, with concentrations of one of the most toxic PCBs (CB118) at or above the EAC in eight of the 11 assessment areas (Northern North Sea, Southern North Sea, Norwegian Trench, English Channel, Skagerrak and Kattegat, Irish Sea, Iberian Sea, Northern Bay of Biscay), indicating possible adverse effects on marine life in these areas. The assessment areas where PCB concentrations are below the BAC are the Barents Sea, the Celtic Sea and along the Irish and Scottish West Coast. Downward trends can be observed in all assessment areas except in the Celtic Sea where concentrations in biota show no statistically significant change (Figure b).
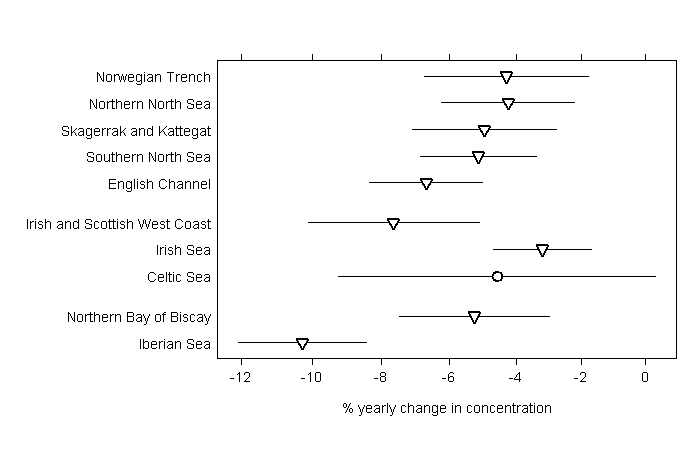
Figure b: Percentage yearly change in overall PCB concentrations in biota in each OSPAR contaminants assessment area.
No statistically significant (p <0.05) change in mean concentration (circle), mean concentration is significantly decreasing (downward triangle). 95% confidence limits (lines)
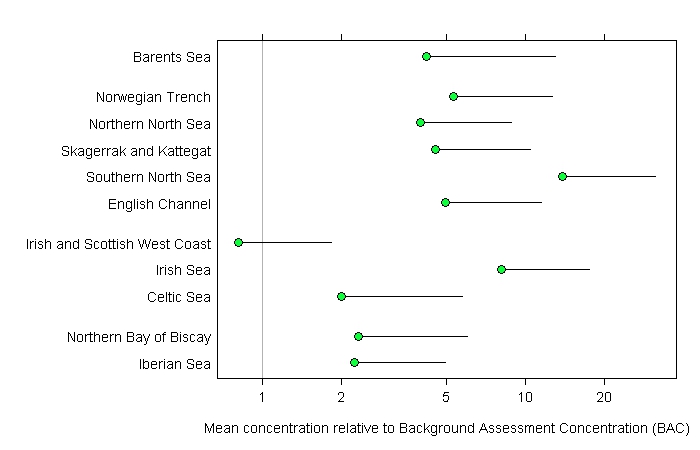
Figure c: : Mean of all PCB concentrations in biota in each OSPAR contaminants assessment area, relative to the BAC (with 95% upper confidence limits)
Value of 1 means that the mean concentration equals the BAC. Green, mean concentration statistically significantly (p <0.05) below the EAC, but not statistically significantly below the BAC
Individual Time Series Results per Monitoring Site
A summary of individual time series results at monitoring sites across the OSPAR Maritime Area for PCB in biota is presented here http://dome.ices.dk/osparmime2016/regional_assessment_biota_chlorobiphenyls.html. In total, mean concentrations of PCB in biota are above the EAC in 390 out of 2178 time series. In 20 out of 1565 time series where trend assessments have been undertaken, mean concentrations have increased over the assessment period (1995–2015). It should be noted that not all individual time series results are included in the regional assessments (see number of time series used in each OSPAR region and assessment area in Tables c and d), due to the criteria set out in the Assessment Methods.
Confidence Assessment
There is high confidence in the quality of the data used for this assessment. The data have been collected over many years using established sampling methodologies. There is sufficient temporal and spatial coverage and no significant data gaps in the areas assessed over the relevant time period (1995–2015). The methods are based on established and internationally recognised protocols for monitoring and assessment per monitoring site, with a new secondary step of synthesising monitoring site data at the assessment area scale. Therefore there is also high confidence in the methodology.
Conclusion
Plus de 25 ans après l’interdiction de l’utilisation des polychlorobiphényles (PCB) la plupart des teneurs en PCB dans le poisson et les mollusques et crustacés ont diminué et sont à des niveaux écologiques acceptables dans la plupart des zones évaluées. Les teneurs en PCB dans le poisson et les mollusques et crustacés, à l’exception de celles du congénère le plus toxique (CB118), sont inférieures au niveau susceptible de présenter un risque intolérable pour l’environnement. Les teneurs moyennes en CB118 dans le milieu vivant sont supérieures à ce niveau dans huit des onze zones évaluées (Figure 2), indiquant des effets négatifs possibles sur la vie marine dans ces zones.
Les PCB subsistent dans les sédiments pendant de longues périodes et peuvent potentiellement s’accumuler dans le milieu vivant et se bioamplifier le long des chaînes trophiques. Il faudra attendre plusieurs autres décennies pour que les teneurs soient proches de zéro, but en dernier ressort de la Stratégie substances dangereuses OSPAR, étant donné les utilisations industrielles antérieures et la persistance des PCB dans l’environnement.
On utilise régulièrement la limande (Limanda limanda) pour la surveillance des PCB dans le milieu vivant Wikimedia common
On utilise régulièrement la moule bleue (Mytilus edulis) pour la surveillance des PCB dans le milieu vivant © Mark A Wilson
Lacunes des connaissances
Il est probable que les polychlorobiphényles (PCB) continuent à pénétrer l’environnement par l’intermédiaire de sources secondaires telles que lixiviats de sites d’élimination de déchets, même en supprimant leur utilisation. Des recherches supplémentaires sont nécessaires pour définir et quantifier les apports diffus provenant de sources telluriques. L’empoisonnement secondaire n’a pas été pris en compte lors du développement des critères d’évaluation environnementale (EAC). Toutefois, à cause des teneurs élevées en PCB identifiées dans des cétacés, OSPAR devrait envisager de développer des EAC à titre de protection contre l’empoisonnement secondaire.
Further research is required to define diffuse inputs from terrestrial sources. Modelling work to understand atmospheric transport from remaining sources could also be undertaken. Landfill and waste deposit sites may also still be leaking polychlorinated biphenyl (PCB) contaminated material as they are unable to provide the very high temperatures needed to destroy PCBs. Demolition of buildings containing PCB sealants and redistribution of sediments via dredging may be remobilising PCBs which were locked away (Jepson and Law, 2016).
A recent study found Europe's cetaceans to have concentrations of PCBs that are among the highest found in the oceans (Jepson and Law, 2016). While consuming small fish, crustaceans and plankton, the cetaceans are also consuming small concentrations of PCBs and other chemical compounds that do not break-down in the natural environment and so build up in their systems. This build-up represents the concept of ‘bioaccumulation’; put simply, the rate at which a contaminant enters an animal being higher than the rate at which it leaves. The study by Jepson and Law (2016) shows that despite the ban and the decline in PCBs in marine sediments and some fish species, PCBs still persist in Europe’s cetaceans at concentrations that are dangerous to the animals.
Secondary poisoning was not considered in the development of the EAC and as high PCB concentrations are identified in cetaceans OSPAR should consider developing EAC also for the purpose of protection against secondary poisoning.
Bergman A, Rydén A, Law RJ, de Boer J, Covaci A, AlaeeM, Birnbaum L, Petreas M, Rose M, Sakai S, den Eede NV, van der Veen I (2012) A novel abbreviation standard for organobromine, organochlorine, and organophosphorus flame retardants and some characteristics of the chemicals. Environ Int 49:57–82.
Breivik, K., Sweetman, A., Pacyna, J. M. and Jones, K. C. 2007. Towards a global historical emission inventory for selected PCB congeners —A mass balance approach 3. An Update, Science of the Total Environment, 377: 296–307.
Eckhardt S, Breivik K, Mano S, Stohl A (2007) Record high peaks in PCB concentrations in the Arctic atmosphere due to long-range transport of biomass burning emissions. Atmos Chem Phys 7:4527–4536
European Commission (2001). Communication from the Commission to the Council, the European Parliament and the Economic and Social Committee Community – Strategy for Dioxins, Furans and Polychlorinated Biphenyls (COM/2001/0593 final)
Gioia R, Nizzetto L, Lohmann R, Dachs J, Jones KC (2008) Polychlorinated biphenyls (PCBs) in air and seawater of the Atlantic Ocean: sources, trends and processes. Environ Sci Technol 42:1416–1422
Jaward FM, Barber JL, Booij K, Dachs J, Lohmann R, Jones KC (2004) Evidence for dynamic air-water coupling and cycling of persistent organic pollutants over open Atlantic Ocean. Environ Sci Technol 38:2617–2625
Jepson, P.D., Law R.J. (2016). Persistent pollutants, persistent threats. Science, Vol. 352, Issue 6292, pp. 1388-1389. DOI: 10.1126/science.aaf9075, http://science.sciencemag.org/content/352/6292/1388
Lauby-Secretan B, Loomis D, Grosse Y, El Ghissassi F, Bouvard V, Benbrahim-Tallaa L, Guha N, Baan R, Mattock H, Straif K (2013) Carcinogenicity of polychlorinated biphenyls and polybrominated biphenyls. Lancet Oncol 14(4):287–288
Menad N, Björkman B, Allain EG (1998) Combustion of plastics contained in electric and electronic scrap. Resour Conserv Recycl 24:65–85
OSPAR (1997). Guidance note on the sampling and analysis of PCBs in air and precipitation. Agreement 1997-09.
OSPAR (2007). OSPAR List of Chemicals for Priority Action (updated 2007). Agreement 2004-12.
OSPAR (2008). OSPAR Publication 2008-379 CEMP Assessment Manual: Co-ordinated Environmental Monitoring Programme Assessment Manual for contaminants in sediment and biota
OSPAR (2009a). Background Document on CEMP Assessment Criteria for QSR 2010. Monitoring and Assessment Series. Publication no. 461/2009. ISBN 978-1-907390-08-1
OSPAR (2009b). OSPAR Agreement 2009-2. Agreement of OSPAR CEMP Assessment Criteria for the QSR 2010.
OSPAR (2016). OSPAR Coordinated Environmental Monitoring Programme (CEMP). Agreement 2016-01
PARCOM (1992). PARCOM Decision 92/3 on the Phasing out of PCBs and Hazardous PCB Substitutes.
Pietrzak-Fiecko R, Smoczynska K, Smoczynski SS (2005) Polychlorinated biphenyls in human milk, UHT cow's milk, and infant formulas. Pol J Environ Stud 14(2): 237–241
Sepulveda A, Schluep M, Renaud FG, Streicher M, Kuehr R, Hageluken C, Gerecke AC (2010) A review of the environmental fate and effects of hazardous substances released from electrical and electronic equipments during recycling: examples from China and India. Eur Env Imp Assess 30:28–e41
Stockholm Convention of Persistent Organic Pollutants (POPs) adopted to EU legislation in Regulation (EC) No 850/2004, amended 2009