

Trends in Blooms of the Nuisance Phytoplankton Species Phaeocystis in Belgian, Dutch and German Waters
D5 - Eutrophication
D5.2 - Direct effects of nutrient enrichment
There are no observed temporal trends in the annual blooms of the nuisance phytoplankton species Phaeocystis along the Belgian, Dutch and German coast; nevertheless abundance is high.
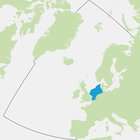
Area Assessed
Printable Summary
Background
OSPAR’s strategic objective with regard to eutrophication is to combat eutrophication in the OSPAR Maritime Area, with the ultimate aim to achieve and maintain a healthy marine environment where anthropogenic eutrophication does not occur. Trends in blooms of nuisance phytoplankton species Phaeocystis is one of a suite of five eutrophication indicators. When assessed and considered together in the OSPAR Common Procedure in a multi-step method, the suite can diagnose eutrophication.
Excessive enrichment of marine water with nutrients may lead to algal (phytoplankton) blooms, with the possible consequence of undesirable disturbance to the balance of organisms in the marine ecosystem and overall water quality. Undesirable disturbance includes shifts in the composition and extent of flora and fauna and depletion of oxygen caused by decomposition of accumulated organic material produced by phytoplankton or seaweed communities during their growing seasons. Phaeocystis is a widespread marine phytoplankton. As it breaks down at the end of a bloom foam can form. It is used as an indicator of eutrophication because increased concentrations of more than 106 or 107 Phaeocystis cells per litre of seawater and increased duration of Phaeocystis blooms per year are an indication of nutrient enrichment.
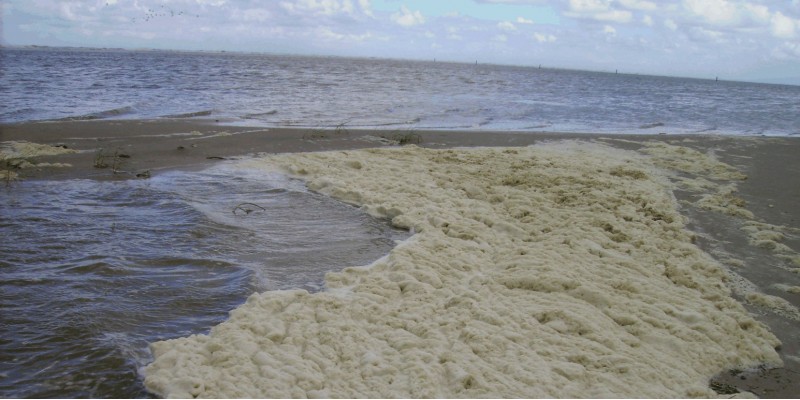
Phaeocystis, shown here on the beach of Spiekeroog, Germany ©Wera Leujak, Umweltbundesamt
Eutrophication is the result of excessive enrichment of water with nutrients. This may cause accelerated growth of algae and / or higher forms of plant life (EC, 1991). This may result in an undesirable disturbance to the balance of organisms present and thus to overall water quality. Undesirable disturbances can include shifts in the composition and extent of flora and fauna and the depletion of oxygen due to decomposition of accumulated biomass. Such disturbances then have other effects, such as changes in habitats and biodiversity, blooms of nuisance algae or macroalgae, a decrease in water clarity, and behavioural changes or even death of fish and other species. Identifying causal links between these disturbances and nutrient enrichment can be complicated by other pressures. Cumulative effects, including climate change, may have similar effects on biological communities and dissolved oxygen, further complicating efforts to demonstrate causal links.
The OSPAR Commission’s strategic objective, with regard to eutrophication, is to combat eutrophication in the OSPAR Maritime Area, with the ultimate aim that by 2020 the OSPAR Maritime Area is a healthy marine environment where anthropogenic eutrophication does not occur (OSPAR, 2010). The OSPAR Eutrophication Strategy requires assessment of eutrophication to be based on the ecological consequences of nutrient enrichment and not just on nutrient enrichment alone, i.e. finding reliable evidence for accelerated growth of algae and / or macrophytes caused by anthropogenic nutrient enrichment, leading to undesirable disturbance. Eutrophication is diagnosed using OSPAR’s harmonised criteria of nutrient inputs, concentrations and ratios, chlorophyll-a concentrations, phytoplankton indicator species, macrophytes, dissolved oxygen levels, incidence of fish kills and changes in zoobenthos (OSPAR, 2013-8). As there is no single indicator of disturbance caused by marine eutrophication, OSPAR applies a multi-step method using the harmonised criteria. Eutrophication is considered to have occurred if there is evidence for all of the stages shown in Figure a and of causal links between them (ECJ, 2009).
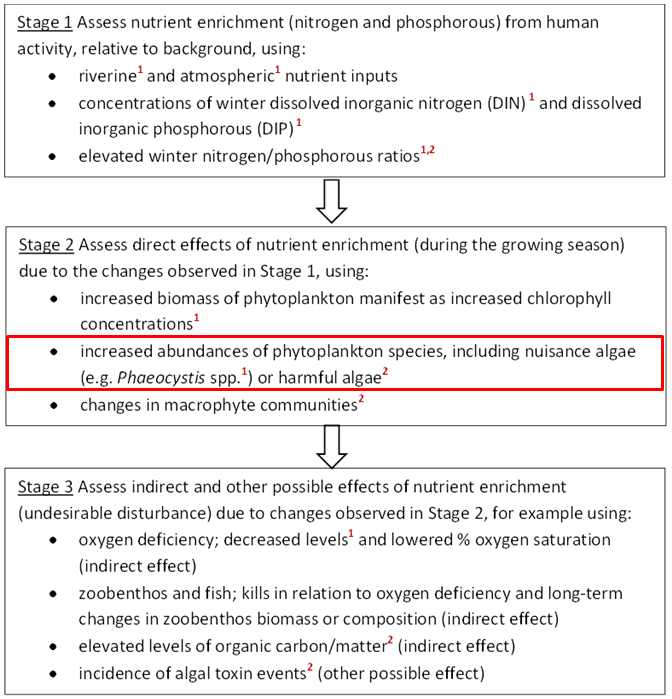
Figure a: Three stages in the identification of eutrophication. The criteria marked ¹ are common indicators for the OSPAR Intermediate Assessment 2017.
The criteria marked ² are not relevant in all OSPAR countries’ waters. The common indicator assessed here (concentrations of the nuisance algae Phaeocystis) is outlined in red
For OSPAR’s Intermediate Assessment 2017, five harmonised criteria have been assessed at a regional scale: nutrient inputs, nutrient concentrations and ratios, chlorophyll-a concentrations, concentrations of the nuisance algae Phaeocystis, and dissolved oxygen levels. These are highlighted in Figure a. The individual assessment results of any one of these five common indicators do not diagnose eutrophication by themselves. However, the assessments provide useful information about trends and are important for informing management measures.
Phaeocystis was assessed in the Quality Status Report (QSR) 2010 as part of the Common Procedure. There is no comparable regional indicator assessment of Phaeocystis.
Currently six species are assigned to the genus Phaeocystis, of which three are associated with bloom formation. In the southern North Sea Phaeocystis species consist of P. globosa (flagellates and non-flagellates) and P. pouchetti, which could partly not be distinguished. For this reason only cell concentrations of Phaeocystis species are reported. Phaeocystis has a polymorphic life cycle, alternating between free-living cells and gelatinous colonies comprising thousands of cells embedded in a polysaccharidic matrix. The colonies range from several millimetres (Rousseau et al., 1994; Peperzak et al., 2000b) up to 3 cm (Chen et al., 2002) in length, causing foam banks on shores during the bloom decline. Phaeocystis globosa is globally detected (Xu et al., 2003; Schoenemann et al., 2005; Medlin and Zingone, 2007) and in the North Atlantic is most abundant during May–June in the eastern part, including the Greater North Sea (Gieskes et al., 2007).
Phaeocystis globosa and P. pouchetti show higher growth rates in colonies than for single cells (Veldhuis et al., 2005). Spreading of colonies was reported by division or release of cells (Rousseau et al., 1994). Losses of Phaeocystis in the southern North Sea were mainly attributed to sedimentation (Riebesell, 1993). Flagellates and colonies are grazed by microzooplankton, such as ciliates and heterotrophic flagellates (Peperzak et al., 1998; Stelfox-Widdicombe et al., 2004) or by a wide array of vertebrates including fish (Weisse et al., 1994).
Phaeocystis can excrete up to 30% of its assimilated biomass (Peperzak et al., 2000a) and production of exopolymeric particles following nutrient limitation has been reported (Mari et al., 2005). Phaeocystis is a major producer of dimethylsulfoniopropionate (DMSP), an antioxidant (Sunda et al., 2002). DMSP is a precursor of dimethyl sulphide (DMS), which is an important global climate regulator. In the Belgian coastal zone, Phaeocystis accounted for 50% of annual primary production and 78% of DMS production (Gypens et al., 2014).
Phaeocystis species succeed the spring bloom of diatoms when silicate becomes limiting and irradiance has reached 100 Wh/m2 per day (Peperzak et al., 1998), although they can also grow in parallel with diatom blooms before silicate becomes limiting. Phaeocystis is a good competitor under nitrogen-limitation (Riegman et al., 1992). Along Belgian, Dutch and German coastal waters Phaeocystis blooms have been observed frequently since about 1974 (Cadée and Hegeman, 2002), partly succeeded by the accumulation of foam on beaches (Hanslik and Rahmel, 1995) and sometimes dominating phytoplankton abundance (Raabe et al., 1997).
Various researchers have found a link between nutrient enrichment of marine waters and an increase in Phaeocystis blooms (e.g. Cadée and Hegeman, 1986; Lancelot et al., 1987; Brockmann et al., 1990), especially in coastal waters where the influence of nutrient input via rivers is highest.
Data for this assessment were only available for Belgian, Dutch and German coastal waters and have mainly been compiled from national data banks. These include: Landesamtes für Landwirtschaft, Umwelt und ländliche Räume (LLUR), Niedersächsischer Landesbetrieb für Wasserwirtschaft, Küsten- und Naturschutz (NLWKN), Alfred Wegner Institut (AWI), Rijkswaterstaat, (RWS), and the Management Unit of the North Sea Mathematical Models and Scheldt estuary (MUM). Helgoland data are protected by AWI, so data were obtained from Germany’s national OSPAR COMP assessment 2007 (OSPAR, 2008).
Owing to restrictions on the use of Helgoland AWI data, the analyses and results presented in this assessment are limited. Since 2005, data were available from fewer monitoring sites. International Council for the Exploration of the Sea (ICES) data for Phaeocystis pouchettii in the northern North Sea and the English Channel 1903–1911 were not considered.
Cell numbers have been estimated from fresh samples (2001–2004 only) or Lugol-fixed samples (since 2005 only). Parallel data were statistically significantly correlated (natural log scales). When colonial cells were not counted as loose colonial cells it was assumed that colonies contain 1000 cells each for calculating cell numbers. Sampling frequencies varied from weekly, to bi-weekly, to monthly, or only occasional.
Spatially, the south-eastern North Sea area was divided into squares of 716.5 km2, for which local average concentrations were calculated. Temporally, time series was divided into regular sections (months or annual bloom seasons: April–August) enabling calculation of averages and their variability, and confidence assessments (Brockmann and Topcu, 2014). By this method the different data resolutions are smoothed and bias towards sites with more frequent sampling is avoided. Spatial gradients as well as time series were calculated with the same software (Surfer, Golden Software). The R-tool was not used because it has been shown that results are identical with the Surfer tool.
Seasonal average and maximum abundance were analysed, taking into account sampling restrictions. In general, surface data are representative of the full water column because there is vertical mixing in the mostly shallow areas. At stratified locations, Phaeocystis was predominantly found in the upper mixed layer. Trends were analysed using the Mann-Kendall test.
Results
Three countries’ Phaeocystis monitoring data are used in this assessment; Belgium (1990–2009), the Netherlands (1990–2014) and Germany (2001–2014). Monitoring sites with available Phaeocystis data are located in coastal waters; these are mostly inshore and along some transects perpendicular to the coast (Figure 1).
At all Dutch (1990–2010) and Belgian (1988–2009) monitoring sites and at most German (2003–2012) monitoring sites, concentrations of Phaeocystis cells peak each year during the growing season, April–May. At the northern part of the German coast (LLUR, Figure 1) the peak is later, usually during June.
Since Phaeocystis species generally reach seasonal maxima during April and May, the focus for assessment was on spatial gradients of Phaeocystis abundance and temporal trends in this season. No statistically significant temporal trends were observed in the analysed data.
The spatial distribution of maximum Phaeocystis concentrations sampled during spring and summer (April–August) 1990–2014 is shown in Figure 2. Phaeocystis abundance during this period was high along the Dutch and German south-east coast of the North Sea. Maximum abundances show regional ‘hot spots’ where locally Phaeocystis cell concentrations can exceed 100 million cells per litre.
The spatial pattern of Phaeocystis concentrations reflects the average salinity regime in the southern North Sea, which is influenced by river discharges within the residual coastal current. Similar spatial patterns in nutrient concentration have also been identified (nutrient concentrations indicator assessment).
There is moderate confidence in the data availability and moderate confidence in the methodology.
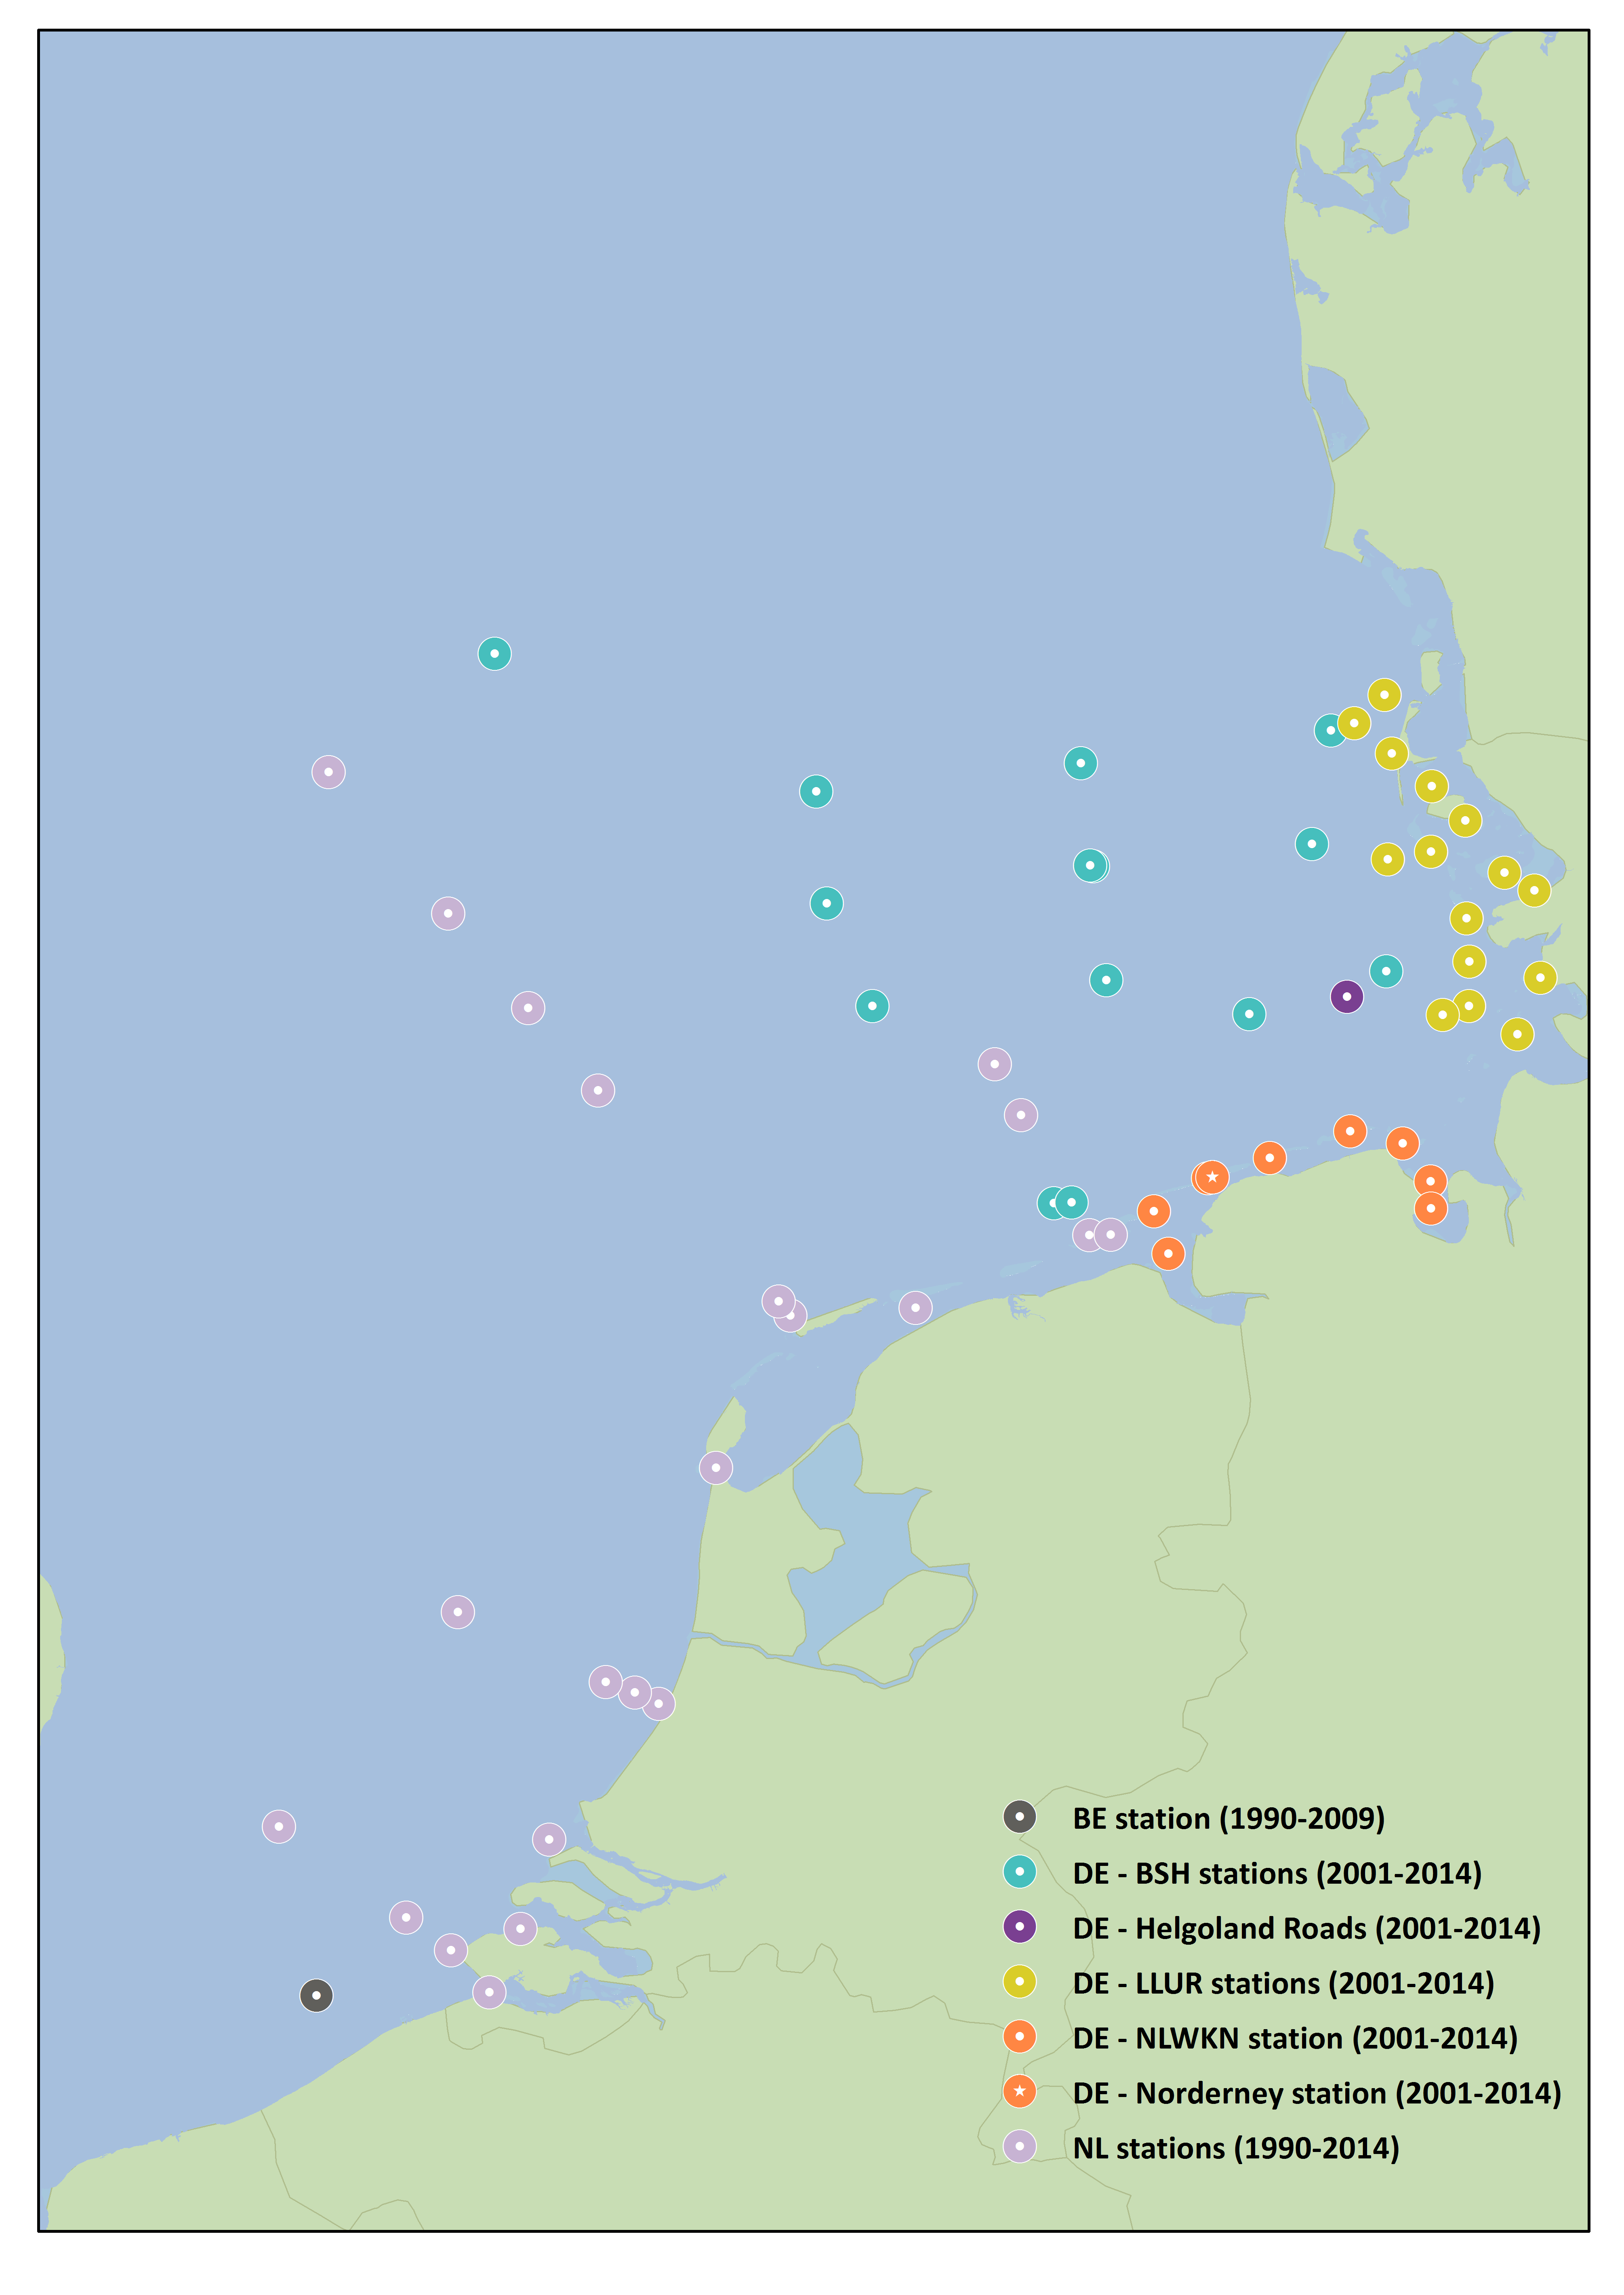
Figure 1: Sites monitored for Phaeocystis by Belgium (BE), the Netherlands (NL) and Germany (DE) (2003–2012)
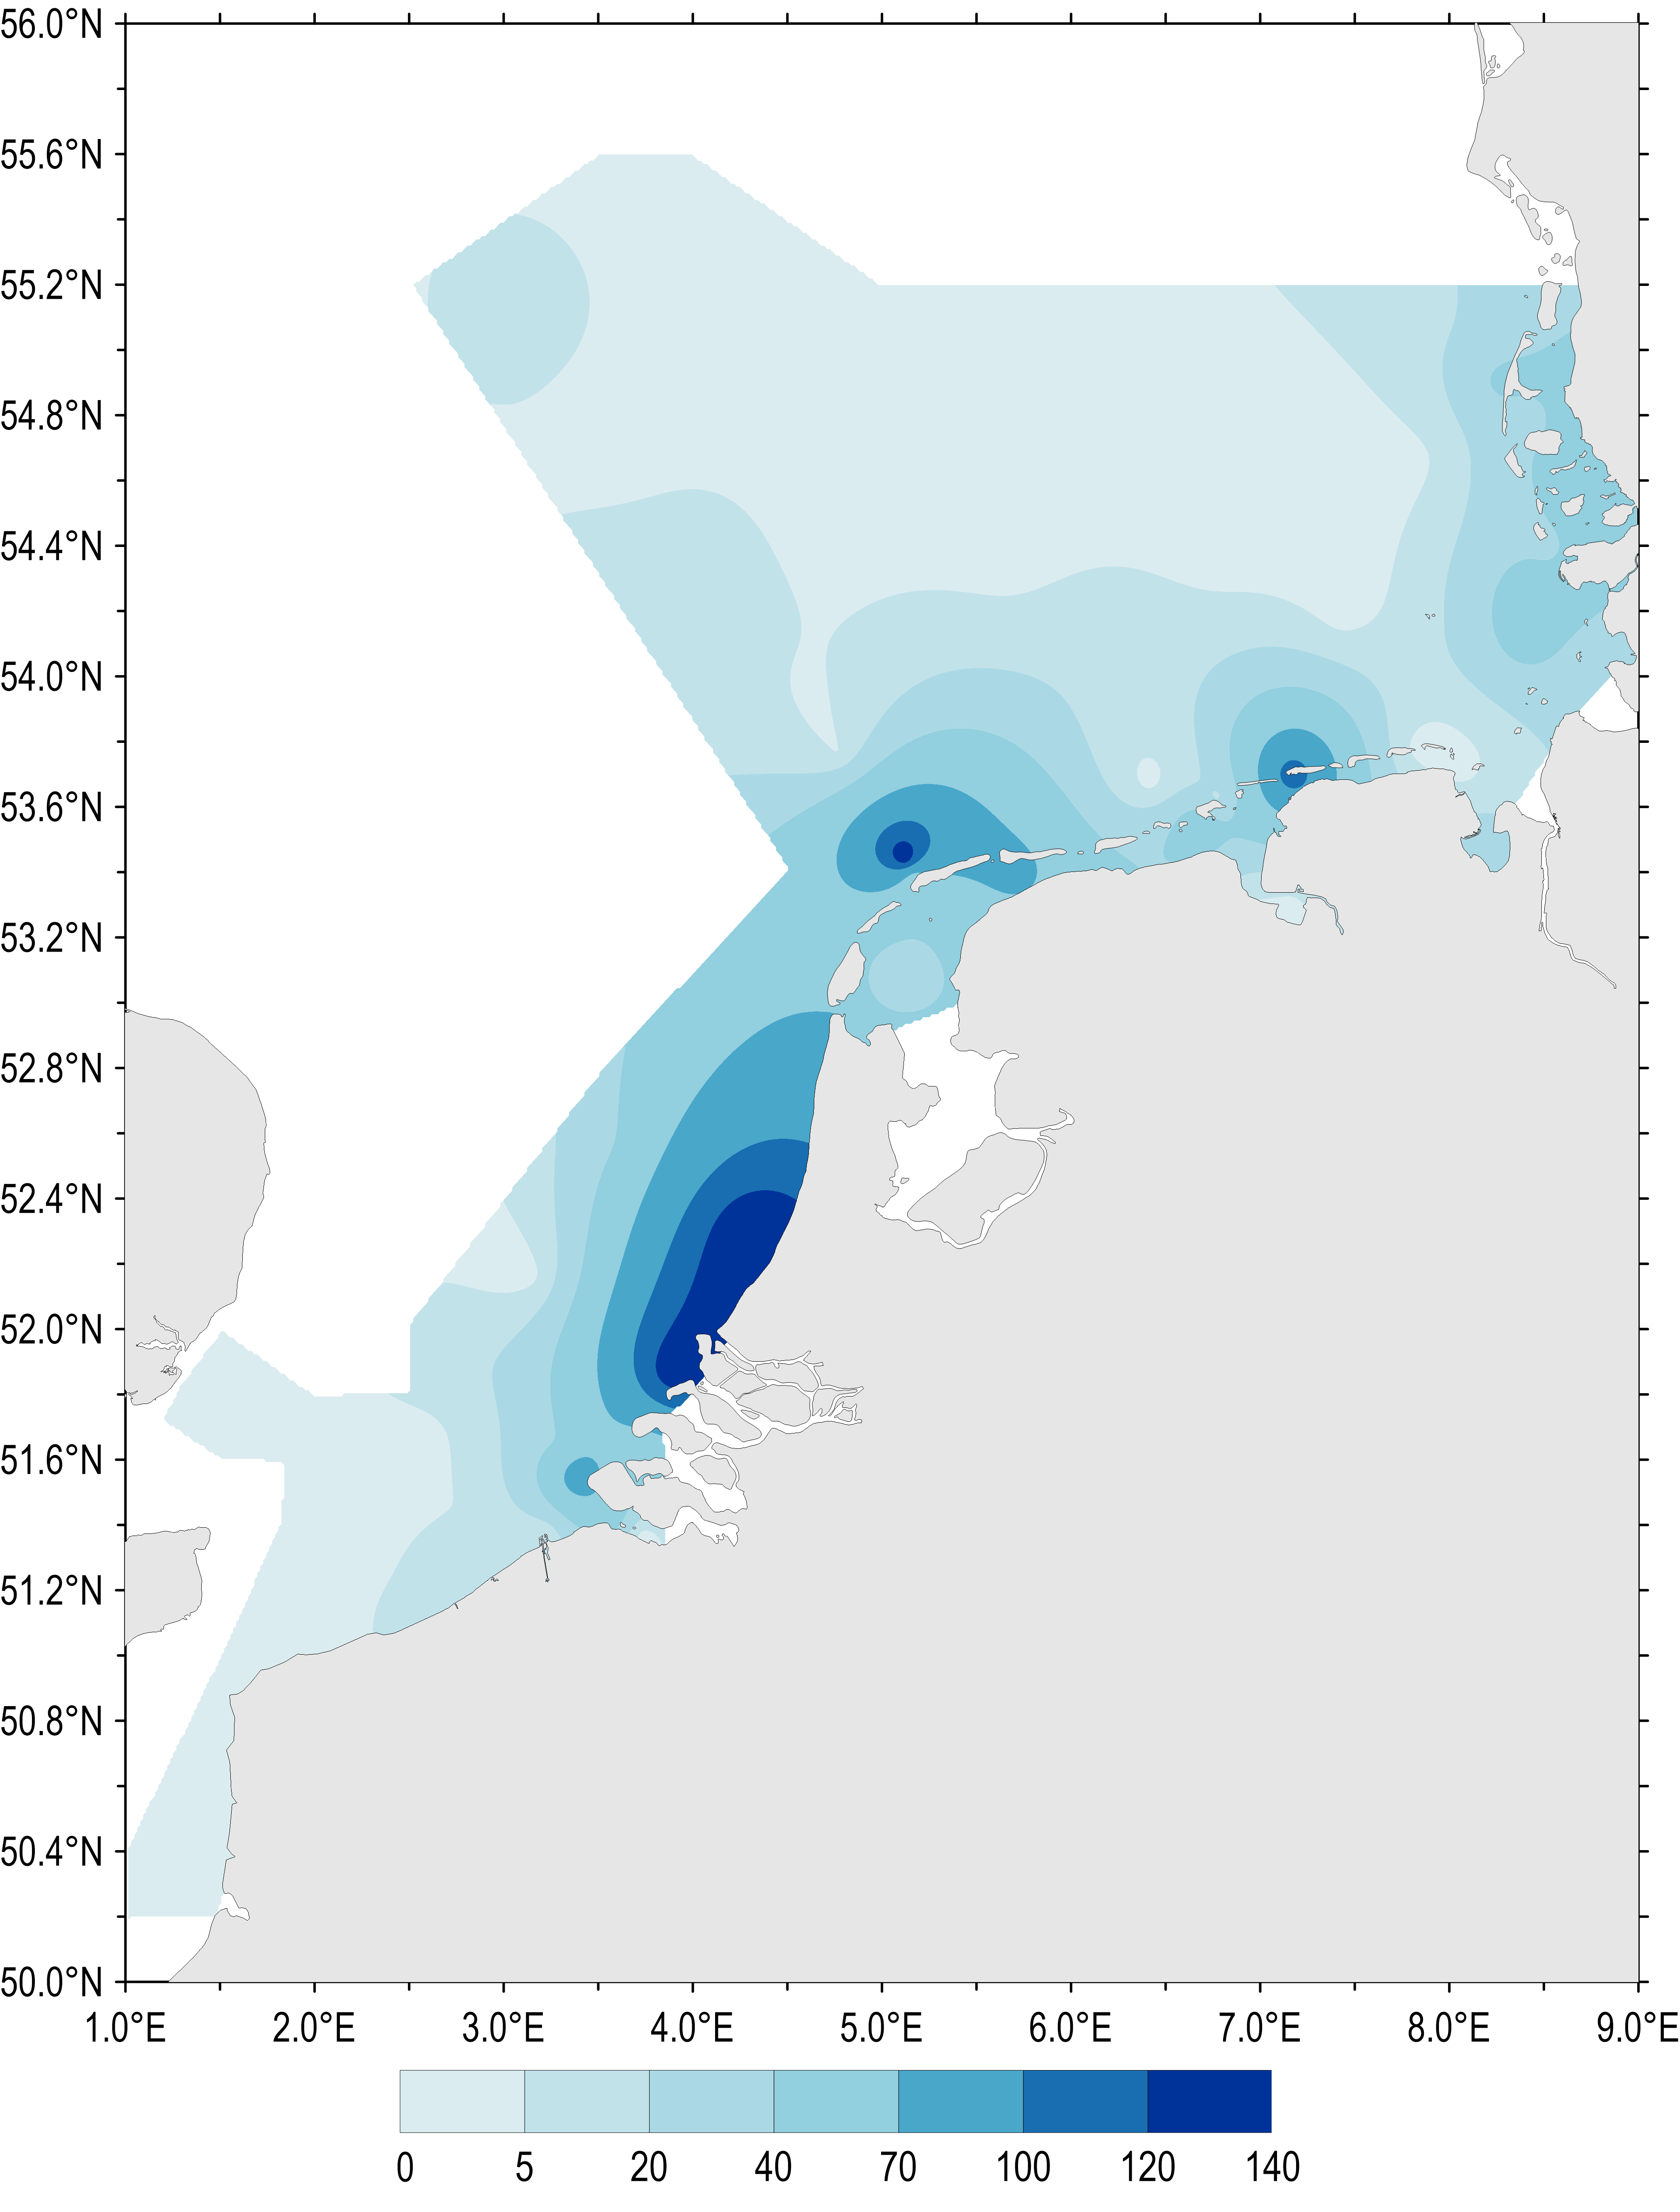
Figure 2: Gradients of maximum Phaeocystis concentrations (million cells per litre) in the period April–August (all available years and monitoring sites 1990–2014)
The assessment focused on spatial gradients and temporal trends in Phaeocystis during the growing season, April–August (Figure b).
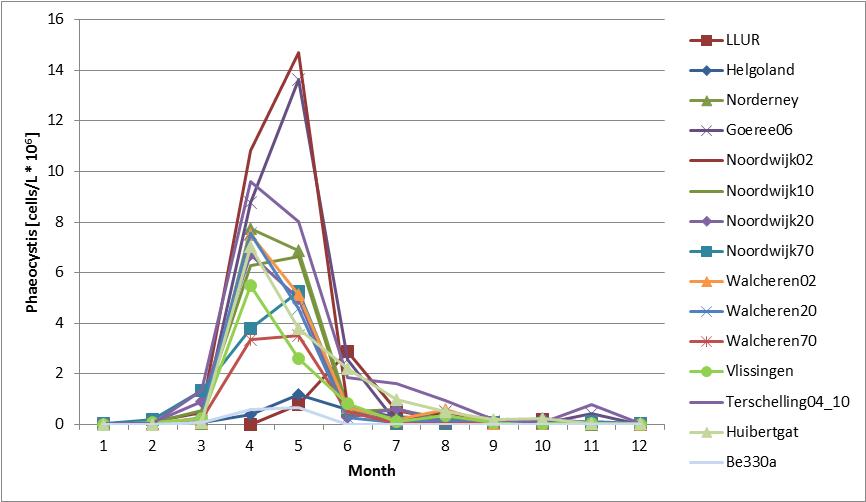
Figure b: Annual cycle of average abundance of Phaeocystis at Belgian (Be 330a; 1990–2009), Dutch (1990–2014) and German (Helgoland Reede, LLUR, Norderney, 2001–2014) stations
The Phaeocystis time series shows high spatial and temporal variability at and between monitoring sites (Figure c and Figure d). The time series of average abundance showed cell numbers were particularly in 1991, 1997–1999 and 2008 (Figure c). At Helgoland and Norderney, high cell numbers (over one million cells per litre) were counted in more than 20 successive seasonal measurements. Locally, Phaeocystis cell numbers are variable with maximum abundance at Dutch monitoring sites during 1991, 1994 and 1998 (Figure d). At Helgoland, high cell numbers (over one million cells per litre) were counted during May and June 2001–2005 (except for 2003). Interannual fluctuations ranged from near zero to over 30 million cells per litre, with peaks of up to 100 million cells per litre for maximum values. The fluctuations were probably not caused by nutrient concentrations, which were much less variable (nutrient concentrations indicator assessment).
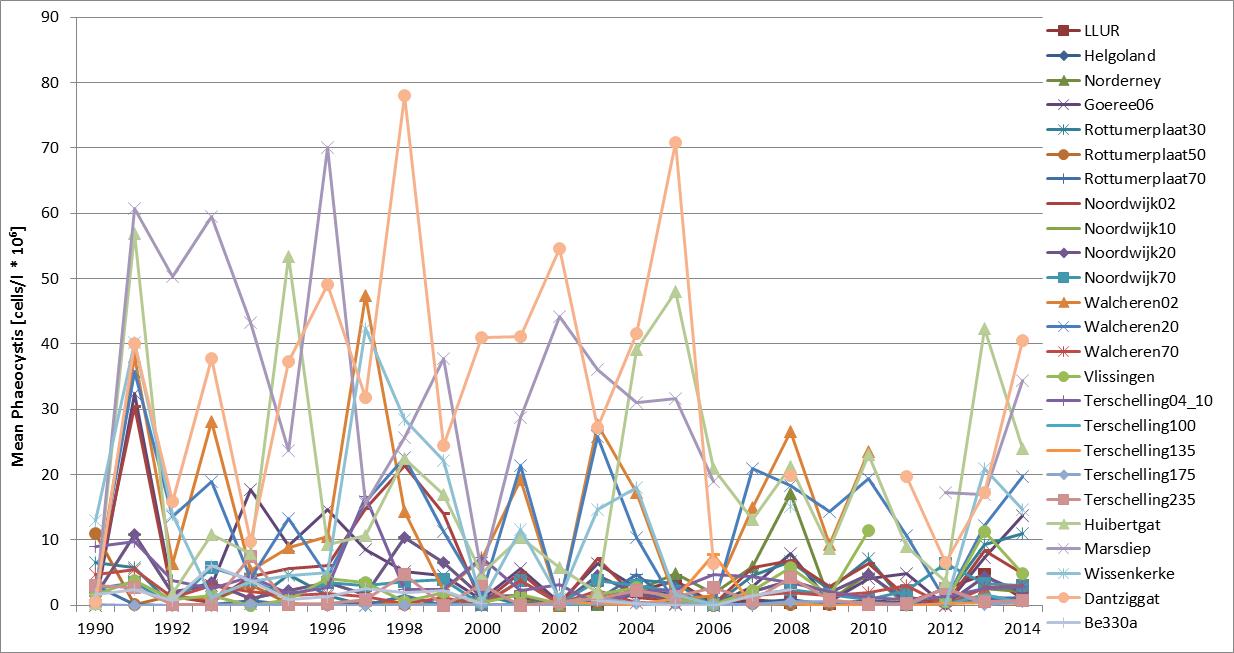
Figure c: Annual average abundance (April–August) of Phaeocystis at Belgian (Be 330a; 1990–2009), Dutch (1990–2014) and German (Helgoland Reede, LLUR, Norderney, 2001–2014) monitoring sites
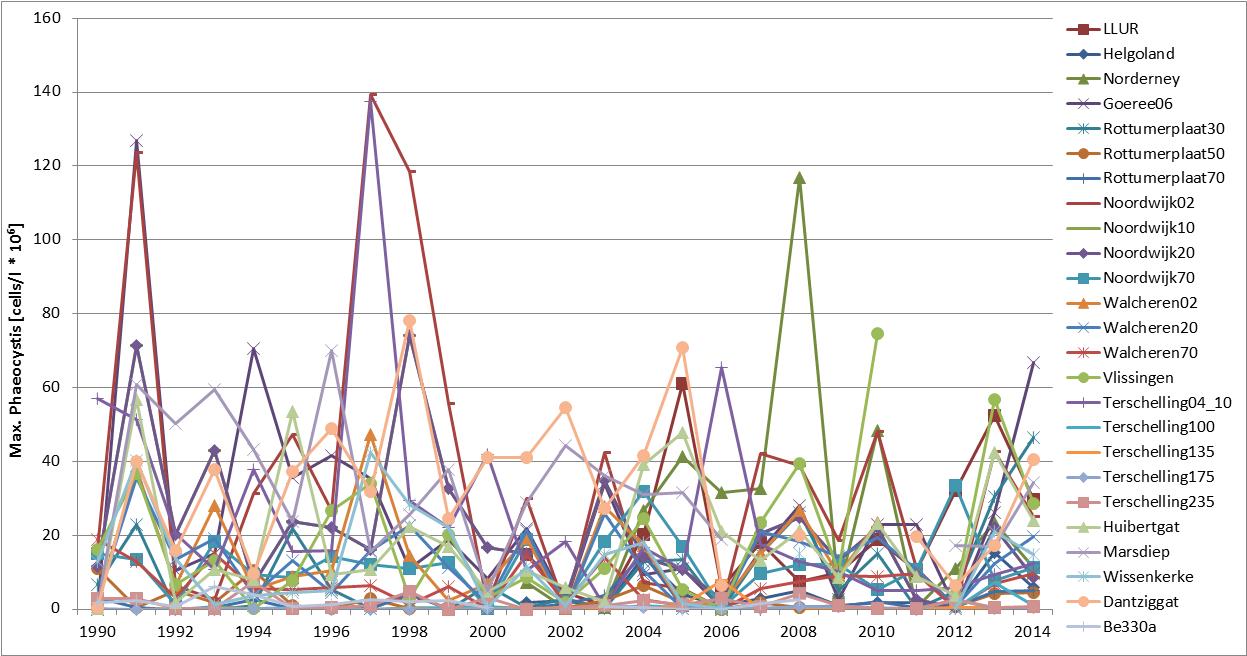
Figure d: Maximum abundance (April–August) of Phaeocystis at Belgian (Be 330a; 1990–2009), Dutch (1990–2014) and German (Helgoland Reede, LLUR, Norderney, 2001–2014) monitoring sites. For monitoring site locations see Figure 1
Samples obtained during the period April–May 1990–2014, were combined for testing the spatial distribution of seasonal Phaeocystis abundance (Figure 2 and Figure e). During the growing season average concentrations of Phaeocystis were highest at several close inshore locations along the Dutch and German coasts, 1990–2014 (Figure e).
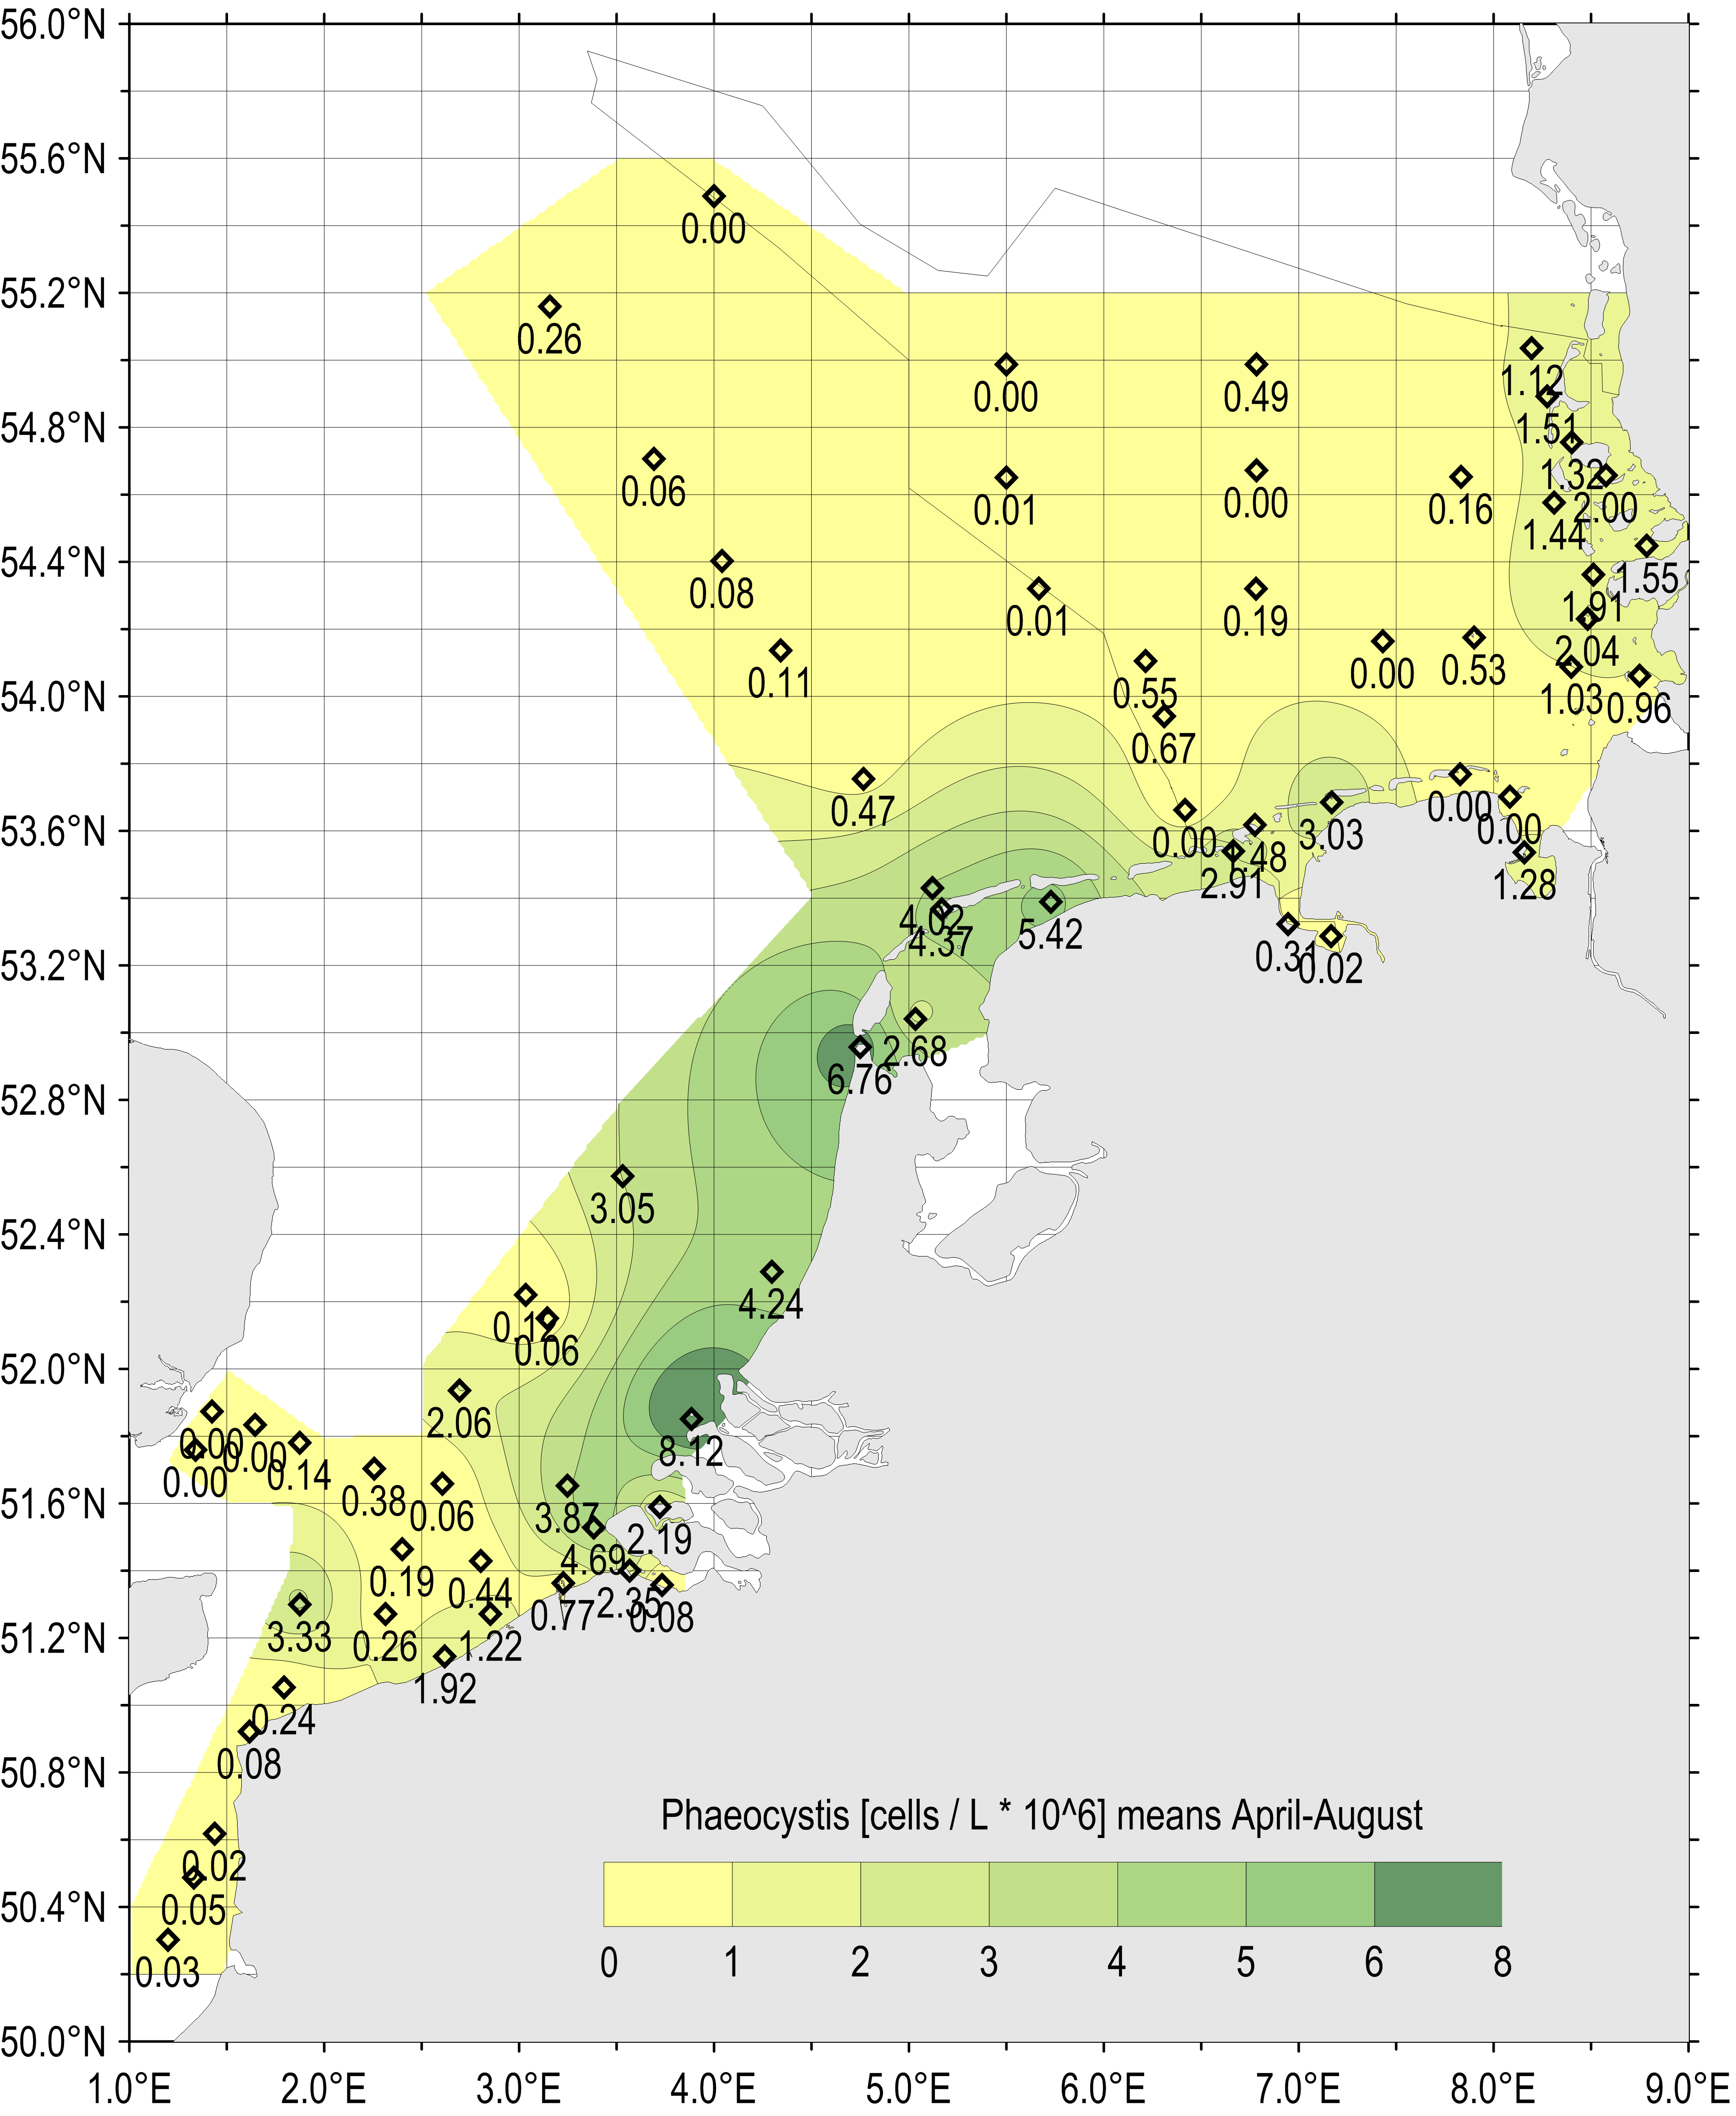
Figure e: Gradients of average Phaeocystis concentration for the period April–August (all available years and monitoring sites 1990–2014)
Spatial gradients of elevated Phaeocystis concentrations along the Dutch coast match the gradients measured at German monitoring sites. Separately, high average abundances were measured at one Belgian monitoring site in the English Channel and at the northern German coast (LLUR monitoring sites).
Although high nutrient inputs may lead to Phaeocystis blooms, annual average concentrations of Phaeocystis in the south-eastern North Sea were especially high (over one million cells per litre) before the 1960s and after the 1980s, periods when nutrient inputs from human activities were relatively low (Gieskes et al., 2007). In the Marsdiep 1990–2014, blooms of over one million cells per litre persisted for the longest periods (more than 100 days per year) around 1990 (Cadée and Hegeman, 2002).
Conclusion
High concentrations of the nuisance marine phytoplankton Phaeocystis in coastal waters (often above one million cells per litre with peaks of up to 100 million cells per litre), with concentrations decreasing offshore, can occur in response to high nutrient concentrations, and may be indicative of eutrophication.
This assessment shows Phaeocystis blooms peak during the summer growing season (April–June) in the southern North Sea. The size of the blooms varies widely from year to year with seasonal average concentrations from near zero to over five million cells per litre. These fluctuations are probably affected by a combination of different factors, such as light, temperature, salinity, other hydrodynamic influences and nutrient availability. However, nutrient concentrations were more consistent and less variable than Phaeocystis concentrations in the southern North Sea ( nutrient concentrations indicator assessment ). Furthermore, no statistically significant temporal or spatial trends could be observed in the analysed data.
The continuing high abundance of Phaeocystis (often over one million cells per litre, sometimes over 30 million cells per litre, and with peaks in maximum concentration of up to 100 million cells per litre) along the shallow continental coasts correlates with high nutrient concentrations and could be an indication of eutrophication. However, the factors driving the interannual fluctuations in concentration need more research, especially parallel sampling of potentially confounding parameters, such as nutrient ratios, changes in organic matter, stratification, vertical distribution of single cells and colonies, and residence time within the upper mixed layer.
The exact determination of Phaeocystis blooms as observed along the coasts of Belgium, the Netherlands and Germany is difficult owing to the occurrence of different ecotypes and live stages with different growth rates and grazing pressure. The specific indication of surplus nitrogen and phosphorus is limited because of the high interannual variability that is not related to the average nutrient regime. The development of colonies is not only affected by nitrate concentration but also by the light climate, temperature and grazing pressure. The assumed dependence on nutrient ratios (N/Si or P/Si) was not confirmed.
Allelopathic effects of Phaeocystis on other phytoplankton species (Hansen and Ellertsen, 2007) should be investigated more generally, including in relation to competition for nutrients. Conversely, mortality of Phaeocystis globosa by viruses has been reported (Baudox et al., 2006).
Knowledge Gaps
The availability of Phaeocystis data for the assessment was regionally restricted to the southern North Sea. The duration of blooms was difficult to determine owing to restricted sampling. Recent Phaeocystis data have yet to be fully reported and stored at the International Council for the Exploration of the Sea (ICES). The contributions of Phaeocystis to total phytoplankton biomass should be estimated to allow representative assessment in relation to chlorophyll-a concentrations.
Further research is needed to identify the reasons for the strong interannual variability in cell concentrations.
Several studies indicate that Phaeocystis abundance in the southern North Sea is to a largely extent climate-related, and determined by the amount of Atlantic Ocean water flushed through the English Channel and Dover Strait. From a management perspective it would be useful to know the extent to which that elevated Phaeocystis concentrations in this area are climate-related.
Further investigation is needed of the link between climate change and Phaeocystis abundance (Gieskes et al., 2007).
Baudox, A.C., A.A.M. Noordeloos, M.J.W. Veldhuis, C.P.D. Brussaard, 2006, Virally induced mortality of Phaeocystis globosa during two spring blooms in temperate coastal waters. Aqu. Microb. Ecol. 44, 207-217
Brockmann, U., R.W.P.M. Laane, H. Postma, 1990, Cycling of nutrient elements in the North Sea. Neth. J. Sea Res. 26 (2-4), 239-264
Brockmann, U.H., D.H. Topcu, 2014, Confidence rating for eutrophication assessments. Mar. Poll. Bull. 82,127-136
Cadée, G.C. & J. Hegeman, 1986, Seasonal and annual variation in Phaeocystis pouchetii (Haptophyceae) in the westernmost inlet of the Wadden Sea during the 1973 to 1985 period. Neth. J. Sea Res. 20, 29-36
Cadée, G.C. & J. Hegeman, 2002, Phytoplankton in the Marsdiep at the end of the 20th century; 30 years monitoring biomass, primary production, and Phaeocystis blooms. J. Sea Res. 48, 97-110
Chen, Y.Q., N. Wang, P. Zhang, H. Zhou, L.H. Qu, 2002, Molecular evidence identifies bloom-forming Phaeocystis (Prymnesiophyta) from coastal waters of southeast China as Phaeocystis globosa. Biochem. System. Ecol. 30, 15-22
European Council (EC), 1991. Directive 91/676/EEC of 12 December 1991 concerning the protection of waters against pollution caused by nitrates from agricultural sources
ECJ 2009. European Court of Justice Judgment of the Court (Third Chamber) of 10 December 2009. European Commission v United Kingdom of Great Britain and Northern Ireland. Failure of a Member State to fulfil obligations – Environment – Directive 91/271/EEC – Urban waste water treatment - Article 3(1) and (2), Article 5(1) to (3) and (5) and Annexes I and II – Initial failure to identify sensitive areas – Concept of ‘eutrophication’ – Criteria – Burden of proof – Relevant date when considering the evidence – Implementation of collection obligations – Implementation of more stringent treatment of discharges into sensitive areas. Case C-390/07 European Court Reports 2009 I-00214
Gieskes, W.W.C., S.C. Leterme, H. Peletier, M. Edwards, P.C. Reid, 2007, Phaeocystis colony distribution in the North Atlantic Ocean since 1948, and interpretation of long-term changes in the Phaeocystis hotspot in the North Sea. Biogeochemistry 83, 49-60
Gypens, N., A.V. Borges, G. Speeckaert, C. Lancelot, 2014, The dimethylsulfide cycle in the eutrophied southern North Sea: a model study integrating phytoplankton and bacterial processes. PLOS ONE 9, e85862, 15pp.
Hansen, E. & H.C. Ellertsen, 2007, Do the polyunsaturated aldehydes produced by Phaeocystis pouchetii (Hariot) Lagerheim influence diatom growth during the spring bloom in northern Norway? J. Plankton Res. 29, 87-96
Hanslik, M. & J. Rahmel, 1995, Seasonal dynamics of bloom-forming and toxic algae along the coast of Lower Saxony since 1982. DHZ 5, Suppl., 221-235
Lancelot, C., G. Billen, A. Sournia, T. Weiße, F. Colijn, M.J.W. Veldhuis, A. Davies, P. Wassmann, 1987, Phaeocystis blooms and nutrient enrichment in the Continental coastal zones of the North Sea. Ambio 16 (1), 38-46
Mari, X., F. Rassoulzadegan, C.P.D. Brussaard, P. Wassmann, 2005, Dynamics of transparent exopolymeric particles, TEP) production by Phaeocystis globosa under N- or P-limitation: a controlling factor of the retention/export balance. Harmful Algae 4, 895-914
Medlin, L. & A. Zingone, 2007, A taxonomic review of the genus Phaeocystis. Biogeochemistry 83, 3-18
OSPAR, 2008, Second OSPAR integrated report on the eutrophication status of the OSPAR maritime area. OSPAR, London, 372/2008. 107pp.
OSPAR 2010. The North-East Atlantic Environment Strategy. Strategy of the OSPAR Commission for the Protection of the Marine Environment of the North-East Atlantic 2010–2020 Agreement 2010-3
OSPAR 2013. Common Procedure for the Identification of the Eutrophication Status of the OSPAR Maritime Area Agreement 2013-08
Peperzak, L., F. Colijn, W.W.C. Gieskes, J.C.H. Peeters, 1998, Development of the diatom-Phaeocystis spring bloom in the Dutch coastal zone of the North Sea: the silicon depletion versus dayly irradiance threshold hypothesis. J. Plankton Res. 20, 517-537
Peperzak, L., R.N.M. Duin, F. Colijn, W.W.C. Gieskes, 2000a, Growth and mortality of flagellates and non-flagellate cells of Phaeocystis globosa (Prymnesiophyceae, J. Plankton Res. 22, 107-119
Peperzak, L., F. Colijn, E.G. Vrieling, W.W.C. Gieskes, J.C.H. Peeters, 2000b, Observations of flagellates in colonies of Phaecystis globosa (Prymnesiophyceae); a hypothesis for their position in the life cycle. J. Plankton Res. 22, 2181-2203
Raabe, T., U.H. Brockmann, C.D. Dürselen, M. Krause, H.J.Rick, 1997, Nutrient and plankton dynamics during a spring drift experiment in the German Bight. Mar. Ecol. Prog. Ser. 156, 275-288
Riebesell, U., 1993, Aggregation of Phaeocystis during phytoplankton spring blooms in the southern North Sea. Mar. Ecol. Progr. Ser. 96, 281-289
Riegman, R., A.A.M. Noordeloos, G.C. Cadee, 1992, Phaeocystis blooms and eutrophication of the continental zones of the North Sea. Mar. Biol. 112, 479-484
Rousseau, V., D. Vaulot, R. Casotti, V. Cariou, J. Lenz, J. Gunkel, M. Baumann, 1994, The life cycle of Phaeocystis (Prymnesiophyceae, evidence and hypotheses. J. Mar. Systems 5, 23-39
Schoenemann, V., S. Becquevort, J. Stefels, V. Rousseau, C. Lancelot, 2005, Phaeocystis blooms in the global ocean and their controlling mechanisms: A review. J. Sea Res. 53, 43-66
Stelfox-Widdicombe, C.E., S.D. Archer, P.H. Burkill, J. Stefels, 2004, Microzooplankton grazing in Phaeocystis and diatom-dominated waters in the southern North Sea in spring. J. Sea Res. 51, 37-51
Sunda, W., D.J. Kieber, R.P.Kiene, S. Huntsman, 2002, An antioxidant function for DMSP and DMS in marine algae. Nature 418, 317-320
Veldhuis, M.J.W., C.P.D. Brussaard, A.A.M. Noordeloos, 2005, Living in a Phaeocystis colony: a way to be successful algae species. Harmful Algae 4, 841-858
Weisse, T., K. Tande, P. Verity, F. Hansen, W. Gieskes, 1994, The trophic significance of Phaeocystis blooms. J. Mar. Systems 5, 67-79
Xu, N., Y. Qi, J. Chen, W. Huang, S. Lv, Y. Wang, 2003, Analysis of the cause of Phaeocystis globosa Scherffel red tide. Acta Sci. Circumst. Huanjing, 23, 113-118
| Sheet reference | HASEC17/D503 |
|---|---|
| Assessment type | Intermediate Assessment |
| Context (1) | Eutrophication |
| Context (2) | OSPAR Publication 2003-189 OSPAR integrated report 2003 on the eutrophication status of the OSPAR maritime area based upon the first application of the Comprehensive Procedure; |
| Context (3) | D5 - Eutrophication |
| Context (4) | D5.2 - Direct effects of nutrient enrichment |
| Point of contact | Annika Grage |
secretariat@ospar.org | |
| Metadata date | 2015-09-01 |
| Title | Trends in Blooms of the Nuisance Phytoplankton Species Phaeocystis in Belgian, Dutch and German Waters |
| Resource abstract | Common indicator trends in blooms of the nuisance phytoplankton species Phaeocystis in the south-east of the Greater North Sea: Belgian, Dutch and German waters. |
| Linkage | https://www.ospar.org/documents?v=6962 |
| Topic category | Environment |
| Indirect spatial reference | L3.2.5.1;L3.2.5.2;L3.2.5.3;L3.2.5.4;L3.2.5.5;L3.2.5.6;L3.2.5.7;L3.2.5.11;L3.2.5.12;L3.2.5.14;L3.2.5.15;L3.2.5.16;L3.2.5.19;L3.2.5.20;L3.2.5.22;L3.2.5.23;L3.2.5.24;L3.2.5.27;L3.2.5.28; |
| N Lat | 57.3475216749854 |
| E Lon | 9.10323512570056 |
| S Lat | 51.0898943348557 |
| W Lon | 0.164464855668598 |
| Countries | DE, NL |
| Start date | 2003-01-01 |
| End date | 2014-12-31 |
| Date of publication | 2017-06-30 |
| Conditions applying to access and use | https://www.ospar.org/site/assets/files/1215/ospar_data_conditions_of_use.pdf |
| Data Snapshot | https://odims.ospar.org/documents/150/download |
| Data Results | https://odims.ospar.org/documents/284/download |
| Data Source | http://www.ices.dk/marine-data/data-portals/Pages/DOME.aspx |