

Socioeconomics of the OSPAR Maritime Area
The North East Atlantic includes a diverse range of environmental conditions and different ecosystems. These play a key role in the types and patterns of human activities in the OSPAR maritime area and associated pressures on the marine environment. The OSPAR Maritime Area provides the basis for a wide range of goods and services including food, transport, energy and amenities for millions of people. Maritime activities are important for the economies of the OSPAR Contracting Parties in terms of gross value added and employment. Many of the activities are expected to increase in the future and new activities will emerge. The consequences of these activities for the marine ecosystem can lead to direct costs for society. On the other hand, many activities directly depend on a good condition of marine waters. While OSPAR has a long history in assessing the state of the marine environment and the pressures from human activities affecting it, OSPAR has only recently begun to work on economic and social analyses. Understanding the linkage between the health of the marine environment and human wellbeing can help support effective management of human activities and the sustainable use of the sea. Under its North-East Atlantic Environment Strategy, OSPAR is developing and refining methodologies, including social and economic analysis of the uses of the OSPAR Maritime Area, to aid future evaluations of whether the North-East Atlantic is used sustainably. This OSPAR work also underpins a coordinated regional approach to economic and social analyses for the North-East Atlantic, which European Union Member States are required to deliver under the Marine Strategy Framework Directive. |

Mud flats in the Wadden Sea one of the diverse ecosystems in the North East Atlantic
This chapter provides preliminary considerations of the methodology associated with assessing the economic and social value of the OSPAR Maritime Area and an initial regional indicator-based economic and social analysis of selected uses of the North-East Atlantic, supported by a description of their spatial distribution.
Economic and social analysis of uses of the seaOver the past years, OSPAR countries have been working together to align the collection of data describing the uses of their marine waters, using a minimum set of indicators. Economic sectors for which data are available for most countries are fisheries and aquaculture, shipping, ports, oil and gas industry, and offshore wind energy. The indicators to characterise these selected uses are gross value added (i.e. the value added by each sector to the gross domestic product), employment, and a qualitative description of the development in production value, based on the difference between the turn over data in the Member States’ reported initial assessments in 2012 and 2018. Ecosystem goods and services: Linking economic analyses to the use of the marine environment
|
An important driver for the implementation of the concept of ecosystem services is Action 5 of the EU Biodiversity Strategy, which foresees that Member States will, with the assistance of the European Commission, map and assess the state of ecosystems and their services in their national territory by 2014, assess the economic value of such services, and promote the integration of these values into accounting and reporting systems at EU and national level by 2020. In addition, OSPAR’s North East Atlantic Environment Strategy, which has implementing the ecosystem approach as one of its main objectives, is another driver for this work. The Strategy commits OSPAR countries to continue to progressively implement the Ecosystem Approach to the management of human activities in order to reduce impacts on the marine environment, taking into account all pressures from human activities on the marine environment. One of the main strategic directions under this objective is to develop methodologies, including social and economic analysis of the use of the OSPAR Maritime Area, to support evaluations of whether the North-East Atlantic Ocean is used sustainably. Ecosystem goods and services is one such approach that will need to be further developed in a regional context. Based on the DEVOTES project, as well as the INTERREG project VALMER, Börger et al. (2016) presented some interesting case studies on the use of ecosystem services in the marine environment (fisheries, marine protected areas, and underwater noise) that can be used as a source of inspiration for the continued work of OSPAR on socio-economic assessments. Key findings from the implementation of ecosystem services in relation to the EU Water Framework Directive will also be taken into account, such as from ESAWADI (Ecosystem Services Approach for Water Framework Directive Implementation). |
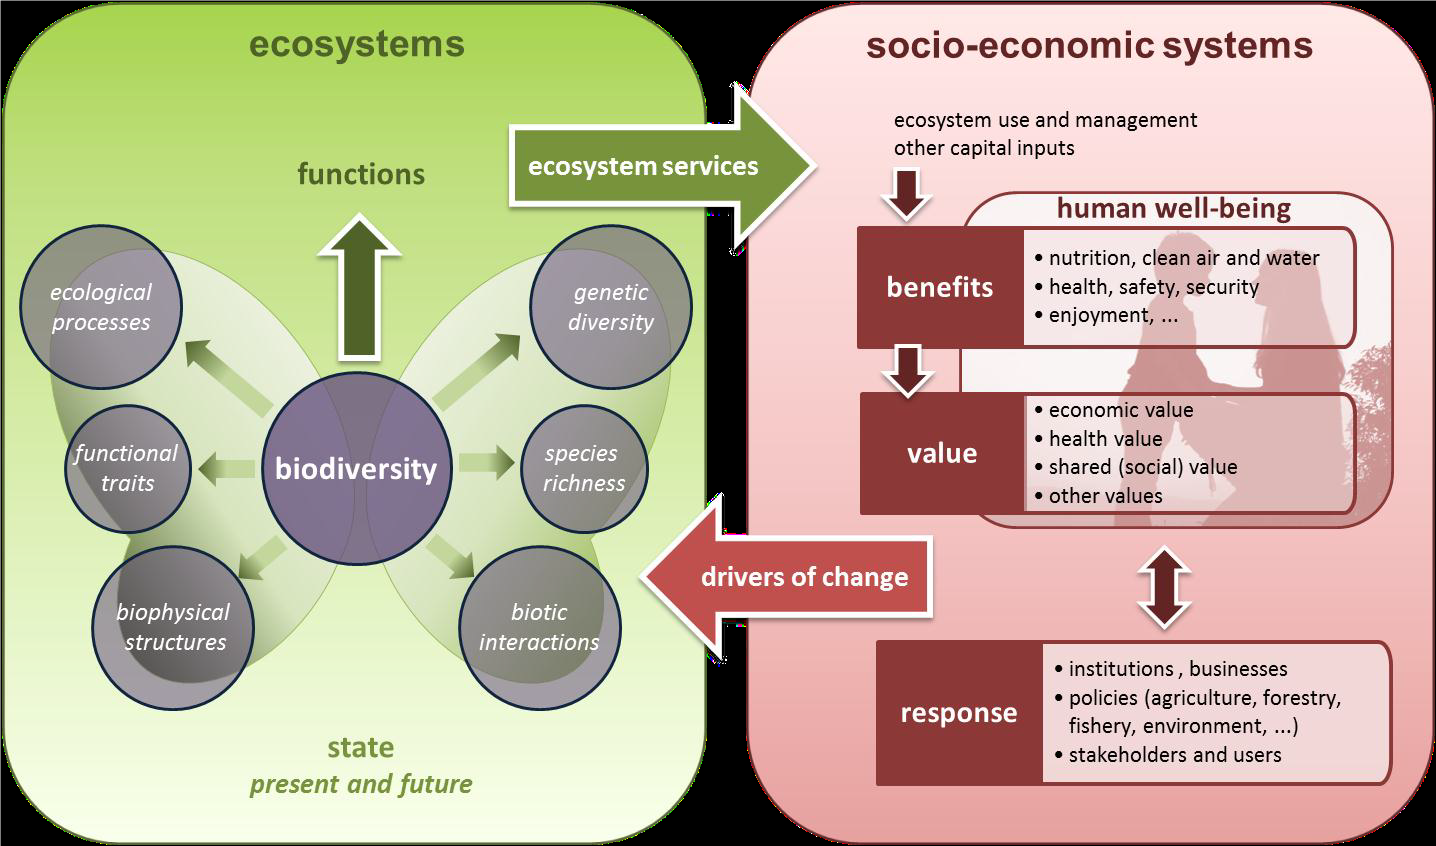
Figure 1 Conceptual framework for EU wide ecosystem assessments that shows how a functioning ecosystem delivers flows of ecosystem services to the socio-economic system, and how the ecosystem are impacted by drivers in the socio-economic system (EU, 2013)
The economic and social analysis is based on statistical data used by EU Member States who are Contracting Parties in their marine status assessments under the Marine Strategy Framework Directive in 2018. Also the non-EU country Norway provided the necessary information[1] . For the data collection and regional analysis, Contracting Parties agreed to use as far as possible the internationally agreed nomenclature of economic activities NACE (Nomenclature statistique des activités économiques dans la Communauté Européenne), an EU-wide classification scheme to define sectors for the collection of statistical data[2] . Despite these arrangements, the collected national data are not fully comparable. One important difference relates to the level of detail at which the economic sector and its sub-activities were reported. Another important difference relates to the scale of the reported indicators: Some countries reported national data, others focused on the national part of the regional sea. This means that the results reported by the countries should be considered with great care and should not be used to derive an aggregated number for the entire OSPAR region. However, they are the best available data, and if in the future this analysis is repeated in the same way, these data can be used to present economic trends.
In general, the data presented refer to the OSPAR area. However, for some countries the numbers present the data on national level, since for them it was impossible to make a detailed distinction between for example fresh water activities and marine activities.
In addition, a series of maps describe the spatial distribution and intensity of the selected uses based on existing OSPAR data streams, and other sources where necessary and as identified. The spatial presentation of the activities helps identify ‘hotspots’ of certain economic activities, which can be linked to potential environmental pressures.
[1] The data on gross value added in the various tables are presented in euros. For Norway and UK both the euro figures and (between brackets) the original values are presented. For the conversion from orginal data to euros, the Eurostat exchange rates for annual data were used: http://appsso.eurostat.ec.europa.eu/nui/show.do
[2] Note that the data provided by statistical offices refer to the economic value that the various economic sectors contribute to the national numbers of the respective country. As a consequence, the economic data cover only the firms that have the nationality of the Parties and not the total economic value obtained by the exploitation in each EEZ's Party. Therefore, the numbers presented in the tables are an underestimate of the total value of all activities taking place.
Fisheries and aquaculture
The fisheries’ sector is understood to include fishing (NACE Code 03.1) and aquaculture (NACE Code 03.2), excluding fish processing industries.
Fisheries operate across the entire OSPAR Maritime Area. The fisheries’ sector data are collated and managed at EU level (ICES, DG-MARE and other relevant parties). As a consequence the data presented below should be considered as indicative only.
Figure 1 illustrates seabed abrasion due to demersal fisheries, as an example of the spatial extent of this activity. Figure 1 does not include pelagic fisheries, as a fishing intensity map was not available for the whole OSPAR Maritime Area, which would show a different spatial pattern.
In most OSPAR countries, future developments in the fisheries sector are largely dependent on the European Common Fisheries Policies and associated future catch quota, as well as on the development of fuel prices. The most important environmental impacts of this economic sector are the removal of target species, by-catch of non-target species including water birds and marine mammals, as well as impacts on the seabed.
Aquaculture is not significant on a national scale for most OSPAR countries. The locations of shellfish cultures, finfish farms and general aquaculture sites (Figure 2) highlight the differences in their distribution across the OSPAR Maritime Area. Most finfish aquaculture occurs in Norway, Scotland and Ireland, whereas aquaculture for shellfish is more widespread.
| Contracting Party | Gross Value Added (Million euro/year) | Year | Employed persons (FTEs) | Year | Development in production value or other relevant data on trends between first and second Initial Assessment | Scale: OSPAR area, national, other | Data sources |
|---|---|---|---|---|---|---|---|
| Belgium[3] | 363 | 2016 | Increase from 68,367 million Euro in 2009 to 81,815 million Euro in 2015 | ||||
| Denmark[4] | 184 | 2014 | 1,289 | 2014 | No possibility for comparison | OSPAR | STECF |
| France | Aquaculture : 443 | 2014 | Aquaculture : 9,284 | 2014 | Aquaculture: sales volumes decreasing, production value increasing | National | Aquaculture : Enquête Aquaculture DPMA / BSPA ; données DCF Aquaculture ; STECF 16-19 « Aquaculture economic data table ». Fisheries : données DCF, DPMA, Ifremer SIH, rapport Capacités 2016 |
| Fisheries : 517 | Fisheries : 9,681 | Fisheries : gross value added steady, employment decreasing | |||||
| Germany | Fisheries : 57 | 2015 | (43,638 national, Fisheries, Aquaculture, including fish processing industry) | 2015 | Gross Value Added (Fisheries and Aquaculture together): 65.8 Mio. € in 2007. There may have been a slight increase. The current values for Fisheries and Aquaculture cannot be added together because they are from different years. | Gross Value Added: OSPAR area, Employed persons: national | Gross Value Added Fisheries: STECF 2017: Scientific, Technical and Economic Committee for Fisheries (STECF) 2017. The 2017 Annual Economic Report on the EU Fishing Fleet (STECF-17-12). Publications Office of the European Union, Luxembourg. Gross Value Added Aquaculture: STECF 2016: Scientific, Technical and Economic Committee for Fisheries (STECF) 2016. Economic Report of the EU Aquaculture Sector (EWG- 16-12); Publications Office of the European Union, Luxembourg. Employed persons: Fisch-Informationszentrum 2018a: Strukturdaten (online), http://www.fischinfo.de/index.php/markt/datenfakten |
| Aquaculture : 9 | 2014 | ||||||
| Ireland | Sea fisheries 187 | 2016 | Sea fisheries 2,536 + Aquaculture 1,030 | 2016 | Sea fisheries: Gross Value Added % change 2010 - 2012: 91% 2012 - 2014: 18% 2014 - 2016: 11% | Irish Marine Waters | All data taken from Ocean Economy 2015 & 2017 reports: https://www.ouroceanwealth.ie/sites/default/files/sites/default/files/Publications/2017/SemruIreland%27sOceanEconomy2017.pdf https://www.ouroceanwealth.ie/sites/default/files/sites/default/files/news/Final%20Semru%20-%20Ireland%27s%20Ocean%20Economy%202015%20Report.pdf |
| Aquaculture 72 | Aquaculture: Gross Value Added % change 2010 - 2012: 31% 2012 - 2014: -19% 2014 - 2016: 46% | ||||||
| Netherlands[5] | 58 | 2014 | 600 | 2014 | Decrease | Dutch part of the North Sea (approx. 30% of total NL) | https://www.noordzeeloket.nl/publish/pages/138222/economic-description-of-the-dutch-north-sea-and-coast-2005-2010-2014.pdf |
| Norway | 3,022 (27,047 million NOK) | 2015 | 15,570 | 2015 | No clear trend, going up and down | National (=OSPAR) | Statistics Norway |
| Portugal | Fisheries, aquaculture, processing, wholesale and retail of its products: 1,223 | 2013 | Fisheries, aquaculture, processing, wholesale and retail of its products: 62,395 | 2013 | Increase in GVA and there isn’t a clear trend regarding FTEs. | National | Statistics Portugal (Satellite Account for the Sea) https://www.ine.pt/xportal/xmain?xpid=INE&xpgid=ine_destaques&DESTAQUESdest_boui=261968449&DESTAQUESmodo=2&xlang=en |
| Spain | Fishing: 977 | 2016 | Fishing: 25,854 | 2016 | Sea fishing - GVA trend: 867 (2009), 833.5 (2010), 902 (2011), 913 (2012), 890 (2013), 1,038 (2014), 957 (2015), 1,142 (2016); employment decreasing from 36,707 in 2009 to 30,240 in 2016 Aquaculture | OSPAR | Encuesta Económica de Pesca Marítima (https://www.mapa.gob.es/es/estadistica/temas/estadisticas-pesqueras/pesca-maritima/encuesta-economica-pesca-maritima/default.aspx) and Encuesta Económica de Acuicultura (https://www.mapa.gob.es/es/estadistica/temas/estadisticas-pesqueras/acuicultura/encuesta-economica-acuicultura/default.aspx) of the Ministry of Agriculture, Fisheries and Food |
| Aquaculture: 87 | Aquaculture: 4,273 | ||||||
| Sweden | Fishing: 23 | 2014 | Fishing: 854 | 2014 | National | Fishing: Eurostat. Aquaculture: Statistics Sweden | |
| Aquaculture: 7 | Aquaculture: 83 | ||||||
| UK | Fisheries: 490 (£356m) | 2015 | Fisheries: 8,135 | 2015 | Productivity trend - Fisheries: Increase Aquaculture: No significant change | National | Fisheries: GVA: Office for National Statistics Annual Business Survey (provided by Cefas) – data from 2015 Employment: STECF (2017) – data from 2015 Productivity: STECF (2017) – data from 2008-2015 Aquaculture: GVA: Uprated by inflation from 2013 values provided in SSPO (2014), UKMMAS (2010) Employment: Cefas (2015) – data from 2012 Productivity: MSS (2015), Cefas (2015) collated in Celtic Seas Partnership (2016) – data from 2009-2014 |
| Aquaculture: 563 (£409m) | Aquaculture: 3,231 | 2012 |
[3]Belgian fishing territory: North Sea, English Channel, Bay of Biscay, Western Waters, Celtic and Irish Sea
[4]The numbers on gross added value only covers fisheries. Aquaculture and marine aquaculture are not included in the Danish description for the OSPAR area.
[5]In Dutch report Value added of 48 mln is mentioned, which is in 2010 prices
Shipping
Shipping is understood as maritime transport including sea and coastal passenger water transport (NACE Code 05.1) and sea and coastal freight water transport, excluding inland transport (NACE Code 05.2).
Shipping takes place throughout the OSPAR Maritime Area, although the highest densities of ship traffic are found in the English Channel and the southern North Sea, where the majority of Europe’s largest ports are located (Figures 3 and 4), and at the entrance to the Mediterranean Sea. There is also support traffic for offshore oil and gas platforms in the North Sea as well as for new wind farm developments in the North Sea.
Most OSPAR countries expect an increase of ship transport and shipping. However, due to the application of more sustainable practices (for instance marine planning and wider regulatory mechanisms) emissions per ship will probably reduce, and therefore, the environmental impacts caused by this economic sector are not expected to grow proportionally with the economic developments in this sector.
| Contracting Party | Gross Value Added (Million euro/year) | Year | Employed persons (FTEs) | Year | Development in production value or other relevant data on trends between first and second Initial Assessment | Scale: OSPAR area, national, other | Data sources |
|---|---|---|---|---|---|---|---|
| Belgium | |||||||
| Denmark[6] | Shipping: 2,900 | Shipping: 2015 | Shipping: 13,760 | Shipping: 2015 | No possibility for comparison | Entire national area | Shipping: national statistics, Passenger transport: Eurostat |
| Passenger transport: 517 | Passengers: 2014 | Passenger transport: 5,653 | Passengers: 2014 | ||||
| France | Sea and coastal passenger and freight water transport: 873 | 2013 | 27,500 | 2014 | Passenger transport activity: steady Freight transport activity: decreasing then increasing | National | SOeS, ONML |
| Germany | 86,000 | Data in Assessments are not comparable due to other basis | National | Oxford Economics 2015 in: Deutscher Reederverband 2018: Daten & Fakten (online), http://www.reederverband.de/daten-und-fakten/infopool.html (Zugriff 22.05.2018) | |||
| Ireland | Shipping and maritime transport: 533 | 2016 | Shipping and maritime transport: 4,666 | 2016 | Shipping and maritime transport: Gross Value Added % change 2010 - 2012: 8% 2012 - 2014: 30% 2014 - 2016: 9% | Irish Marine Waters | All data taken from Ocean Economy 2015 & 2017 reports: https://www.ouroceanwealth.ie/sites/default/files/sites/default/files/Publications/2017/SemruIreland%27sOceanEconomy2017.pdf https://www.ouroceanwealth.ie/sites/default/files/sites/default/files/news/Final%20Semru%20-%20Ireland%27s%20Ocean%20Economy%202015%20Report.pdf |
| International Cruise Industry 10 | Aquaculture: Gross Value Added % change 2010 - 2012: -% 2012 - 2014: 10% 2014 - 2016: 0% | ||||||
| Netherlands[7] | 1,616 | 2014 | 9,500 | 2014 | Increase | Dutch part of the North Sea (= national) | https://www.noordzeeloket.nl/publish/pages/138222/economic-description-of-the-dutch-north-sea-and-coast-2005-2010-2014.pdf |
| Norway[8] | Ocean transport, passengers: 220 (1,967 million NOK) Ocean transport, freight and supply: 5,096 (45,608 million NOK) | 2015 | Ocean transport, passengers: 1,770 Ocean transport, freight and supply: 42,070 | 2015 | Increase in ocean transport | National (=OSPAR) | Statistics Norway |
| Domestic sea transport, goods and passengers, including inland transport (but this is a very small amount): 426 (3,811 million NOK) | Domestic sea transport, goods and passengers, including inland transport (but this is a very small amount): 7,730 | 2015 | |||||
| Portugal | Shipping: 98 | 2013 | Shipping: 2,221 | 2013 | No clear trend | National | Based on the Satellite Account for the Sea (Statistics Portugal) https://www.ine.pt/xportal/xmain?xpid=INE&xpgid=ine_destaques&DESTAQUESdest_boui=261968449&DESTAQUESmodo=2&xlang=en, Statistics Portugal |
| Spain | Maritime passengers transport: 11 | 2016 | Maritime passengers transport: 139 | 2016 | Maritime passengers transport and freight: Gross Value Added % change 2015-2016: increased 12% and 11% respectively | OSPAR | Instituto Nacional de Estadística- Principales magnitudes según actividad principal (CNAE-2009 a 1,2,3 y 4 dígitos). http://www.ine.es/dyngs/INEbase/operacion.htm?c=Estadistica_C&cid=1254736176865&menu=resultados&secc=1254736195033&idp=1254735576778 |
| Maritime freight transport: 2,649 | Maritime freight transport: 26,220 | ||||||
| Sweden | 591 | 2014 | 2176 | 2014 | None | National | Statistics Sweden |
| UK | Maritime Transport: 10,840 (£7,868m) | 2015 | Maritime Transport: 130,900 | 2013 | Productivity trend -– Maritime Transport: No significant change | National | Maritime Transport: GVA and employment: Oxford Economics (2015) – GVA uprated by inflation from 2013 prices Productivity: DfT (2014), collated in Celtic Seas Partnership (2016) |
[6]No NACE
[7]In Dutch report 1,790 is mentioned, which is in 2010 prices
[8]In national account, shipping aggregates are not directly comparable to NACE definitions.
Ports
The sector ‘ports’ is understood to cover manufacturing (building ships and boats; NACE Code 30.1), wholesale trade (other specialized wholesale; NACE Code 46.7), construction (civil engineering, construction of buildings excluded; NACE Code 42) and transportation and storage (warehousing for transportation; NACE Code 52.1).
Major ports are widely distributed along the OSPAR coasts (Figure 4). They provide a wide range of support services including shipbuilding and maintenance.
Activities in ports can be expected to be depending on the developments in the shipping sector. The shipping sector is expected to increase in most of the OSPAR area. Therefore, activities in ports (such as cargo handling (e.g. wholesale trade), ship building, ship maintenance, etc) are expected to increase as well.
| Contracting Party | Gross Value Added (Million euro/year) | Year | Employed persons (FTEs) | Year | Development in production value or other relevant data on trends between first and second Initial Assessment | Scale: OSPAR area, national, other | Data sources |
|---|---|---|---|---|---|---|---|
| Belgium | 18,000, together with the indirect added value this increases up to 33,000 | 2015 | 114,647 FTEs (direct employment) and together with indirect employment this adds up to 252,394 FTEs | 2015 | 400 million Euro in 2010 | National | |
| Denmark | N/A | N/A | N/A | N/A | N/A | N/A | |
| France | Building ships and boats (NAF 2008 30.11Z, 33.15Z and 30.12Z): 1,773 | 2014 | 25,884 | 2014 | Building ships and boats : production value and employment increasing | National | INSEE |
| Germany | N/A | N/A | N/A | N/A | N/A | N/A | |
| Ireland | Marine Manufacturing Construction and Engineering: 71 | 2016 | 1,023 | 2016 | Gross Value Added % change 2010 - 2012: - 21% 2012 - 2014: 98% 2014 - 2016: 9% | Irish Marine Waters | All data taken from Ocean Economy 2015 & 2017 reports: https://www.ouroceanwealth.ie/sites/default/files/sites/default/files/Publications/2017/SemruIreland%27sOceanEconomy2017.pdf https://www.ouroceanwealth.ie/sites/default/files/sites/default/files/news/Final%20Semru%20-%20Ireland%27s%20Ocean%20Economy%202015%20Report.pdf |
| Netherlands | 15,552 | 2014 | 136,000 | 2014 | Increase | Ports that can be accessed by sea vessels | https://www.noordzeeloket.nl/publish/pages/138222/economic-description-of-the-dutch-north-sea-and-coast-2005-2010-2014.pdf |
| Norway[9] | Manufacturing (building ships and boats): 612 (5,474 million NOK) | 2015 | Manufacturing (building ships and boats): 6,280 | 2015 | National (=OSPAR) | Statistics Norway | |
| Construction (civil engineering; construction of buildings excluded): 2,071 (18,539 million NOK) | Construction (civil engineering; construction of buildings excluded): 19,390 | ||||||
| Portugal | 1,632 | 2013 | 45,293 | 2013 | Steady GVA. A decrease in FTEs | National | Based on the Satellite Account for the Sea (Statistics Portugal) https://www.ine.pt/xportal/xmain?xpid=INE&xpgid=ine_destaques&DESTAQUESdest_boui=261968449&DESTAQUESmodo=2&xlang=en, Statistics Portugalhttps://www.ine.pt/xportal/xmain?xpid=INE&xpgid=ine_destaques&DESTAQUESdest_boui=261968449&DESTAQUESmodo=2&xlang=en |
| Spain | Transportation and storage: 385 Manufacturing: 121 | 2016 | Transportation and storage: 5,175 Manufacturing: 3,837 | 2016 | Transportation and storage and manufacturing: Gross Value Added % change 2015-2016: increased 7% and decreased 17% respectively | OSPAR | Instituto Nacional de Estadística – Estadística Estructural de Empresas: Sector Industrial. http://www.ine.es/jaxiT3/Tabla.htm?t=28379&L=0 Instituto Nacional de Estadística- Principales magnitudes según actividad principal (CNAE-2009 a 1,2,3 y 4 dígitos) http://www.ine.es/dyngs/INEbase/operacion.htm?c=Estadistica_C&cid=1254736176865&menu=resultados&secc=1254736195033&idp=1254735576778 |
| Sweden[10] | 818 | 2014 | 7,497 | 2014 | National | Statistics Sweden | |
| UK | N/A | N/A | N/A | N/A | N/A | N/A | N/A |
[9]NACE 30.1 and NACE 42
[10]SNI: 52.22, 52.24, 52.29 (partly)
Oil and gas industry
The oil and gas sector encompasses the extraction of crude petroleum and natural gas (NACE Codes 06.1, 06.2), excluding.
| Contracting Party | Gross Value Added (Million euro/year) | Year | Employed persons (FTEs) | Year | Development in production value or other relevant data on trends between first and second Initial Assessment | Scale: OSPAR area, national, other | Data sources |
|---|---|---|---|---|---|---|---|
| Belgium | 0 | -- | 0 | -- | Does not take place in Belgian part of the sea | ||
| Denmark[11] | 4,800 | 2014 | 1,854 | 2012 | No possibility for comparison | OSPAR area | National statistics |
| France | 6,000 | 2014 | 29,000 | 2014 | Gross value added increasing | National | DEMF 2016 |
| Germany | N/A | N/A | N/A | N/A | N/A | N/A | |
| Ireland | O&G Exploration and Production: 72 | 2016 | 265 | 2016 | Gross Value Added % change 2010 - 2012: - 8% 2012 - 2014: -14% 2014 - 2016: 199% | Irish Marine Waters | All data taken from Ocean Economy 2015 & 2017 reports: https://www.ouroceanwealth.ie/sites/default/files/sites/default/files/Publications/2017/SemruIreland%27sOceanEconomy2017.pdf https://www.ouroceanwealth.ie/sites/default/files/sites/default/files/news/Final%20Semru%20-%20Ireland%27s%20Ocean%20Economy%202015%20Report.pdf |
| Netherlands[12] | 4,003 | 2014 | 4,000 | 2014 | Decrease | Dutch part of the North Sea | https://www.noordzeeloket.nl/publish/pages/138222/economic-description-of-the-dutch-north-sea-and-coast-2005-2010-2014.pdf |
| Norway | 51,261 (449,813 million NOK) | 2015 | 28,950 | 2015 | Significant reduction from 2014 to 2015, which probably continues to 2016 | National (=OSPAR) | Statistics Norway |
| Portugal | 0 | 0 | Does not take place in Portugal | ||||
| Spain | Extraction of crude petroleum: 0 Extraction of natural gas: 1 | 2016 | Extraction of crude petroleum: 0 Extraction of natural gas : 13 | 2016 | OSPAR | Instituto Nacional de Estadística - Estadística Estructural de Empresas: Sector Industrial. http://www.ine.es/jaxiT3/Tabla.htm?t=28379&L=0 | |
| Sweden | - | - | None | ||||
| UK | Oil and Gas: 15,844 (£11,500m) | 2015 | Oil and Gas: 38,200 | 2015 | Productivity trend – Oil and Gas: Significant decrease | National | GVA: Office for National Statistics estimate (provided by Oil and Gas Authority 14/06/16) – data from 2015 Employment: Oil and Gas UK – data from 2015 Productivity: Oil and Gas UK (pers. comm.) |
[11]No NACE
[12]In Dutch report 3,473 is mentioned, which is in 2010 prices
Offshore oil and gas exploration and exploitation takes place in waters of few OSPAR Contracting Parties, with the United Kingdom, Norway, the Netherlands and Denmark having the majority of offshore installations (Figure 5). For other Contracting Parties, the number of offshore installations is relatively small or non-existent.
In the Netherlands and Denmark offshore oil and gas exploitation is expected to decline in the next decades, whereas a slight increase is expected from the United Kingdom. In Germany, the future development of this sector depends on the results of ongoing exploration activities.
A wide range of programmes and measures are in place to reduce pollution from all phases of offshore oil and gas activities including meausres to prevent oil spills. There are also measures in place with respect to decommissioning of disused offshore oil and gas installations. The expected reduction in oil and gas exploitation means that decommissioning of disused offshore oil and gas installations is expected to increase in the future.
Offshore renewable energy
Recent years have seen a significant increase in the amount of renewable energy development in the OSPAR Maritime Area, especially in terms of wind farms, although this has mostly been focused in the Greater North Sea and Celtic seas. There are also plans for further development. These plans in the United Kingdom, Germany and Denmark contribute to the EU target of renewable energy, aiming for 20% of electricity demand to be met by renewable energy sources. There are also many areas that have been reserved for further offshore renewable energy development, indicating that this sector is likely to grow in importance in the coming years (Figure 6).
A significant expansion of the production of offshore wind energy is expected over the next decades, with an increasing number of offshore wind farms being built and planned at locations at increasing distances from the coast. This applies to most of the OSPAR area. This means that many wind farms are likely to be built. The building of wind farms often results in inputs of underwater noise due to pile driving/drilling. It is therefore likely that the expected increase of offshore wind energy will result in increased environmental pressures for the years to come.
| Contracting Party | Gross Value Added (Million euro/year) | Year | Employed persons (FTEs) | Year | Development in production value or other relevant data on trends between first and second Initial Assessment | Scale: OSPAR area, national, other | Data sources |
|---|---|---|---|---|---|---|---|
| Belgium | 1,000 | 2017 | 1,400 | 2017 | 2,560 million Euro in 2017 | National | |
| Denmark | N/A | - | 31,194 | 2016 | No possibility for comparison | National | National statistics |
| France[13] | N/A | N/A | N/A | N/A | N/A | N/A | |
| Germany | 27,200 | 2016 | The data in the Assessments are not comparable due to other data basis. A significant increase has taken place, further dynamic development is expected (Source: Update of the Assessment). | national | https://www.bmwi.de/Redaktion/DE/Publikationen/Studien/erneuerbar-beschaeftigt-in-den-bundeslaendern.pdf?__blob=publicationFile&v=8 | ||
| Ireland | Marine Renewable Energy: 38 | 2016 | 454 | 2016 | Gross Value Added % change 2010 - 2012: 94% 2012 - 2014: 78% 2014 - 2016: 147% | Irish Marine Waters | All data taken from Ocean Economy 2015 & 2017 reports: https://www.ouroceanwealth.ie/sites/default/files/sites/default/files/Publications/2017/SemruIreland%27sOceanEconomy2017.pdf https://www.ouroceanwealth.ie/sites/default/files/sites/default/files/news/Final%20Semru%20-%20Ireland%27s%20Ocean%20Economy%202015%20Report.pdf |
| Netherlands[14] | 35 | 2014 | 40 | 2014 | Decrease | Dutch part of the North Sea | https://www.noordzeeloket.nl/publish/pages/138222/economic-description-of-the-dutch-north-sea-and-coast-2005-2010-2014.pdf |
| Norway | N/A | N/A | N/A | N/A | N/A | N/A | |
| Portugal | Commercial project in development | ||||||
| Spain | N/A | N/A | N/A | N/A | N/A | N/A | |
| Sweden | 47 | 2014 | National | Statistics Sweden | |||
| UK | Offshore wind: 1,408 (£1,022m) | 2015 | Offshore wind: 3,042 | 2014 | Productivity trend – Offshore wind: Significant increase | National | GVA: Uprated by inflation from 2013 values provided in BIS (2015) Employment: ONS (2015) and RenewableUK (2013) - Data from 2014 (offshore) Productivity trend data 2012 onwards |
[13]Many projects but not in exploitation phase. Activity that will be developed in the coming years.
[14]In Dutch report 39 mln is mentioned, which is in 2010 prices
A series of maps are used to describe the spatial distribution and intensity of selected uses: fisheries and aquaculture (Figure 2 and Figure 3), shipping (Figure 4), ports (Figure 5), oil and gas industry (Figure 6), and offshore wind energy (Figure 7). The maps are based on existing OSPAR data streams, and other sources where necessary and as identified. They help identify ‘hotspots’ of certain economic activities, which can be linked to potential environmental pressures. |
Fisheries and aquacultureFisheries operate across the entire OSPAR Maritime Area. Figure 2 illustrates seabed abrasion due to demersal fisheries, as an example of the spatial extent of this activity. Figure 2 does not include pelagic fisheries, as a fishing intensity map was not available for the whole OSPAR Maritime Area, which would show a different spatial pattern. The picture is different for aquaculture, which is not significant on a national scale for most OSPAR countries. The locations of shellfish cultures, finfish farms and general aquaculture site (Figure 3) highlight the differences in their distribution across the OSPAR Maritime Area. Most finfish aquaculture occurs in Norway, Scotland and Ireland, whereas aquaculture for shellfish is more widespread. |
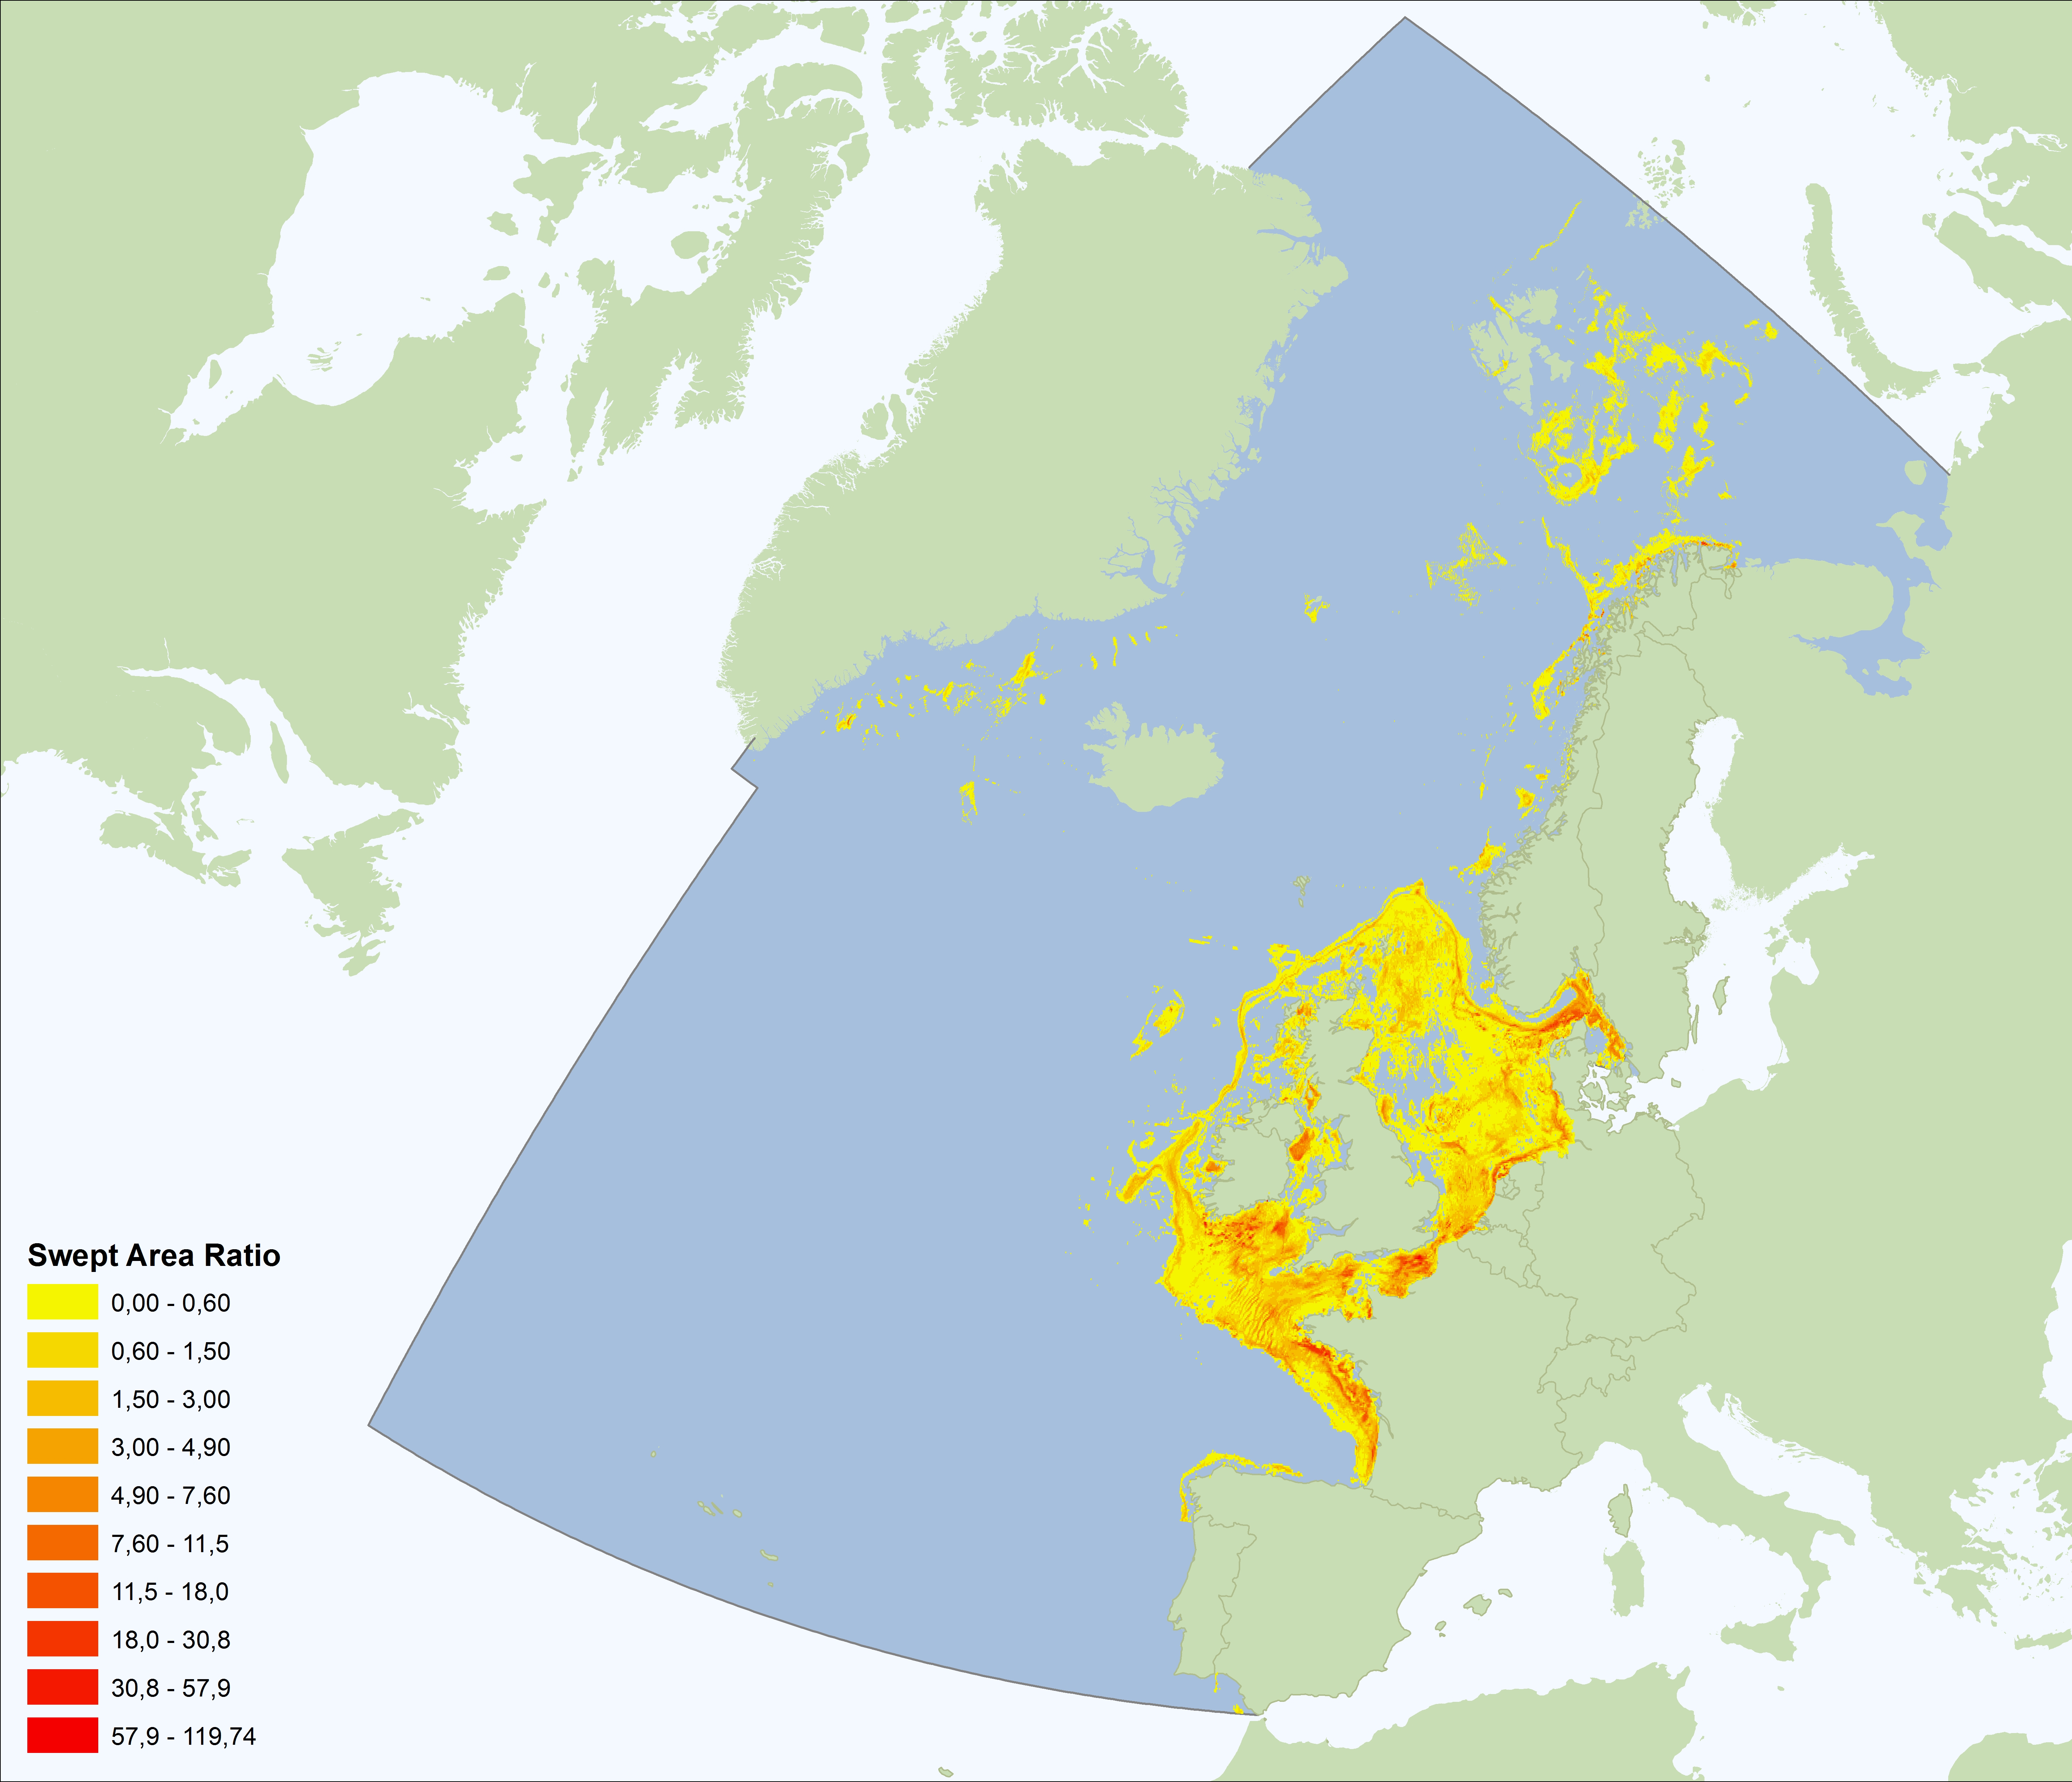
Figure 2: Seabed abrasion from demersal fisheries (2014) (Data Source: OSPAR)
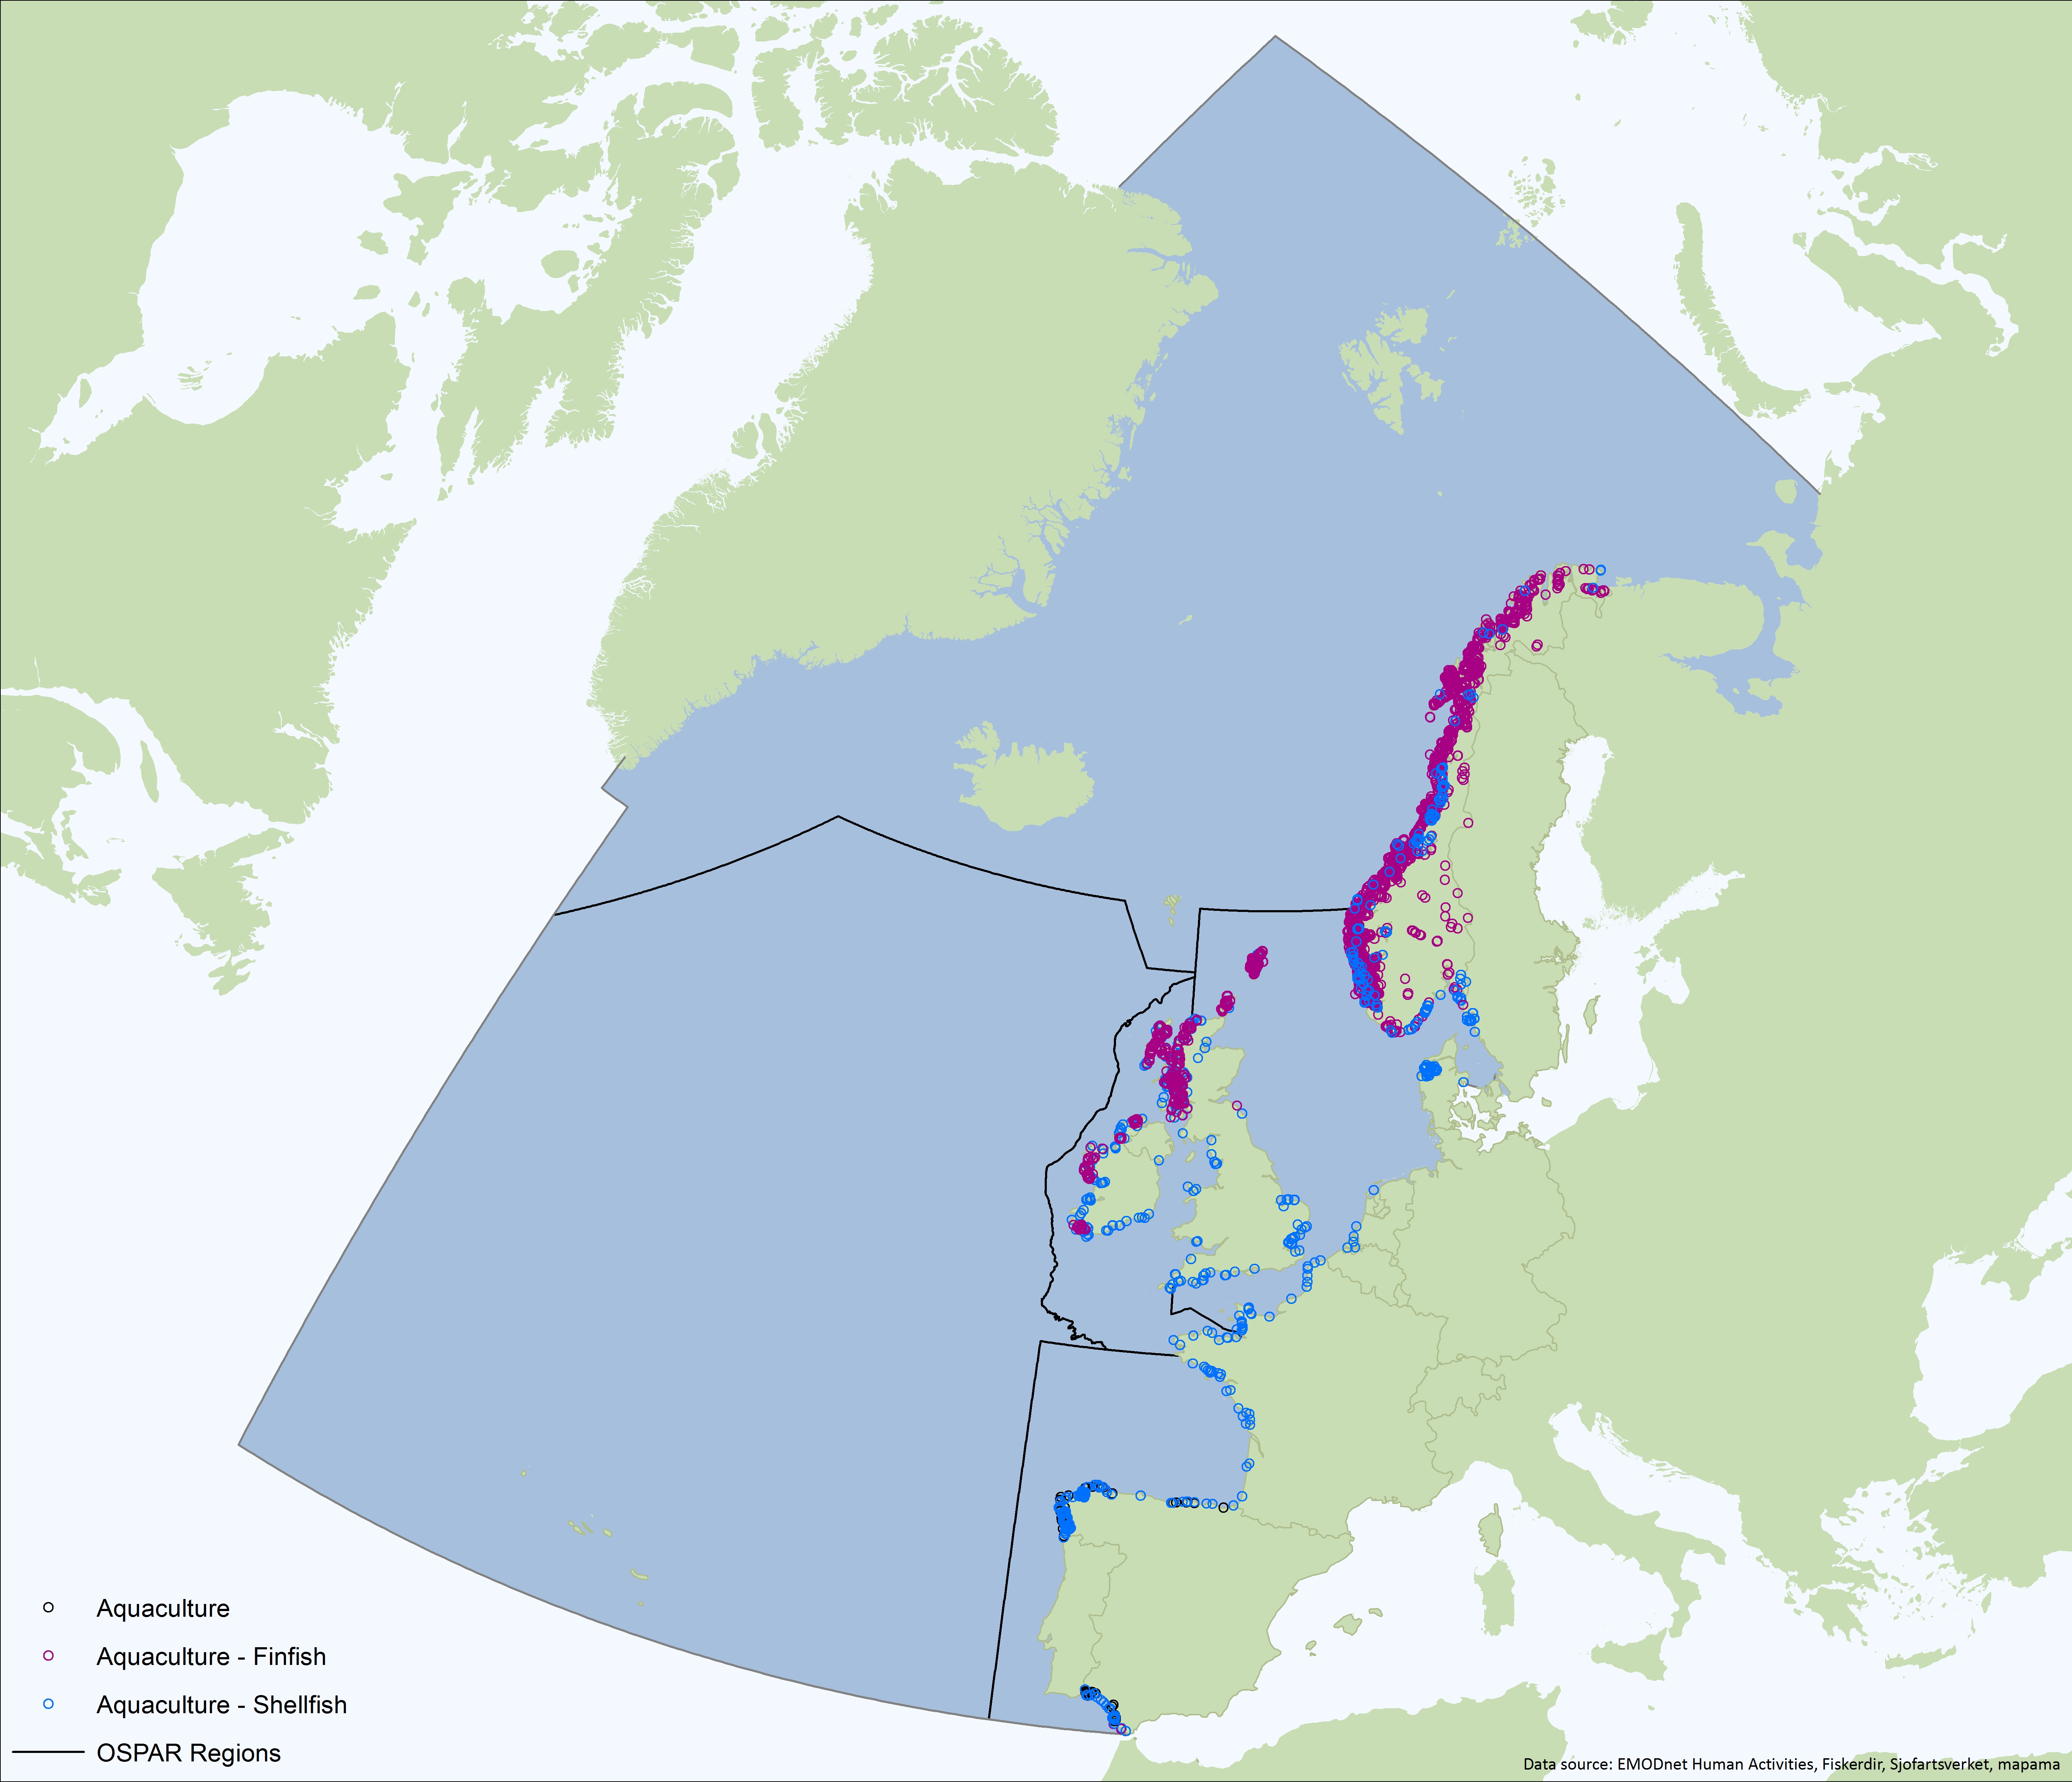
Figure 3: Aquaculture sites in the OSPAR Maritime Area (Data Sources: Bonn Agreement, Norway, Spain, EMODNet Human Activities)
Ports and ShippingThe economic activity related to shipping is widespread throughout the OSPAR Maritime Area although the highest densities of ship traffic are found in the English Channel and the southern North Sea, where the majority of Europe’s largest ports are located (Figure 3.4), and at the entrance to the Mediterranean Sea. There is also support traffic for offshore oil and gas platforms in the North Sea as well as new wind farm developments. The major ports provide a wide range of support services including shipbuilding and maintenance and are widely distributed along the OSPAR coasts (see Figure 5). |
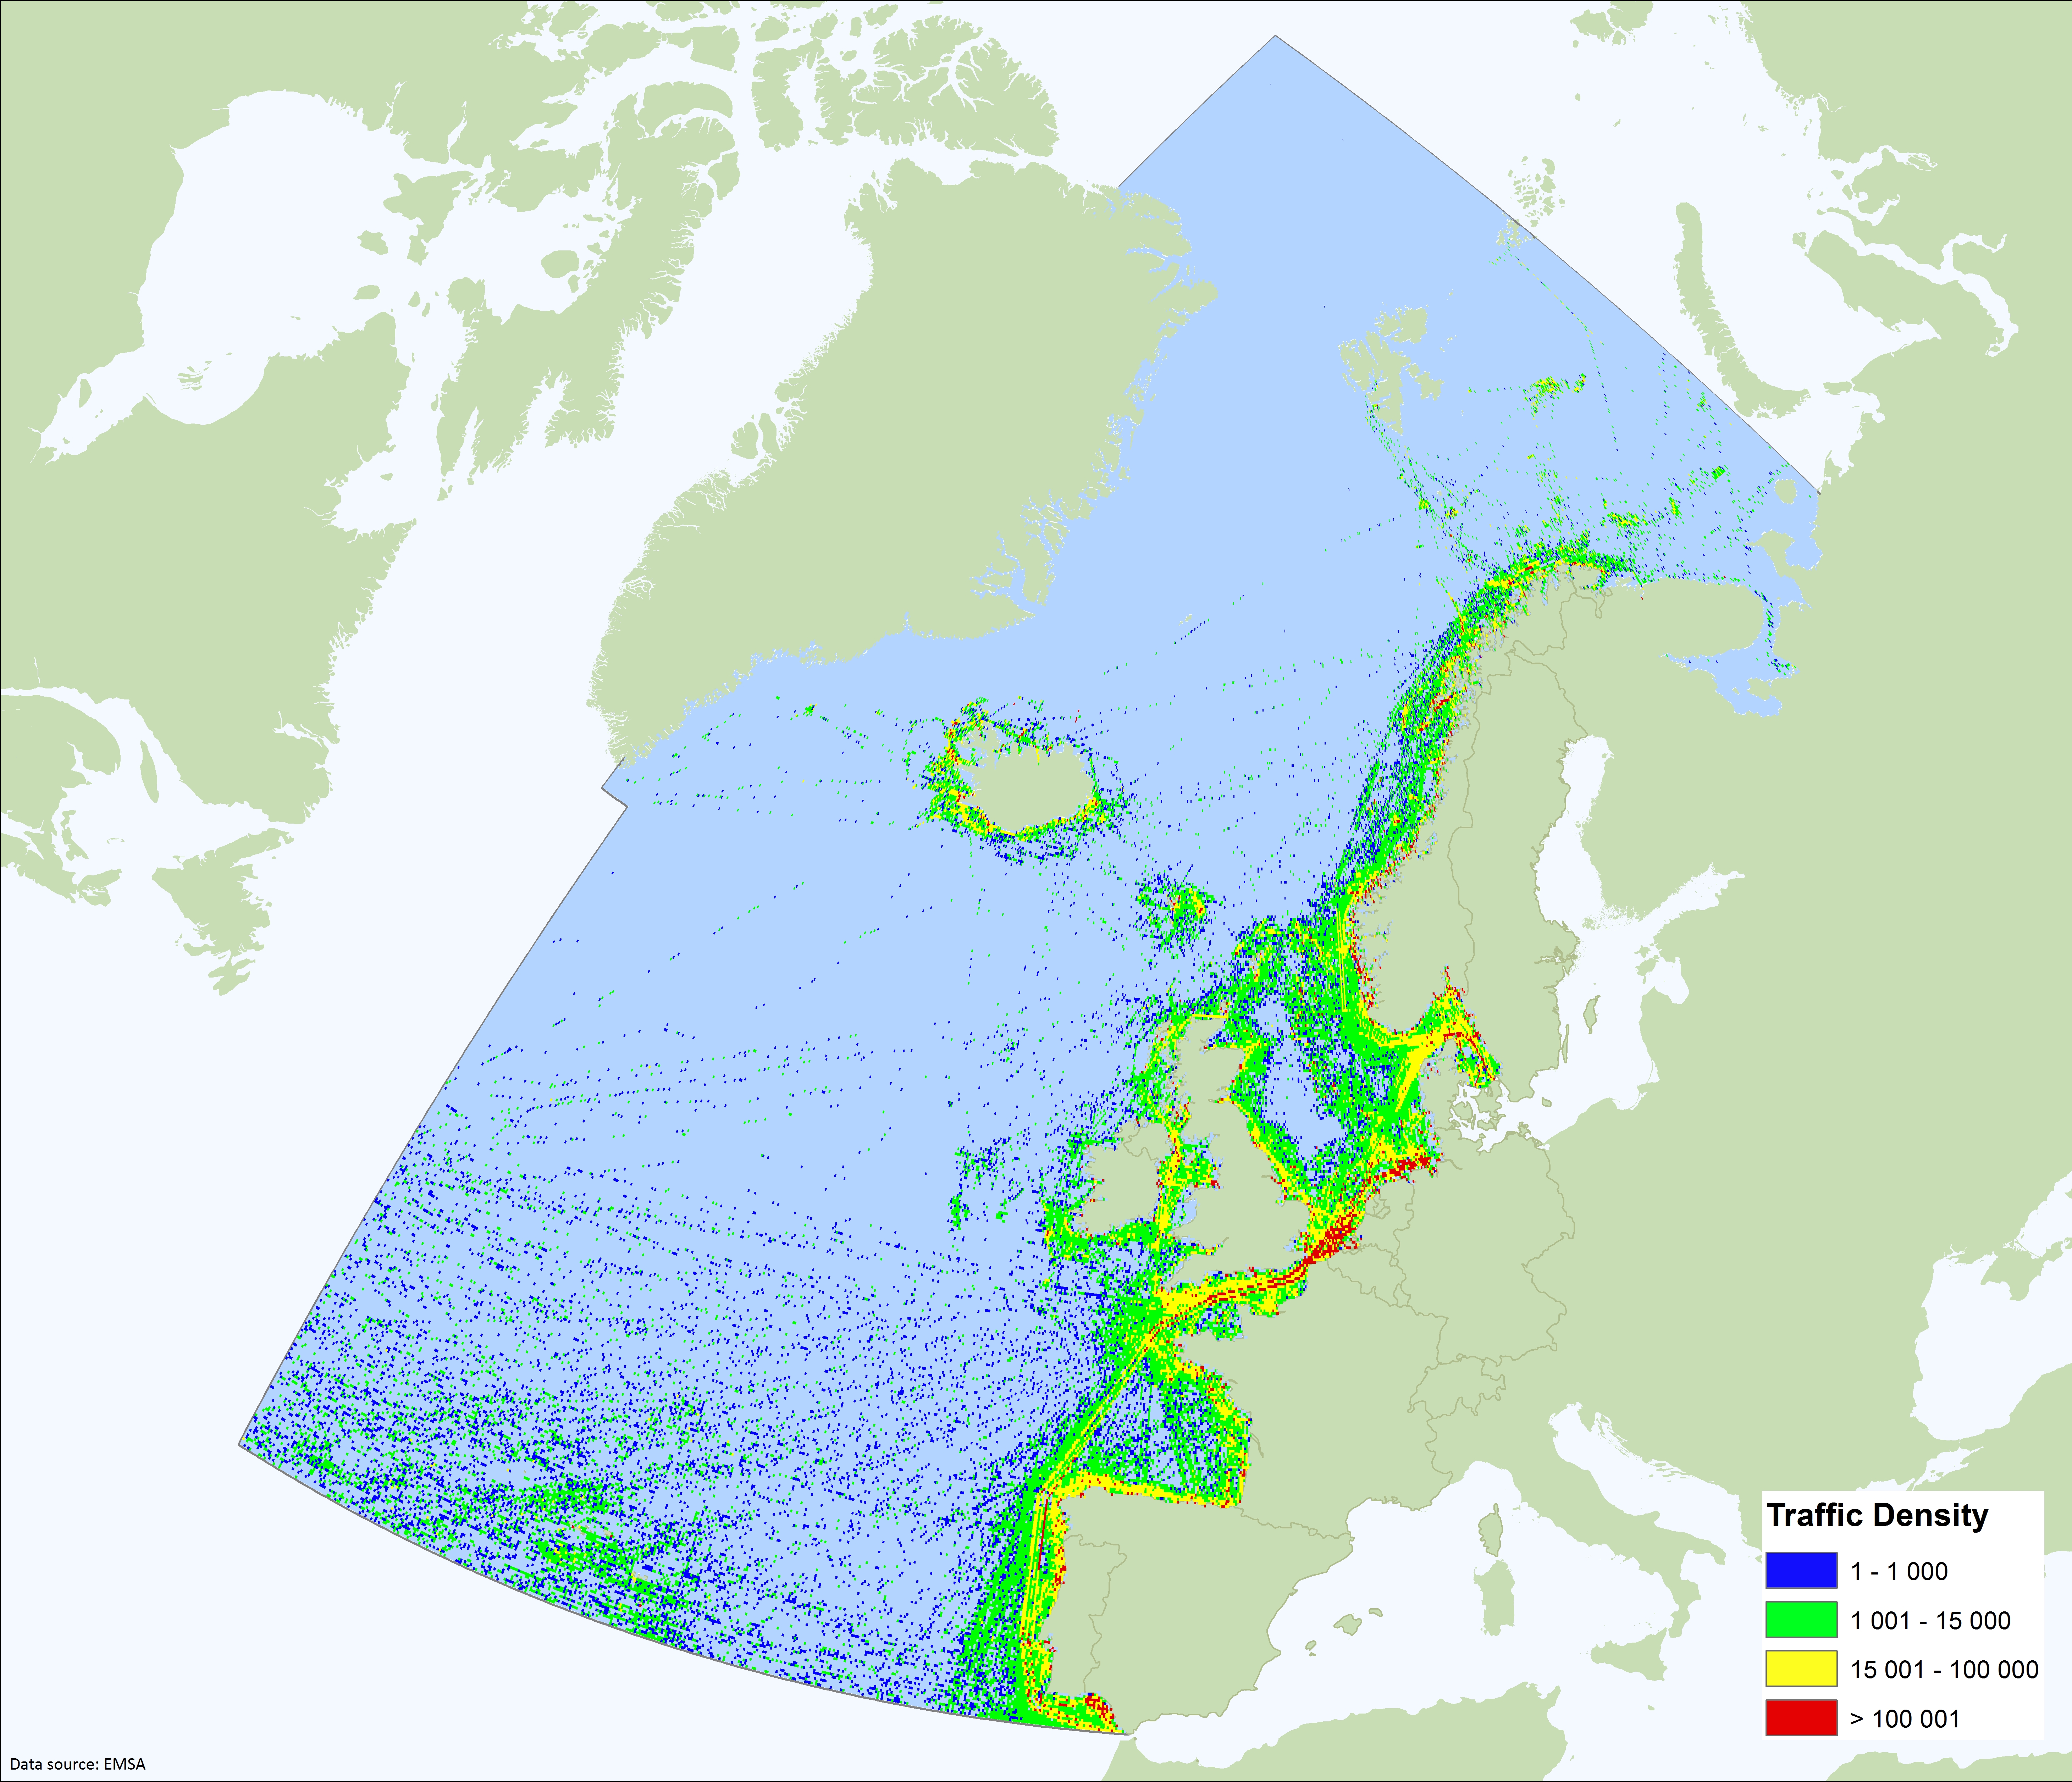
Figure 4: intensity of shipping in OSPAR Maritime Area for 1 week period in February 2017 (Data Source: EMSA)
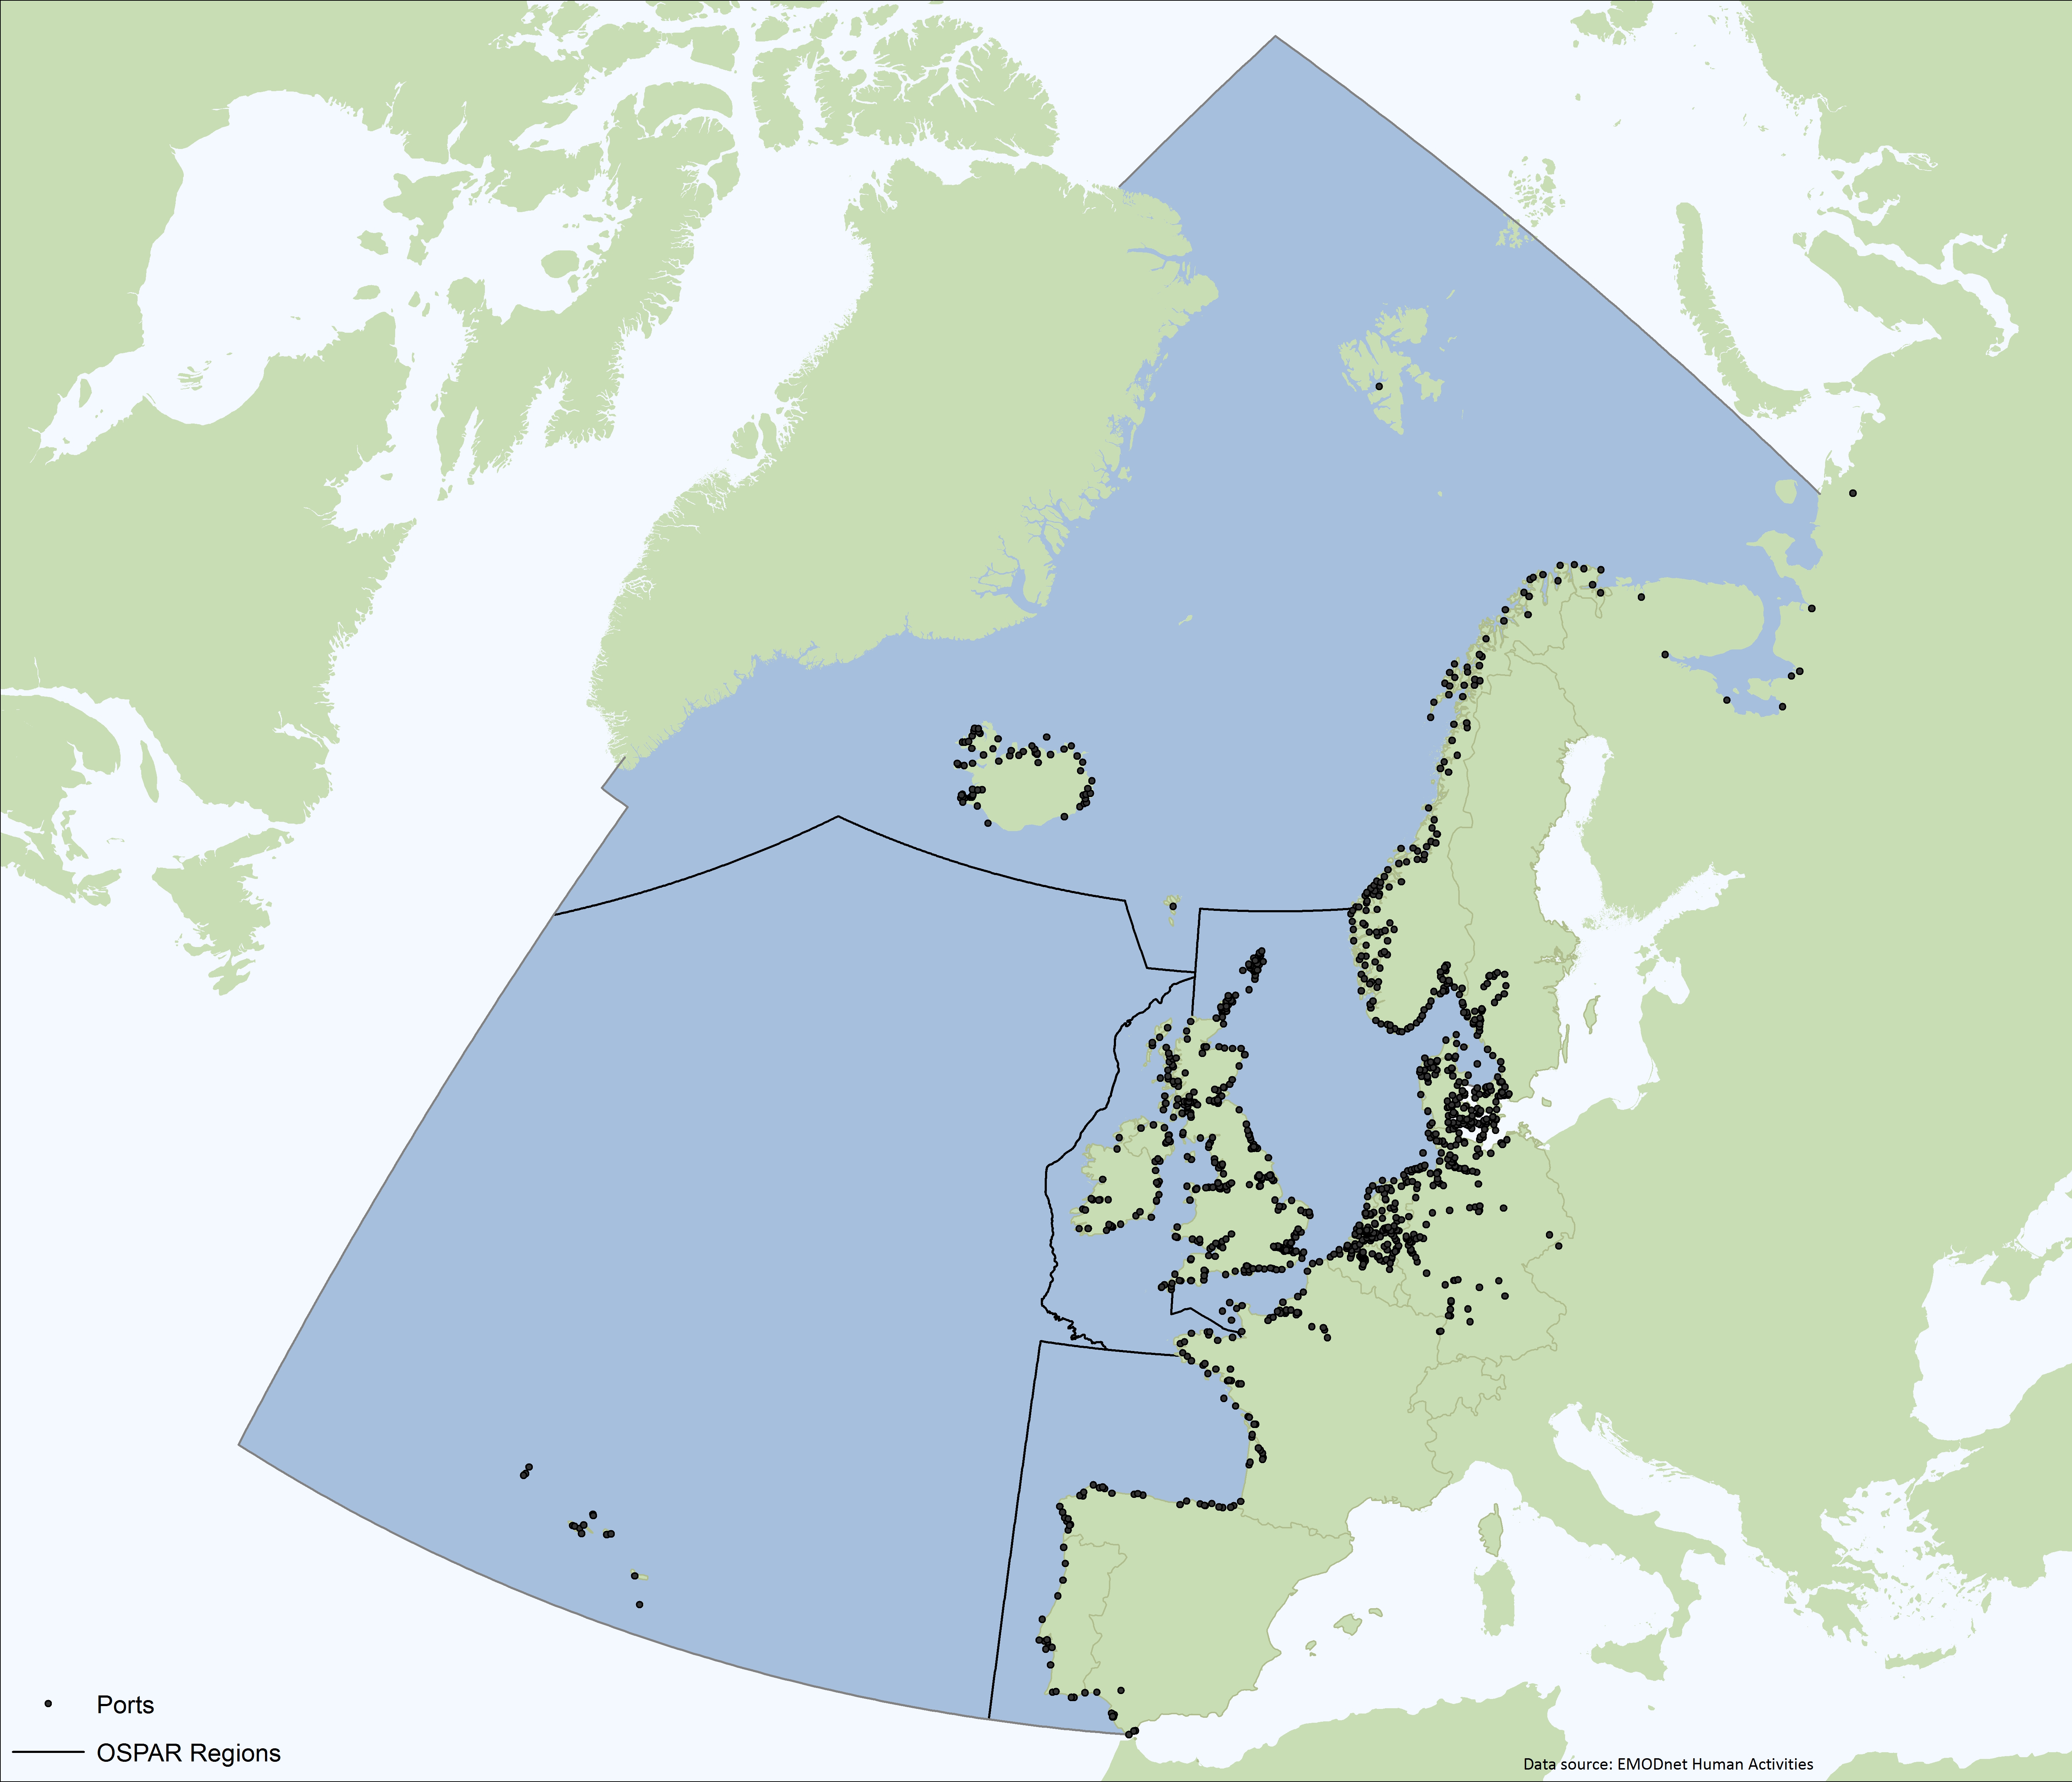
Figure 5: Ports in the OSPAR Area (Data Source: EMODNet Human Activities Portal)
Oil and gasOil and gas exploration takes place in a few OSPAR Contracting Parties, with the United Kingdom, Norway, the Netherlands and Denmark having the majority of offshore installations (Figure 6). For other countries, the number of offshore installations is relatively small. |
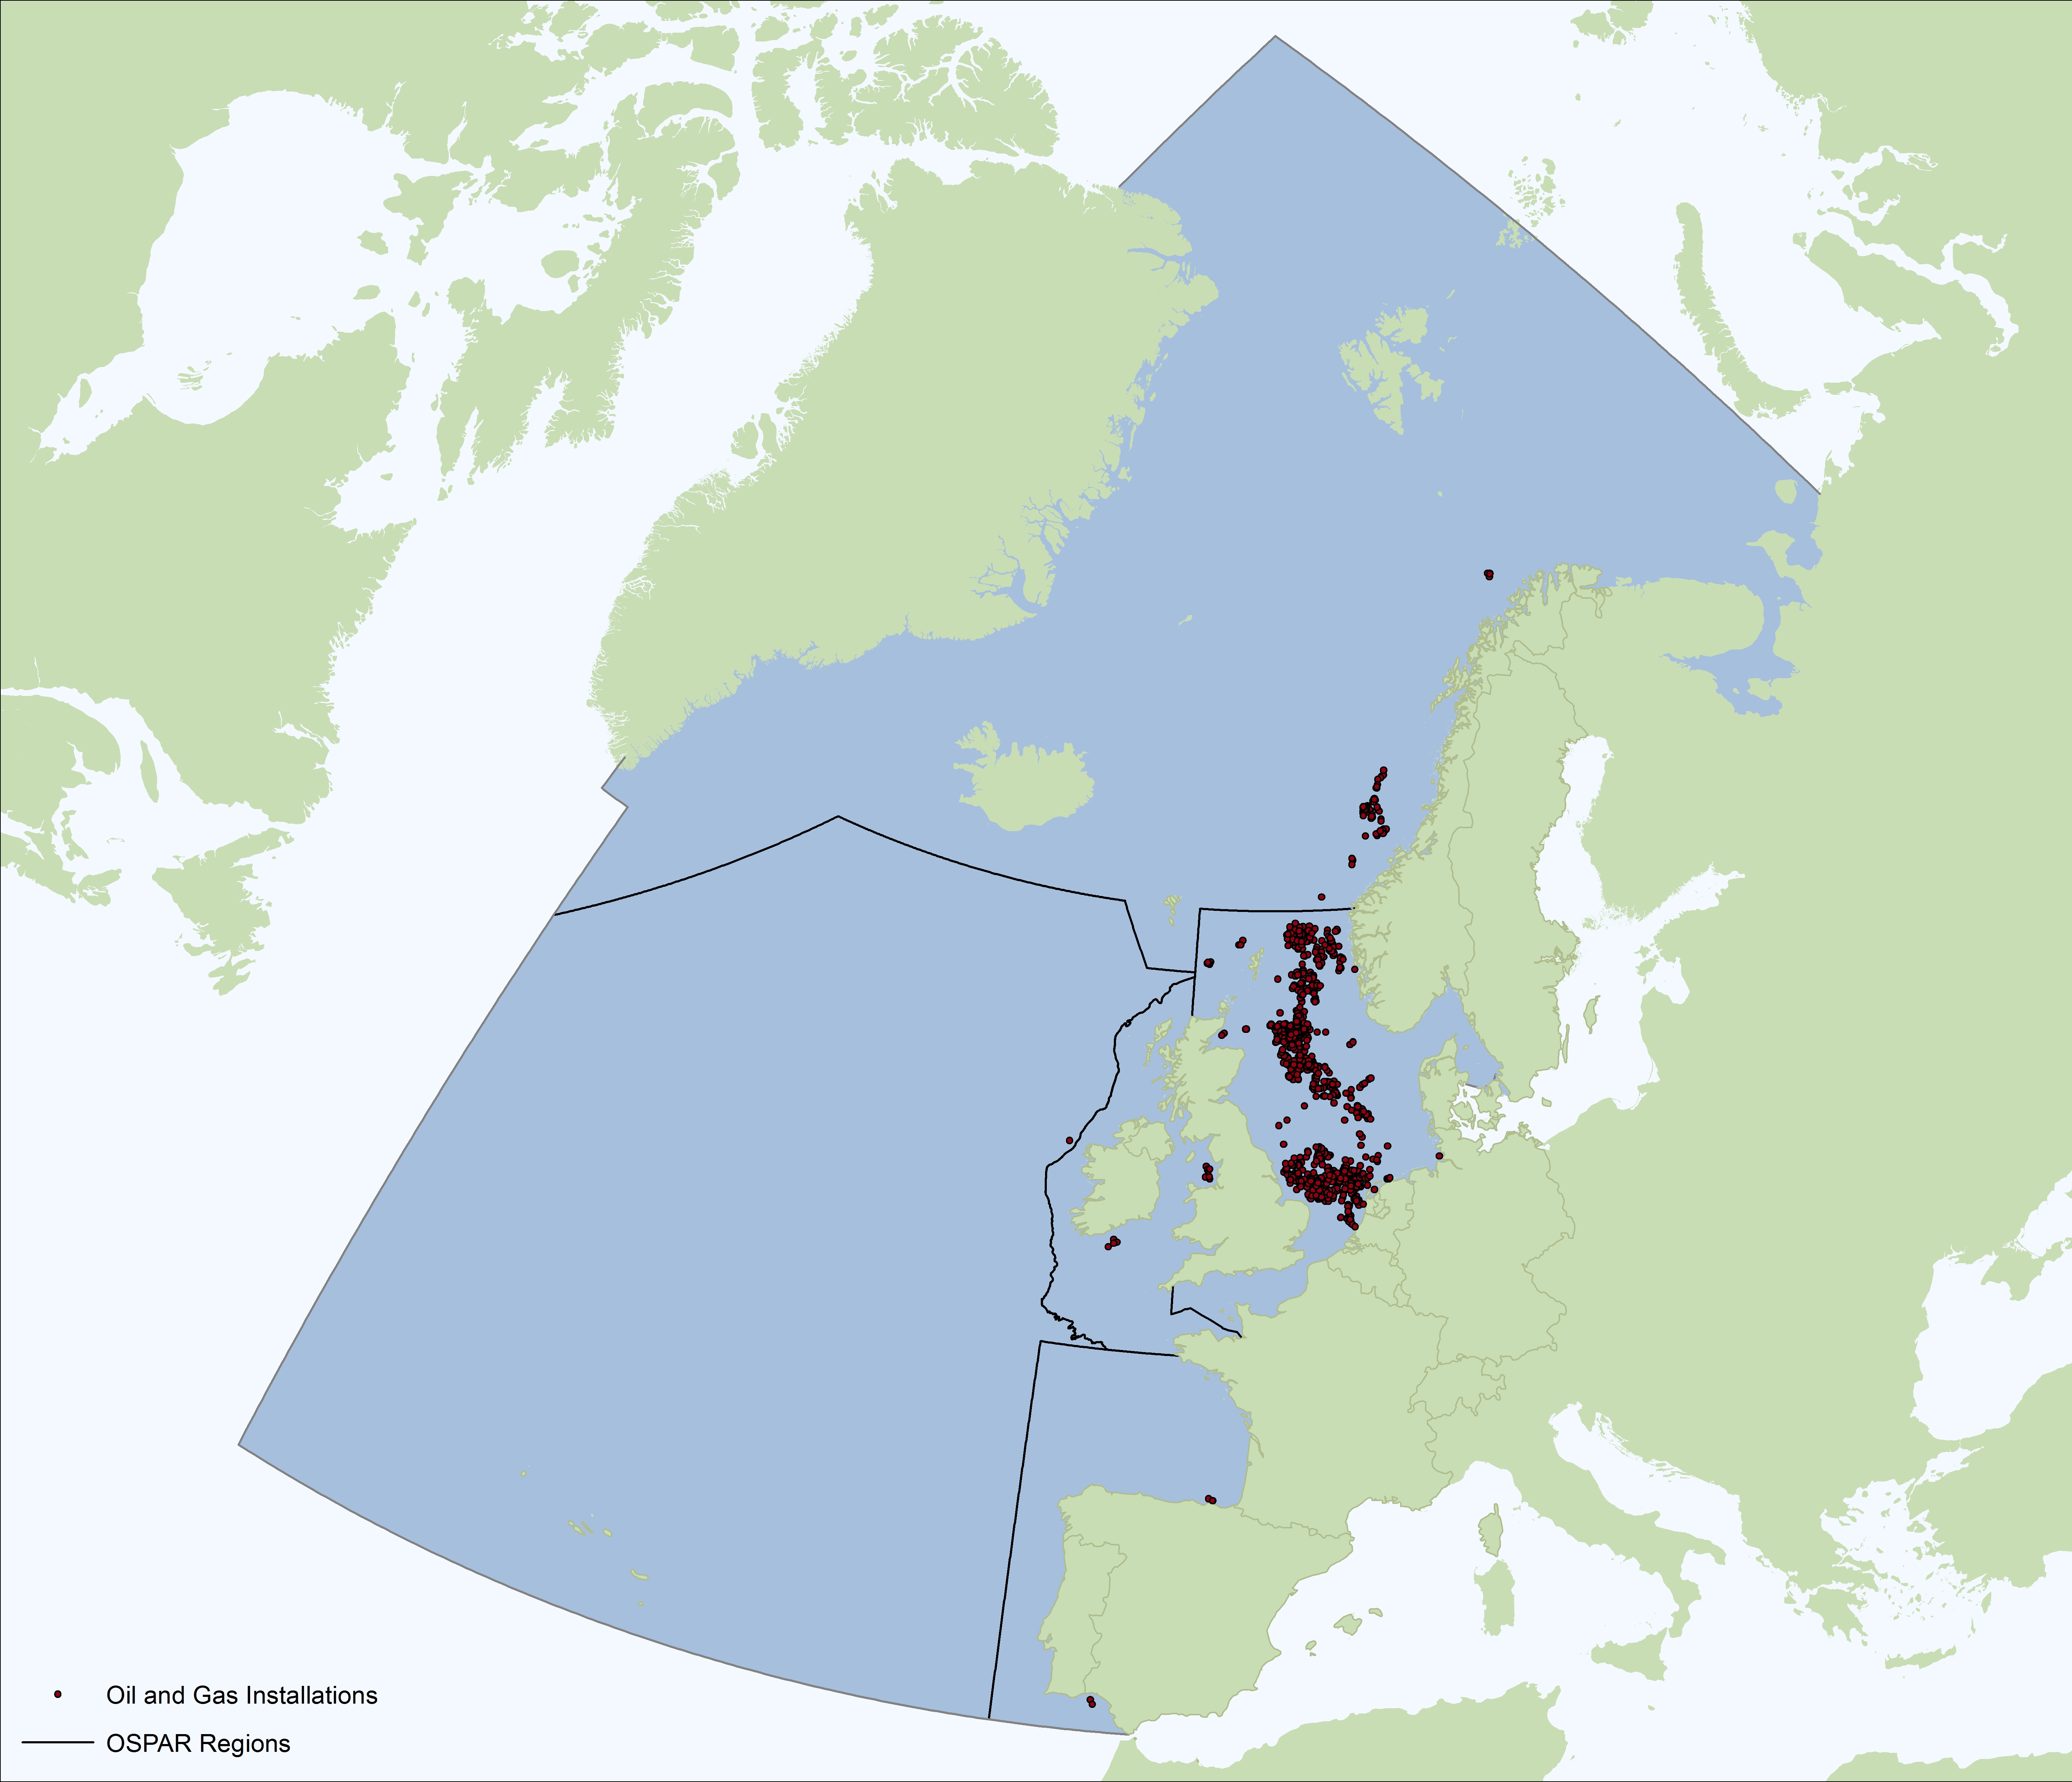
Figure 6: Oil and gas installations in the OSPAR maritime region (Data Source: OSPAR)
|
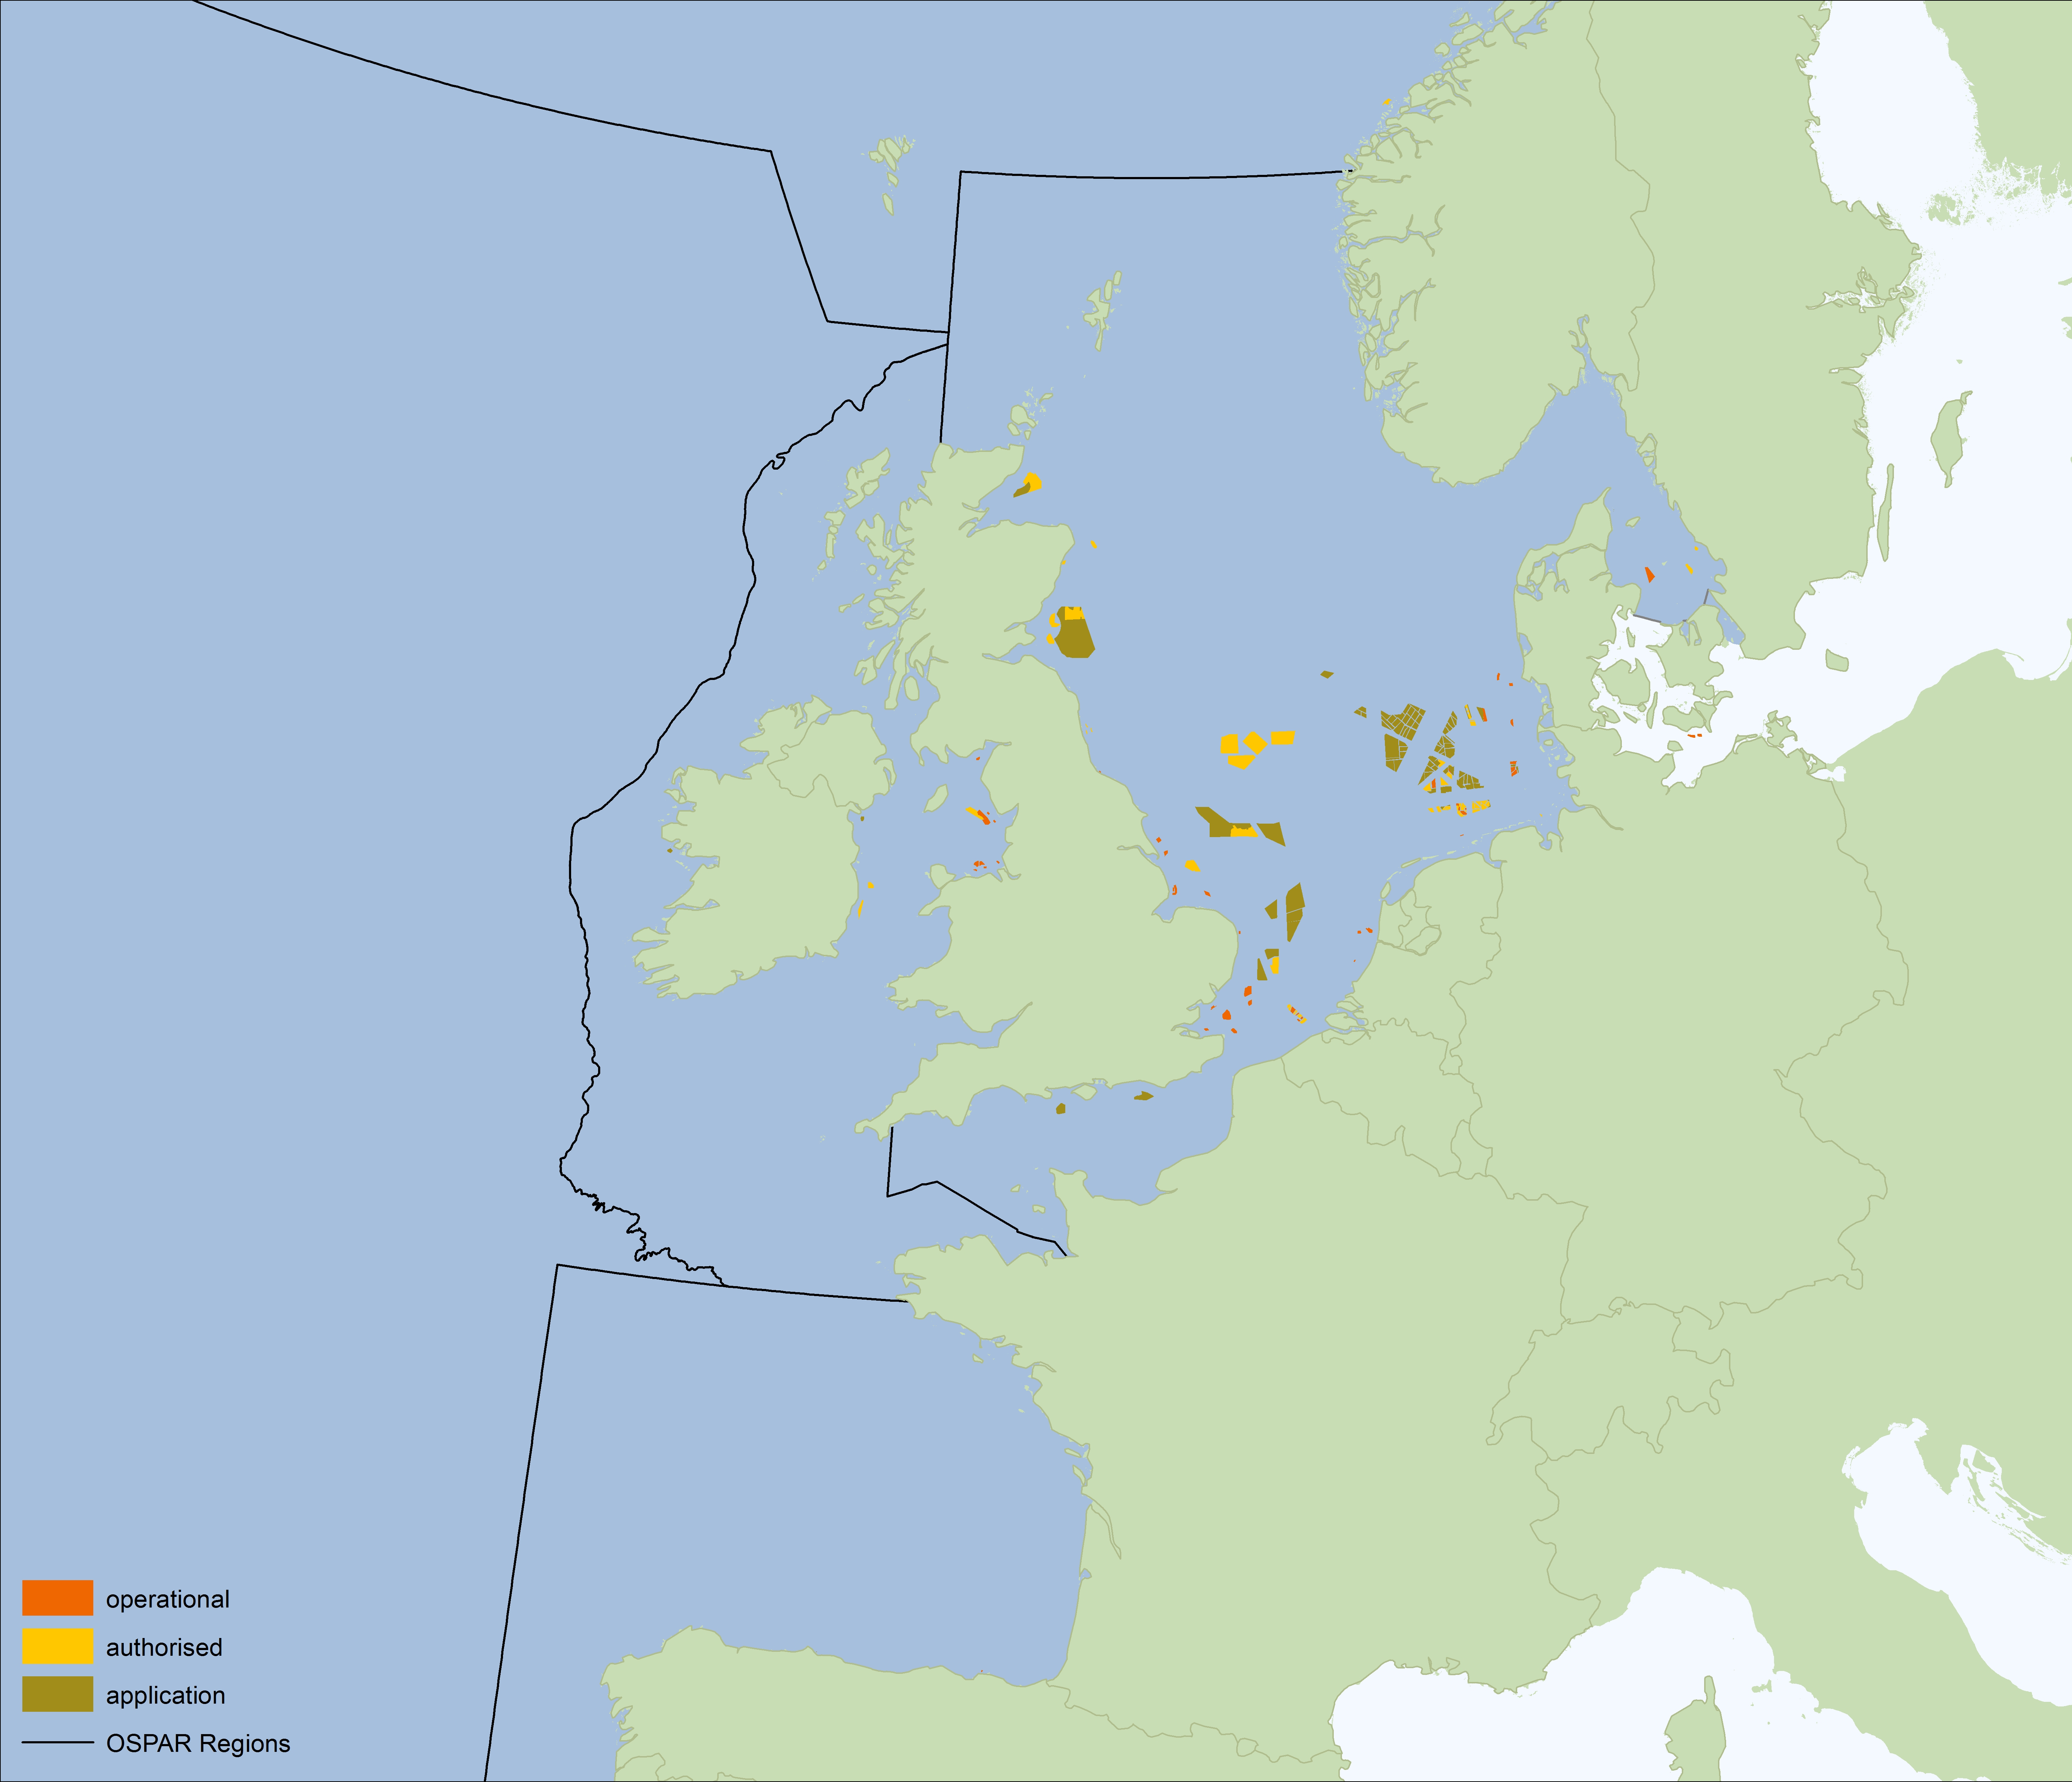
Figure 7: Operational, proposed and planned wind farms in the OSPAR Maritime area (Data Source: OSPAR)
To allow future economic and social analysis of uses of the OSPAR Maritime Area there is a need to:
- quantify the relationship between economic activities and pressures on the marine environment, and determine how these impact the benefits we can derive from the ocean in terms of ecosystem services.
- develop a uniform description of the economic activity ‘recreation and tourism’. This is an important activity both because of the economic relevance and because of its dependency on the marine ecosystem, but since it is not have a separate NACE code, it is not yet possible to collect the relevant data in a uniform manner.
- The potentially most critical issue for performing a uniform OSPAR wide economic analysis based on statistical data is to make sure that the data used focus only on the OSPAR region, instead of presenting national numbers. This requires significant additional efforts in most countries, since this requires explicitly excluding value added generated both outside the OSPAR region (e.g. fisheries) and inland (e.g. aquaculture).
Börger Tobias, Broszeit Stefanie, Ahtiainen Heini, Atkins Jonathan P., Burdon Daryl, Luisetti Tiziana, Murillas Arantza, Oinonen Soile, Paltriguera Lucille, Roberts Louise, Uyarra Maria C., Austen Melanie C. Frontiers in Marine Science, Volume 3, 2016, Pages 192, https://doi.org/10.3389/fmars.2016.00192 B. Grizzetti, D. Lanzanova, C. Liquete, A. Reynaud, A.C. Cardoso, Assessing water ecosystem services for water resource management, Environmental Science & Policy, Volume 61, July 2016, Pages 194-203, ISSN 1462-9011, https://doi.org/10.1016/j.envsci.2016.04.008. |