

Status and Trends in the Concentrations of Polycyclic Aromatic Hydrocarbons (PAHs) in Shellfish and Sediment
Background
Polycyclic aromatic hydrocarbons (PAHs) are natural components of coal and oil and are also formed during the combustion of fossil fuels and organic material, for example during activities at an oil refinery. PAHs also occur as a result of natural processes such as forest fires.
PAHs enter the marine environment through atmospheric deposition, road run-off, industrial discharges and as a result of oil spills. PAHs in the marine environment often end up in marine sediment, where they can become trapped in lower layers unless the sediments are disturbed. Associations have been demonstrated between the incidence of some diseases in flatfish and the concentrations of PAHs in the sediment over which they live and feed. PAHs also accumulate in shellfish, either absorbed directly from the marine environment or indirectly through food consumption. In contrast fish metabolise PAHs and therefore concentrations in fish are low. Exposure to PAH in fish can be screened for by the measurement of PAH bile metabolites in their gall bladders. The problems caused by PAHs in the marine environment vary considerably from tainting the taste of fish and shellfish to potential carcinogenic effects on humans and animals.
Due to their persistence in the marine environment, their potential to bioaccumulate and their toxicity, analyses of PAH concentrations in shellfish and sediment, and PAH bile metabolites in fish, are reported in the OSPAR Coordinated Environmental Monitoring Programme (CEMP). Monitoring PAHs across the OSPAR Maritime Area began between 1985 and 1999.
OSPAR's strategic objectives in its 2030 North-East Atlantic Environment Strategy aim at preventing pollution by hazardous substances, by eliminating their emissions, discharges and losses, to achieve levels that do not give rise to adverse effects on human health or the marine environment with the ultimate aim of achieving and maintaining concentrations in the marine environment at near background values for naturally occurring hazardous substances and close to zero for human made hazardous substances.
 can accumulate in shellfish, either absorbed directly from the marine environment or indirectly through food consumption © Marine Scotland Science")
Figure 1: Shellfish – Polycyclic aromatic hydrocarbons (PAHs) can accumulate in shellfish, either absorbed directly from the marine environment or indirectly through food consumption © Marine Scotland Science
 can accumulate in marine sediments © Marine Scotland Science")
Figure 2: Sediment grab – Polycyclic aromatic hydrocarbons (PAHs) can accumulate in marine sediments © Marine Scotland Science
Polycyclic aromatic hydrocarbons are hydrocarbons composed of two or more fused aromatic rings, encompassing both parent (non-alkylated) compounds and alkylated homologues. Although PAHs can be produced through natural processes, they also arise from anthropogenic sources (Mojiri et al., 2019). Incomplete combustion processes are a major source of PAHs, but they can also be of petrogenic origin (crude oils or refinery products). PAHs of petrogenic origin include mainly alkylated, 2-ring and 3-ring PAHs formed as a result of diagenetic processes, whereas PAHs from pyrolytic sources mainly comprise the heavier, parent (non-alkylated) PAHs. Assessment of the PAH profile, including PAH ratios such as the phenanthrene/anthracene ratio or the fluoranthene/pyrene ratio can give an indication of the source of the PAHs (Tobiszewski and Namieśnik, 2012).
PAHs are of concern due to their persistence, potential to bioaccumulate and toxicity. They are therefore included on the OSPAR List of Chemicals for Priority Action. The analyses of PAHs in both sediment and shellfish are reported in the OSPAR Coordinated Environmental Monitoring Programme (CEMP).
PAH properties will vary considerably depending on the number of rings. Low molecular weight PAHs can cause tainting of fish and shellfish, rendering them unfit for sale (Davis et al., 2002). In addition, metabolites of some of the high molecular PAHs, such as benzo[a]pyrene, are potent animal and human carcinogens (Honda et al., 2020). Less is known about the toxicity of alkylated PAHs, although one study has demonstrated that alkylated PAHs may have increased toxicity compared to the parent compound (Marvanova et al., 2008).
There are marked differences in the behaviour of PAHs in the aquatic environment between the low molecular weight compounds (e.g. naphthalene) and the high molecular weight compounds (e.g. benzo[g,h,i]perylene) as a consequence of their differing physical-chemical properties (Mojiri et al., 2019). The low molecular weight compounds are appreciably more water soluble and can be bioaccumulated from the dissolved phase by transfer across the gill surfaces of aquatic organisms; whereas the high molecular weight compounds are relatively insoluble and hydrophobic and can attach to both organic and inorganic particulates within the water column. PAHs derived from combustion sources may be deposited directly to the marine environment already adsorbed to atmospheric particulates, such as soot.
PAHs can enter the marine environment through atmospheric deposition, run-off, industrial discharges and as a result of oil spills. Sediment will act as a sink for PAHs in the marine environment. Filter-feeding organisms such as bivalve molluscs can accumulate high concentrations of PAHs (Baumard et al., 1999; Honda et al., 2020). Fish do not generally accumulate high concentrations of PAHs as they possess an effective mixed-function oxygenase (MFO) system which allows them to metabolise PAHs and to excrete them in bile (Stagg et al., 1995; Richardson et al., 2001; Vethaak et al., 2016). Other marine vertebrate and marine mammals also metabolise PAHs efficiently.
Emissions of PAHs are controlled via a number of different regulations. These include the United Nations Economic Commission for Europe Convention on Long-Range Transboundary Air Pollution (UNECE, 2009). This obliges its member countries to reduce their emissions of persistent organic pollutants such as PAHs with the ultimate objective of eliminating discharges and emissions. Persistent Organic Pollutants regulation (EC 850/2004) requires PAH emissions to be captured in an inventory and an action plan put in place to limit releases. The REACH registration process (EC 1906/2007) states conditions for the safe use of substances including PAHs.
In assessing polycyclic aromatic hydrocarbons (PAHs) both ‘relative’ and ‘absolute’ aspects have been analysed:
- ‘Trend assessment’ or spatial distribution assessment to focus on relative differences and changes on spatial and temporal scales – provides information about the rates of change and whether PAH contamination is widespread or confined to specific locations; and
- ‘Status assessment’ of the significance of the (risk of) pollution, defined as the status where PAHs are at a hazardous level, usually requires assessment criteria that take account of the possible severity of the impacts and hence require criteria that take account of the natural conditions (background concentrations) and the ecotoxicology of the contaminants. For example, Environmental Assessment Criteria (EAC) are tools in this type of assessment.
OSPAR has clarified that in assessing the Coordinated Environmental Monitoring Programme (CEMP) data the primary assessment value used in the assessment of PAH concentrations in sediment and biota “corresponds to the achievement, or failure to achieve, statutory targets or policy objectives for contaminants in these matrices” (OSPAR, 2009). This set of assessment criteria was specifically compiled for the assessment of CEMP monitoring data on hazardous substances contributing to the Quality Status Report (QSR) 2010. The use of this set was considered an interim solution for the purposes of the QSR 2010 until more appropriate approaches to defining assessment criteria could be agreed on and implemented. These criteria have also been used in the annually recurring CEMP assessments since 2010, including the Intermediate Assessment 2017 (IA 2017), and will be used until OSPAR adopts improved assessment criteria and subject to the conditions set out in the agreement.
Temporal trends in PAH concentrations in biota and sediment are presented. Two assessment criteria are used to assess the status of PAH concentrations in biota: Background Assessment Concentrations (BACs) and Environmental Assessment Criteria (EAC). Two assessment criteria are used to assess PAH concentrations in sediment: Background Assessment Concentrations (BACs) and the United States Environmental Protection Agency (EPA) sediment quality guidelines; Effects Range-Low (ERL).
OSPAR QSR 2023 Indicator Assessment values are not to be considered as equivalent to proposed European Union Marine Strategy Framework Directive (MSFD, 2008/56/EC) criteria threshold values. However, they can be used for the purposes of their MSFD obligations by those Contracting Parties that wish to do so.
Provenance and limitations of BACs
Background assessment concentrations (BACs) were developed by OSPAR for testing whether measured concentrations are near natural background levels for naturally occurring substances and close to zero for man-made substances, the ultimate aim of the OSPAR Hazardous Substances Strategy (2010-2020). Mean concentrations significantly below the BAC are said to be near natural background concentrations. BACs are statistical tools defined in relation to the background concentrations or low concentrations, which enable statistical testing of whether observed concentrations could be considered to be near natural background concentrations.
Background concentrations (BCs) are assessment tools intended to represent the concentrations of hazardous substances that would be expected in the North-East Atlantic if certain industrial developments had not happened. They represent the concentrations of those substances at ’remote’ sites, or in ’pristine’ conditions based on contemporary or historical data respectively, in the absence of significant mineralisation and / or oceanographic influences. In this way, they relate to the background values referred to in the OSPAR Hazardous Substances Strategy (2010-2020). BCs for man-made substances should be regarded as zero. It is recognised that natural processes, such as geological variability or upwelling of oceanic waters near the coast, may lead to significant variations in background concentrations of contaminants, for example trace metals. The natural variability of background concentrations should be taken into account in the interpretation of CEMP data, and local conditions should be taken into account when assessing the significance of any exceedance.
Low concentrations (LCs) are values used to assist the derivation of BACs where there have been difficulties in assembling a dataset on concentrations in remote or pristine areas from which to derive BCs. LCs have been prepared by the International Council for the Exploration of the Sea (ICES) on the basis of datasets from areas that could generally be considered remote, but which could not be guaranteed to be free from influence from long-range atmospheric transport of contaminants.
BACs are calculated according to the method set out in Section 4 of the CEMP Assessment Manual (OSPAR, 2008) and updated in 2021 (OSPAR, 2021). The outcome of this method is that, on the basis of what is known about variability in observations, there is a 90% probability that the observed mean concentration will be below the BAC when the true mean concentration is at the BC. Where this is the case, the true concentrations can be regarded as ‘near background’ (for naturally occurring substances) or ‘close to zero’ (for man-made substances).
BACs are calculated on the basis of variability within the CEMP dataset currently available through databases held by the ICES Data Centre and will be refined at the working level by the relevant assessment group as further CEMP monitoring data are collected.
Provenance and limitations of EACs
Environmental Assessment Criteria (EACs) were developed by OSPAR and ICES for assessing the ecological significance of biota concentrations. Some EAC values were specifically compiled for the assessment of CEMP monitoring data on hazardous substances contributing to the QSR 2010 and IA 2017 (OSPAR Agreement 2009-2). EACs do not represent target values or legal standards under the OSPAR Convention and should not be used as such. EACs were set so that hazardous substance concentrations in biota below the EAC should not cause chronic effects in sensitive marine species, including the most sensitive species, nor should concentrations present an unacceptable risk to the environment and its living resources. However, the risk of secondary poisoning is not always considered. EACs continue to be developed for use in data assessments.
Concentrations below EACs are considered to present no significant risk to the environment, and in most cases EACs are considered analogous to the Environmental Quality Standards applied to concentrations of contaminants in water or biota, for example under the European Union Water Framework Directive (WFD, 2000/60/EC).
Caution should be exercised in using these generic environmental assessment criteria in specific situations. Their use does not preclude the use of common sense and expert judgement when assessing environmental effects and/or the potential for them. Furthermore, the EACs neither take into account specific long-term biological effects such as carcinogenicity, genotoxicity and reproductive disruption due to hormone imbalances, nor do they include combination toxicology.
Provenance and limitations of ERLs
Because OSPAR has not yet established Environmental Assessment Criteria (EACs) for PAHs in sediment, an alternative means of assessment is required. ‘Effects range’ values were developed by the United States Environmental Protection Agency (EPA) as sediment quality guidelines for assessing the ecological significance of contaminant concentrations in sediment to protect against the potential for adverse biological effects on organisms. Concentrations below the Effects Range-Low (ERL) level rarely cause adverse effects in marine organisms.
The ERL value is defined as the lower tenth percentile of the data set of concentrations in sediments which were associated with biological effects. Adverse effects on organisms are rarely observed when concentrations fall below the ERL value, and the ERL therefore has some parallels with the philosophy underlying the OSPAR EACs and the Environmental Quality Standards (EQSs) of the European Union Water Framework Directive. The procedure by which ERL criteria are derived is very different from the methods used to derive EACs and EQSs, and so precise equivalence between the two sets of criteria should not be expected. ERL values are to be used in sediment assessments of PAHs as an interim solution where recommended EACs are not available.
Assessment methods
PAH concentrations are measured in shellfish and sediment samples and PAH bile metabolites in fish taken annually (or every few years) from monitoring sites throughout much of the Arctic Waters (shellfish only), Greater North Sea, Celtic Seas, Bay of Biscay and Iberian Coast (Figure 3, Figure 4 and Figure 5). Additional data is available but was not included in the regional status and trend assessment due to there being too few stations or number of years.
Monitoring of PAH in the OSPAR Maritime Area began between 1985 and 1999. For the measurements of PAH concentrations in shellfish, blue mussel (Mytilus edulis) made up the majority of time series in the OSPAR Maritime Area, although data were also available for other species. The number of time series used in each OSPAR Region and contaminants assessment area is shown in Table b. Only assessment areas with at least three monitoring sites with a reasonable geographic spread were included in the regional assessment of status and temporal trends.
For each PAH compound at each monitoring site, the time series of concentration measurements was assessed for temporal trends and status using the methods described in the OSPAR Hazardous Substances Assessment Tool ( https://dome.ices.dk/ohat/?assessmentperiod=2022 ). The results from these individual time series were then synthesised at the assessment area scale in a series of meta-analyses.
For temporal trends, those monitoring sites that were representative of general conditions were considered and those monitoring sites impacted due to a point source were excluded. Analysis was also restricted to assessment areas where there were at least three monitoring sites with trend information and where those monitoring sites had reasonable geographic spread.
The trend for each PAH compound at each monitoring site was summarised by the estimated annual change in log concentration, with its associated standard error.
The annual change in log concentration was then modelled by a linear mixed model with a fixed effect:
~ OSPAR contaminants assessment area and random effects:
~ compound + compound: OSPAR contaminants assessment area + monitoring site + compound: monitoring site + within-series variation
The choice of fixed and random effects was motivated by the assumption that the PAH compounds would have broadly similar temporal trends, since they have similar sources. Thus, the fixed effect measures the common trend in PAH compounds in each OSPAR contaminants assessment area and the random effects measure variation in trends:
- between compounds common across OSPAR contaminants assessment areas (congener);
- between compounds within OSPAR contaminants assessment areas (compound: contaminants assessment area);
- between monitoring sites common across compounds (monitoring site);
- between compound but common across tissues and species within monitoring sites (compound : monitoring site); and
- residual variation.
The residual variation is made up of two terms: the variation associated with the estimate of the trend from the individual time series, which is assumed known (and given by the square of the standard error); and a term which accounts for any additional residual variation not explained by the other fixed and random effects.
Evidence of temporal trends in PAH concentration at the assessment area scale was then assessed by plotting the estimated fixed effects with point-wise 95% confidence intervals. Differences between compounds were explored by plotting the predicted temporal trend for each compound and for each compound/assessment area combination with point-wise 95% confidence intervals.
Similar analyses explored status at the assessment area scale. Two summary measures were considered: the log ratio of the fitted concentration in the last monitoring year to the EAC or ERL; and the log ratio of the fitted concentration in the last monitoring year to the BAC. Impacted monitoring sites were also included in these analyses.
Finally, concentration profiles across compounds at the assessment area scale were explored using the fitted log concentration in the last monitoring year.
BACs and EACs are available for the following PAHs in mussels and oysters and sediment (Table a).
| PAH | Abbreviation | mussels and oysters | sediment | ||||
|---|---|---|---|---|---|---|---|
| BAC (μg/kg dw) | EAC (μg/kg dw) | QS (hh) (μg/kg ww) | BAC¹ (μg/kg dw) | BAC² (μg/kg dw) | ERL (μg/kg dw) | ||
| Naphthalene | 340 | 8 | 160 | ||||
| Phenanthrene | PA | 11,0 | 1700 | 32 | 7,3 | 240 | |
| Anthracene | ANT | 290 | 5 | 1,8 | 85 | ||
| Dibenzothiophene | 190 | ||||||
| Fluoranthene | FLU | 12,2 | 110 | 30 | 39 | 14,4 | 600 |
| Pyrene | PYR | 9,0 | 100 | 24 | 11,3 | 665 | |
| Benz[a]anthracene | BAA | 2,5 | 80 | 16 | 7,1 | 261 | |
| Chrysene (including triphenylene) | CHR | 8,1 | 20 | 8,0 | 384 | ||
| Benzo[a]pyrene | BAP | 1,4 | 600 | 5 | 30 | 8,2 | 430 |
| Benzo[g,h,i]perylene | BGHIP | 2,5 | 110 | 80 | 6,9 | ||
| Indeno[123-c,d]pyrene | ICDP | 2,4 | 103 | 8,3 | |||
Table a notes: dw, dry weight; ww, wet weight; hh, human health
- for sediment BACs are normalised to 2,5% organic carbon
- BACs for mussels and oysters applied to all bivalves.
- PAHs are not routinely monitored in fish, but PAH bile metabolites are in Regions 2 and 3. For PAH bile metabolites (1-hydroxypyrene, or equivalent) in fish, the BACs and EACS are dependent on the species and analytical method used, more details can be found here AC biological effects (ices.dk) (Davies and Vethaak 2012)
- 1, All assessment areas except Iberian Sea and Gulf of Cadiz; 2, Iberian Sea and Gulf of Cadiz
- Denmark has reservations to the EAC and ERL values
The number of time series used in each OSPAR Region and assessment area assessed is shown in Table b.
| Region | OSPAR contaminants assessment area | sediment | shellfish | fish | |||
|---|---|---|---|---|---|---|---|
| Trends | Status | Trends | Status | Trends | Status | ||
| Arctic Waters | Barents Sea | - | - | 1* | 2* | - | - |
| Greenland-Scotland Ridge | - | - | 3* | 8 | - | - | |
| Norwegian Sea | - | - | 1* | 1* | - | - | |
| Greater North Sea | Norwegian Trench | - | - | - | - | 2* | 3 |
| Northern North Sea | 18 | 18 | 18 | 20 | 7 | 12 | |
| Skagerrak and Kattegat | - | - | 8 | 20 | 0* | 1* | |
| Southern North Sea | 56 | 60 | 18 | 22 | 13 | 15 | |
| English Channel | 3 | 52 | 23 | 25 | 4 | 4 | |
| Celtic Seas | Irish and Scottish West Coast | 7 | 7 | 17 | 21 | 2* | 2* |
| Irish Sea | 13 | 15 | 23 | 33 | 10 | 12 | |
| Celtic Sea | 1* | 3* | 19 | 27 | 2* | 2* | |
| Bay of Biscay and Iberian Coast | Northern Bay of Biscay | - | - | 25 | 32 | - | - |
| Iberian Sea | 0* | 34 | 24 | 26 | - | - | |
| Gulf of Cadiz | - | - | - | - | - | - | |
Differences in methodology used for the QSR 2023 compared with the QSR 2010
For the QSR 2023, a meta-analysis is used to synthesise the individual time series results and provide an assessment of status and temporal trends at the assessment area level. Meta-analyses take into account both the estimate of status or temporal trend in each time series and the uncertainty in that estimate. This method was also used for the IA 2017. This assessment also includes the assessment of bile metabolites, which was not included in the QSR 2010 or IA 2017. Although not presented in this assessment, the status assessment against the human health standards (QS(hh)) can be found on the OSPAR Hazardous Substances Assessment Tool ( https://dome.ices.dk/ohat/?assessmentperiod=2022 ).
Results
Polycyclic aromatic hydrocarbon (PAH) concentrations were measured in sediment and shellfish, and bile metabolites in fish, collected between 1985 and 2020 from monitoring sites throughout much of the Arctic Waters (shellfish only), Greater North Sea, Celtic Seas, and Bay of Biscay and Iberian Coast (Figure 3, Figure 4 and Figure 5), at frequencies ranging from annually to every five years.
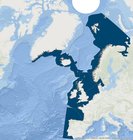
Figure 3: Monitoring sites used to assess PAH concentrations in sediment by OSPAR contaminants assessment areas (grey lines) determined by hydrogeographic principles and expert knowledge not OSPAR internal boundaries (black lines). There are additional data that are not shown because they have too few years. Available at: ODIMS
Figure 4: Monitoring sites used to assess PAH concentrations in shellfish by OSPAR contaminants assessment areas (grey lines) determined by hydrogeographic principles and expert knowledge not OSPAR internal boundaries (black lines). There are additional data that are not shown because they have too few years. Available at: ODIMS
Figure 5: Monitoring sites used to assess PAH concentrations in bile metabolites in fish by OSPAR contaminants assessment areas (grey lines) determined by hydrogeographic principles and expert knowledge not OSPAR internal boundaries (black lines). There are additional data that are not shown because they have too few years. Available at: ODIMS
The number of monitoring sites varied widely between OSPAR contaminant assessment areas, with the Greater North Sea having the most. Only assessment areas with at least three monitoring sites and a reasonable geographic spread were included in the assessment of status and temporal trends.
PAH concentrations in sediment and shellfish and the PAH metabolite (1-hydroxy pyrene) in fish, were compared to the OSPAR Background Assessment Concentration (BAC). In addition, PAH concentrations in shellfish (and 1-hydroxy pyrene for fish) were compared to Environmental Assessment Criteria (EACs) and concentrations in sediment compared to the United States Environmental Protection Agency’s Effects Range-Low (ERL). Adverse effects on marine organisms are rarely observed when concentrations are below the EAC or ERL value.
Mean PAH concentrations in sediment and shellfish and 1-hydroxy pyrene in fish, are statistically significantly below the ERL or EAC in all contaminants assessment areas (Figure 6, Figure 7 and Figure 8). Therefore, adverse biological effects in marine species are unlikely. Concentrations in shellfish are lowest in the Greenland-Scotland Ridge, this is the only area where concentrations are at background (i.e., statistically significantly below the BAC). No area was at background for sediment, PAHs in sediment were not assessed in the Greenland-Scotland Ridge.
 (with 95% upper confidence limits)")
Figure 6: Mean PAH concentration in sediment in each OSPAR contaminants assessment area, relative to the Effects Range Low (ERL) (with 95% upper confidence limits)
 or Environmental Assessment Criteria (EAC) (with 95% upper confidence limits)")
Figure 7: Mean PAH concentration in shellfish in each OSPAR contaminants assessment area, relative to the Effects Range Low (ERL) or Environmental Assessment Criteria (EAC) (with 95% upper confidence limits)
 (with 95% upper confidence limits)")
Figure 8: PAH bile metabolite concentrations in fish in each OSPAR contaminants assessment area, relative to the Environmental Assessment Criteria (EAC) (with 95% upper confidence limits)
Temporal trends in the PAH concentrations in sediment and shellfish were assessed in areas with at least three stations and five years of data, with five areas being assessed for sediment, nine for shellfish and four for PAH bile metabolites in fish (Figure 9, Figure 10 and Figure 11). PAH concentrations are increasing in sediment from the Irish and Scottish West Coast. Decreasing trends were observed in shellfish from the Northern North Sea and the Iberian Sea. Bile metabolite concentrations show no statistically significant trend in all four regions.

Figure 9: Percentage annual change in PAH concentration in sediment in each OSPAR contaminants assessment area.
Note: No statistically significant (p <0,05) change in mean concentration (circle), mean concentration is significantly decreasing (downward triangle), mean concentration is significantly increasing (upward triangle)

Figure 10: Percentage annual change in PAH concentration in shellfish in each OSPAR contaminants assessment area.
Note: No statistically significant (p <0,05) change in mean concentration (circle), mean concentration is significantly decreasing (downward triangle), mean concentration is significantly increasing (upward triangle)

Figure 11: Percentage annual change in PAH bile metabolite concentrations in fish in each OSPAR contaminants assessment area.
Note: No statistically significant (p <0,05) change in mean concentration (circle), mean concentration is significantly decreasing (downward triangle), mean concentration is significantly increasing (upward triangle)
Polycyclic aromatic hydrocarbon (PAH) concentrations are measured in sediment and shellfish samples and bile metabolites (1-hydroxy pyrene, or 1 hydroxy pyrene equivalents) in fish, taken annually (or every few years) from monitoring sites throughout much of the Arctic Waters, Greater North Sea, Celtic Seas, and Bay of Biscay and Iberian coast (Figure 3, Figure 4 and Figure 5). The number of monitoring sites varies widely between assessment areas, with the Greater North Sea having the most. Only assessment areas with at least three monitoring sites and a reasonable geographic spread were included in the assessment of status and temporal trends (Table b).
PAH concentrations in sediment and shellfish and the PAH metabolite (1-hydroxy pyrene, or 1 hydroxy pyrene equivalents) in fish, were compared to the OSPAR Background Assessment Concentration (BAC). In addition, PAH concentrations in shellfish (and 1-hydroxy pyrene, or 1 hydroxy pyrene equivalents for fish) were compared to Environmental Assessment Criteria (EACs) and concentrations in sediment compared to the United States Environmental Protection Agency’s Effects Range-Low (ERL). Adverse effects on marine organisms are rarely observed when concentrations are below the EAC or ERL value.
Mean PAH concentrations in sediment (normalised to organic carbon in the Greater North Sea, Channel, Bay of Biscay and Celtic Seas) and biota (shellfish) relative to the BAC for each assessment area are shown in Figure a and Figure b. Mean individual PAH concentrations in sediment were mainly above BACs. Concentrations were statistically significantly below BACs for two individual PAHs (indeno[1,2,3-cd]pyrene and benzo[g,h,i]perylene) in the Northern North Sea, Southern North Sea and Channel. For shellfish, concentrations were lowest in the Greenland-Scotland Ridge with all PAH compounds being below the BAC. Three PAH compounds (chrysene, benzo[a]pyrene and indeno[1,2,3-c,d]pyrene) were also below BACs in shellfish in the Irish and Scottish West Coast and two PAHs (chrysene and indeno[123-c,d]pyrene) in the Celtic Sea.
 (with 95% upper confidence limits)")
Figure a: Mean PAH concentration in sediment in each OSPAR contaminants assessment area, relative to the Background Assessment Concentration (BAC) (with 95% upper confidence limits)
Note: Value of 1 means that the mean concentration equals the BAC. Blue, mean concentration is statistically significantly (p <0,05) below the BAC. Green, the mean concentration is statistically significantly below the Environmental Assessment Criteria (EAC) but not below the BAC. Red, mean concentration is not statistically significantly below the EAC. Amber, mean concentration is statistically significantly (p <0,05) above the BAC, and no EAC or ERL available. ICDP, indeno[1,2,3-cd]pyrene; BGHIP, benzo[ghi]perylene; BAP, benzo[a]pyrene; CHR, chrysene (including triphenylene); BAA, benz[a]anthracene; PYR, pyrene; FLU, fluoranthene; PA, phenanthrene
 (with 95% upper confidence limits)")
Figure b: Mean PAH concentration in shellfish in each OSPAR contaminants assessment area, relative to the Background Assessment Concentration (BAC) (with 95% upper confidence limits)
Note: Value of 1 means that the mean concentration equals the BAC. Blue, mean concentration is statistically significantly (p <0,05) below the BAC. Green, the mean concentration is statistically significantly below the Environmental Assessment Criteria (EAC) but not below the BAC. Red, mean concentration is not statistically significantly below the EAC. Amber, mean concentration is statistically significantly (p <0,05) above the BAC, and no EAC or ERL available. ICDP, indeno[1,2,3-cd]pyrene; BGHIP, benzo[ghi]perylene; BAP, benzo[a]pyrene; CHR, chrysene (including triphenylene); BAA, benz[a]anthracene; PYR, pyrene; FLU, fluoranthene; PA, phenanthrene
All PAH compounds in sediment and biota were significantly below the ERL or EAC in all assessment areas. Therefore, adverse biological effects in marine species are unlikely in the assessed areas. The PAH profile in all assessment areas was typical of pyrolytic sources, being dominated by the heavier 4-ring to 6-ring PAH compounds.
Temporal trends in PAH concentrations in sediment and biota were assessed in areas where there were at least three stations and five years of data. The percentage yearly change for each PAH in each assessment area is shown in Figure c and Figure d. In most regions trends were stable or downwards. However, increasing trends were seen for individual PAHs in some regions, with sediment from the Irish and Scottish West Coast having increasing trends for 9 of the 18 PAHs. Shellfish from the same region showed decreasing trends for 5 out of 14 PAHs, and no increasing trends for the other PAHs. Increasing trends in shellfish were seen for four individual PAHs in the Channel and Irish Sea. It should be noted that shellfish and sediment sampling cover different areas, with shellfish sites being coastal and estuarine and sediment samples being collected in coastal and offshore areas.

Figure c: Percentage annual change in PAH concentration in sediment by OSPAR contaminants assessment area and compound
Note: No statistically significant (p <0,05) change in mean concentration (circle), mean concentration is significantly decreasing (downward triangle), mean concentration significantly increasing (upward triangle)

Figure d: Percentage annual change in PAH concentration in shellfish by OSPAR contaminants assessment area and compound.
Note: No statistically significant (p <0,05) change in mean concentration (circle), mean concentration is significantly decreasing (downward triangle), mean concentration significantly increasing (upward triangle)
Individual Time Series Results per Monitoring Site
A summary of individual time series results per monitoring site (across the OSPAR Maritime Area) for PAH concentrations in sediment and biota is presented here https://dome.ices.dk/ohat/?assessmentperiod=2022 . In summary, at 202 out of 1 841 time series across the OSPAR Maritime Area, mean concentrations of PAH in sediment are above the ERL. At 50 out of 1 459 stime series, mean concentrations have increased over the assessment period. For shellfish 79 out of 2 209 time series were above the EAC and 126 of 1 896 mean concentrations have increased over the assessment period. For 1-hydroxy pyrene, or 1 hydroxy pyrene equivalents, in fish none of the 49-time series exceeded the EAC and mean concentrations have increased for 11 of 48 sites. It should be noted that not all individual time series results are included in the assessments (see number of time series used in each assessment area in Table b), due to the criteria set out in the assessment methods.
Confidence Assessment
There is high confidence in the quality of the data used for this assessment. The data have been collected over many years using established sampling methodologies. There is sufficient temporal and spatial coverage and no significant data gaps in the areas assessed over the relevant time periods. The synthesis of monitoring site data for the assessment area scale are based on established and internationally recognised protocols for monitoring and assessment per monitoring site, therefore there is also high confidence in the methodology.
Conclusion
Mean polycyclic aromatic hydrocarbon (PAH) concentrations in shellfish were at background levels in one of the six assessed contaminants assessment areas (Greenland-Scotland Ridge). Mean PAH concentrations in sediment and shellfish were below the ERLs or EACs in all assessment areas and therefore are unlikely to cause adverse effects in marine organisms.
However, PAH concentrations need to be kept under surveillance, because concentrations are above background in sediment and shellfish in most regions with individual PAH compounds also exceeding the EAC / ERL at some stations. Concentrations are mainly stable or decreasing however there are also some increasing trends, particularly for sediment in the Irish and Scottish West Coast.
PAHs originate from natural sources and so they will always be present in the marine environment. However, better use of emission control technology in combustion processes could improve the situation further and reduce concentrations to natural levels.
PAH concentrations in sediment and biota have in general been stable or decreasing with only 3,4% of sediment and 6,6% of shellfish time series showing increasing trends. However, for 1-hydroxy pyrene, or 1 hydroxy pyrene equivalents, in fish 23% of time series showed increasing trends, although there was limited data with only 48 time series. At the regional scale only Irish and Scottish West Coast sediment showed an increasing trend.
The majority of time series were below concentrations that could cause adverse effects in marine organism with only 11% time series for sediment exceeding the ERL, and for shellfish 3,6% of time series exceeded the EAC. For 1-hydroxy pyrene, or 1 hydroxy pyrene equivalents, in fish no time series exceeded the EAC. However, few assessment areas had concentrations below the BAC (close to background), only in the Greenland-Scotland Ridge were all PAH compounds below the BAC.
Knowledge Gaps
There is a lack of monitoring data, particularly for sediment in Arctic waters, and in some assessment areas there are insufficient monitoring sites with a good geographic spread for a status and trends assessment.
Monitoring of PAH metabolites in fish bile can extend the biota monitoring programme to include open waters, however this is the first OSPAR bile metabolite assessment and only 4 assessment areas (Northern North Sea, Southern North Sea, Channel, Irish Sea) had enough data for a status and trend assessment.
Effects Range-Low (ERL) values were used in the sediment assessment because there are no Environmental Assessment Criteria (EACs) available. There is a need for EACs to be developed PAHs in sediment.
Environmental Assessment Criteria (EACs) were used in the assessment of parent PAHs in shellfish only; there are no assessment criteria for alkylated PAHs. There is a need for EACs to be developed for alkylated PAHs in shellfish. The limitations in using EACs and Background Assessment Concentrations (BACs) should be addressed with further research.
Baumard, P., Budzinski, H., Garrigues, P., Narbonne, J. F., Burgeot, T. Michel, X. and Belloccq, J. (1999). ‘Polycyclic aromatic hydrocarbon burden of mussels (Mytilius sp.) in different marine environments in relation with sediment and PAH contamination and bioavailability’, Marine Environment Research, 47, 415 – 439.
Davies, I. M. and Vethaak, A. D. 2012. Integrated marine environmental monitoring of chemicals and their effects. ICES Cooperative Research Report No. 315. 277 pp. https://doi.org/10.17895/ices.pub.5403
Davis, H. K., Moffat, C. F. and Shepherd N. J. (2002). ‘Experimental tainting of marine fish by three chemical dispersed petroleum products, with comparisons to the Braer oil spill’, Spill Science and Technology Bulletin, 7, 257 – 278.
Honda, M. and Suzuki, N., 2020. Toxicities of polycyclic aromatic hydrocarbons for aquatic animals. International Journal of Environmental Research and Public Health, 17(4), p.1363.
Marvanova, S., Vondracek, J., Pencikova, K., Trilecova, L., Krcmar, P., Topinka, J., Novakova, Z., Milcova, A., Machala, M. (2008). ‘Toxic effects of methylated benz[a]anthracenes in liver cells’, Chemical Research in Toxicology, 21, 503 – 512.
Mojiri, A., Zhou, J. L., Ohashi, A., Ozaki, N., and Kindaichi, T. (2019). Comprehensive review of polycyclic aromatic hydrocarbons in water sources, their effects and treatments. Sci. Total Environ. 2019:133971. doi: 10.1016/j.scitotenv.2019.133971
OSPAR Publication 2008-379 CEMP Assessment Manual: Co-ordinated Environmental Monitoring Programme Assessment Manual for contaminants in sediment and biota
OSPAR Publication 2009-461 Background Document on CEMP Assessment Criteria for the QSR 2010
OSPAR (2017). Intermediate Assessment 2017. Available at: https://oap.ospar.org/en/ospar-assessments/intermediate-assessment-2017/
OSPAR (2009). Background Document on Polycyclic Aromatic Hydrocarbons (PAHs), Publication Number: 399/20009, ISBN: 978-1-906840-39-6
Background document on Background Assessment Concentrations (BAC) for Polybrominated Diphenyl Ethers (PBDE) in fish and shellfish, Publication Number: 796/2021, ISBN: 978-1-913840-00-6
Richardson, D. M., Davies, I. M., Moffat, C. F., Pollard, P. and Stagg, R. M. (2001) ‘Biliary PAH metabolites and EROD activity in flounder (Platichthys flesus) from a contaminated estuarine environment’, Journal of Environmental Monitoring, 3, 610 - 615.
Stagg, R. M., McIntosh A. M. and Mackie, P. (1995). ‘The induction of hepatic mono-oxygenase activity in dab (Limanda limanda) in relation to environmental contamination with petroleum hydrocarbons in the North Sea’, Aquatic Toxicology, 33: 254-264.
Tobiszewski, M. and Namieśnik, J. 2012. PAH diagnostic ratios for the identification of pollution emission sources. Environ. Pollut., 162, 110-119.
UNECE (2009). Stockholm Convention on Persistent Organic Pollutants Decision 2009/1, Amendment of the text of and annexes I, II, III, IV, VI and VIII to the 1998 Protocol on Persistent Organic Pollutants
Vethaak, A.D., Baggelaar, P.K., van Lieverloo, J.H.M. and Ariese, F., 2016. Decadal trends in polycyclic aromatic hydrocarbon (PAH) contamination assessed by 1-hydroxypyrene in fish bile fluid in the Netherlands: Declining in marine waters but still a concern in estuaries. Frontiers in Marine Science, 3, p.215.
Contributors
Lead authors: Lynda Webster and Rob Fryer
Supported by: Working Group for Monitoring and on Trends and Effects of Substances in the Marine Environment, Task Group for the development of the Hazardous Substances Thematic Assessment and Hazardous Substances and Eutrophication Committee.
Citation
Webster, L. and Fryer, R. 2022. Status and Trends in the Concentrations of Polycyclic Aromatic Hydrocarbons (PAHs) in Shellfish and Sediment. In: OSPAR, 2023: The 2023 Quality Status Report for the North-East Atlantic. OSPAR Commission, London. Available at: https://oap.ospar.org/en/ospar-assessments/quality-status-reports/qsr-2023/indicator-assessments/pah-shellfish-sediment
| Assessment type | Indicator Assessment |
|---|---|
| Summary Results | https://odims.ospar.org/en/submissions/ospar_pahs_biota_sediment_msfd_2022_06/ |
| SDG Indicator | 14.1 By 2025, prevent and significantly reduce marine pollution of all kinds, in particular from land-based activities, including marine debris and nutrient pollution |
| Thematic Activity | Hazardous Substances |
| Relevant OSPAR Documentation | OSPAR Publication 2008-379 CEMP Assessment Manual: Co-ordinated Environmental Monitoring Programme Assessment Manual for contaminants in sediment and biota |
| Date of publication | 2022-06-30 |
| Conditions applying to access and use | https://oap.ospar.org/en/data-policy/ |
| Data Results | https://odims.ospar.org/en/submissions/ospar_pah_biota_sediment_results_2022_06/ |
| Data Snapshot | https://doi.org/10.17895/ices.data.21229139 |
| Data Snapshot | https://doi.org/10.17895/ices.data.18601820 |
| Data Source | https://dome.ices.dk/ohat/?assessmentperiod=2022 |