

Extent of Physical Disturbance to Benthic Habitats: Aggregate Extraction
Background
The BH3 aggregates assessment aims to quantify estimated disturbance caused by extraction pressure associated with commercial aggregate extraction; please see separate BH3 indicator assessment for surface and subsurface abrasion pressure associated with bottom-contact fishing.
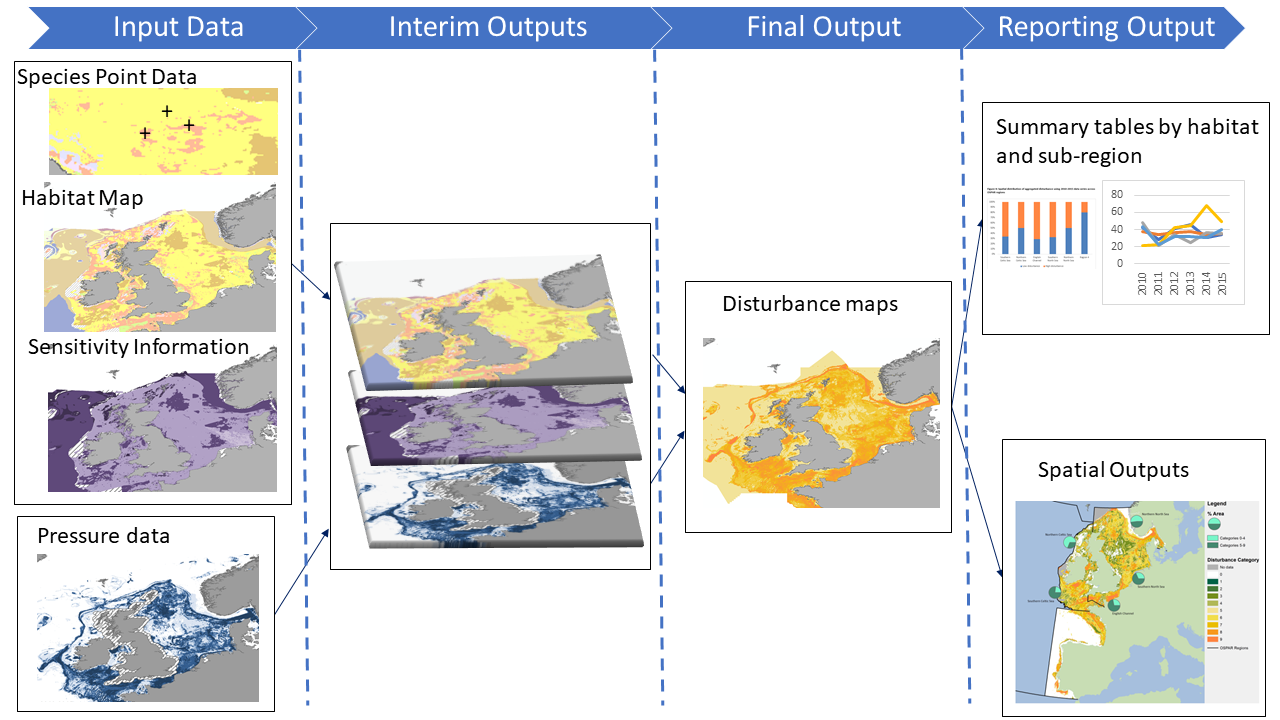
Figure 1: Interlinkage between data inputs, processes, and outputs for the BH3 indicator

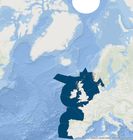
Figure 2: OSPAR assessment units used to report BH3 results against
The BH3 Intermediate Assessment 2017 only assessed impacts from bottom-contact fishing (via surface and sub-surface abrasion pressure). Following further consultation between the OSPAR Environmental Impacts of Human Activities Committee (EIHA) and Biodiversity Committee (BDC), an assessment of commercial aggregate extraction was selected as the next activity to be analysed by BH3. Therefore, the QSR 2023 is the first assessment on the physical disturbance of benthic habitats and seafloor integrity associated with commercial aggregate extraction via the BH3 indicator. Please see separate BH3 indicator assessment for surface and subsurface abrasion pressure associated with bottom-contact fisheries.
Marine sediment extraction in the North-East Atlantic can be split into two distinct operations: firstly, capital / maintenance dredging (including navigational dredging) where marine sediment is moved as a by-product, and secondly, extraction, also known as ‘commercial aggregate extraction’, which is the licensed removal of non-living resources from the seafloor for a specific purpose (e.g., construction industries) (OSPAR, 2009). Capital dredging can be defined as the removal of sediments to depths not previously dredged (or dredged within a 10-year period), and maintenance dredging defined as keeping the seafloor of a water body at specific depths, appropriate for a human activity such as navigation (MMO, 2019). Capital and maintenance dredging are commonly used for the creation and management of navigable channels, vessel berths in ports and the removal of accumulated sediment, undesired for the intended use of a given water body (MMO, 2019). The majority of commercial aggregate extraction in the OSPAR Maritime Area is related to the extraction of sand and gravel, with three main uses: (i) construction (predominantly for concrete); (ii) land reclamation and construction fill; and (iii) coastal protection (e.g., beach replenishment) (OSPAR, 2009; OSPAR, 2021). The QSR 2023 BH3 assessment focuses on pressures associated with commercial aggregate extraction and does not consider capital / maintenance dredging, as associated data were not readily available at the required spatial resolutions at the time of assessment.
Pressure can be defined as “the mechanism through which an activity has an effect on any part of the ecosystem”, the nature of the pressure is determined by the type of activity, intensity, and its distribution (Robinson et al., 2008). Pressures from aggregate extraction that cause physical disturbance to the seabed can have deleterious effects on benthic organisms and habitats (Newell et al., 1998; Desprez, 2000; Newell and Woodcock, 2013). The most common method of commercial aggregate extraction in the offshore marine environment is trailer suction hopper dredging, which can create shallow furrows that extend for several kilometres, are initially 0,5 m deep, and are generally 2 to 3 m wide (Tillin et al., 2011; Last et al., 2011; Newell & Woodcock, 2013). Physical impacts from trailer dredging can extend for multiple kilometres, having potential of lowering the seabed by several metres through consistent and repeated dredging within a given location, typically throughout the duration of a license period (e.g., 15 years) (Tillin et al., 2011; BMAPA & TCE, 2017).
Although less common, static suction dredging, or ‘anchor dredging’, can create deep (5 to 10 m) depressions in the seabed, and can be used to target specific types of sediment in localised areas (Tillin et al., 2011; Last et al., 2011; Newell & Woodcock, 2013). Dredging depressions can create geological irregularities in the seabed, with infill and degradation rates varying dependent on local and regional hydrodynamic and sedimentation regimes (BMAPA & TCE, 2017). Monitoring suggests that trailer dredge furrows can degrade over durations of 3 to 7 years following impact (Cooper et al., 2005). In contrast, deeper, more prominent depressions, often associated with static dredging can degrade over longer timeframes, sometimes resulting in a permanent lowering of the seabed (Cooper et al., 2007).
Infilling and degradation of dredge depressions can take longer in lower energy environments, or in areas with larger sediment particles (e.g., gravels) that require greater water velocities for sediment entrainment and therefore, transport prior to deposition (Cooper et al., 2007). Conversely, in higher energy environments and / or sediments that require lower water velocities for transport, such as sands, the physical, geological effects of dredging may have been masked by new sedimentation within a matter of months (BMAPA & TCE, 2017; ICES, 2019a). In addition, ecological recovery of biota is possible, without full physical recovery of seabed geomorphology (Tyler-Walters et al., 2018; ICES, 2019a). However, it should be noted that recovery time and success are highly dependent on the nature of the dredging activity, the affected seafloor geology and surrounding hydrodynamic regime; further evidence is required to better understand the nature of recovery following extraction.
In the QSR 2023 assessment, the pressure associated with physical disturbance from commercial aggregate extraction was ‘Habitat structure changes - removal of substratum (extraction)’ (hereafter defined as ‘extraction’ pressure). Although aggregate extraction can lead to permanent changes of the original morphological state of the seabed, it is possible for biological / ecological recovery to be reached, without a full recovery of the physical state (Desprez et al., 2022). The BH3 assessment of aggregate extraction aims to assess direct pressure associated with extraction that does not result in physical loss (a permanent loss of habitat via change to another substrate type), although, it is recognised that physical loss can occur following extraction activity (e.g., infilling of dredge depressions by fine sediment).
To analyse the impact of extraction pressure on benthic ecosystems, information quantifying both the distribution and intensity of extraction activity is required (Newell et al., 1998). However, the definition of extraction intensity is less established than the definition used to quantify the intensity of fishing pressure. The International Council for the Exploration of the Sea (ICES) Working Group on the Effects of Extraction of Marine Sediments on the Marine Ecosystem (WGEXT) previously aimed to quantify temporal extraction intensity as volume extracted, per unit area. However, due to lack of commercial extraction data harmonisation across the North-East Atlantic, previous assessments of extraction activity used dredging duration, per unit area, per unit time as a substitute for intensity (ICES 2016; ICES 2019b). The BH3 assessment of commercial extraction aims to build on previous assessments and – in the absence of standardised, spatially discrete data on volume extracted – quantify extraction intensity as the annual area affected by extraction activity, per unit area.
The QSR 2023 BH3 assessment aims to assess the status of benthic habitats in the North-East Atlantic, identifying trends and facilitating comparisons with previous assessments; specifically, the QSR 2010 and IA 2017. This component of the QSR 2023 BH3 assessment focusses on extraction pressure assessments only; for assessments of fishing pressure, please see separate BH3 assessment document. Findings are presented in two intervals: 2009 to 2020 and 2016 to 2020; corresponding to the decadal QSR assessment and the six-year period used by European Union (EU) Member States to assess progress from the second Article 8 reporting of the EU Marine Strategy Framework Directive (MSFD) in 2018, respectively. The BH3 assessment method is an agreed OSPAR Common Indicator for the Greater North Sea, the Celtic Seas and the Bay of Biscay and Iberian Coast Regions (OSPAR Regions II, III and IV; including the following marine assessment units: Central North Sea, Southern North Sea, Channel, Norwegian Trench, Kattegat, Northern Celtic Sea, Southern Celtic Sea, Gulf of Biscay, North-Iberian Atlantic, South-Iberian Atlantic, and Gulf of Cadiz, Figure 2). The BH3 assessment method is an OSPAR Candidate Indicator for the Atlantic Projection located in OSPAR Region V.
The BH3 method comprises four main components: the creation of a composite habitat map; assessments of sensitivity; the creation of pressure layers and the calculation of potential physical disturbance. Inputs are combined using a stepwise approach to calculate the total area of potential disturbance within assessment units:
- A composite habitat map showing the extent and distribution of habitats at different scales of the EUNIS 2007 classification based on observational and modelled data (Castle et al., 2021). Please see ‘Step 5: EUNIS to MSFD Benthic Broad Habitat Type (BHT) Translation’ and Annex 1 of the BH3 CEMP guidelines for a detailed summary of translation process from EUNIS source data to MSFD BHT classification for national reporting.
- Species and habitat sensitivity derived from resistance (ability to withstand a given pressure) and resilience (ability of a habitat to recover) (Holling, 1973; Tillin et al., 2010; BioConsult, 2013; Tillin and Tyler-Walters, 2014a & 2014b; Tyler-Walters et al., 2018; Last et al., 2020).
- Distribution and intensity of pressures from human activities causing physical disturbance (surface abrasion, subsurface abrasion, extraction) to the seabed.
- Calculation of potential disturbance of benthic habitats, per habitat type and per assessment unit. Calculation of potential disturbance is based on the intensity of pressures and degree of habitat sensitivity per pressure type.
It should be noted that the details of the methods described below are only written where they deviate from the QSR 2023 BH3 assessment of fishing pressure.
Step 1: Composite habitat map (not including OSPAR Threatened and / or Declining Habitats assessments)
A composite habitat map was developed to show the extent and distribution of habitats and their associated sensitivities for all QSR 2023 BH3 assessments. Habitats were mapped to the greatest level of detail available from the EUNIS 2007 classification system (EEA, 2021) using a combination of modelled and in-situ sample data. Please see the QSR 2023 BH3 assessment of fishing pressure for full details on data sources and methodology used for the creation of the composite habitat map.
Step 2: Assessment of Sensitivity
Step 2 of the assessment created a sensitivity layer that quantified the sensitivity of species and habitats within the OSPAR Maritime Area to extraction pressure. For full detail of the methods used to select pressure-specific sensitivity values, please see the BH3 assessment of bottom-contact fishing pressure. To ensure that sensitivity assessments relevant to commercial aggregate extraction were used, established pressure-activity relationships were identified via literature review and the JNCC Marine Pressures-Activities Database, Version 1.5 (Robson et al., 2018). Sensitivity values used in the BH3 assessment included assessments against the OSPAR ICG-C pressure ‘Habitat structure changes - removal of substratum (extraction)’ (Table a); relevant sensitivity assessments from MarESA and MB0102 were used in the BH3 sensitivity analyses. The BH3 assessment of aggregate extraction aims to assess direct pressure associated with extraction and does not aim to assess physical loss (a permanent loss of habitat via change to another substrate type), although, it is recognised that physical loss can occur following extraction activity (e.g., infilling of dredge depressions by fine sediment).
| OSPAR ICG-C Pressure | Assessment Benchmark | Definition |
|---|---|---|
| Habitat structure changes - removal of substratum (extraction) | Extraction of substratum to 30 cm (where substratum includes sediments and soft rocks but excludes hard bedrock) | Unlike the "physical change" pressure type where there is a permanent change in sea bed type (e.g. sand to gravel, sediment to a hard artificial substratum) the "habitat structure change" pressure type relates to temporary and / or reversible change, e.g. from marine mineral extraction where a proportion of seabed sands or gravels are removed but a residual layer of seabed is similar to the pre-dredge structure and as such biological communities could re-colonise; navigation dredging to maintain channels where the silts or sands removed are replaced by non-anthropogenic mechanisms so the sediment typology is not changed. |
Data sources
Habitat polygon data were derived from the composite habitat map created in ‘Step 1’. Species point records obtained from those collated for the QSR 2023 BH3 assessment of fishing pressure, were combined with additional species point records obtained from OneBenthic faunal database (OneBenthic database, 2020). Additional species point records were incorporated as OneBenthic faunal database contained industry data from locations relevant to those licensed for aggregate extraction.
Sensitivity assessments of species and habitats to extraction pressure were obtained from Marine Evidence based Sensitivity Assessments (MarESA) and Defra MB0102 Report No. 22, Task 3: Development of a Sensitivity Matrix (pressures-MCZ / MPA features) (hereafter referred to as MB0102) (Tillin et al., 2010; Tyler-Walters et al., 2018). Please see the QSR 2023 BH3 fisheries assessment for full details on how sensitivity assessments were selected and assigned to individual habitat polygons and species points (Table b).
| Species | BH3 Sensitivity; Habitat structure changes - removal of substratum (extraction) | Sensitivity assessment source |
|---|---|---|
| Abra alba | 3 | Sediment |
| Abra nitida | 4 | Sediment |
| Abra prismatica | 4 | Sediment |
| Alcyonium digitatum | 4 | Sediment; Sublittoral rock |
| Alkmaria romijni | 4 | MarESA |
| Ampharete falcata | 4 | Sediment |
| Amphiura filiformis | 4 | Sediment |
| Arctica islandica | 5 | MarESA |
| Ascidiella aspersa | 3 | Sediment |
| Asterias rubens | 4 | Sediment; Sublittoral rock |
| Astropecten irregularis | 4 | Sediment |
| Atrina fragilis | 5 | MarESA |
| Balanus crenatus | 3 | Sediment |
| Bathyporeia elegans | 3 | Sediment |
| Branchiostoma lanceolatum | 3 | Sediment |
| Brissopsis lyrifera | 4 | Sediment |
| Caecum armoricum | 5 | MarESA |
| Calocaris macandreae | 4 | Sediment |
| Calvadosia campanulata | 5 | MarESA |
| Calvadosia cruxmelitensis | 4 | MarESA |
| Cerianthus lloydii | 3 | Sediment |
| Chaetozone zetlandica | 4 | Sediment |
| Dipolydora caulleryi | 3 | Sediment |
| Echinocardium cordatum | 4 | Sediment |
| Echinocyamus pusillus | 4 | Sediment |
| Echinus esculentus | 3 | Sediment; Sublittoral rock |
| Eudorellopsis deformis | 3 | Sediment |
| Flustra foliacea | 4 | Sediment; Sublittoral rock |
| Funiculina quadrangularis | 4 | Sediment |
| Gammarus insensibilis | 5 | MarESA |
| Glycera lapidum | 4 | Sediment |
| Haliclystus auricula | 5 | MarESA |
| Hippocampus hippocampus | 2 | MarESA |
| Iphinoe trispinosa | 3 | Sediment |
| Lanice conchilega | 4 | Sediment; Sublittoral rock |
| Lithothamnion corallioides | 5 | MarESA |
| Maxmuelleria lankesteri | 3 | Sediment |
| Modiolus modiolus | 4 | Sediment |
| Nematostella vectensis | 5 | MarESA |
| Nemertesia ramosa | 3 | Sediment |
| Neopentadactyla mixta | 5 | Sediment |
| Nephrops norvegicus | 4 | Sediment |
| Nephtys hombergii | 3 | Sediment |
| Obelia longissima | 3 | Sediment |
| Ophiocomina nigra | 4 | Sediment |
| Ophiothrix fragilis | 4 | Sediment |
| Ophiura albida | 4 | Sediment |
| Ostrea edulis | 5 | MarESA |
| Pagurus bernhardus | 4 | Sediment |
| Paramphinome jeffreysii | 4 | Sediment |
| Pecten maximus | 4 | Sediment |
| Pennatula phosphorea | 4 | Sediment |
| Phaxas pellucidus | 4 | Sediment |
| Phymatolithon calcareum | 5 | MarESA |
| Protodorvillea kefersteini | 4 | Sediment |
| Scoloplos armiger | 4 | Sediment |
| Sepia officinalis | 3 | MarESA |
| Sertularia argentea | 3 | Sediment |
| Styela gelatinosa | 4 | Sediment; Sublittoral rock |
| Thyasira flexuosa | 4 | Sediment |
| Timoclea ovata | 4 | Sediment |
| Urticina felina | 4 | Sediment |
| Virgularia mirabilis | 4 | Sediment |
Creating a final extraction sensitivity layer using both habitat and species sensitivity data
The method for creating a final sensitivity layer for both species and habitats broadly followed that used in the QSR 2023 BH3 fisheries assessment. However, when the habitat data was gridded in preparation for joining species point data, a 50 m x 50 m grid (spatially aligned with grid cell size commonly used in aggregate extraction assessments in the North-East Atlantic, e.g., by ICES WGEXT) was used. The 50 m x 50 m grid was created in R (versions ranging from 3.6.1 – 4.1.2; R core team 2019-2021) using the following packages: tidyverse (Wickham et al., 2019), sf (Pebesma, E., 2018), and lubridate (Grolemund & Wickham, 2011) using the following spatial specifications:
- Data projected in Lambert Azimuthal Equal-Area projection ETRS89 / EPSG:3035
- Alignment parameters:
- Latitude of origin 52° N;
- Longitude of origin 10° E;
- False northing 3 210 000,0 m;
- False easting 4 321 000,0 m;
- Grid origin is at 0 m N; 0 m E.
The method of creating a complete extraction sensitivity layer followed the agreed steps for BH3 sensitivity assessments, an overview of which is provided here (please see the QSR 2023 BH3 assessment of fishing pressure for full details on combining species and habitat sensitivity data):
- The composite habitat map was spatially intersected with a grid (50 m x 50 m resolution in this case)
- Where available, species points were spatially joined to habitat polygons within grid cells and where more than one species point was present, only the point with the highest sensitivity value was joined. Assigning the maximum species sensitivity followed the precautionary principle which aimed to avoid assigning sensitivity based on the presence of less sensitive opportunistic species that can occur in high abundances in areas that have already been impacted by human activities.
- Where species point data were present, the maximum value between the habitat and species sensitivity was assigned as the final sensitivity value. This maintained the precautionary approach aimed to mitigate the use of potentially less sensitive, opportunistic species, to represent an already impacted area. If species sensitivity was higher, and therefore, prioritised over habitat sensitivity, the species sensitivity value was only assigned to the portion of the polygon within the grid cell where the record was observed to maximise representativity.
- Where species point data were absent the habitat sensitivity value was assigned as the final sensitivity. Full details of creating a complete sensitivity layer with both species and habitat data can be seen in the QSR BH3 fisheries assessment.
Species and habitat extraction sensitivity layers were only created where extraction activity data were present or had the potential to occur (licensed extraction areas). Assessing sensitivity to extraction pressure for an entire OSPAR assessment unit was not considered relevant, due to the discrete, localised nature of extraction pressure; sensitivity was only considered from areas that were licensed for extraction activity to ensure accuracy. It should be noted that at this current stage of assessment, only direct extraction pressures were considered; sensitivity from wider areas beyond those licensed for extraction could be considered in assessments of secondary impacts (e.g., siltation, smothering and sedimentation changes).
Step 3: Assessing the Extent and Distribution of Physical Disturbance Pressures: Commercial aggregate extraction
Data sources
The extraction data analysed were collated via a joint EIHA and BDC data call, circulated in June 2021. The data call aimed to facilitate standardised and regionally comparable assessments of physical disturbance associated with aggregate extraction on benthic habitats, within the OSPAR Maritime Area. Data were requested from all OSPAR Regions in the formats of:
- Licensed extraction areas and;
- Gridded extraction data, as either:
- total volume dredged, per licensed extraction area / per grid cell, and / or;
- extraction duration in units of time per grid cell as gridded spatial data, indicative of the activity intensity, including both vessel Automatic Identification System (AIS) and Electronic Monitoring System (EMS) data.
- Confirmation of OSPAR Contracting Parties where aggregate extraction activity was known not to occur.
To align with wider North-East Atlantic-scale assessments of aggregate extraction, such as those conducted by the ICES Working Group on the Effects of Extraction of Marine Sediments on the Marine Ecosystem (ICES-WGEXT), data were requested in a standardised 50 m x 50 m grid format. Grids of 50 m x 50 m are beneficial for assessing aggregate extraction data as they equate to the frequency of vessel EMS / AIS pings (typically every 20–30 seconds) (ICES, 2019a). Additionally, the OSPAR QSR presented a temporal assessment of pressure, which required annual gridded data to spatially align. Therefore, the data call requested that 50 m x 50 m grids aligned with parameters derived from European Environment Agency Reference Grids and Infrastructure for Spatial Information in Europe (INSPIRE) geographical grid systems, which previously facilitated standardised reporting on progress and the implementation of the Marine Strategy Framework Directive and Article 17 of the Habitats Directive (EEA, 2017):
- Data projected in Lambert Azimuthal Equal-Area projection ETRS89 / EPSG:3035
- Alignment parameters:
- Latitude of origin 52° N,
- Longitude of origin 10° E,
- False northing 3 210 000.0 m,
- False easting 4 321 000.0 m,
- Grid origin is at 0 m N, 0 m E.
Data were received in response to the data call from both OSPAR Contracting Parties and ICES-WGEXT in a range of formats (Table c). Overall, the most commonly available data across the OSPAR Maritime Area were boundary polygons of areas licensed for aggregate extraction; polygons were available from direct data call responses and publicly available portals (EMODnet, 2021b; MST, 2021; NIBIS, 2021). In addition, many Contracting Parties submit annual aggregate extraction data to ICES, who collate these data and provide it to OSPAR for analysis in the QSR. Data provided by ICES included: national extraction statistics in the form of volume extracted per country, per Regional Sea Convention, per extraction method; spatial polygon layers outlining areas licensed for aggregate extraction; and spatial polygons of areas where extraction occurred within licensed areas for Belgium and the United Kingdom. However, as part of the OSPAR data call additional higher spatial resolution data on volume of sediment extracted was also provided by Germany at the scale of individual licensed areas. Additionally, Denmark and the United Kingdom provided more detailed annual extraction data, within licensed areas, that allowed for an additional measurement of annual extraction intensity.
The degree to which the types of received extraction data could be analysed via BH3 varied, based on data type and resolution of detail (Table d). All data received provided valuable insight to the extent of extraction activity within the OSPAR Maritime Area. However, only two data sources contained sufficient information to quantify both extent and intensity of pressure and, therefore, estimate disturbance: extraction duration data submitted by the United Kingdom and extraction polyline data submitted by Denmark. The spatial extent of these data sources within the OSPAR Maritime Area was limited to just two Contracting Parties. Although other Contracting Parties likely had similar datasets, they were not available for assessments due to commercial sensitivities and constraints from the various national industries. In contrast, licensed area data was the most widespread data available, providing information on the spatial extent of where pressure had potentially occurred across several OSPAR Contracting Parties. Therefore, extraction duration and extraction polyline data from the United Kingdom and Denmark, respectively, were used to estimate disturbance, and licensed area data was used to outline where pressure had potentially occurred. To safeguard commercially sensitive information, raw extraction duration and polyline data from the United Kingdom and Denmark, respectively, were assigned pressure categories prior to disturbance assessments.
Table c: Summary of data received from OSPAR aggregates data call. Spatial data used in the BH3 assessment is highlighted in purple. 1 Preliminary data or a database that is still under construction; 2 The temporal range is applicable to the dataset and not necessarily all individual Contracting Parties within the dataset; 3 Conventional sea not provided in attribute table but spatial analyses indicated that licensed areas were outside the OSPAR Maritime Area; 4 The years 2016, 2018 and 2019 were missing; 5 Only data from 2017 was present for Belgium;’ 6 Convention area not supplied within dataset these countries are known to not contain extraction activity within the OSPAR Maritime Area; 7 Temporal range and Contracting Parties summarised in the table were for the OSPAR Maritime Area only; 8 Extraction volumes in IE and SE were zero indicative that there is no aggregate extraction activity from these countries in the OSPAR Maritime Area
| Data Type | Format | Data Provider | Contents | Temporal Range | OSPAR Regions Covered | OSPAR Contracting Parties Covered |
| Licensed area polygons | Spatial | ICES1 | Polygons by year and country | 1998-20202 | I, II, III, IV, V | BE, DK, FI3, FR, IS, NE, NO, PT, ES, SE3, UK |
| DE | Polygons for two known active licensed areas for sand and gravel extraction: Westerland III, OAM III | N/A | II | DE | ||
| FR | Polygon layer | N/A | II, IV | FR | ||
| NIBIS portal | Polygon for licensed marine and terrestrial extraction sites for a variety of extraction activities. | N/A | II | DE | ||
| MST portal | Four polygon layers as follows:
| N/A | II | DK | ||
| EMODnet portal1 | Polygon layers by year by country | Unknown: database still under construction | ||||
| Area extracted polygons | Spatial | ICES1 | Polygons by year and country | 1993-20204 | II, III | BE5, UK |
| Area extracted values | Tabular | ICES1 | Annual values for total area licensed and total area dredged per country | 2006-2018 | Unknown | BE, DK, FI6, FR, IS, NE, SE6, UK |
| Extraction volume (national statistic) | Tabular | ICES1 | Annual records by country, convention area and extraction type7 | 2005-20202 | I, II, III, IV, V | BE, DK, FR, DE, IS, IE8, NE, NO, PT, ES, SE8, UK |
| Extraction volume (licensed area) | Tabular | DE | Annual records for the following licensed areas: Westerland III, OAM III | 2010-2020 | II | DE |
| Extraction duration | Spatial | The Crown Estate and Royal Haskoning | Annual duration of extraction within 50 x 50 m polygons derived from EMS | 2009-2020 | II, III | UK |
| Extraction polylines | Spatial | MST | Annual extraction polylines derived from AIS with associated start and end times and start and end speeds from extraction activity | 2015-2020 | II | DK |
Table d: Critical analysis, including advantages and disadvantages of data received in response to OSPAR data call
| Metric | Advantages | Disadvantages |
| Licensed area polygons (m2) | Data available for many countries, indicative of area potentially impacted by pressure | May overestimate footprint as extraction does not occur across whole license area and no measurement of intensity provided. |
| Area extracted polygons | Provided more accurate representation of area impacted by activity than licensed area alone. | No measurement of intensity. No indication of extraction method provided. Only available for Belgium and the United Kingdom. Only 2017 data provided for Belgium and time series incomplete for the United Kingdom (missing 2016, 2018 and 2019). Please note, data availability assessed at time of QSR assessment, based on data call responses. Data have since been made available post-QSR assessment and will be considered in future assessments: https://rconnect.cefas.co.uk/connect/#/apps/26/access |
| Area extracted values (m2) | Data available for many countries. Indicative of area impacted by pressure for each country. | No spatial information so it is unknown where within licensed areas the pressure has occurred. For countries with EEZs that extend beyond the OSPAR Maritime Area, no indication of conventional sea is given. |
| Volume extracted (National statistic) (m3/m2/yr.) | Available for many countries. Facilitated understanding of the annual volume extracted by different extraction activities in different countries. Conventional sea that extraction occurred in was provided. | No spatial information to indicate what licensed areas the volumes extracted were taken from. Number of years provided for each country varied. |
| Extraction volume (licensed area) (m3/m2/yr.) | Facilitated understanding of the volume extracted within a given licensed area. | Without direct footprint data, cannot indicate where within a given licensed area is impacted. Data was also only available for Germany. |
| Extraction duration (mins/year in 50 x 50 m grid) | Provided information on the extent of where pressure occurred within licensed areas to the resolution of 50 m x 50 m grids derived from EMS data. Annual duration values provided a measurement of intensity of pressure. Complete time series for QSR assessment period (2009 to 2020) | No information on the area impacted within the 50 m x 50 m grid due to commercial data sensitivity. Duration not directly representative of the volume extracted, likely dependent on extraction method. Raw duration data cannot be shared publicly, due to commercial sensitivity. Only available for the United Kingdom. |
| Extraction polylines | Provided track lines indicative of extent of aggregate extraction activity derived from AIS pings. Measurements of intensity possible from the data included: duration calculated from start and end times of extraction; length and numbers of polylines with licensed areas; length and numbers of polylines within 50 m x 50 m grid cells. | Extraction polylines not directly representative of the volume extracted, likely dependent on extraction method. Data in raw format and still required substantial sorting. Raw data could not be shared due to commercial sensitivity. Only available for Denmark. Data only available for 2015 to 2020 so not suitable for a full QSR assessment of 2009 to 2020. |
Data Analyses:
Pressure Data Preparation: United Kingdom
Extraction data from the United Kingdom extraction was analysed in R (versions ranging from 3.6.1 – 4.1.2; R core team 2019-2021) using the tidyverse (Wickham et al., 2019) and sf (Pebesma, E., 2018) packages. Aggregate extraction intensity was estimated from calculating the Swept Area Ratio (proportion of a grid cell swept per year, SAR) using Equation 1.
Equation 1: Swept Area Ratio (SAR) calculation for aggregate extraction
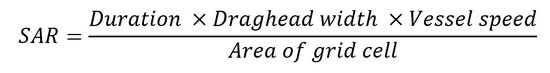
Where:
- Duration is the annual length of time spent undertaking aggregate extraction (hrs/yr.),
- Draghead width is the width of the equipment on the end of the dredge pipe that is in contact with the seabed whilst extracting aggregates (km),
- Vessel speed is the speed at which the vessel is travelling whilst extracting aggregate (km/hr),
- Area of grid cell is the grid or cell area determined by the resolution of the data (km2).
Fixed values, derived from literature relevant to extraction activity in the North-East Atlantic, were used for the parameters of vessel speed (2 kt, converted to 3,704 km/hr) and draghead width (3 m, converted to 0.003 km) (Kenny & Rees, 1994; Boyd et al., 2003; Boyd & Rees, 2003; Vlasblom, 2005; BMAPA, 2010; Birchenough et al., 2010; Cook & Burton, 2010; Tillin et al., 2011; Last et al., 2011; Drabble, 2012; Newell & Woodcock, 2013; BMAPA, 2017; Robson et al., 2018; Table e). The parameters used when calculating SAR were associated with trailer dredging, which was considered the most prevalent extraction method across the OSPAR Maritime Area. Although other forms of extraction, such as static dredging, were known to occur in the North-East Atlantic, available data from the United Kingdom were not sufficiently detailed to identify specific extraction methods; improved data resolution will be considered in future assessments to improve the accuracy of results.
For commercial aggregate extraction data to be included in the BH3 assessment, data had to be categorised into an intensity scale to protect commercial data sensitivity. As a preliminary approach, SAR values were categorised into an intensity scale ranging from 1 to 5 (Table f), in line with the method used for bottom-contact fishing, to create annual extraction pressure maps for the years 2009 to 2020. The intensity scale used was discussed and agreed with members of the OSPAR Benthic Habitats Expert Group and industry experts as a suitable preliminary approach to assessing extraction pressure. However, future assessments aim to further improve the BH3 method through changes to how pressure is analysed as new evidence becomes available.
Table e: Summary of trailer dredging extraction activity parameters derived from literature
| Maximum draghead / furrow width (m) | Source information |
| 1,4 | Drabble, 2012 (draghead width) |
| 2,4 | Drabble, 2012 (furrow) |
| 2,5 | Boyd et al., 2003 |
| 3 | Kenny & Rees 1994; Boyd & Rees, 2003; Cook & Burton, 2010; Tillin et al., 2011; Last et al., 2011; Newell & Woodcock, 2013; BMAPA, 2017; Robson et al., 2018 |
| 4 | BMAPA, 2010; Birchenough et al., 2010 |
| Vessel speed | Source information |
| 1,5 knots | Tillin et al., 2011; Last et al., 2011; Newell & Woodcock, 2013; BMAPA, 2017 |
| 2 knots | Boyd et al., 2003; Drabble, 2012 |
| 2-3 knots | Vlasblom, 2005 |
Pressure Data Preparation: Denmark areas
The steps taken to prepare AIS data provided by Denmark broadly followed those used by ICES WGEXT (ICES, 2019b). Danish data preparation was carried out in R (versions ranging from 3.6.1 – 4.1.2; R core team 2019-2021) using the following packages: tidyverse (Wickham et al., 2019), sf (Pebesma, E., 2018), and lubridate (Grolemund & Wickham, 2011). The dataset was first filtered to ensure polylines not indicative of extraction activity were removed where practicable:
- Any polylines that did not intersect with a licensed area were excluded.
- Polylines with start and / or end speeds greater than three knots were removed (not indicative of extraction activity). Polylines with zero knot speeds were retained as these can be indicative of static extraction activity which is present in Danish waters.
- Extraction duration was calculated for each polyline based on the start and end times provided. As recommended via consultation with data providers and experts in Denmark, all lines with a duration of more than one hour were removed to mitigate erroneous lines caused by intermittent AIS data recording.
To enable standardisation of extraction data on a 50 m x 50 m grid (with the aforementioned spatial parameters), the following approach was used to convert AIS polyline data into pressure categories (Table f):
- Line features were spatially intersected with the 50 m x 50 m grid;
- The total length of annual line features within a grid cell were calculated to give a total annual distance of dredge activity within a grid cell;
- The total annual distance of dredge activity within a grid cell was multiplied by draghead width (3 m) to give Swept Area;
- Swept Area Ratio was then calculated by dividing Swept Area by cell area;
- Pressure categories were assigned to the corresponding Swept Area Ratio ranges (Table f). As with data from the United Kingdom, categorisation of SAR values protected commercial data sensitivities.
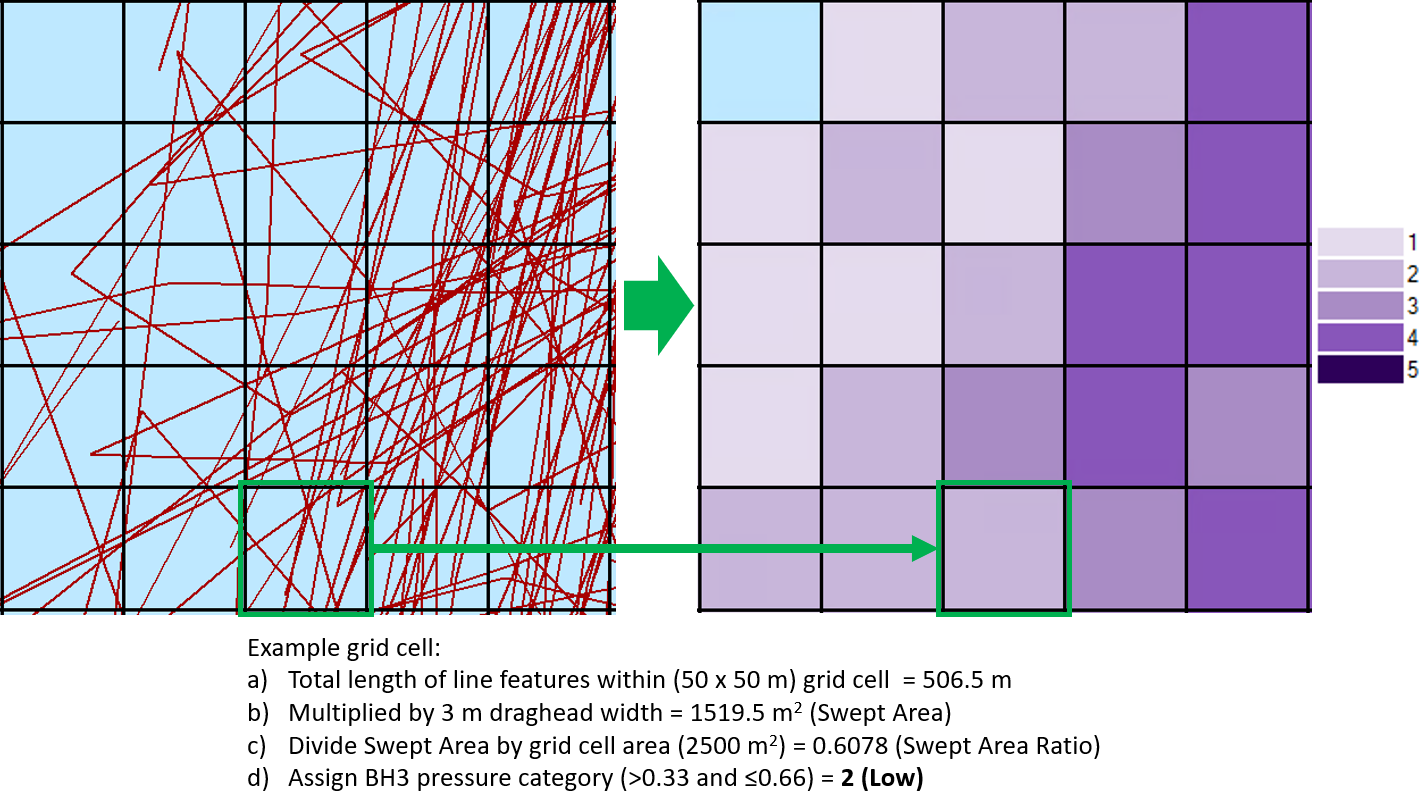
Figure a: Example of processing AIS line features to calculate Swept Area Ratio and BH3 pressure category
The method used to process Danish AIS data differed from that used for data supplied by the United Kingdom (duration dredging); vessel track data enabled greater resolution of coverage within a given grid cell than duration alone. Additionally, the high prevalence of static dredging activity in Danish waters could lead to overestimation of the area of seabed impacted if SAR calculations were proportional to dredging time. The approach used aimed to best represent the swept area of the seabed, independent of dredge time and vessel speed. This approach may have underrepresented additional impacts from static extraction activity which were potentially better represented by the total time dredging, such as smothering. However, for this assessment of physical disturbance only the proportion of seabed impacted by the draghead was considered relevant.
Aggregated Extraction Pressure Maps to Represent Pressure Across Multiple Years
An aggregated extraction pressure map representative of the assessment periods 2009 to 2020 (QSR assessment period) and 2016 to 2020 (MSFD assessment period) was created based on the BH3 methodology. Due to the temporal range of the two respective datasets (United Kingdom: 2009 to 2020, and Denmark: 2015 to 2020), data from the United Kingdom alone was used to calculate the QSR aggregated pressure values. Data from both the United Kingdom and Denmark were used to calculate the MSFD aggregated pressure values.
To assess extraction pressure from the United Kingdom and Denmark across multiple years, the range of pressure categories observed across the time series was calculated for each grid cell. Cells were considered ‘Variable’ if a range of three or more categories was observed throughout the time series and ‘Non-variable’ if pressure categories had a range of less than three. To represent an aggregated pressure value for the time series, cells with ‘Non-variable’ pressure used the mean SAR value across all years to assign a BH3 pressure category (Table f). Cells with ‘Variable’ pressure used the maximum SAR value from all years to assign a BH3 pressure category. However, in contrast to the assessment of fishing pressure, grid cells with no aggregate extraction present in a given year, where extraction activity was present in other years, were treated as 0 pressure. This specific distinction of 0 pressure was made as commercial aggregate extraction is a licensed activity and, where a Contracting Party submitted data, there was high confidence that the data accounted for all commercial aggregate extraction activity within the Contracting Party’s EEZ. Upon categorising final SAR values representative of pressure across multiple years, all data indicative of duration extracting, and uncategorised SAR were removed prior to further analyses to safeguard commercially sensitive information.
| Pressure category | Pressure score | Swept Area Ratio range |
|---|---|---|
| None | 0 | 0,00 |
| Very Low | 1 | >0,00 – ≤0,33 |
| Low | 2 | >0,33 - ≤0,66 |
| Medium | 3 | >0,66- ≤1,00 |
| High | 4 | >1,00- ≤3,00 |
| Very High | 5 | > 3,00 |
Extraction Pressure Map Caveats:
Assessments using a gridded approach assumed a homogenous distribution of extraction pressure across an individual grid cell. Therefore, the true spatial distribution of pressure within a grid cell may be overestimated in instances where extraction activity was confined to discrete portions of a grid cell. However, in contrast to BH3 assessments of fishing pressure at c-square resolution (0,05 x 0,05 decimal degrees), assessments of aggregate extraction were undertaken using a much finer-scale grid resolution (50 m x 50 m grids), improving the spatial accuracy of pressure mapping and, therefore, disturbance calculations.
Assessment of Licensed Areas
Spatial licensed area polygons were analysed in Arc Map v10.1 and QGIS v 3.16 Hannover. The data provided by ICES WGEXT contained a comprehensive dataset of licensed extraction areas within the OSPAR Maritime Area. However, these data were supplemented with additional polygons not included by ICES, obtained directly under the OSPAR data call from German experts (outlining two known active sand and gravel extraction sites) and the Fællesområder and Auktionstilladelser layers obtained from the Ministry of Environment for Denmark (MST). Data received directly from France and data available on the European Marine Observation Data Network (EMODnet) were covered by licensed areas in the ICES dataset. Data available on the Niedersächsischen Bodeninformationssystems (NIBIS) data portal and the Efterforskningsområder layer from MST contained licensed areas for other extraction methods (e.g., terrestrial) or outlined exploration sites for aggregate extraction so were not deemed appropriate for the BH3 assessment.
Data from ICES, Germany, and MST were combined into a single GIS layer and intersected with OSPAR assessment unit polygons, which excluded any licensed areas that occurred outside the OSPAR Maritime Area (e.g., those for Finland and Sweden). Additionally, licensed areas that occurred in assessment units where BH3 is not agreed as a Common Indicator were removed (Icelandic licensed areas in Region I and Portuguese areas in Region V). Furthermore, two large, licensed areas for shell extraction (covering over 17 000 km2), off the coast of The Netherlands in the Southern North Sea, were identified when processing the spatial data. Consultation with Dutch experts, via OSPAR, indicated that these areas outlined the zone between 5 and 50 km from the coast where shell extraction was permitted. In practice, shell extraction activity was confirmed to be negligible, only restricted to small scale local sites where shell layers were present at or near the surface of the seafloor (Noordzeeloket, 2022). These areas licensed for shell extraction were, therefore, not considered representative of the activity and these two aforementioned areas were removed from the assessment to facilitate a more accurate assessment of typical commercial aggregate extraction licensed areas in the OSPAR Maritime Area.
Step 4: Calculation of disturbance
Step 4 of the QSR 2023 BH3 assessment involved creating a spatial layer that quantified disturbance to species and habitats within the OSPAR Maritime Area. Sensitivity (outputs of Step 2) and pressure (outputs of Step 3) layers were spatially intersected via ESRI ArcGIS software v10.1 (ESRI, 2012). Extraction disturbance was calculated on the intersected output layer by combining sensitivity and pressure values via a matrix (Table g), producing nine categories of disturbance (1–9, where 9 was the maximum). The matrix was created from previous studies that analysed the impacts of bottom-contact pressures on sensitive species and habitats when applied at different intensities (Schroeder et al., 2008; Rondinini, 2010; BioConsult, 2013; van Loon et al, 2018). In instances where pressure data intersected areas without sensitivity information (due to a lack of EUNIS habitat data and / or sensitivity assessment), outputs were classified as ‘Unassessed Disturbance’.
Table g: Disturbance matrix combining pressure and habitat sensitivity
| Disturbance Matrix | Sensitivity | |||||
|---|---|---|---|---|---|---|
| 1 | 2 | 3 | 4 | 5 | ||
| Pressure | ||||||
| 1 | 1 | 2 | 3 | 4 | 6 | |
| 2 | 1 | 2 | 4 | 6 | 7 | |
| 3 | 1 | 3 | 5 | 7 | 9 | |
| 4 | 1 | 4 | 6 | 8 | 9 | |
| 5 | 2 | 4 | 7 | 9 | 9 | |
Annual and aggregated (2009 to 2020; 2016 to 2020 assessment periods) extraction disturbance values were calculated from the corresponding annual and aggregated pressure categories. Disturbance categories were summarised into three groups (‘Low’ = disturbance categories 1 to 4, ‘Moderate’ = disturbance categories 5 to 7, and ‘High’ = disturbance categories 8 and 9) derived from the 1 to 9 disturbance scale (Table h; Schroeder et al., 2008; OSPAR, 2017). It should be noted that these groupings are not representative of thresholds and should be used for comparative interpretations of disturbance outputs across the OSPAR Maritime Area only. Disturbance category 0 and therefore disturbance group ‘Zero’ were not included in the BH3 extraction assessment as only extraction pressure data from Denmark and the United Kingdom were available for full disturbance analyses at the time of assessment. As extraction data from other Contracting Parties was not available for disturbance analyses at the time of assessment, pressure values of 0, and therefore 0 disturbance, could not be assigned to all areas of an assessment unit with no extraction footprint data.
Table h: Disturbance matrix with summary groups; ‘Low’ (1-4), ‘Moderate’ (5-7), and ‘High’ (8-9)
| Disturbance Matrix | Sensitivity | |||||
|---|---|---|---|---|---|---|
| 1 | 2 | 3 | 4 | 5 | ||
| Pressure | ||||||
| 1 | 1 | 2 | 3 | 4 | 6 | |
| 2 | 1 | 2 | 4 | 6 | 7 | |
| 3 | 1 | 3 | 5 | 7 | 9 | |
| 4 | 1 | 4 | 6 | 8 | 9 | |
| 5 | 2 | 4 | 7 | 9 | 9 | |
Step 5: EUNIS to MSFD Benthic Broad Habitat Type (MSFD BHT) Translation
Step 5 assigned disturbance outputs based on EUNIS habitat classification 2007 to the appropriate Broad Habitat Type (BHT) in the MSFD classification system to maximise usability of assessment results for Contracting Parties that report against Article 8 of the MSFD. See the QSR 2023 BH3 assessment of fishing pressure for full details on data sources and methodology used for the translations.
Step 6: Assessment of OSPAR Threatened and / or Declining Habitats
Disturbance from aggregate extraction in OSPAR Threatened and / or Declining Habitats (OSPAR, 2008 & 2019) was assessed using the OSPAR Habitats in the North-East Atlantic Ocean - 2020 Polygons layer (EMODnet, 2020). The layer is a compilation of OSPAR Threatened and / or Declining Habitats data submitted by OSPAR Contracting Parties and is a separate data product to the composite habitat map. Sensitivity of habitats were assigned using EUNIS codes associated with the habitat definition and the corresponding MarESA sensitivity assessments to these EUNIS codes. In instances where habitats had multiple EUNIS codes associated with their definition; the maximum sensitivity was assigned following a precautionary approach. See the QSR 2023 BH3 fisheries assessment for full details on how sensitivity assessments are assigned to habitat polygons.
For habitats without MarESA assessments (e.g., carbonate mounds, coral gardens, and seamounts) sensitivity was assigned following Tillin & Tyler-Walters (2010). For habitats that were present in Common Indicator Assessment Units, EUNIS codes associated with the habitat definition and assessed sensitivity are summarised in Table i. Disturbance in OSPAR Threatened and / or Declining Habitats was calculated using the aggregated extraction pressure layers, developed in Step 3 (assessment period 2009 to 2020). Results were summarised grouping disturbance values as ‘Low’ (disturbance categories 1 to 4), ‘Moderate’ (disturbance categories 5 to 7), and ‘High’ (disturbance categories 8 to 9), following the same approach as for non-OSPAR Threatened and / or Declining Habitats.
| Habitat | EUNIS | Extraction Sensitivity |
|---|---|---|
| Carbonate mounds | A6.75 | 5 |
| Coral gardens | A6.1, A6.2, A6.3, A6.5, A6.7, A6.8, A6.9 | 5 |
| Deep‐sea sponge aggregations | A6.62 | 5 |
| Intertidal mudflats | A2.3 | 5 |
| Intertidal Mytilus edulis beds on mixed and sandy sediments | A2.7211, A2.7212 | 4 |
| Littoral chalk communities | A1.126, A1.441, A1.2143 | 5 |
| Lophelia pertusa reefs | A5.631, A6.611 | 5 |
| Maerl beds | A5.51 | 5 |
| Modiolus modiolus horse mussel beds | A5.621, A5.622, A5.623, A5.624 | 5 |
| Ostrea edulis beds | A5.435 | 5 |
| Sabellaria spinulosa reefs | A4.22, A5.611 | 4 |
| Seamounts | A6.72 | 5 |
| Sea-pen and burrowing megafauna communities | A5.361, A5.362 | 4 |
| Zostera beds | A5.533, A5.545 | 5 |
Step 7: Confidence assessments
To spatially represent confidence in the data, a numeric method of calculating confidence was adapted from an internal OSPAR method previously developed by the Environmental Impacts of Human Activities Committee (EIHA). A high confidence score was given a numeric value of 1, medium 0,66 and low 0,33. The different methods used to create the sensitivity layer were taken in turn and a numeric confidence score was assigned to each of the components. The method then averaged confidence scores from each of the following four components to obtain a final confidence score between 0 and 1:
- Step 1: Confidence in the habitat data (MESH and survey or modelled data)
- Step 2: Confidence in the representativity of the habitat data (Three Step method)
- Step 3: Confidence in the habitat sensitivity assessments to a given pressure (MarESA Quality of Evidence or MB0102)
- Step 4: Confidence from in-situ species data
See BH3 CEMP Guidelines for full overview of confidence assessment calculation.
Results
The distribution and intensity of commercial aggregate extraction pressure were assessed to calculate levels of disturbance within licenced polygons across the OSPAR Maritime Area. Unless specified, statements are true for both QSR and MSFD assessment periods. Disturbance was calculated where extraction intensity data were available from the United Kingdom and Denmark within assessment units where BH3 is an agreed OSPAR Common Indicator: Regions II and III.
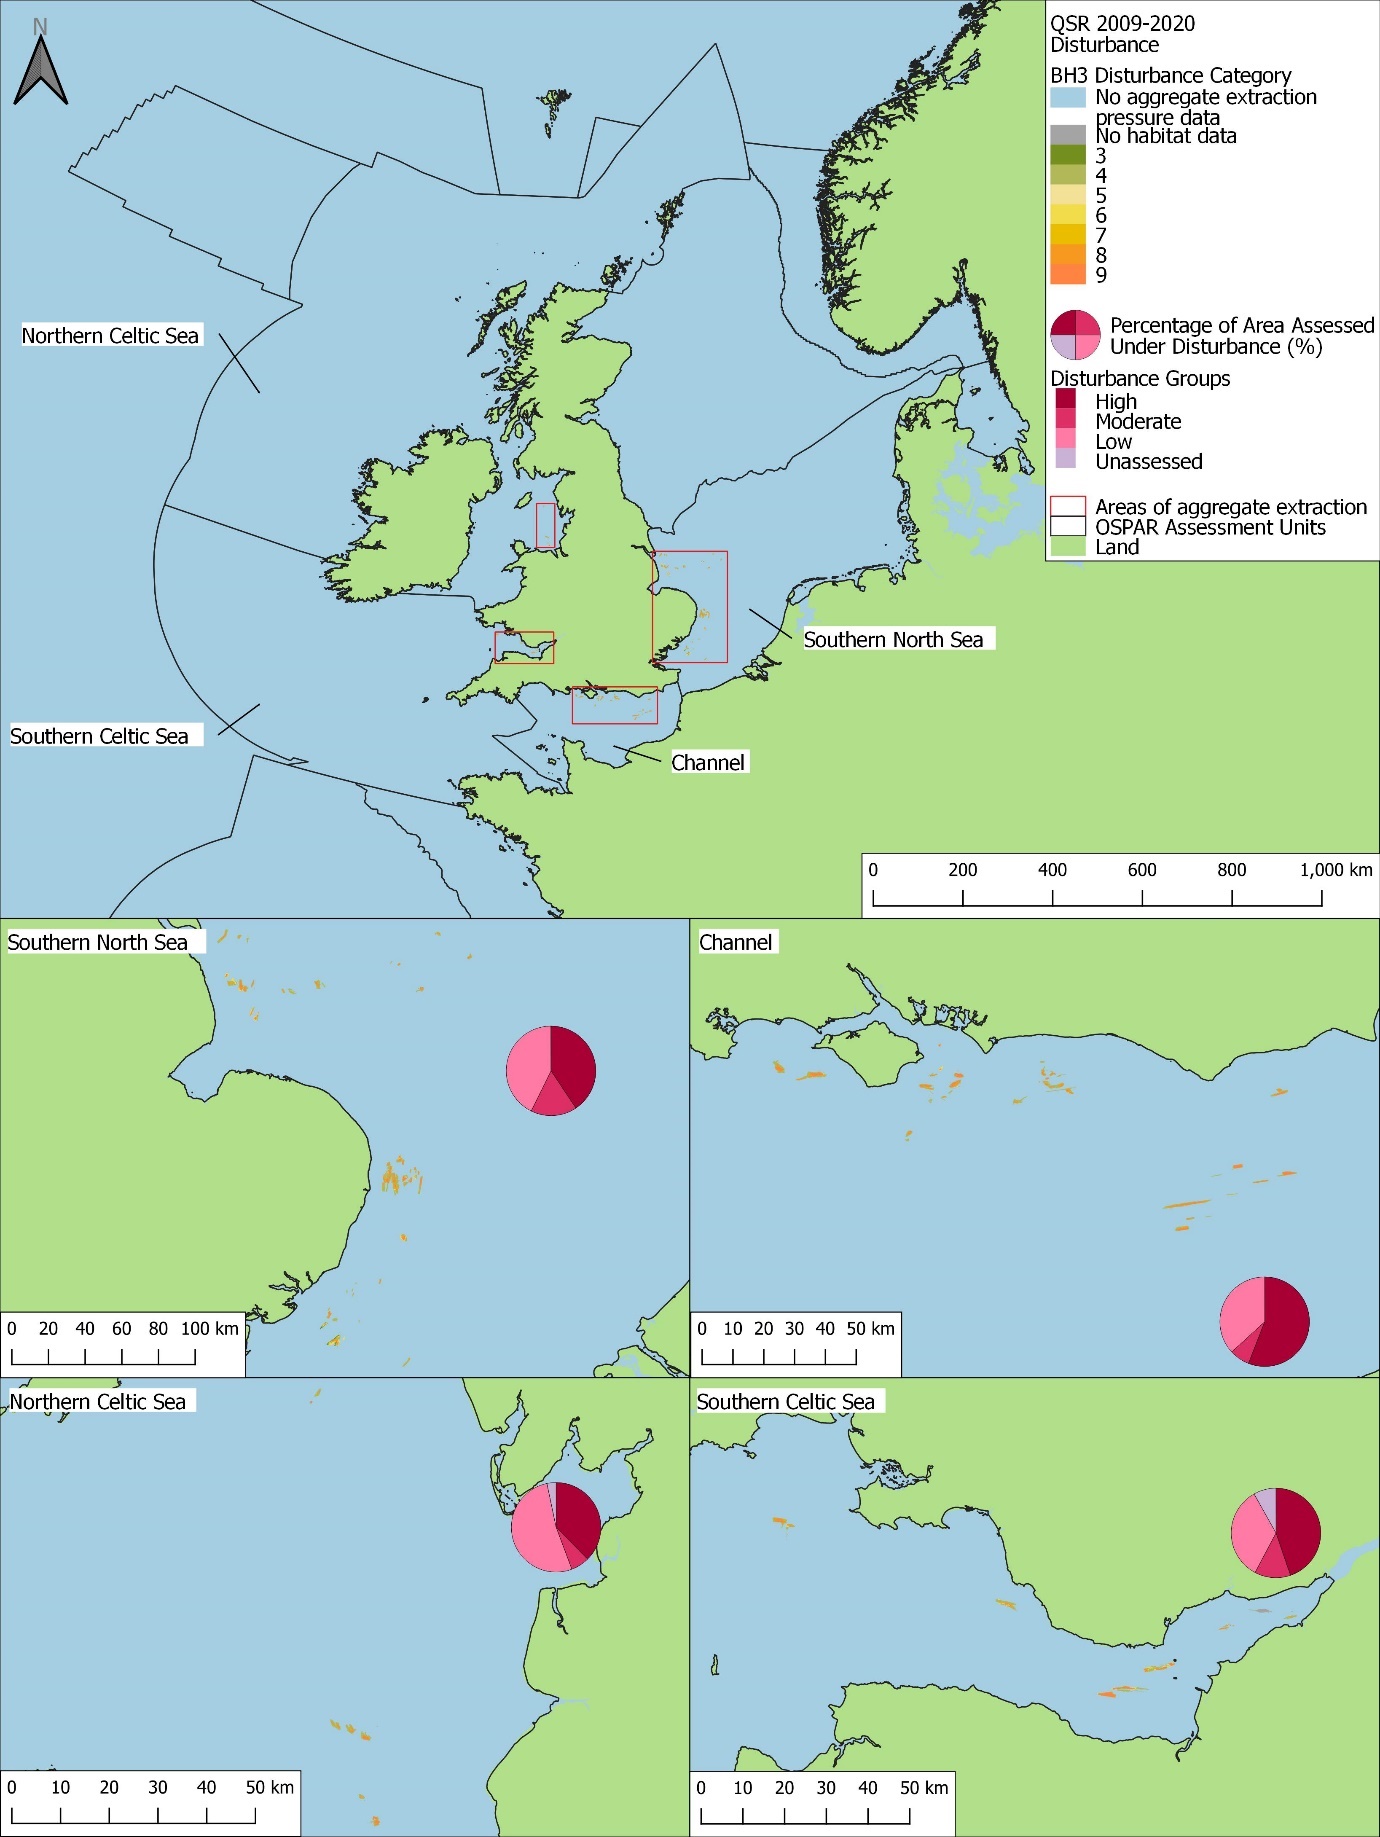
Figure 3: Spatial distribution of extraction disturbance in the 2009 to 2020 assessment period. Pie charts show the percentage of the extraction footprint area under each disturbance group: ‘High’ (categories 8-9), ‘Moderate’ (categories 5-7), ‘Low’ (categories 1-4), and Unassessed (area where extraction pressure was present, but disturbance could not be assessed due to i) no habitat data, or ii) no sensitivity assessments for underlying habitat)
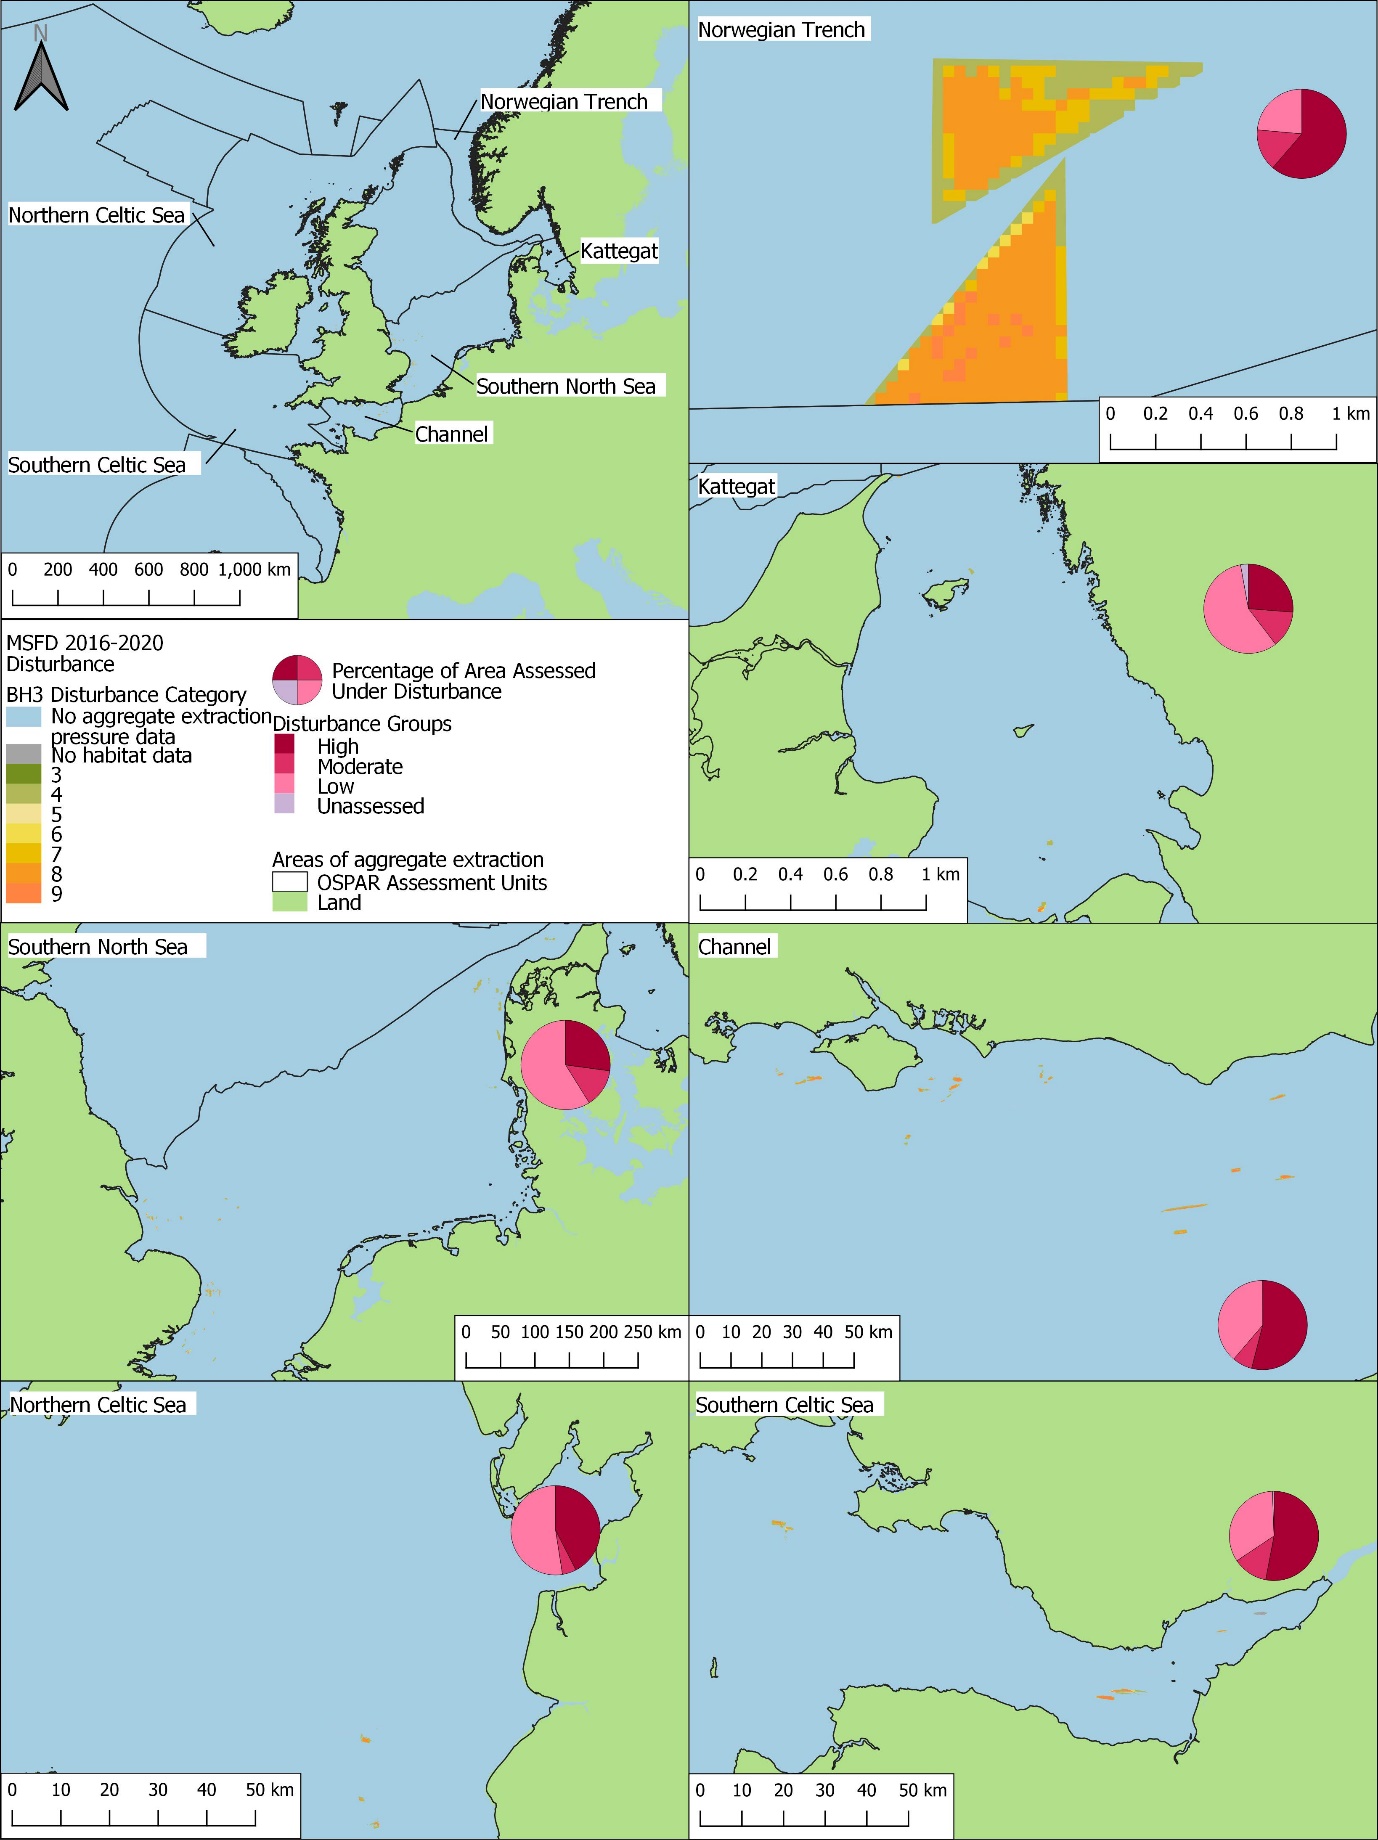
Figure 4: Spatial distribution of extraction disturbance in the 2016 to 2020 assessment period. Pie charts show the percentage of the extraction footprint area under each disturbance group: ‘High’ (categories 8-9), ‘Moderate’ (categories 5-7), ‘Low’ (categories 1-4), and Unassessed (area where extraction pressure was present, but disturbance could not be assessed due to i) no habitat data, or ii) no sensitivity assessments for underlying habitat)
Total disturbance across all Common Indicator Assessment Units:
- Disturbance occurred in 0,027% (QSR) and 0,022% (MSFD) of the total assessed area.
- In the QSR assessment, 0,012% of area had ‘High’ disturbance, 0,004%, ‘Moderate’; and 0,011%, ‘Low’. In the MSFD assessment, 0,007% had ‘High’ disturbance; 0,003%, ‘Moderate’; and 0,012%, ‘Low’.
- Disturbance could not be assessed in <0,001% (QSR and MSFD) of the total assessed area, due to a lack of habitat and / or sensitivity data.
Percentage of assessment unit area in each disturbance group:
- The Channel had the greatest percentage of area with disturbance in the QSR assessment (0,147%), the Southern North Sea in the MSFD (0,107%).
- The Channel had the greatest percentages of area with ‘High’ disturbance (QSR:0,082%; MSFD:0,045%), and Southern North Sea with ‘Moderate’ disturbance (QSR:0,016%; MSFD:0,015%). ‘Low’ disturbance was greatest in the Channel in the QSR period (0,054%) and the Southern North Sea in the MSFD (0,063%).
- Little annual variation was observed in all assessment units, though was greatest in the Channel (predominantly ‘Low’ - 2009 to 2010, and ‘High’ - 2011 to 2020 disturbance) and the Kattegat (predominantly ‘Low’ disturbance – 2015 to 2016).
Habitat disturbance across all assessment units:
- Disturbance occurred in 13 BHTs in the QSR and 12 in the MSFD, of these 92% and 100% had both ‘High’ and ‘Moderate’ disturbance respectively. A negligible area of ‘Low’ disturbance in Infralittoral mud was only present in the QSR and likely anomalous.
- Total disturbance was greatest in Circalittoral mixed sediment (QSR:0,46%; MSFD:0,375%).
- In the QSR, ‘High’, ‘Moderate’ and ‘Low’ disturbance was greatest in Circalittoral mixed sediment (0,19%, 0,104% and 0,166%). In the MSFD, ‘High’ and ‘Moderate disturbance was greatest in Infralittoral mixed sediment (0,12% and 0,087%), but ‘Low’ disturbance was greatest in Circalittoral mixed sediment (0,189%).
- The BHT with the greatest disturbance within assessment units was Offshore circalittoral rock and biogenic reef in the Southern North Sea for the QSR (>4%) and Infralittoral Sand in the Norwegian Trench for the MSFD (>2%). However, disturbance in rock and biogenic reef BHTs needs to be considered in the context of its constituent habitats (e.g., Sabellaria spinulosa) and their limited extent within each assessment unit.
- Infralittoral coarse sediment, Circalittoral coarse sediment, and Circalittoral sand were the only BHTs to have disturbance in all assessment units in the QSR. No BHT had disturbance in all assessment units analysed in the MSFD.
- No single BHT was consistently under the greatest proportion of disturbance across all assessment units.
Composite Habitat map
See the QSR 2023 BH3 assessment of fishing pressure for full details of the composite habitat map (Figure b to Figure d).
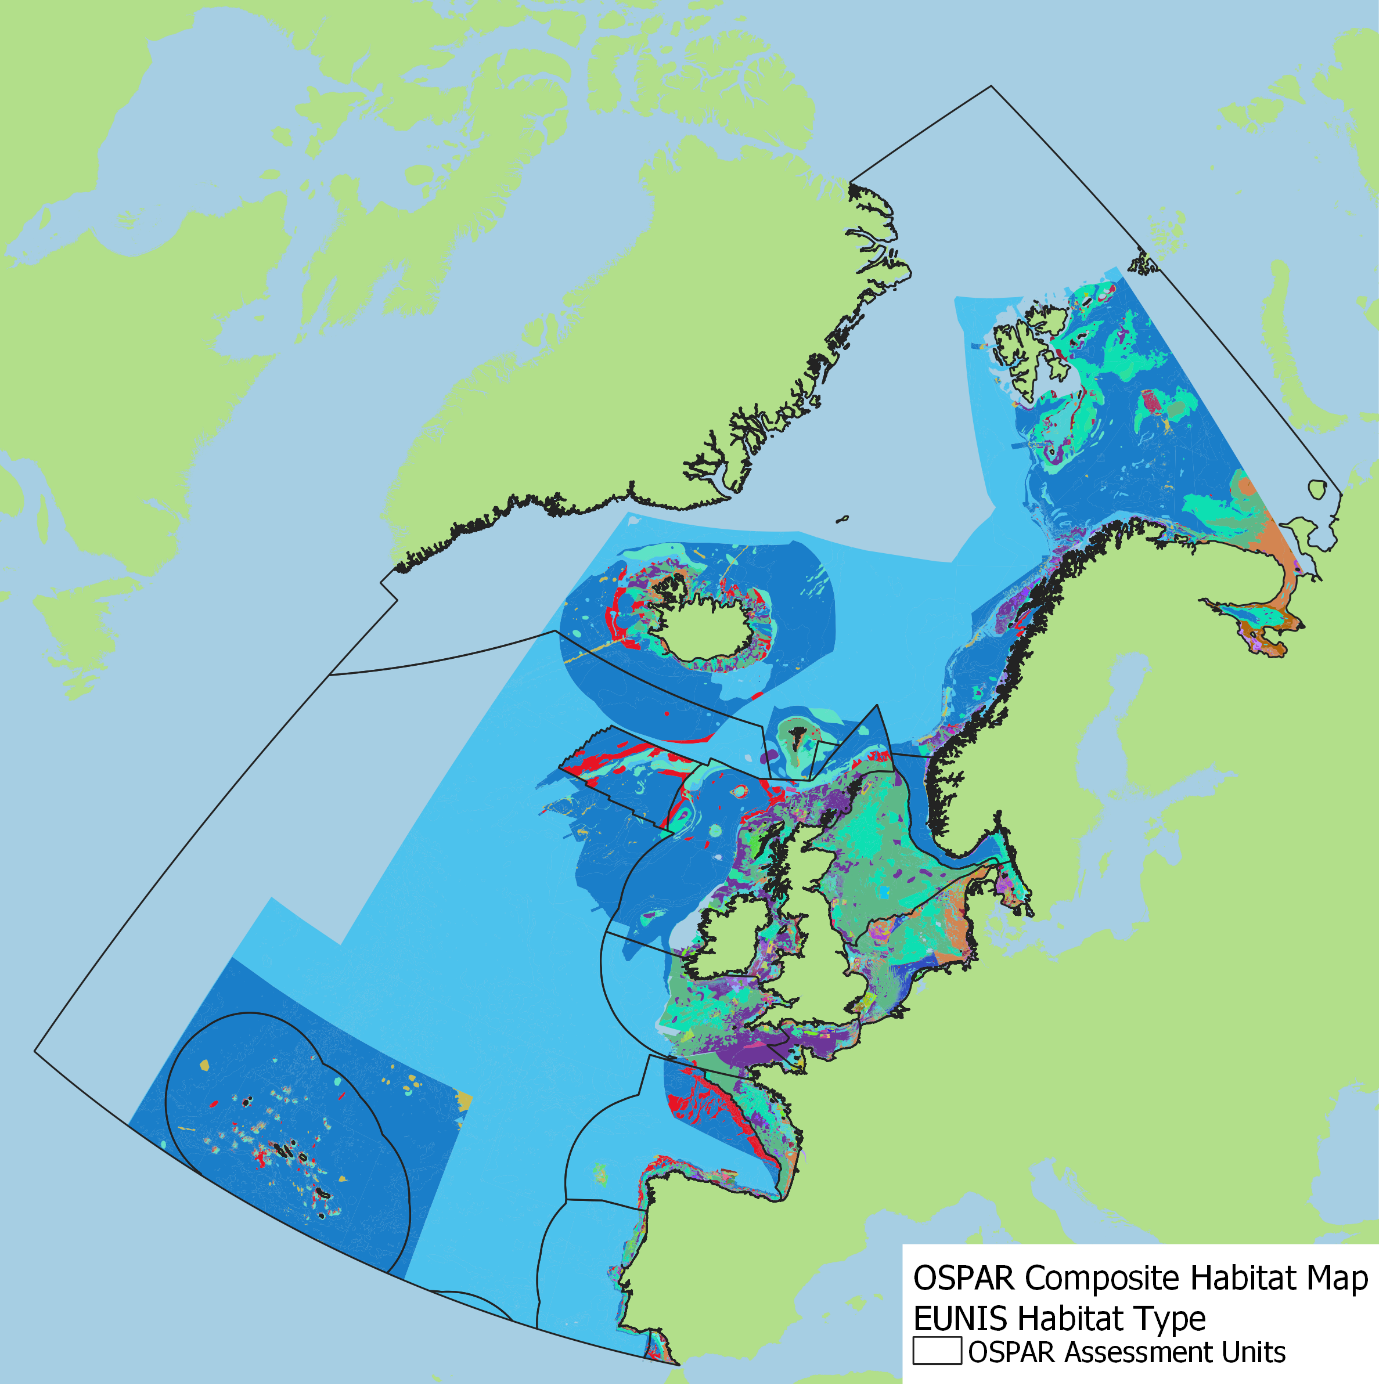
Figure b: OSPAR-scale composite habitat map symbolised at EUNIS Levels 2-6, integrating maps from surveys and broad-scale models
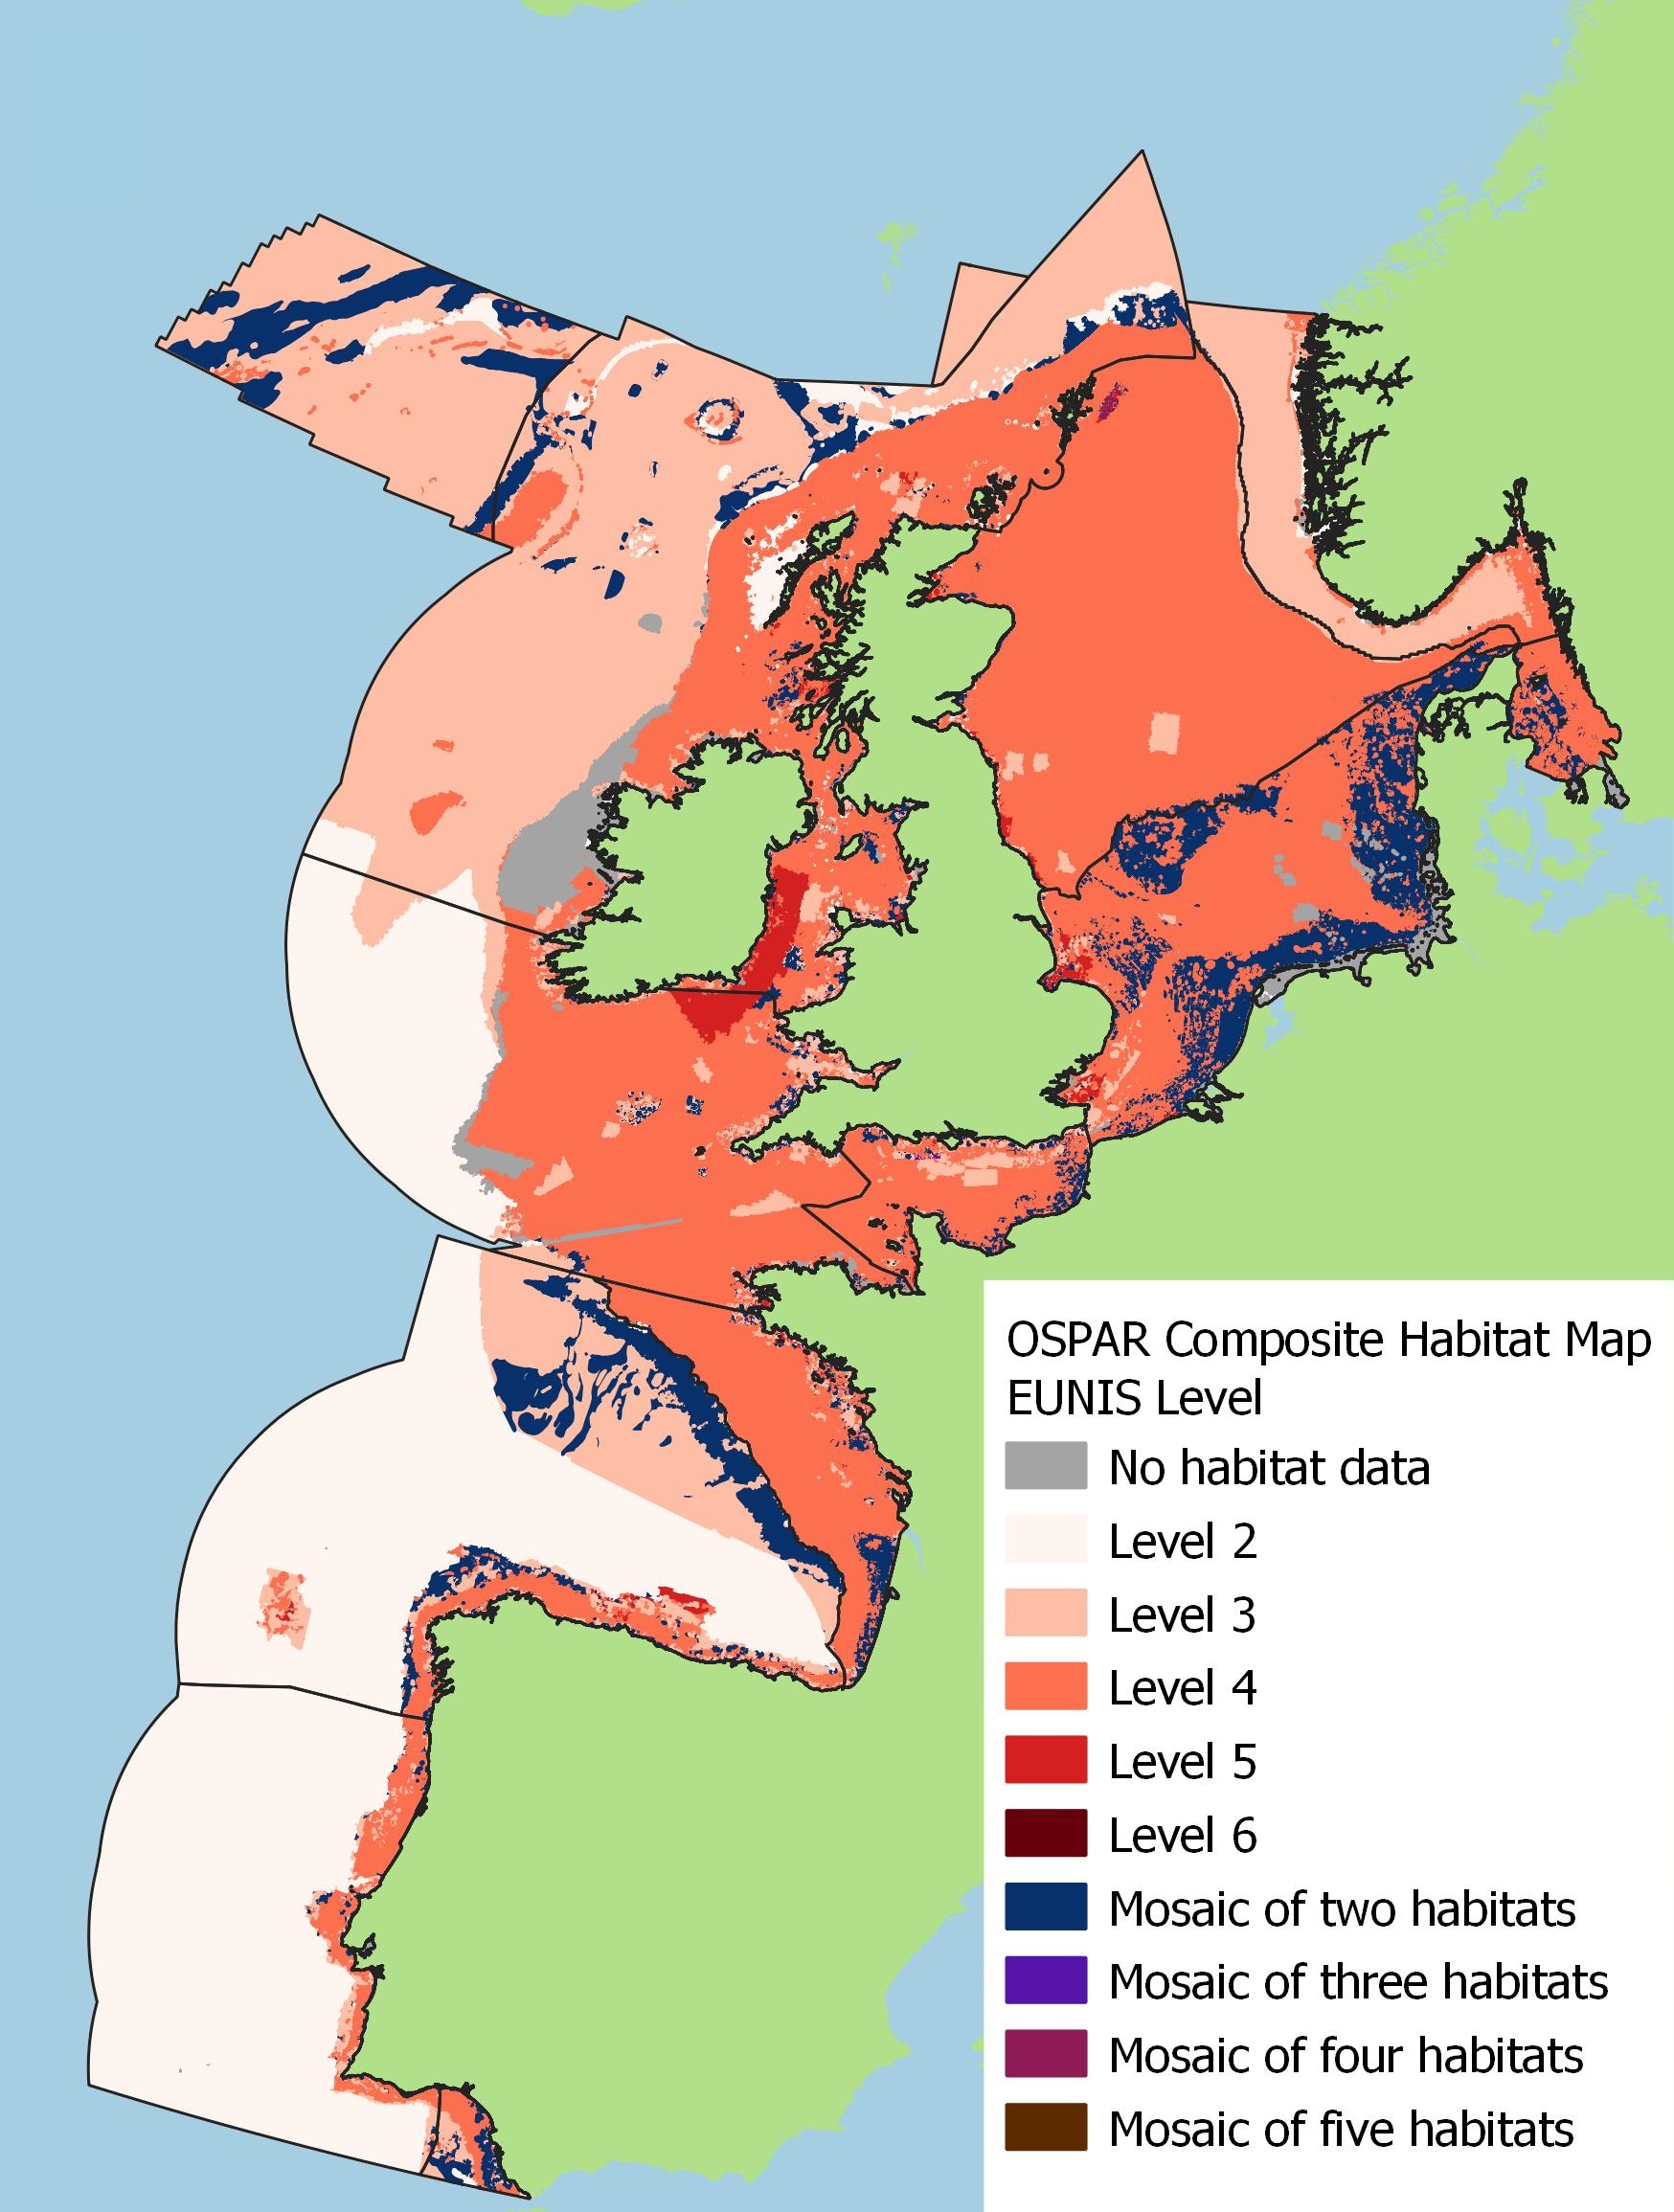
Figure c: OSPAR-scale composite habitat map, mapped at the most detailed EUNIS level for all assessment units considered under BH3. Where multiple EUNIS habitats are present, the number of habitats comprising the mosaic is given
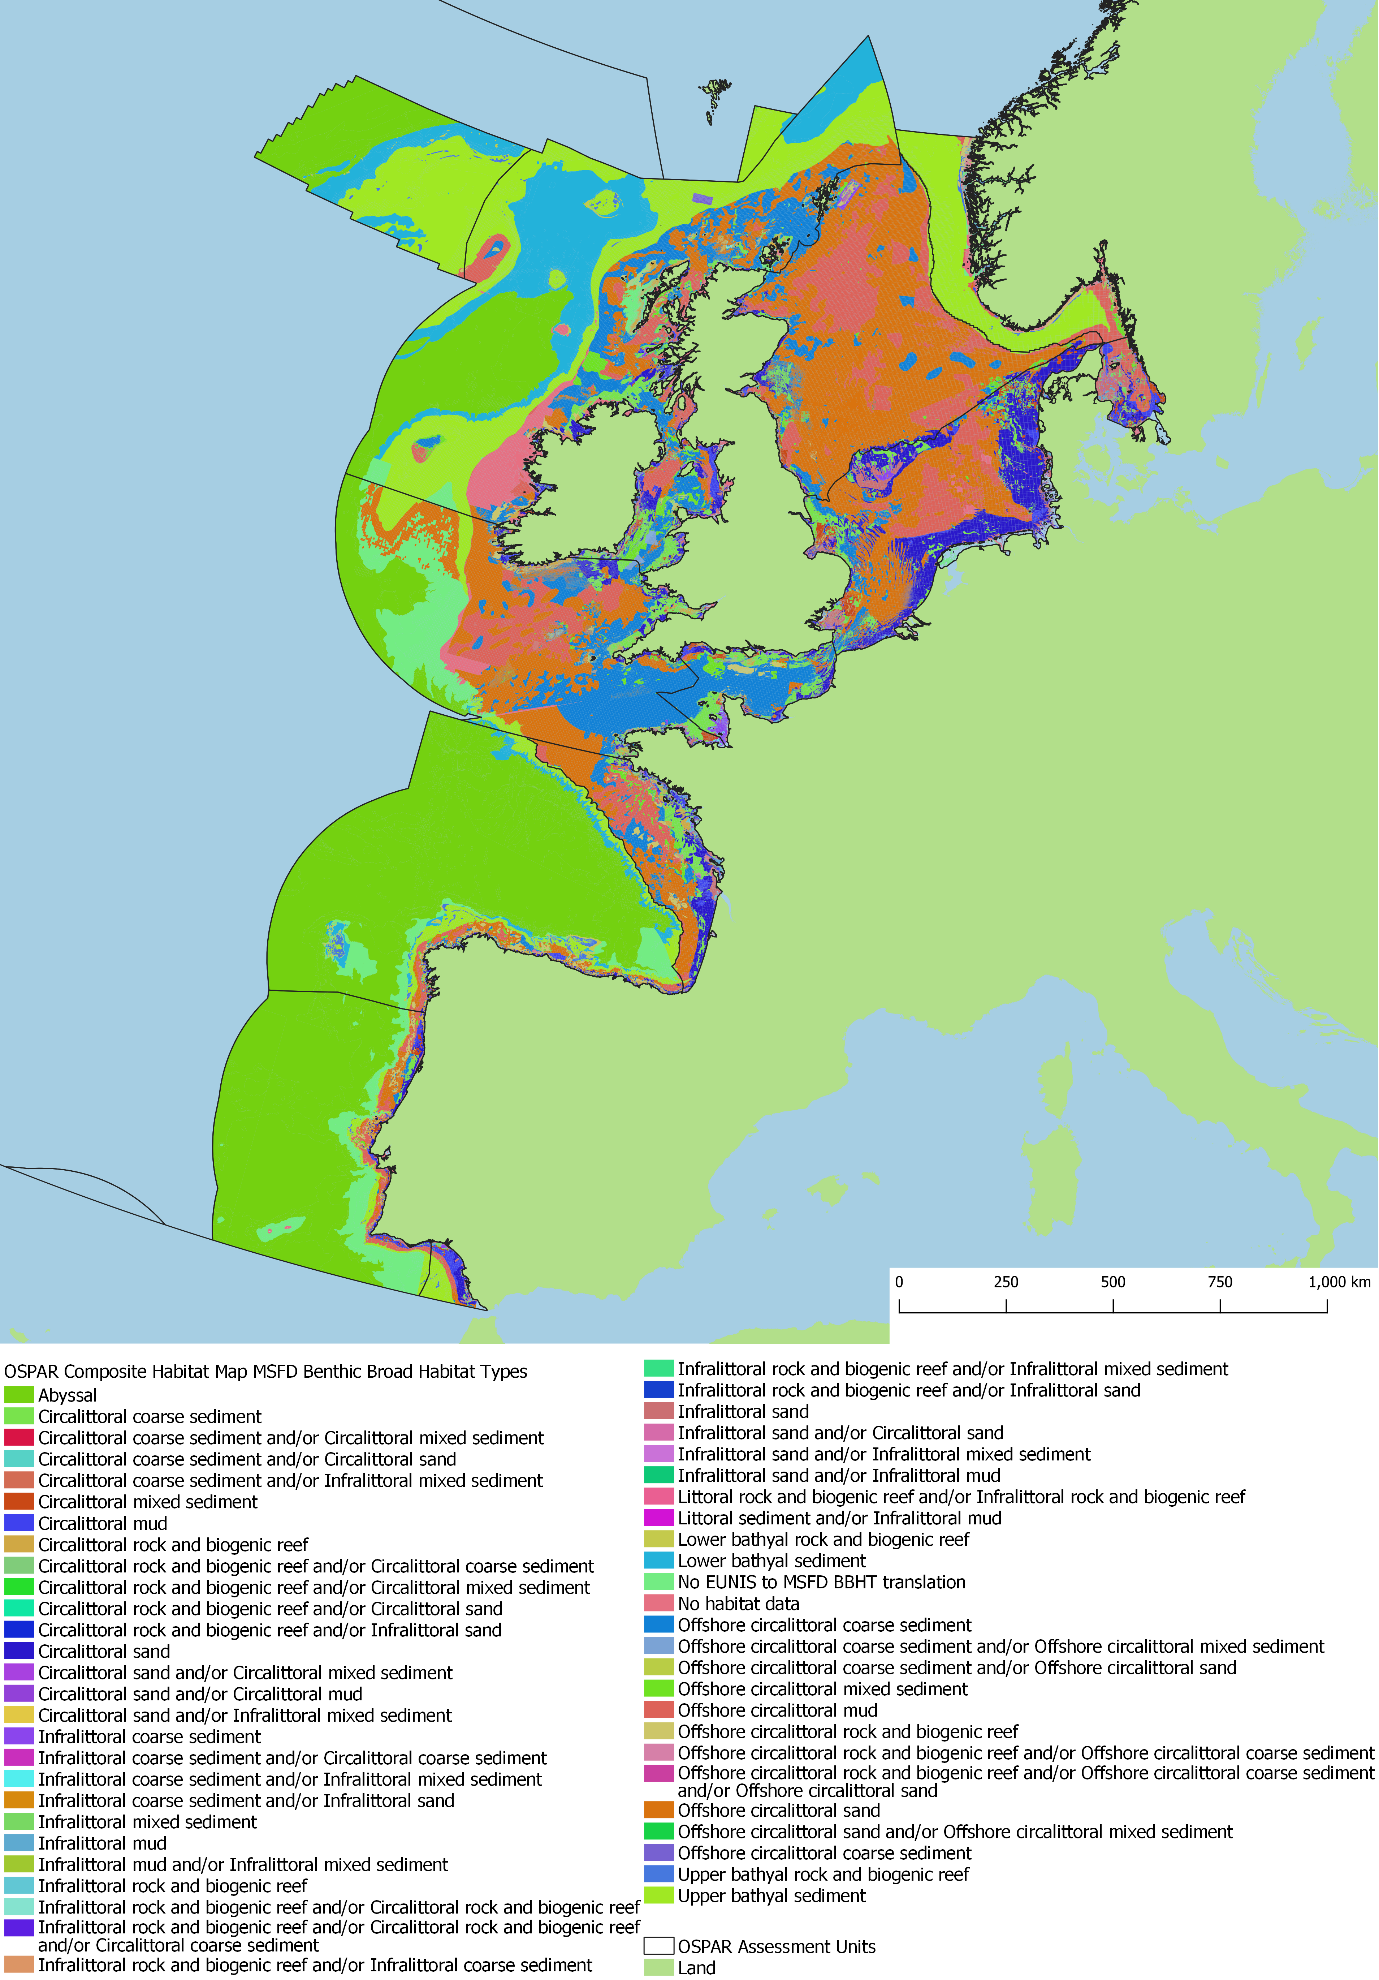
Figure d: OSPAR-scale composite habitat map in the MSFD Benthic Broad Habitat Type classification. Note that this map was created by translating EUNIS habitat codes within the OSPAR Composite Habitat Map to MSFD BBHTs. Translations were conducted on the final disturbance outputs
Sensitivity
Licensed extraction areas:
The Southern North Sea had the largest proportion of area licensed for extraction (greater than 2%; Figure e to Figure m). The Gulf of Biscay and Channel both had similar proportion of area licensed for extraction (1,2%), all other assessment units with licensed extraction had less than 0,2% area licensed. In the Southern North Sea, Kattegat, Southern Celtic Sea, and Gulf of Cadiz a small proportion of the assessment unit (0,002%) did not have sufficient habitat information, within licensed areas, to assign a Broad Habitat Type (BHT) (Figure n). In the Southern Celtic Sea less than 1 km2 of licensed area could only be translated to uncertain BHTs (0,12 km2 Infralittoral coarse sediment and / or Circalittoral coarse sediment and 0,8 km2 Infralittoral sand and / or Circalittoral sand) and therefore was not included in summaries of distinct BHTs (Figure o).
The largest proportion of BHT within licensed extraction areas for each assessment unit was Offshore circalittoral rock and biogenic reef in the Southern North Sea (14,2%; Figure o). The area of Offshore circalittoral rock and biogenic reef in licensed areas was almost entirely in the Southern North Sea, with only 0,01% of the habitat area in the Channel present in licensed areas. However, it should be noted that Offshore circalittoral rock and biogenic reef BHT includes biogenic reefs on sediment habitats, such as ‘A5.61 Sublittoral polychaete worm reefs on sediment’. In the Southern North Sea, Offshore circalittoral rock and biogenic reef included a greater proportion of biogenic reef habitat than other assessment units where this BHT typically included large extents of rock habitat. Circalittoral coarse sediment had the second greatest proportion of BHT area within licensed areas for the Gulf of Biscay (8,2%). Infralittoral sand, Circalittoral mixed sediment, and Circalittoral sand all had greater than 3% of habitat within licensed extraction areas in at least one assessment unit (Figure o).
Overall, the sensitivity of BHTs to extraction pressure predominantly fell under the higher end of the sensitivity scale (Figure o). Most BHTs within licensed extraction areas were assessed as sensitivity category 4 or with the majority of their area as category 4 (Figure o). Infralittoral mixed sediment, Infralittoral mud, Circalittoral rock and biogenic reef, and Offshore circalittoral mud in licensed areas were mostly assessed as sensitivity category 5 to extraction pressure. The only BHTs within licensed areas that included areas with sensitivity assessed as category 3 were Infralittoral sand and Infralittoral rock and biogenic reef. However, a small area of Circalittoral and Offshore circalittoral rock and biogenic reef in licensed areas in the channel (less than 0.01 km2) had unassessed sensitivity.
Sensitivity to extraction pressure in licensed areas was assessed using the best publicly available habitat maps and habitat / species specific sensitivity evidence at the time of the assessment. Due to limitations associated with access to commercially sensitive habitat maps and species records from industry data, location-specific sensitivity evidence could not be incorporated in the current OSPAR Maritime Area scale assessment. Future assessments for commercially licensed activities could be improved through better access to industry data to ensure that calculations of sensitivity are directly representative of the assessed locations.
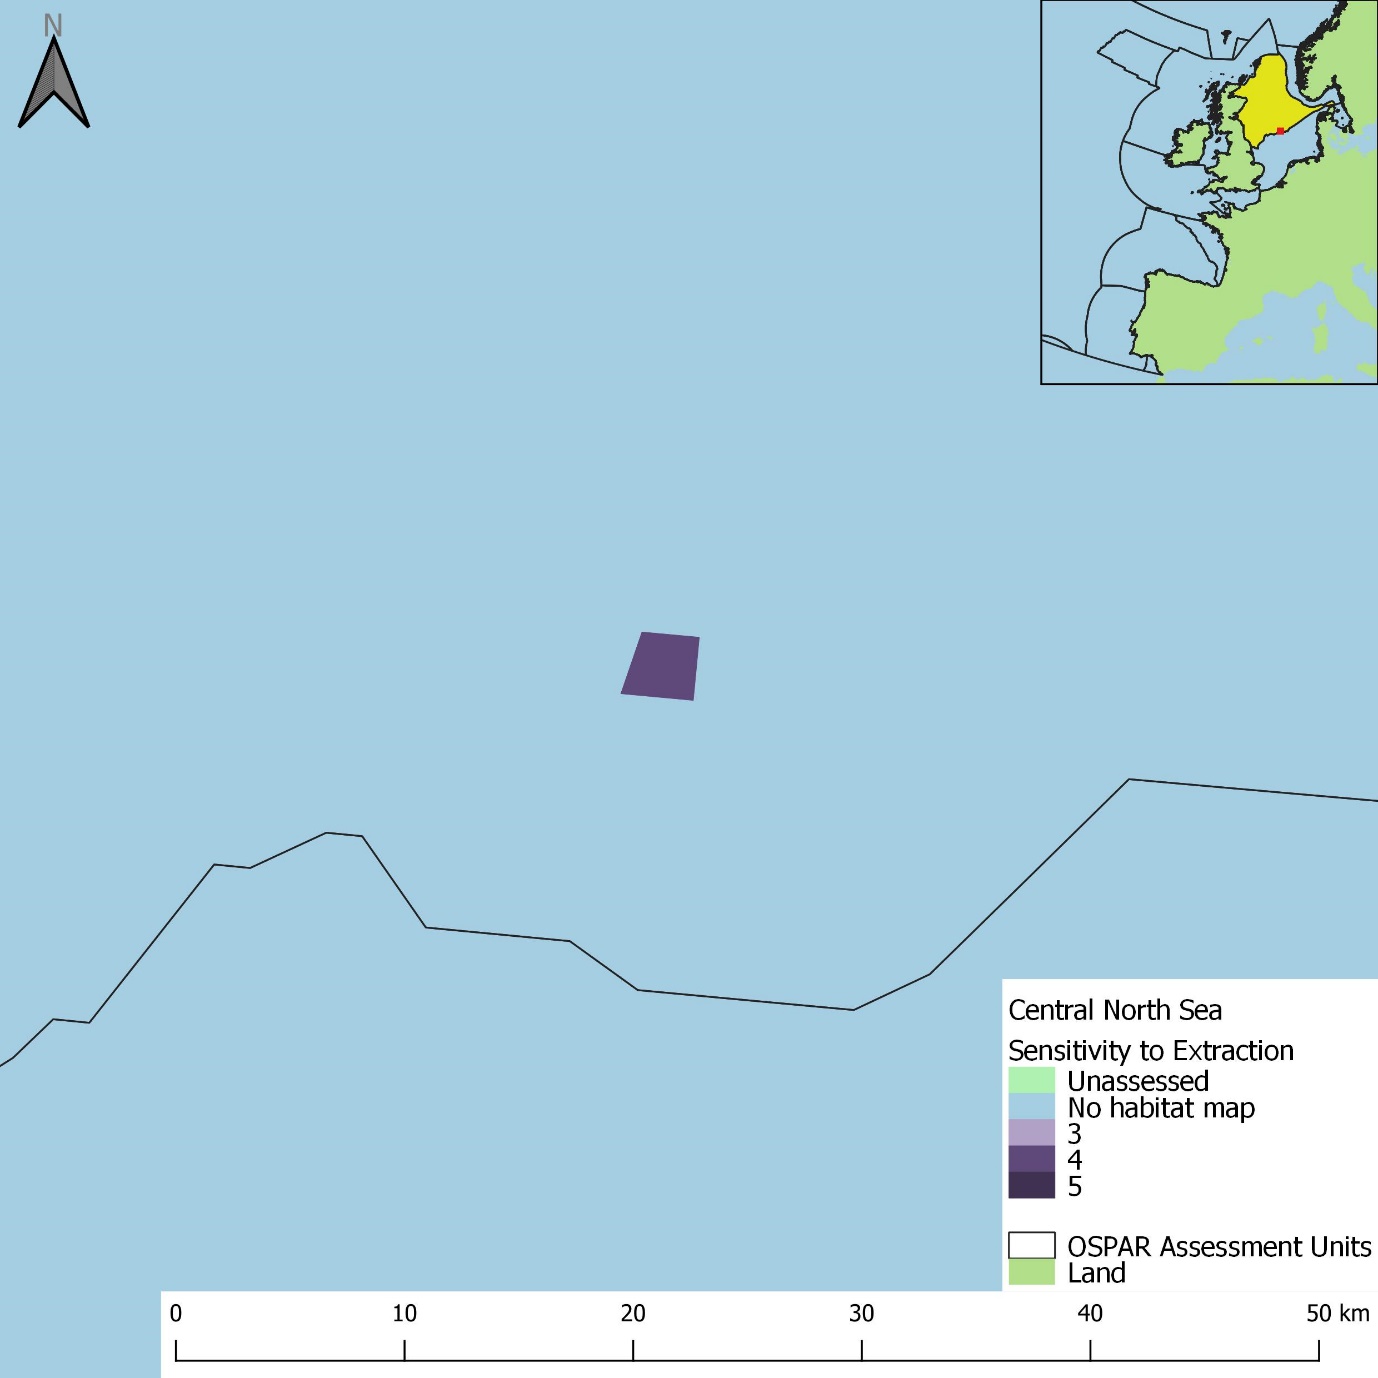
Figure e: Sensitivity map of areas licensed for extraction in the Central North Sea
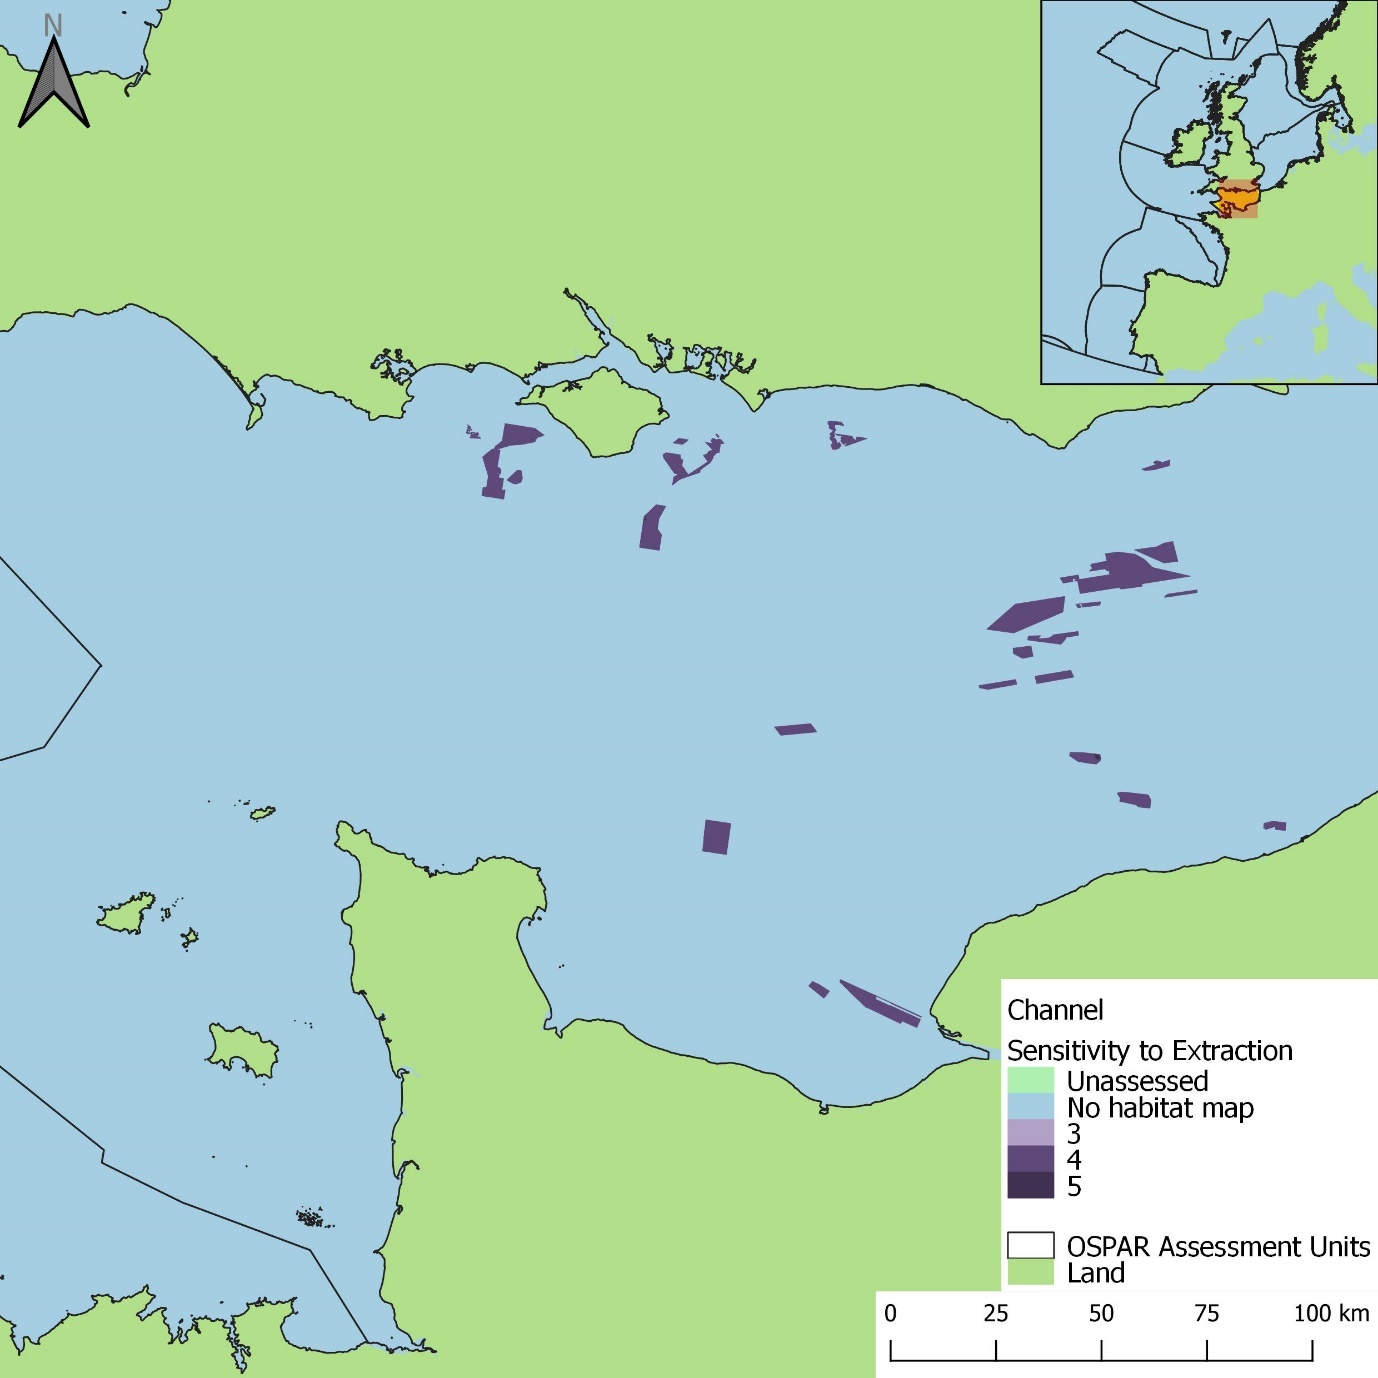
Figure g: Sensitivity map of areas licensed for extraction in the Channel
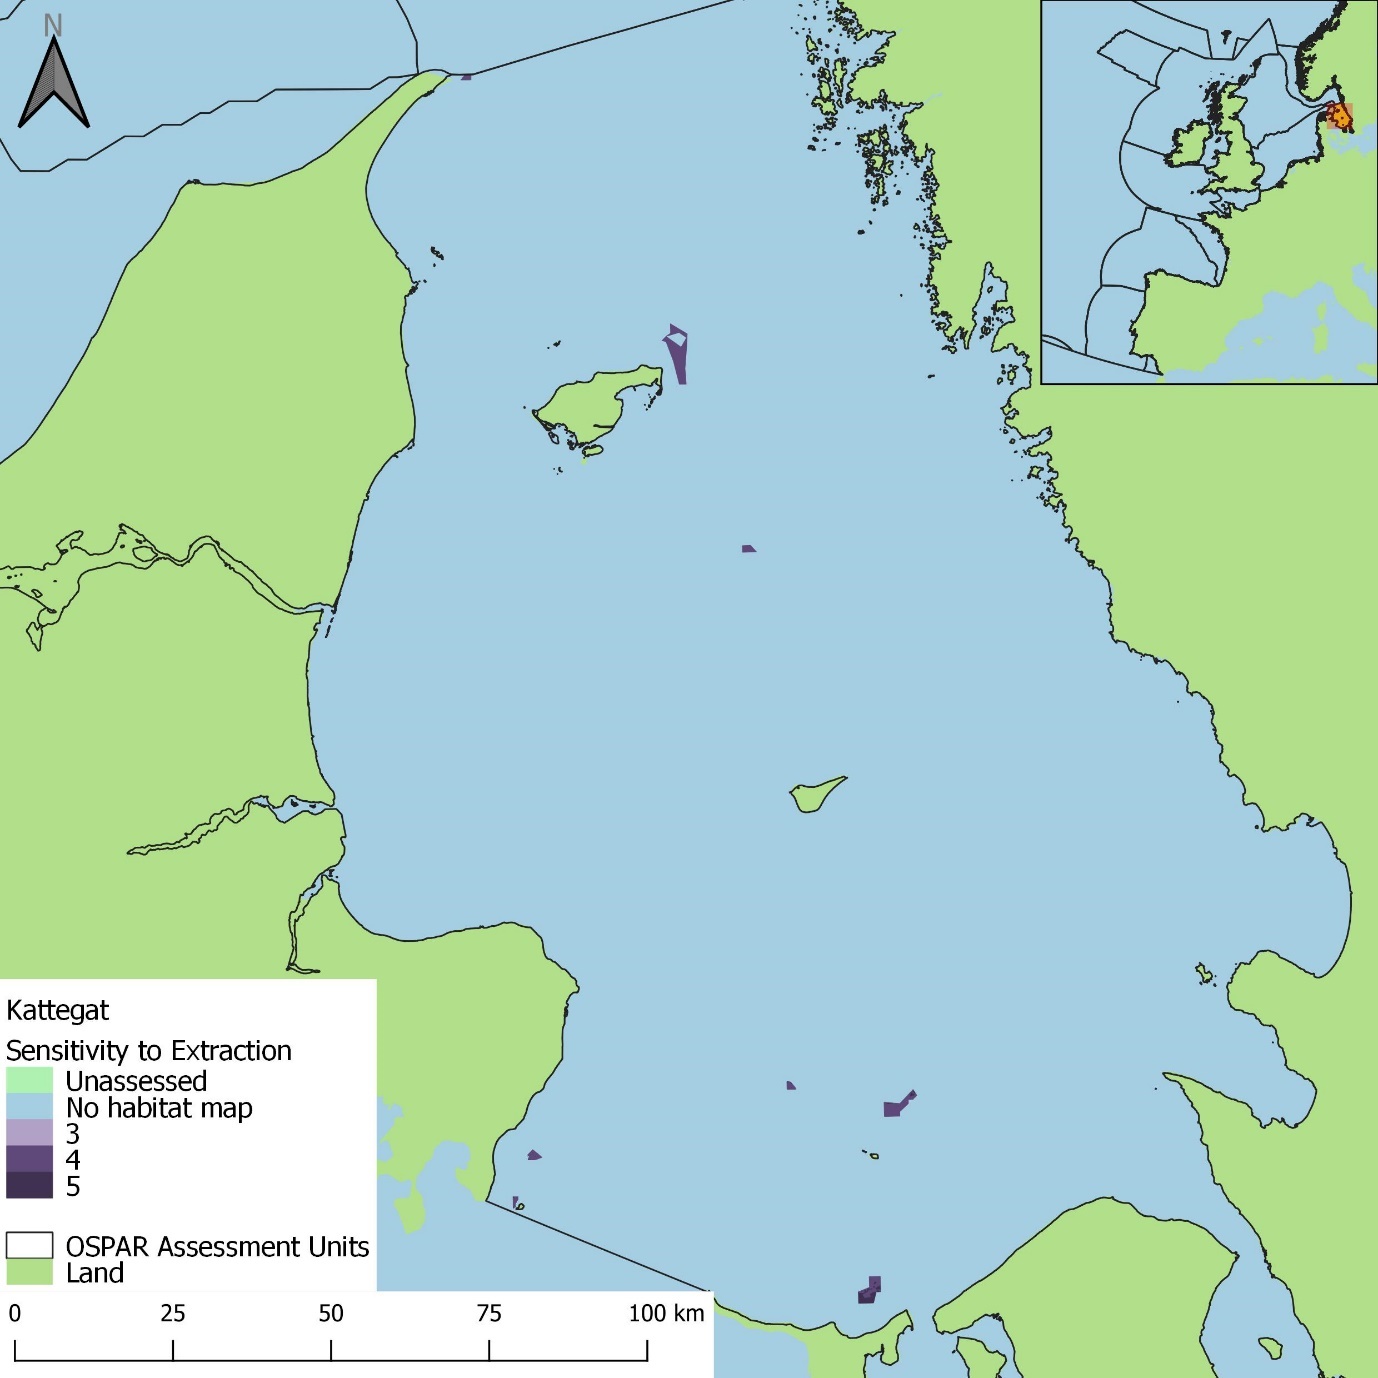
Figure i: Sensitivity map of areas licensed for extraction in the Kattegat
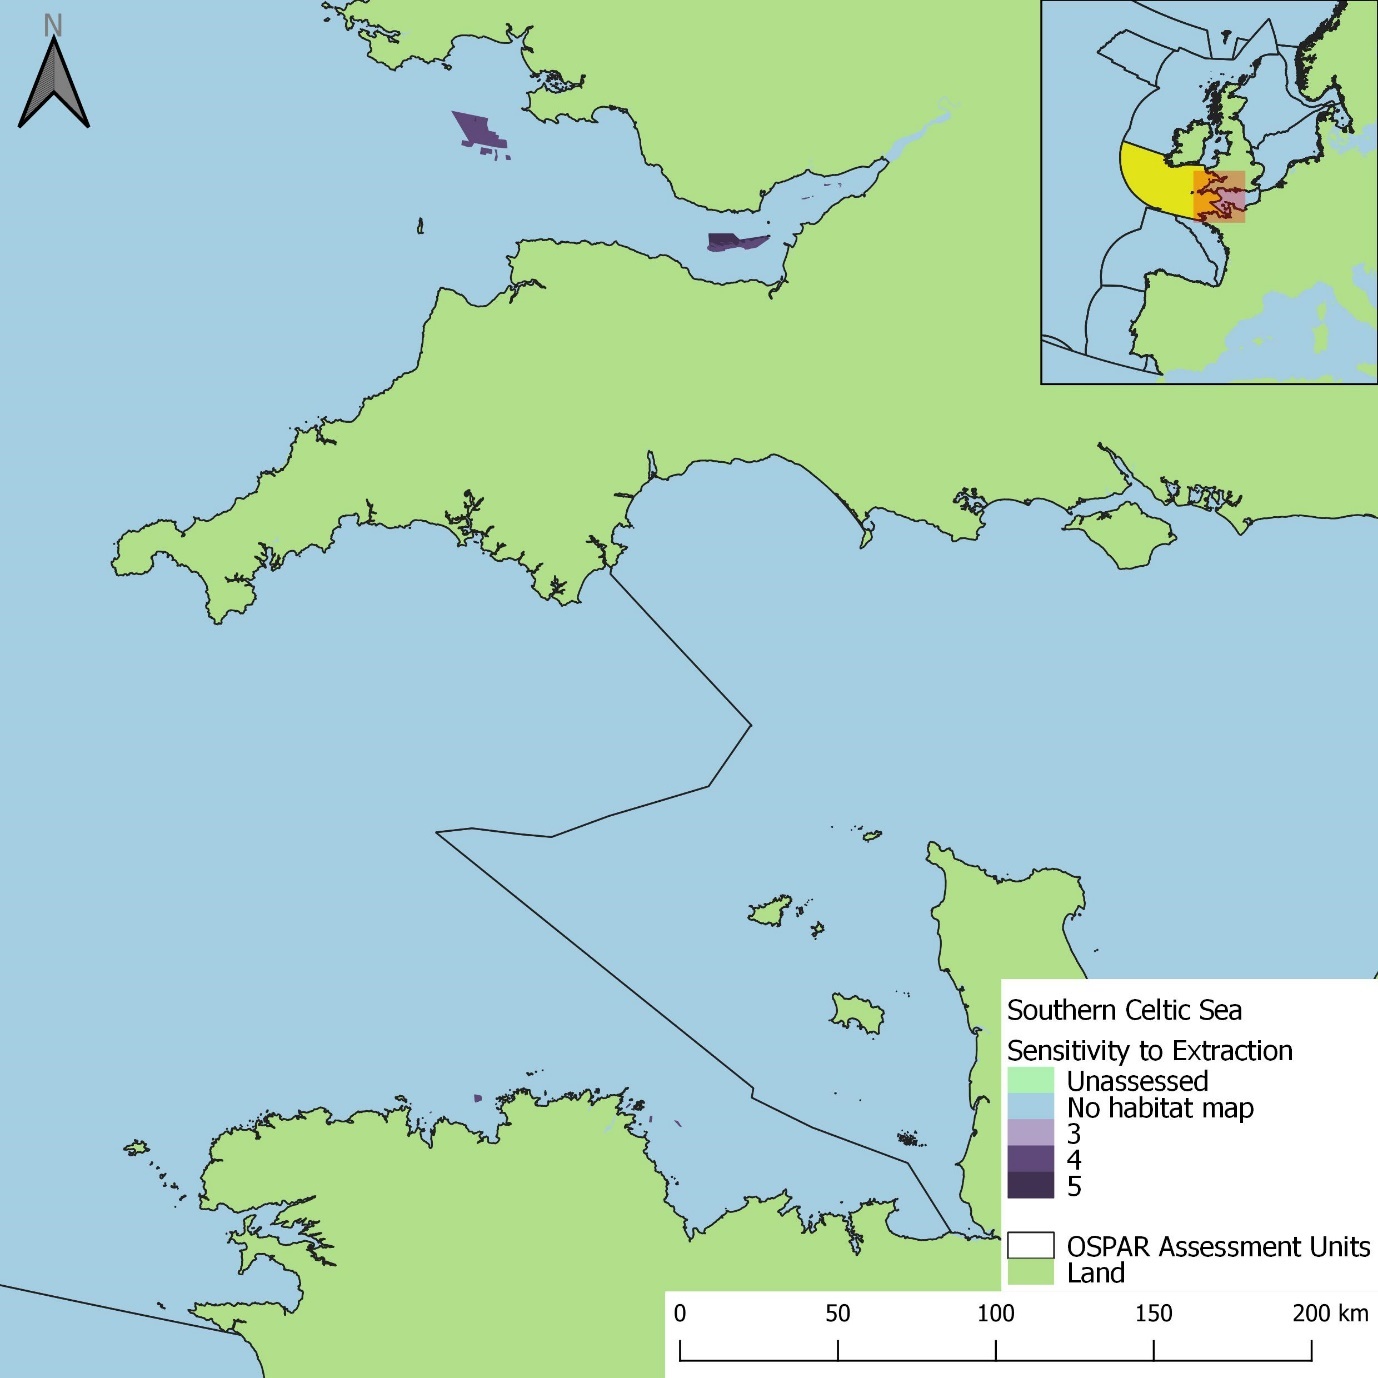
Figure k: Sensitivity map of areas licensed for extraction in the Southern Celtic Sea
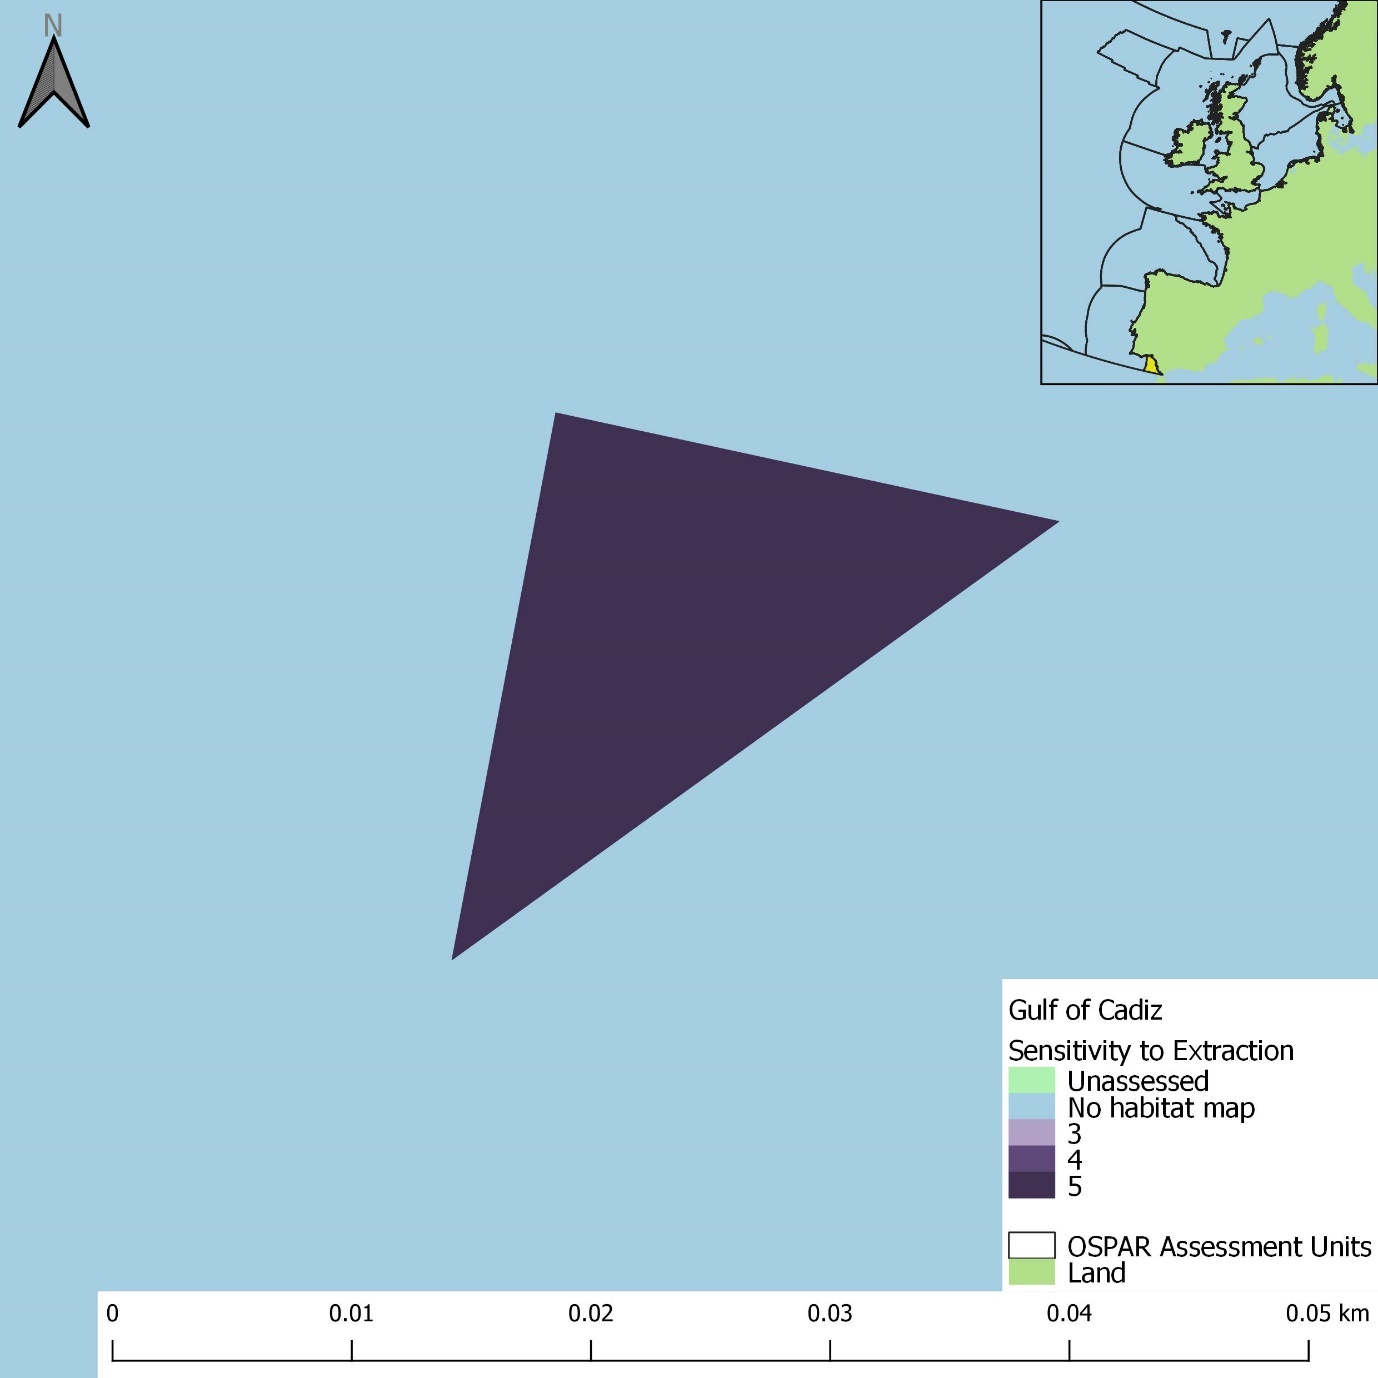
Figure m: Sensitivity map of areas licensed for extraction in the Gulf of Cadiz
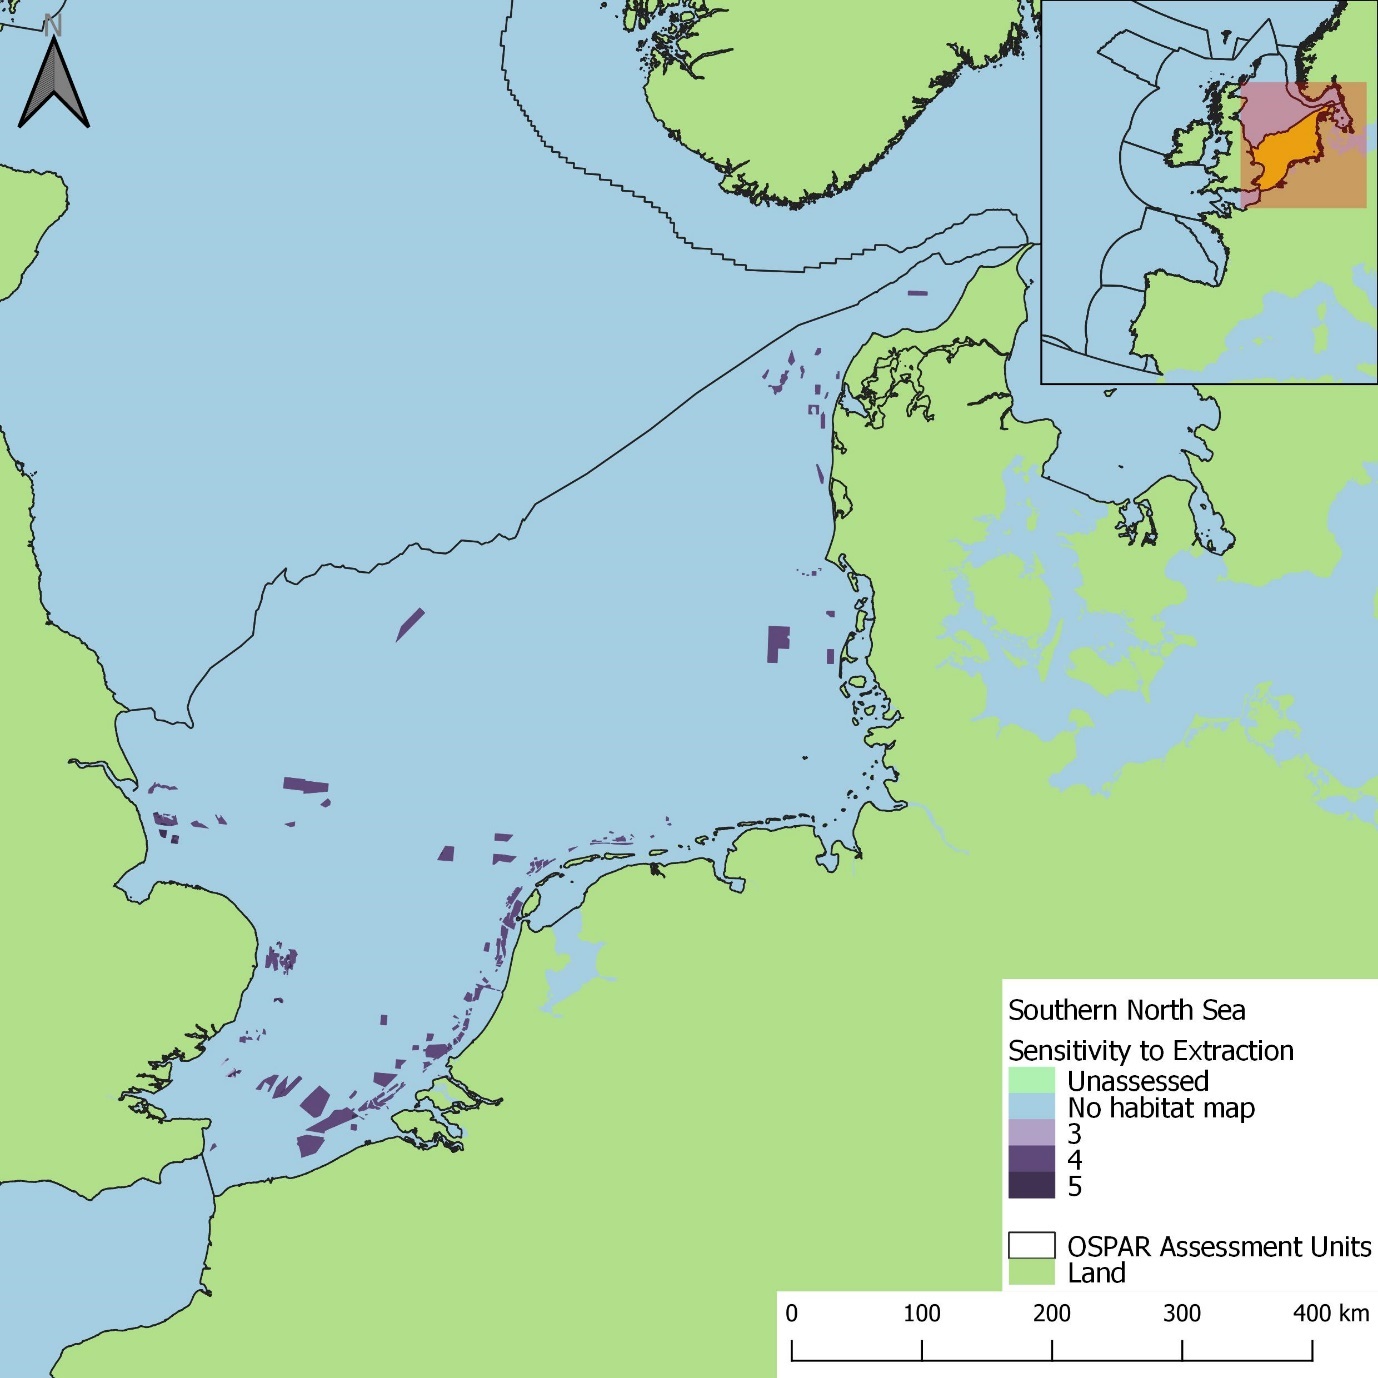
Figure f: Sensitivity map of areas licensed for extraction in the Southern North Sea
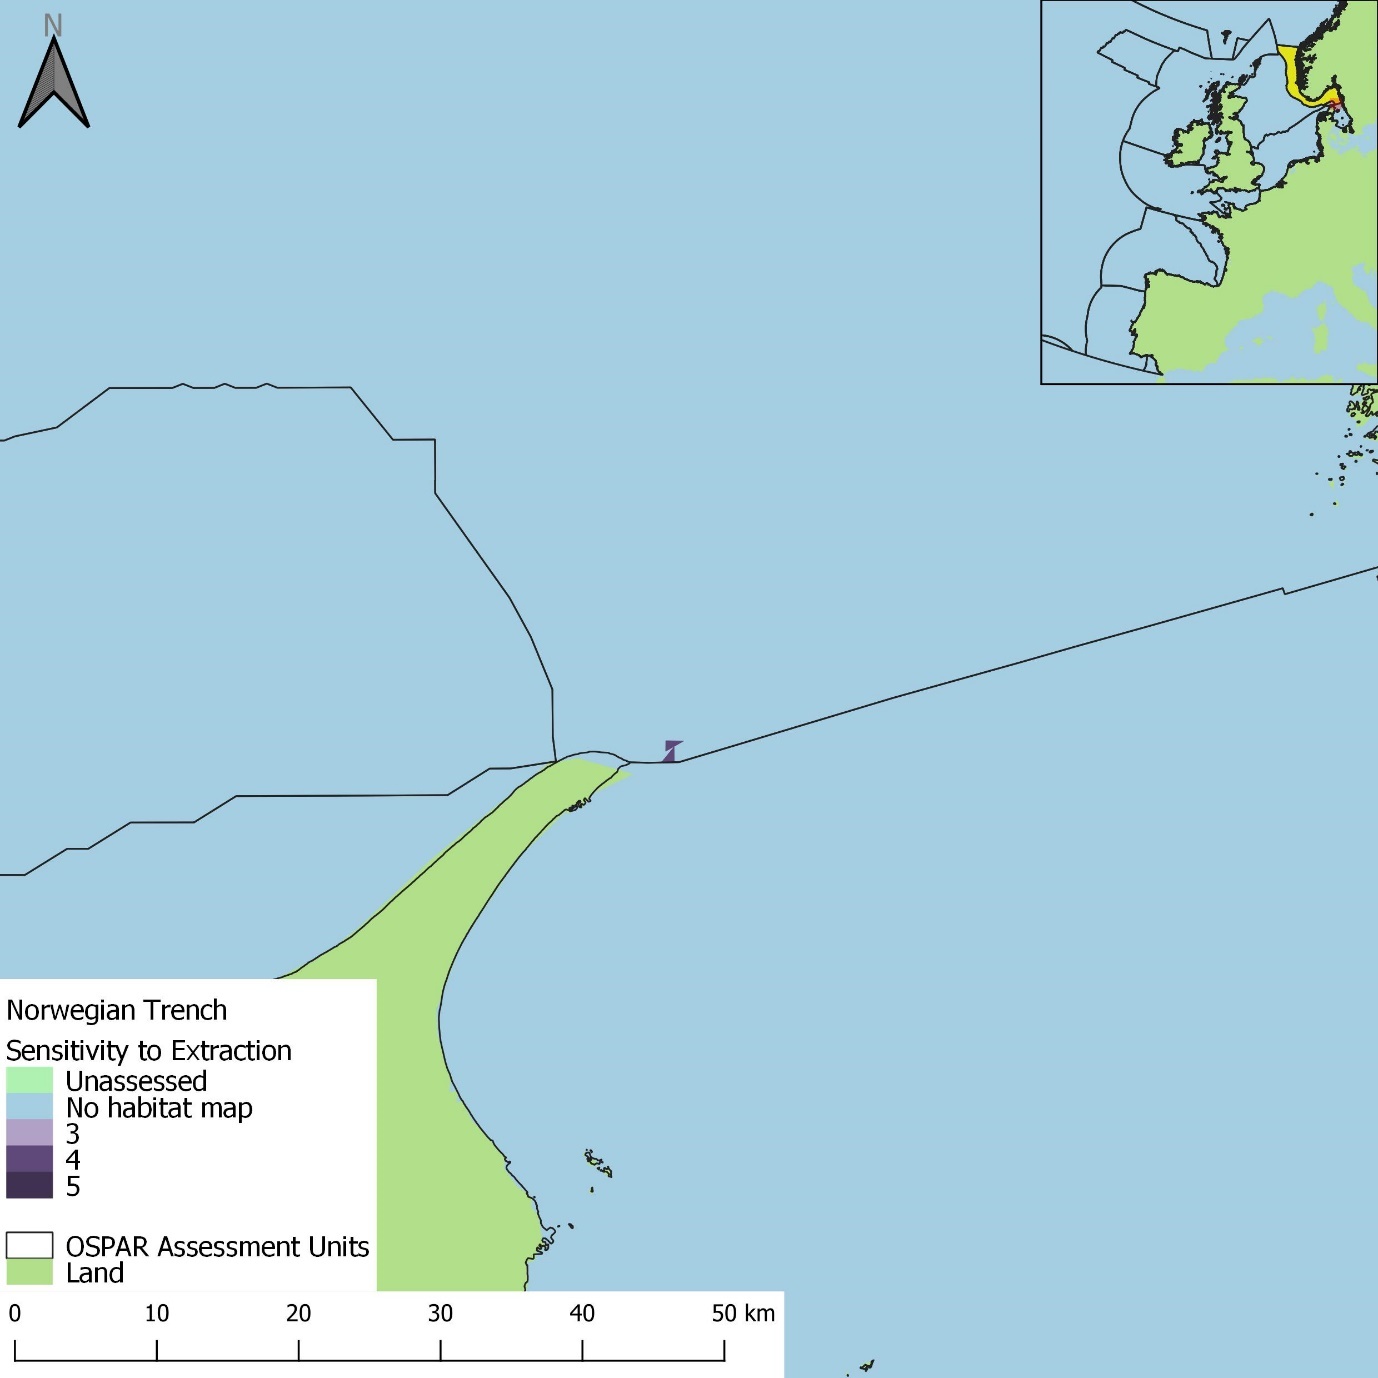
Figure h: Sensitivity map of areas licensed for extraction in the Norwegian Trench
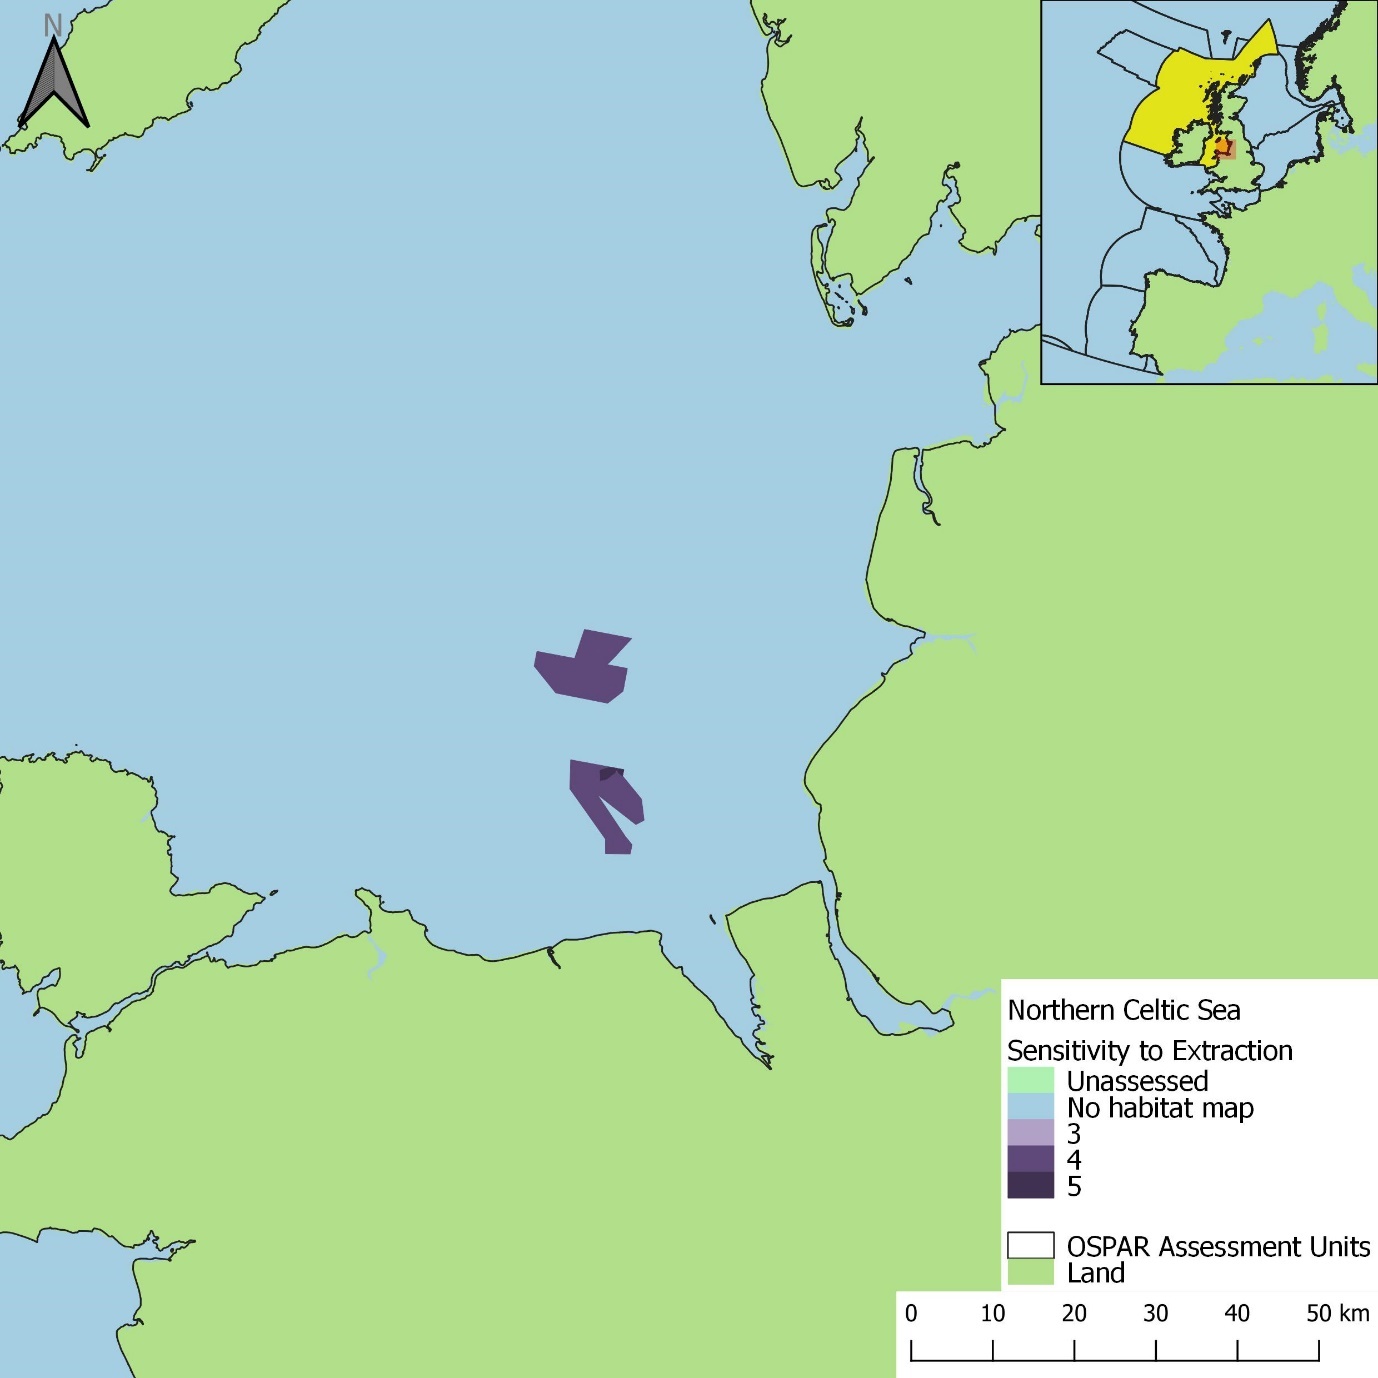
Figure j: Sensitivity map of areas licensed for extraction in the Northern Celtic Sea
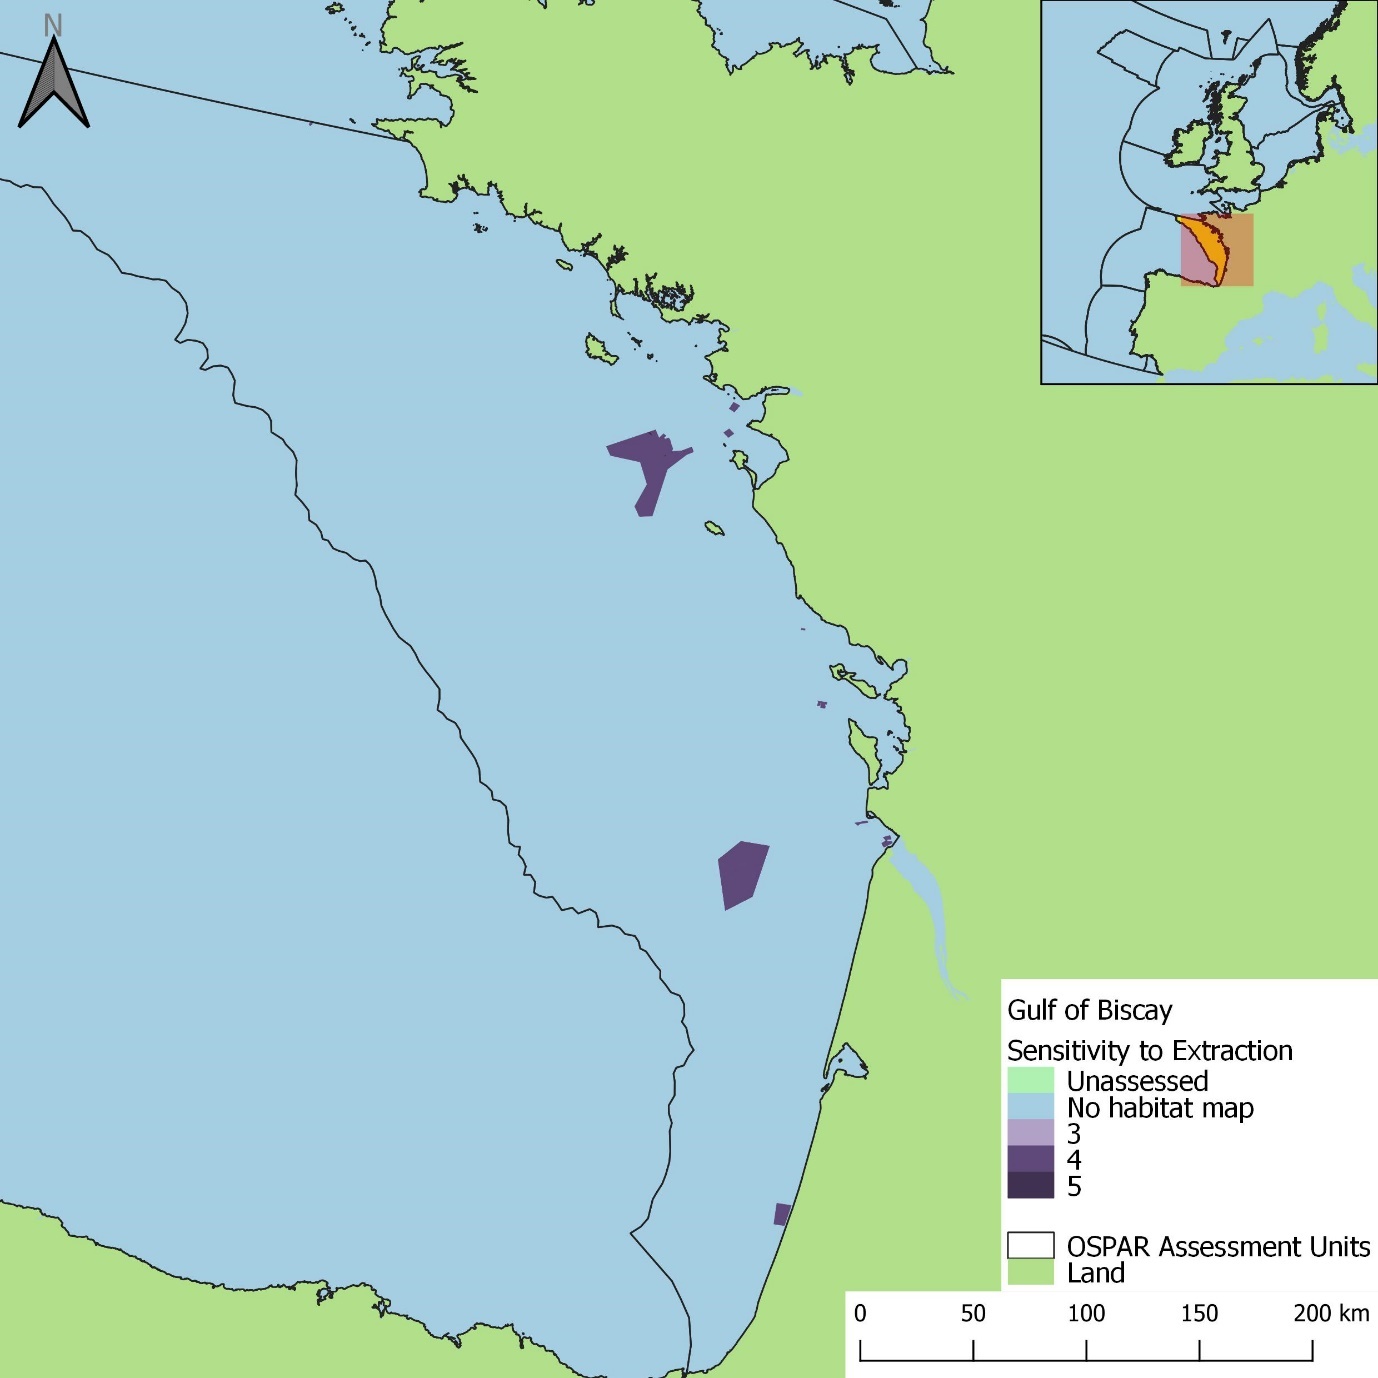
Figure l: Sensitivity map of areas licensed for extraction in the Gulf of Biscay
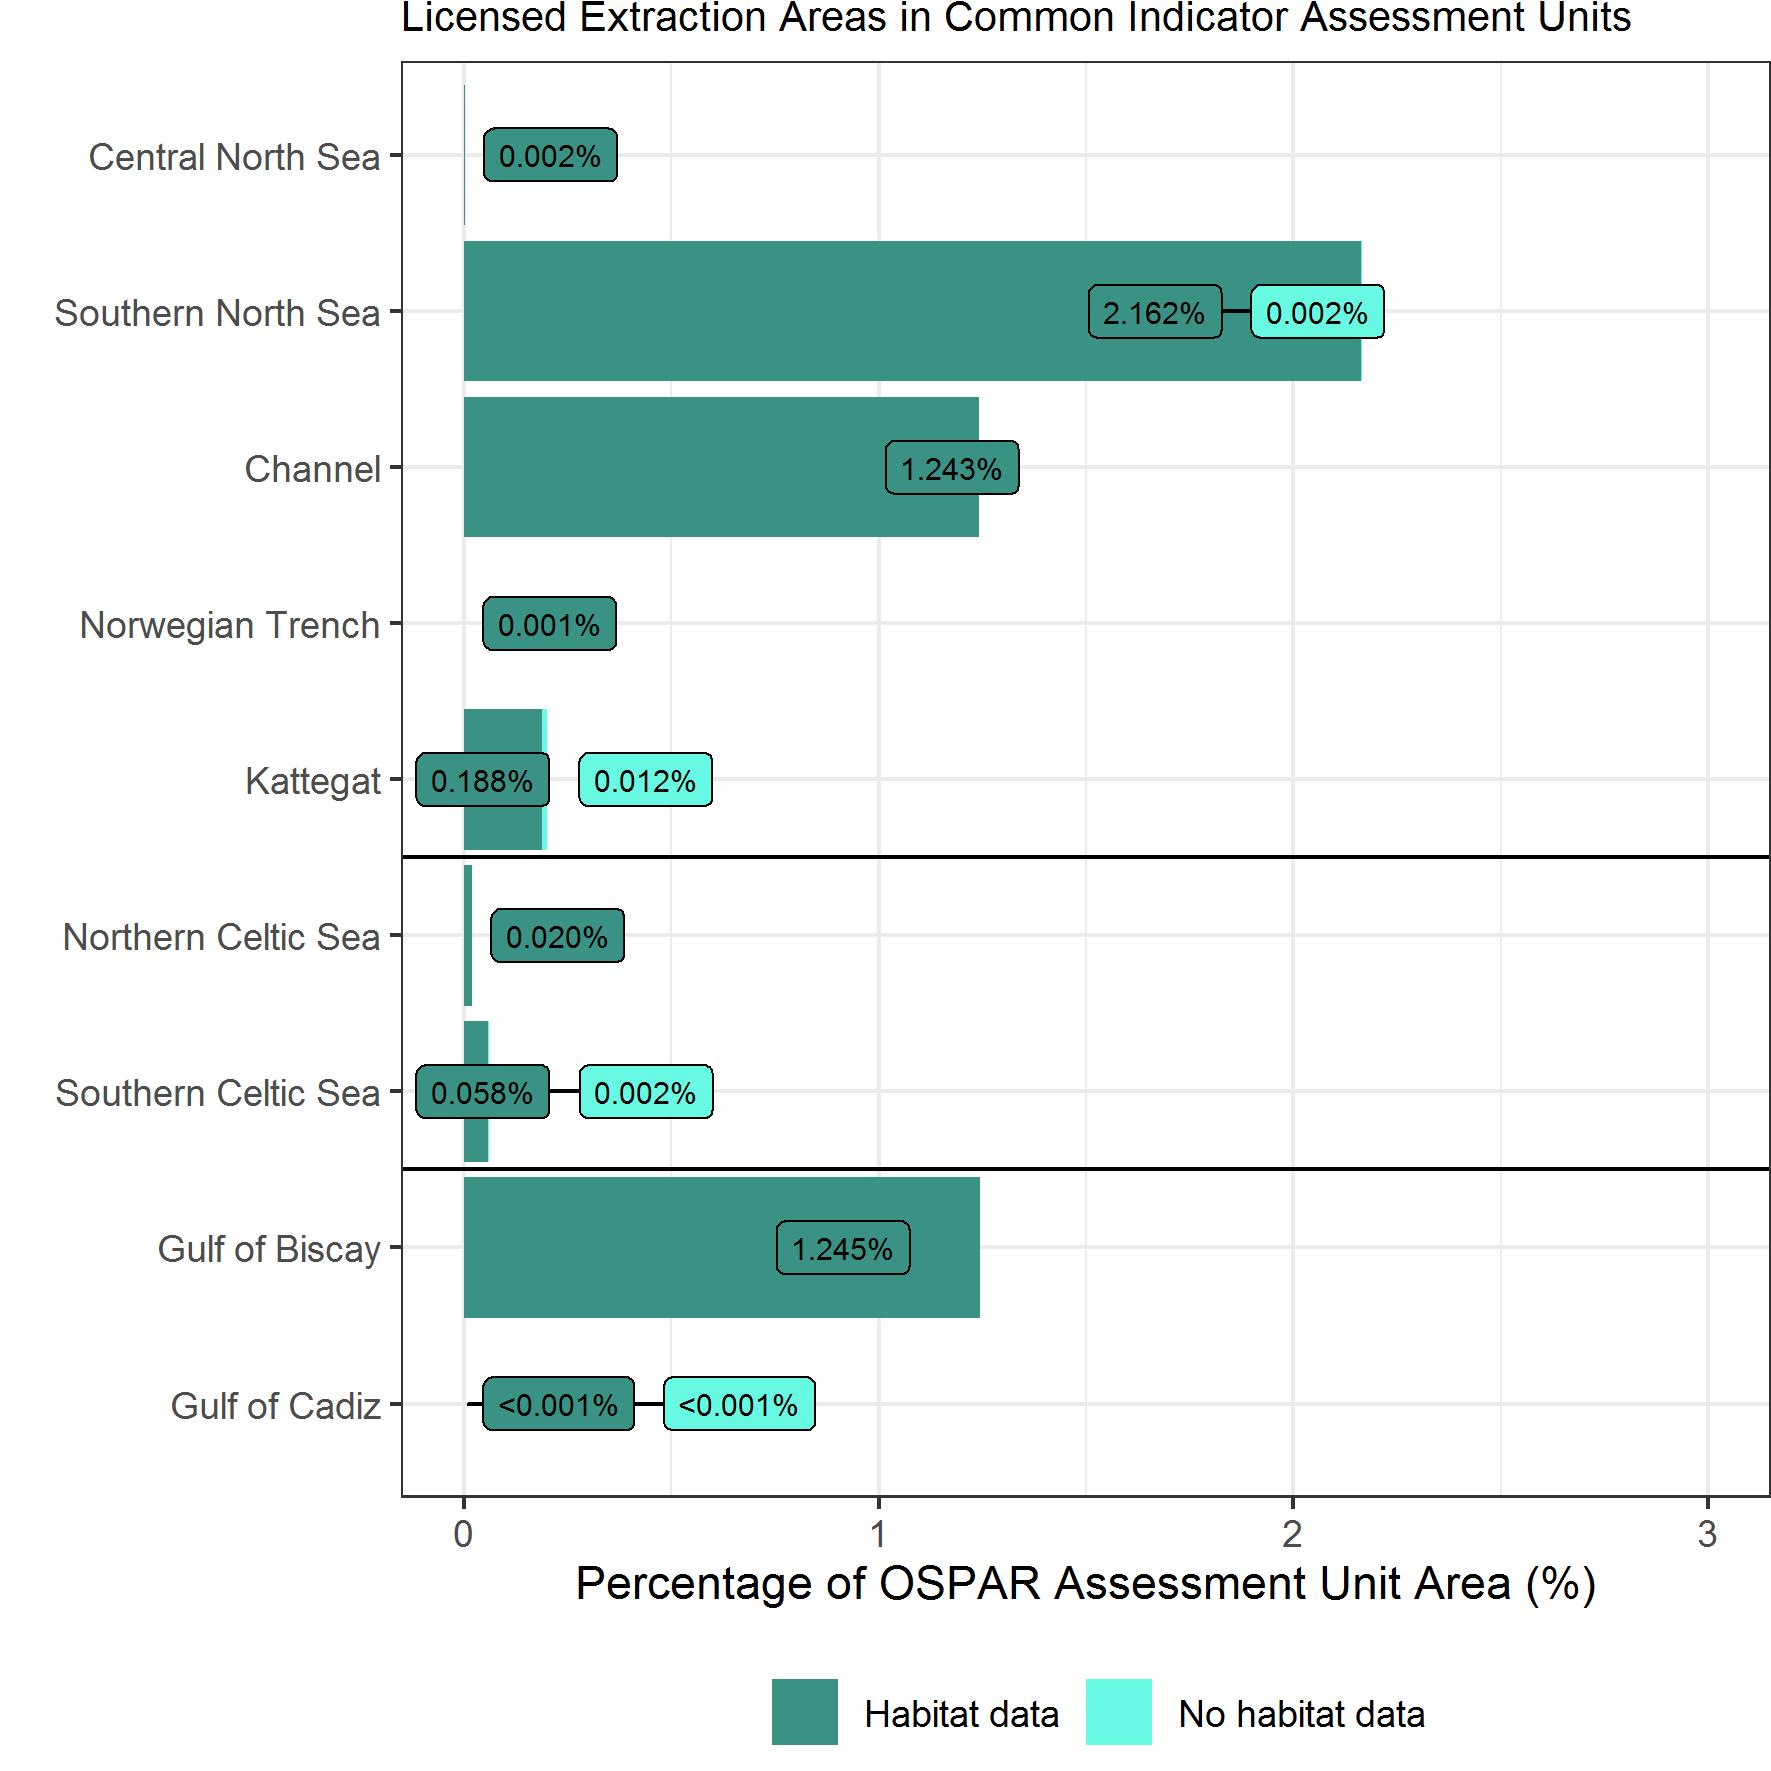
Figure n: Percentage of OSPAR Common Indicator assessment units designated as licensed extraction areas; No habitat data = area where EUNIS habitat data were not available (habitat information unavailable or incompatible with EUNIS classification)
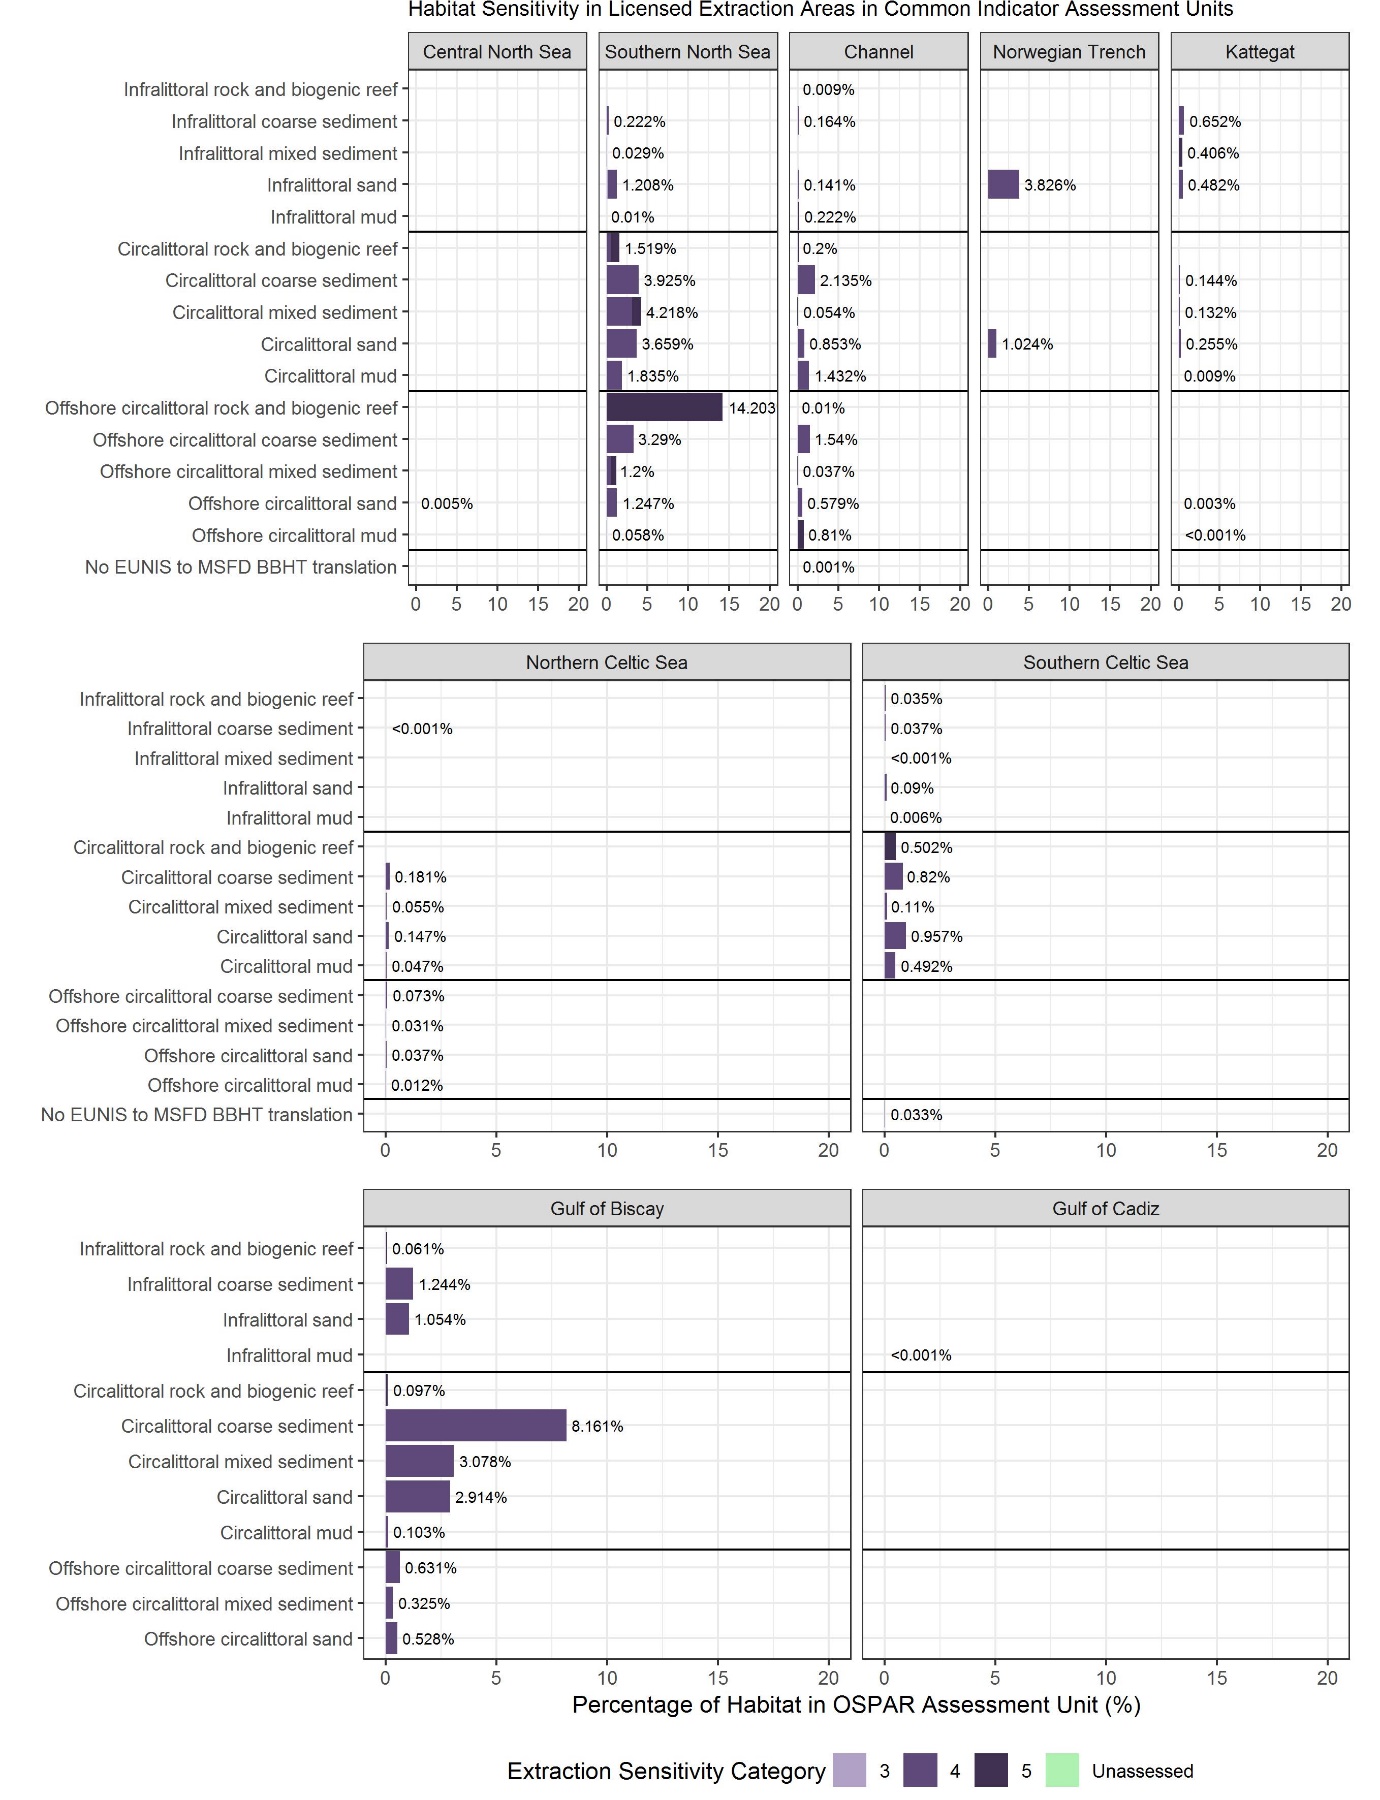
Figure o: Percentage of Broad Habitat Type area within an assessment unit in each sensitivity category. Extraction sensitivity was only assessed within licensed areas; therefore, the numerical labels represent the total percentage of each habitat area within an assessment unit that occurred in licensed areas. No EUNIS to MSFD BBHT translation = EUNIS habitats that could not be assigned MSFD translations (e.g., lacking substrate information)
Extraction activity areas:
The majority of extraction pressure in both the 2009 to 2020 and 2016 to 2020 assessment periods, occurred in areas with a sensitivity category of four (Figure p to Figure v, and Figure x). With the exception of a small area in the Southern North Sea, where sensitivity was category 3, extraction pressure in both assessment periods predominantly occurred in areas with sensitivity categories 4, 5 or ‘unassessed’ sensitivity (areas without habitat and / or sensitivity information). The largest proportion of assessment unit area with sensitivity 5 habitat under extraction pressure occurred in the Kattegat (0,017%, Infralittoral mixed sediment; Figure x and Figure y). There was little variation between the 2009 to 2020 and 2016 to 2020 assessment periods in the composition of assessed sensitivity of BHTs where extraction pressure was present (Figure w and Figure y).
Around 95% or more of each BHT was categorised as having sensitivity values of 3, 4 or 5 for both assessment periods, with exceptions for Circalittoral mud and Circalittoral mixed sediment in the Southern North Sea and Southern Celtic Sea, which did not fit this trend. Circalittoral rock and biogenic reef was almost entirely sensitivity category 5 in all assessment units it was found in, apart from 2% in the Southern North Sea in the 2009 to 2020 assessment period, which was category 4 (Figure w). Extraction in areas of Infralittoral sand in the Southern North Sea were almost entirely sensitivity category 3, in contrast to the Southern Celtic Sea, where Infralittoral sand had a sensitivity category of 4. Differences in sensitivity were caused by variations in the composition of child biotopes within BHTs, and their associated sensitivities within assessment units. The Southern North Sea was the only assessment unit where extraction pressure coincided with habitats with a sensitivity category of 3 (exclusively Infralittoral sand BHT). The greatest proportion of area within an assessment unit with pressure and ‘unassessed’ sensitivity occurred in the Kattegat (0,002%; Figure x), which was a result of the OSPAR Maritime Area composite habitat map not including the Øresund strait area of the Kattegat assessment unit.
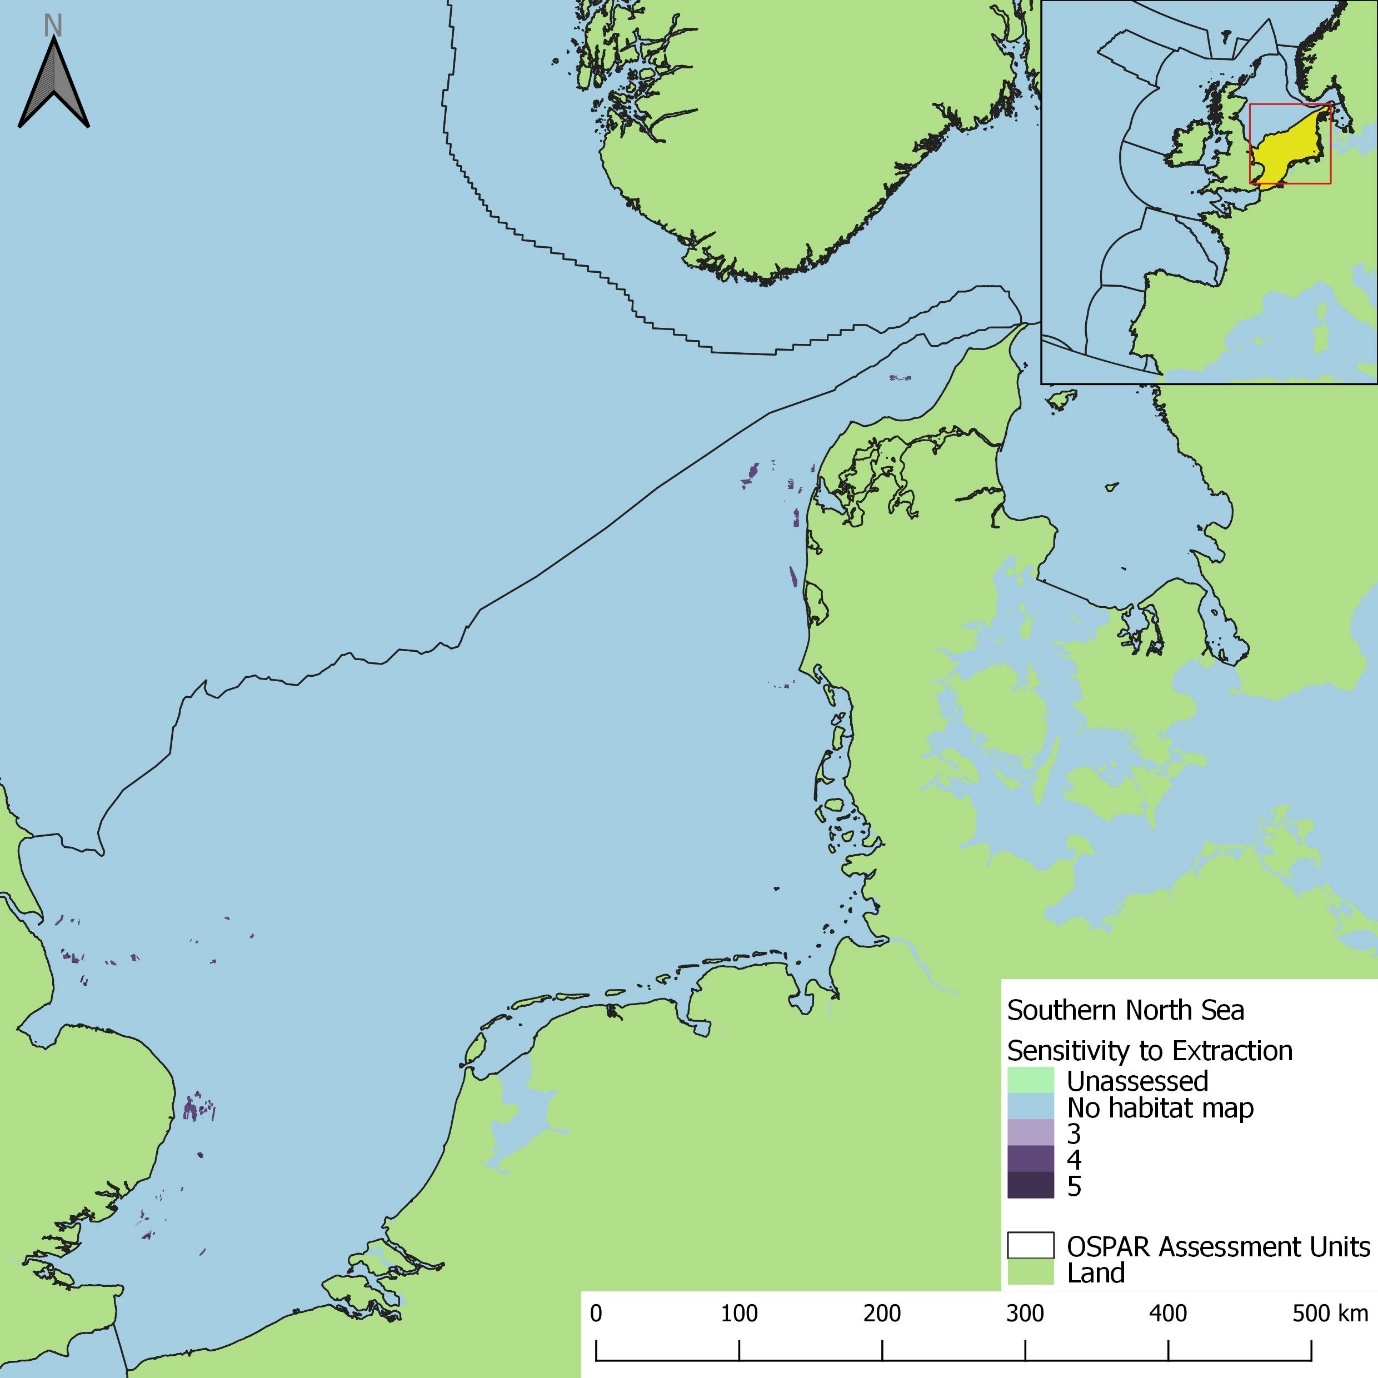
Figure p: Extent and distribution of habitat and benthic species sensitivities (based on resilience and resistance) to extraction combined within EUNIS Level 2-6 benthic habitat types, where aggregate extraction pressure data were available in the Southern North Sea assessment unit
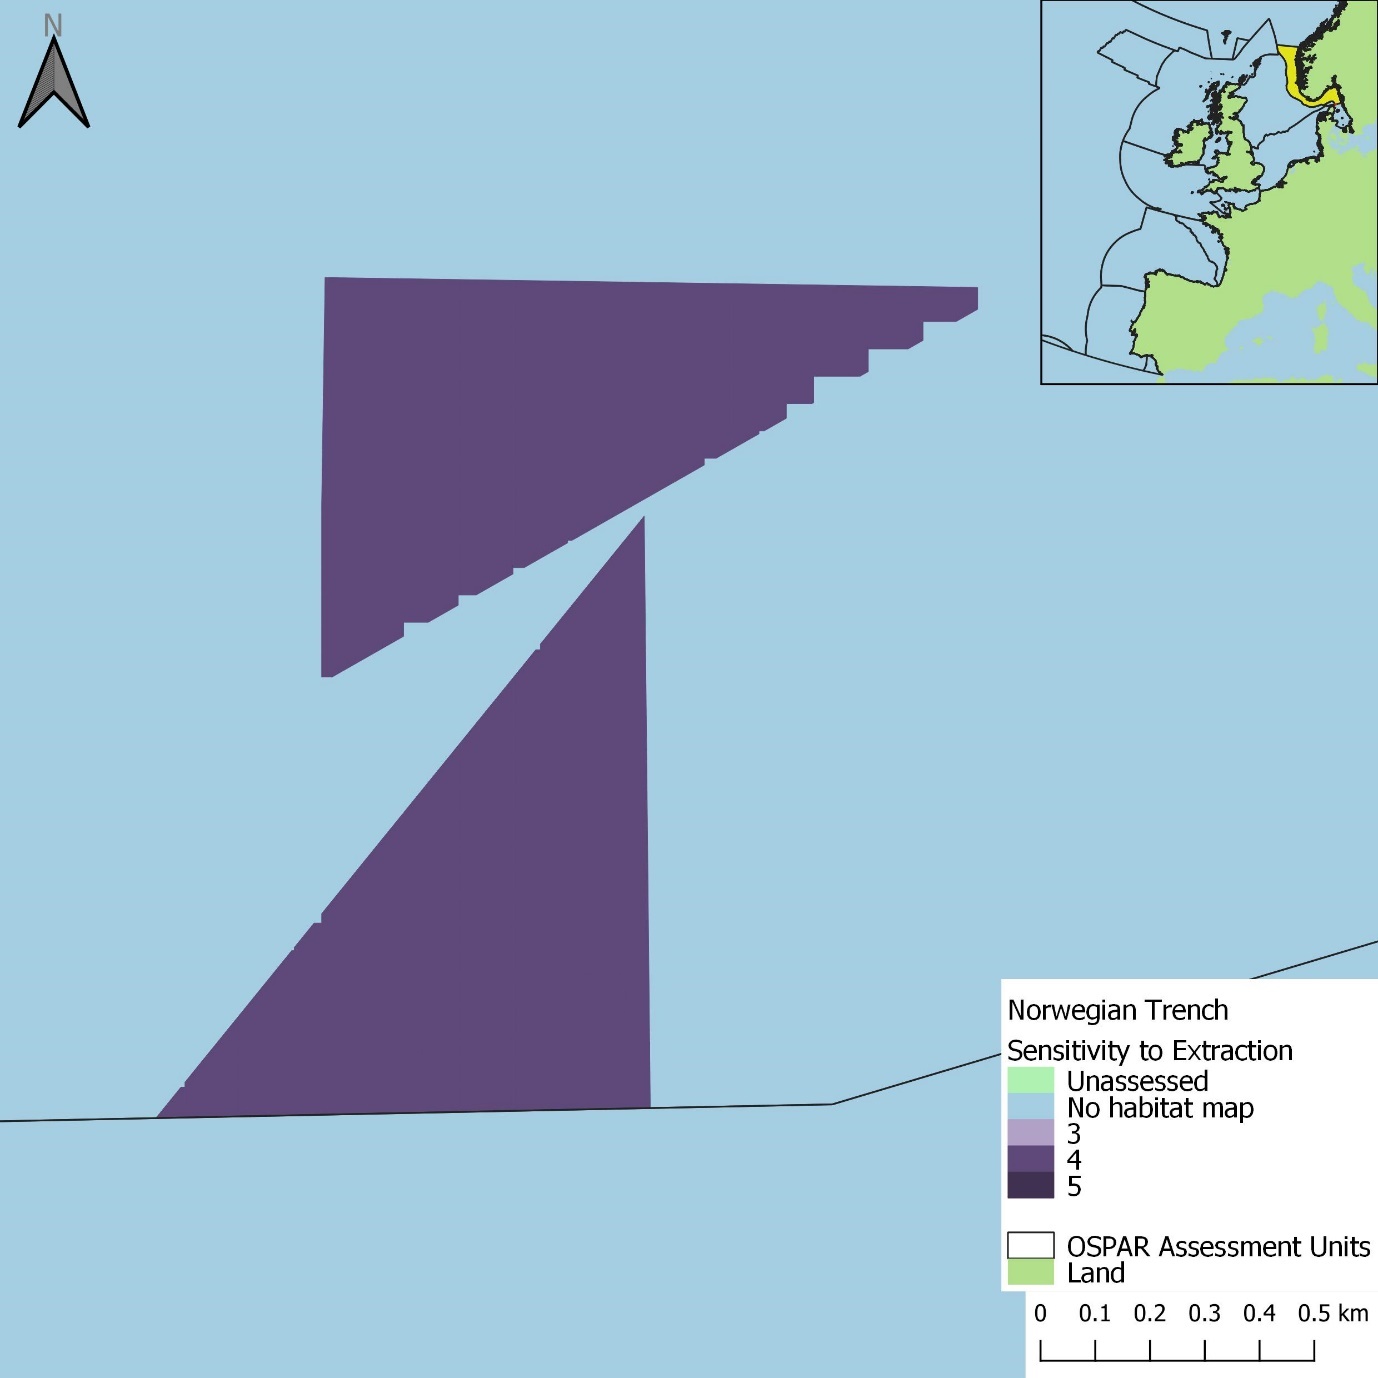
Figure r: Extent and distribution of habitat and benthic species sensitivities (based on resilience and resistance) to extraction combined within EUNIS Level 2-6 benthic habitat types, where aggregate extraction pressure data were available in the Norwegian Trench assessment unit
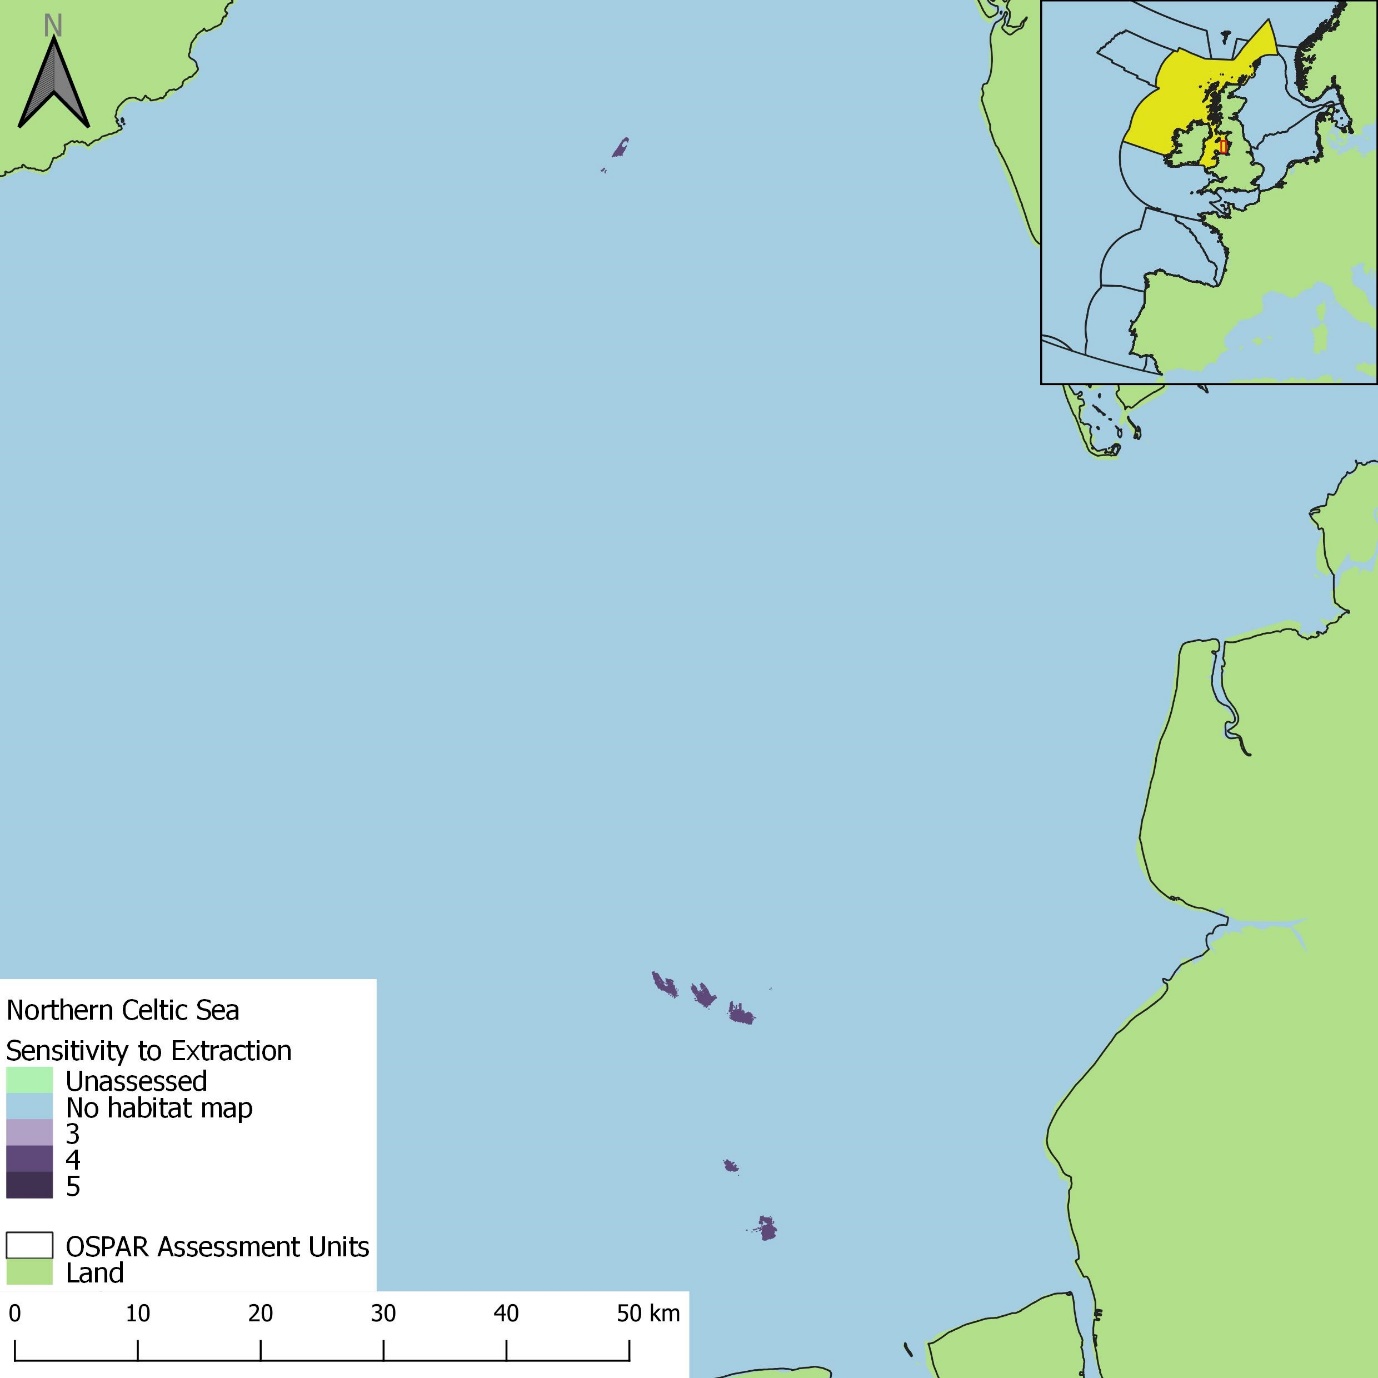
Figure t: Extent and distribution of habitat and benthic species sensitivities (based on resilience and resistance) to extraction combined within EUNIS Level 2-6 benthic habitat types, where aggregate extraction pressure data were available in the Northern Celtic Sea assessment unit
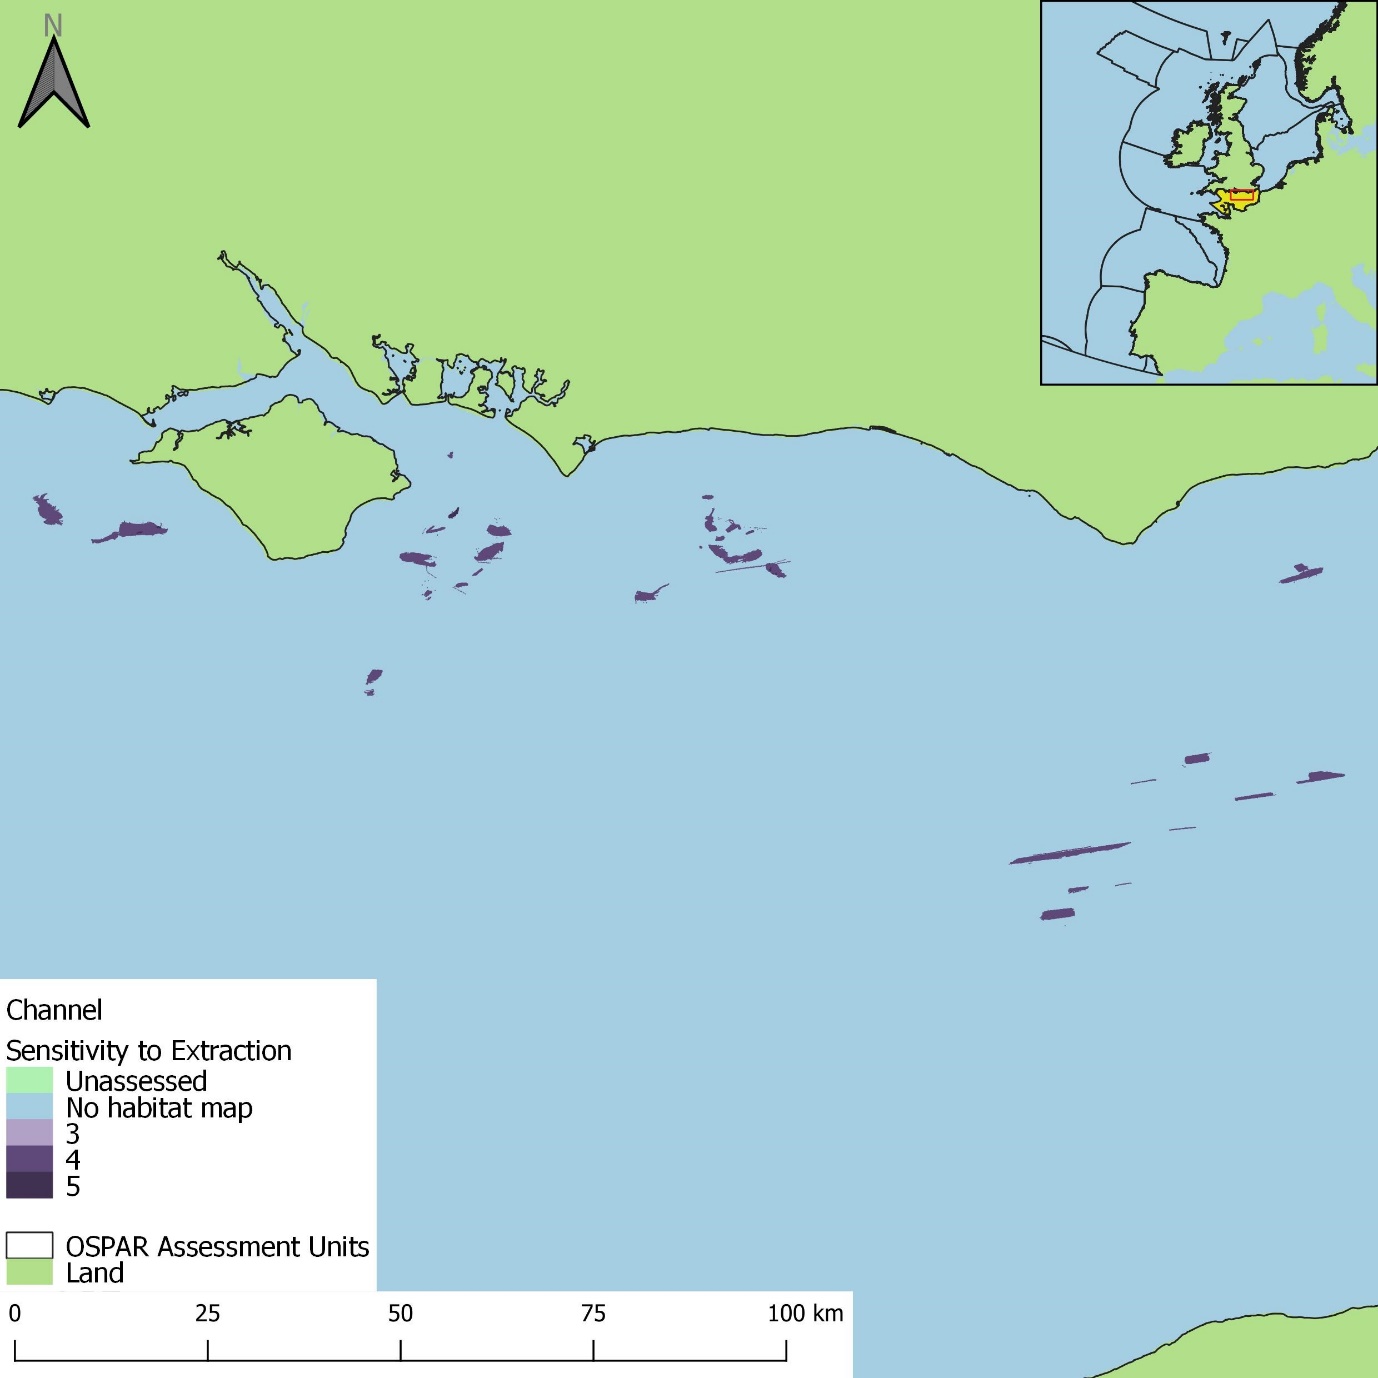
Figure q: Extent and distribution of habitat and benthic species sensitivities (based on resilience and resistance) to extraction combined within EUNIS Level 2-6 benthic habitat types, where aggregate extraction pressure data were available in the Channel assessment unit
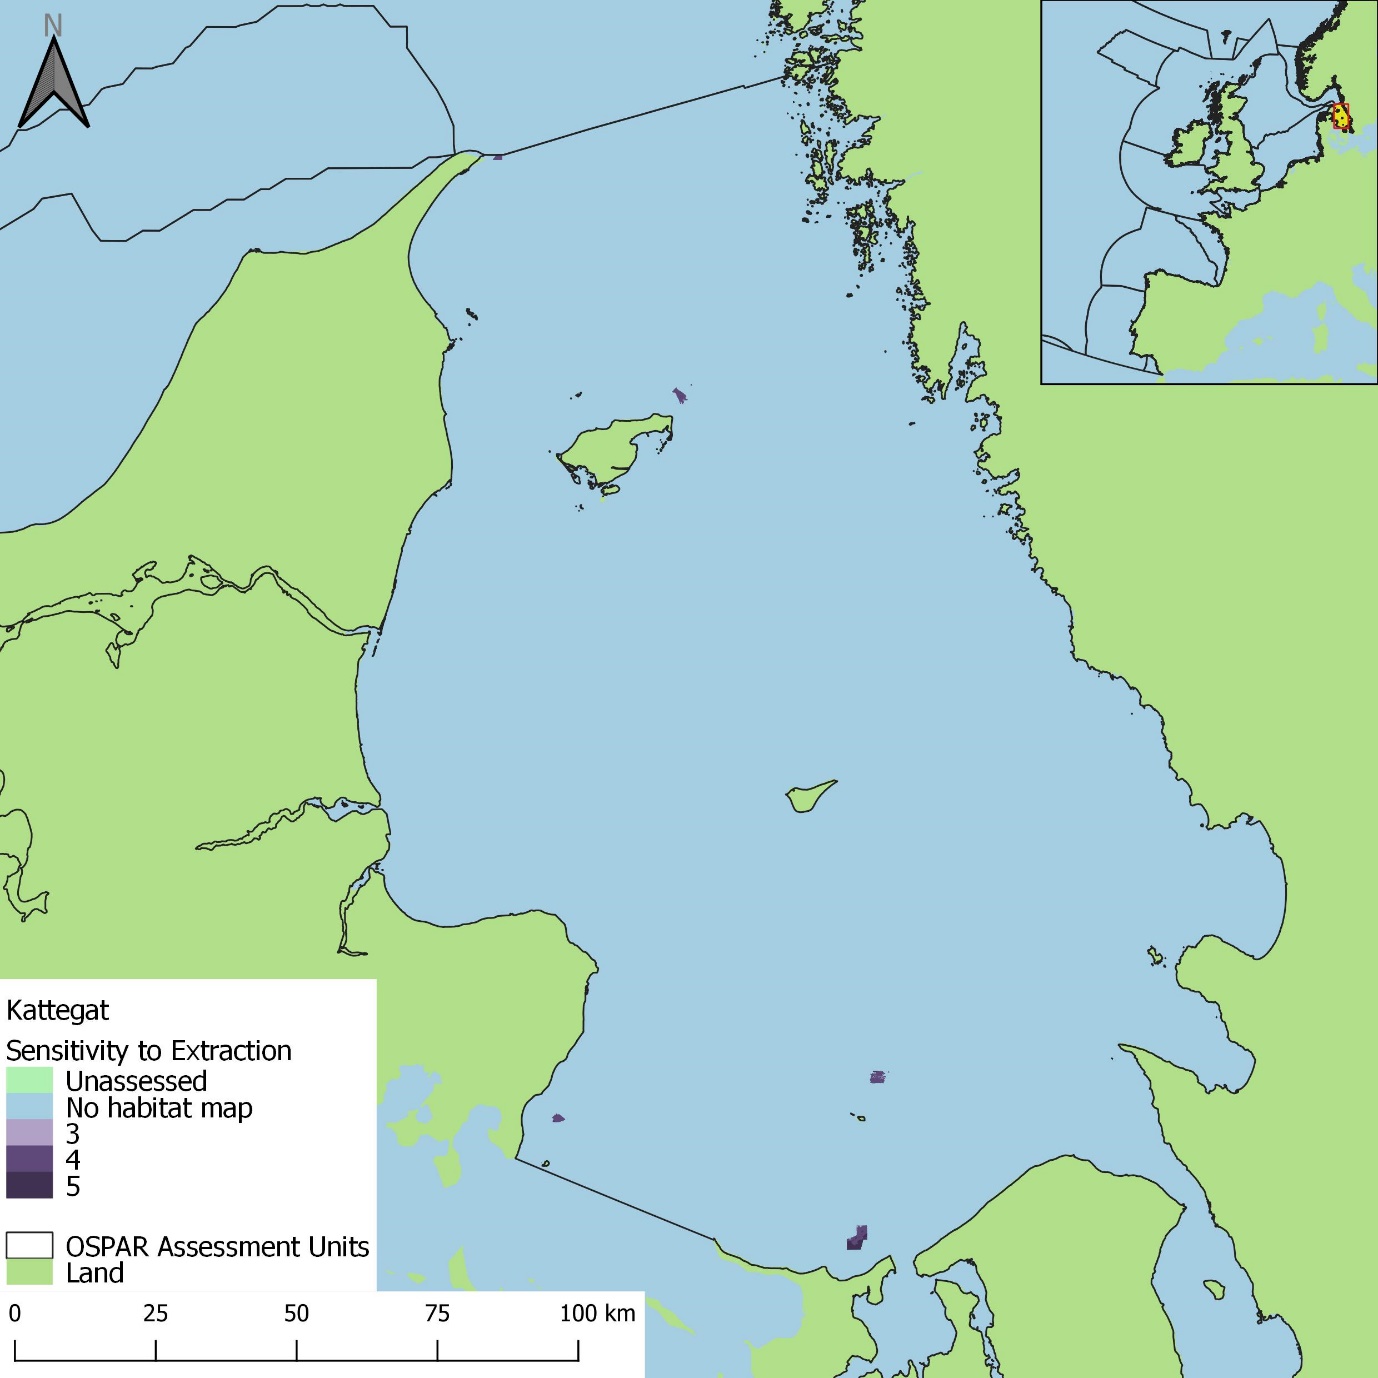
Figure s: Extent and distribution of habitat and benthic species sensitivities (based on resilience and resistance) to extraction combined within EUNIS Level 2-6 benthic habitat types, where aggregate extraction pressure data were available in the Kattegat assessment unit
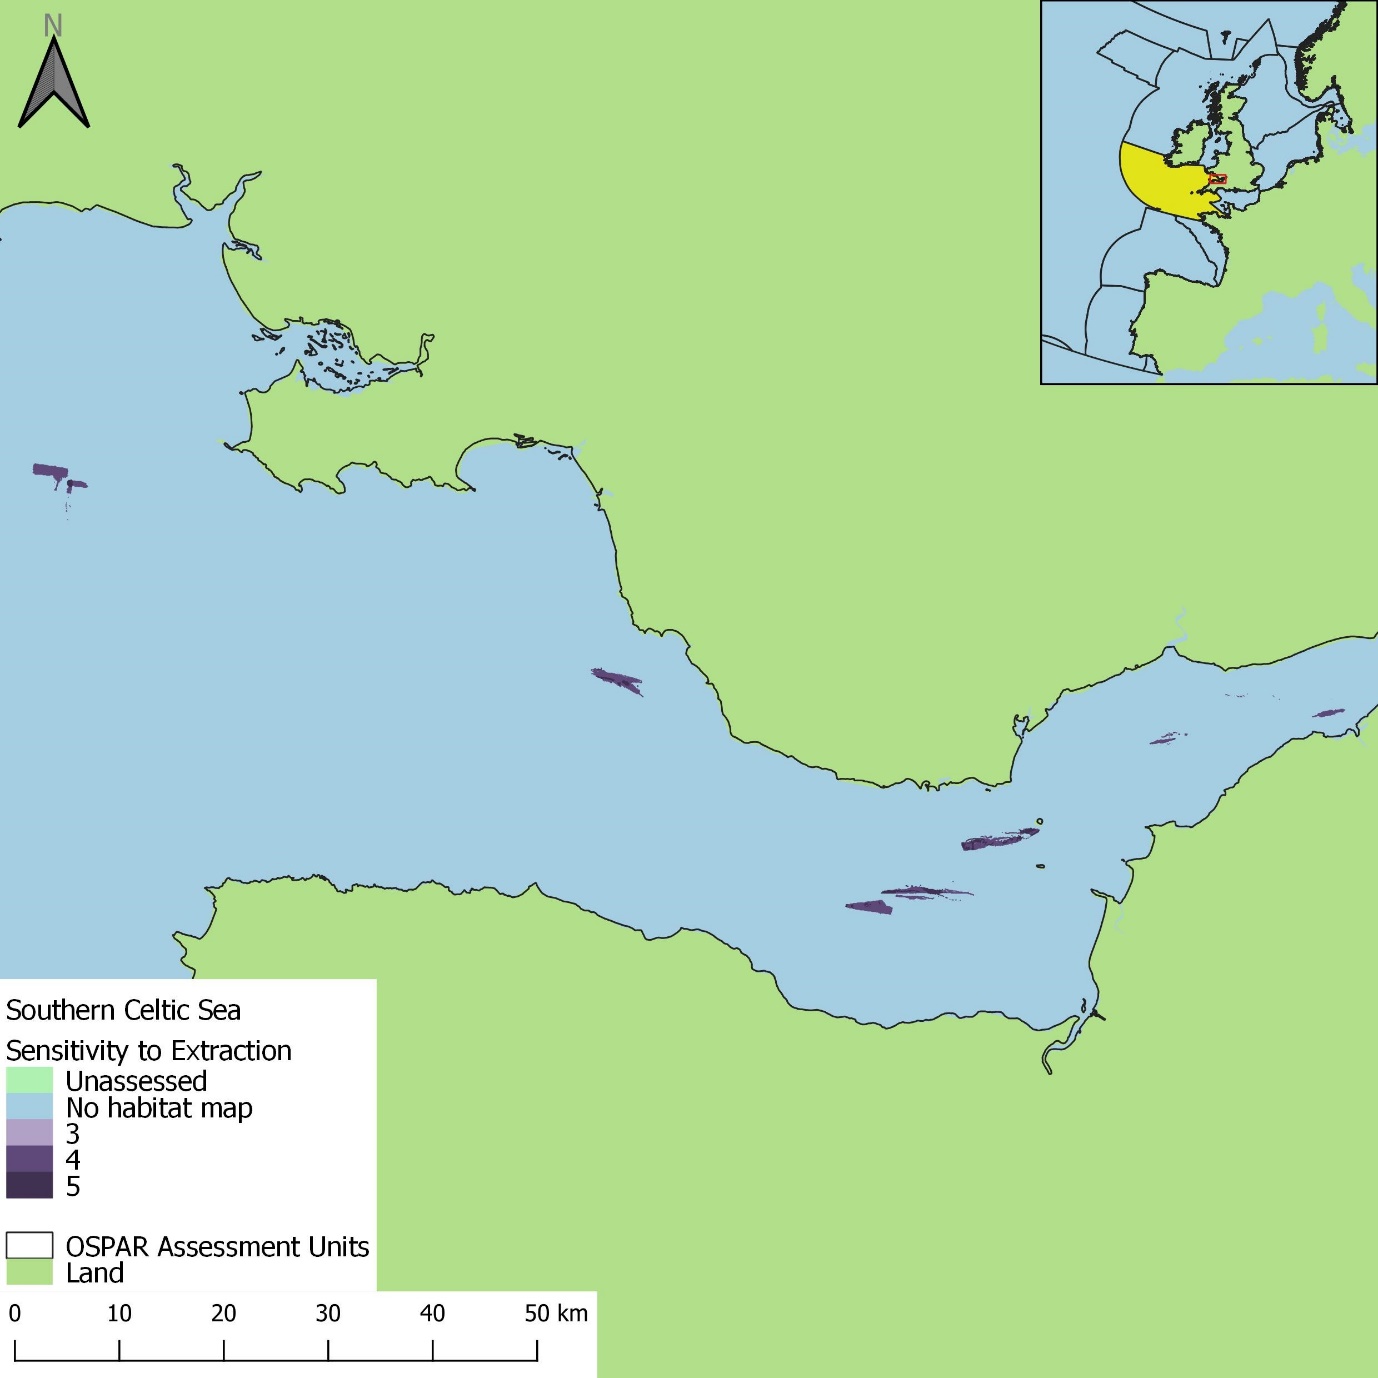
Figure u: Extent and distribution of habitat and benthic species sensitivities (based on resilience and resistance) to extraction combined within EUNIS Level 2-6 benthic habitat types, where aggregate extraction pressure data were available in the Southern Celtic Sea assessment unit
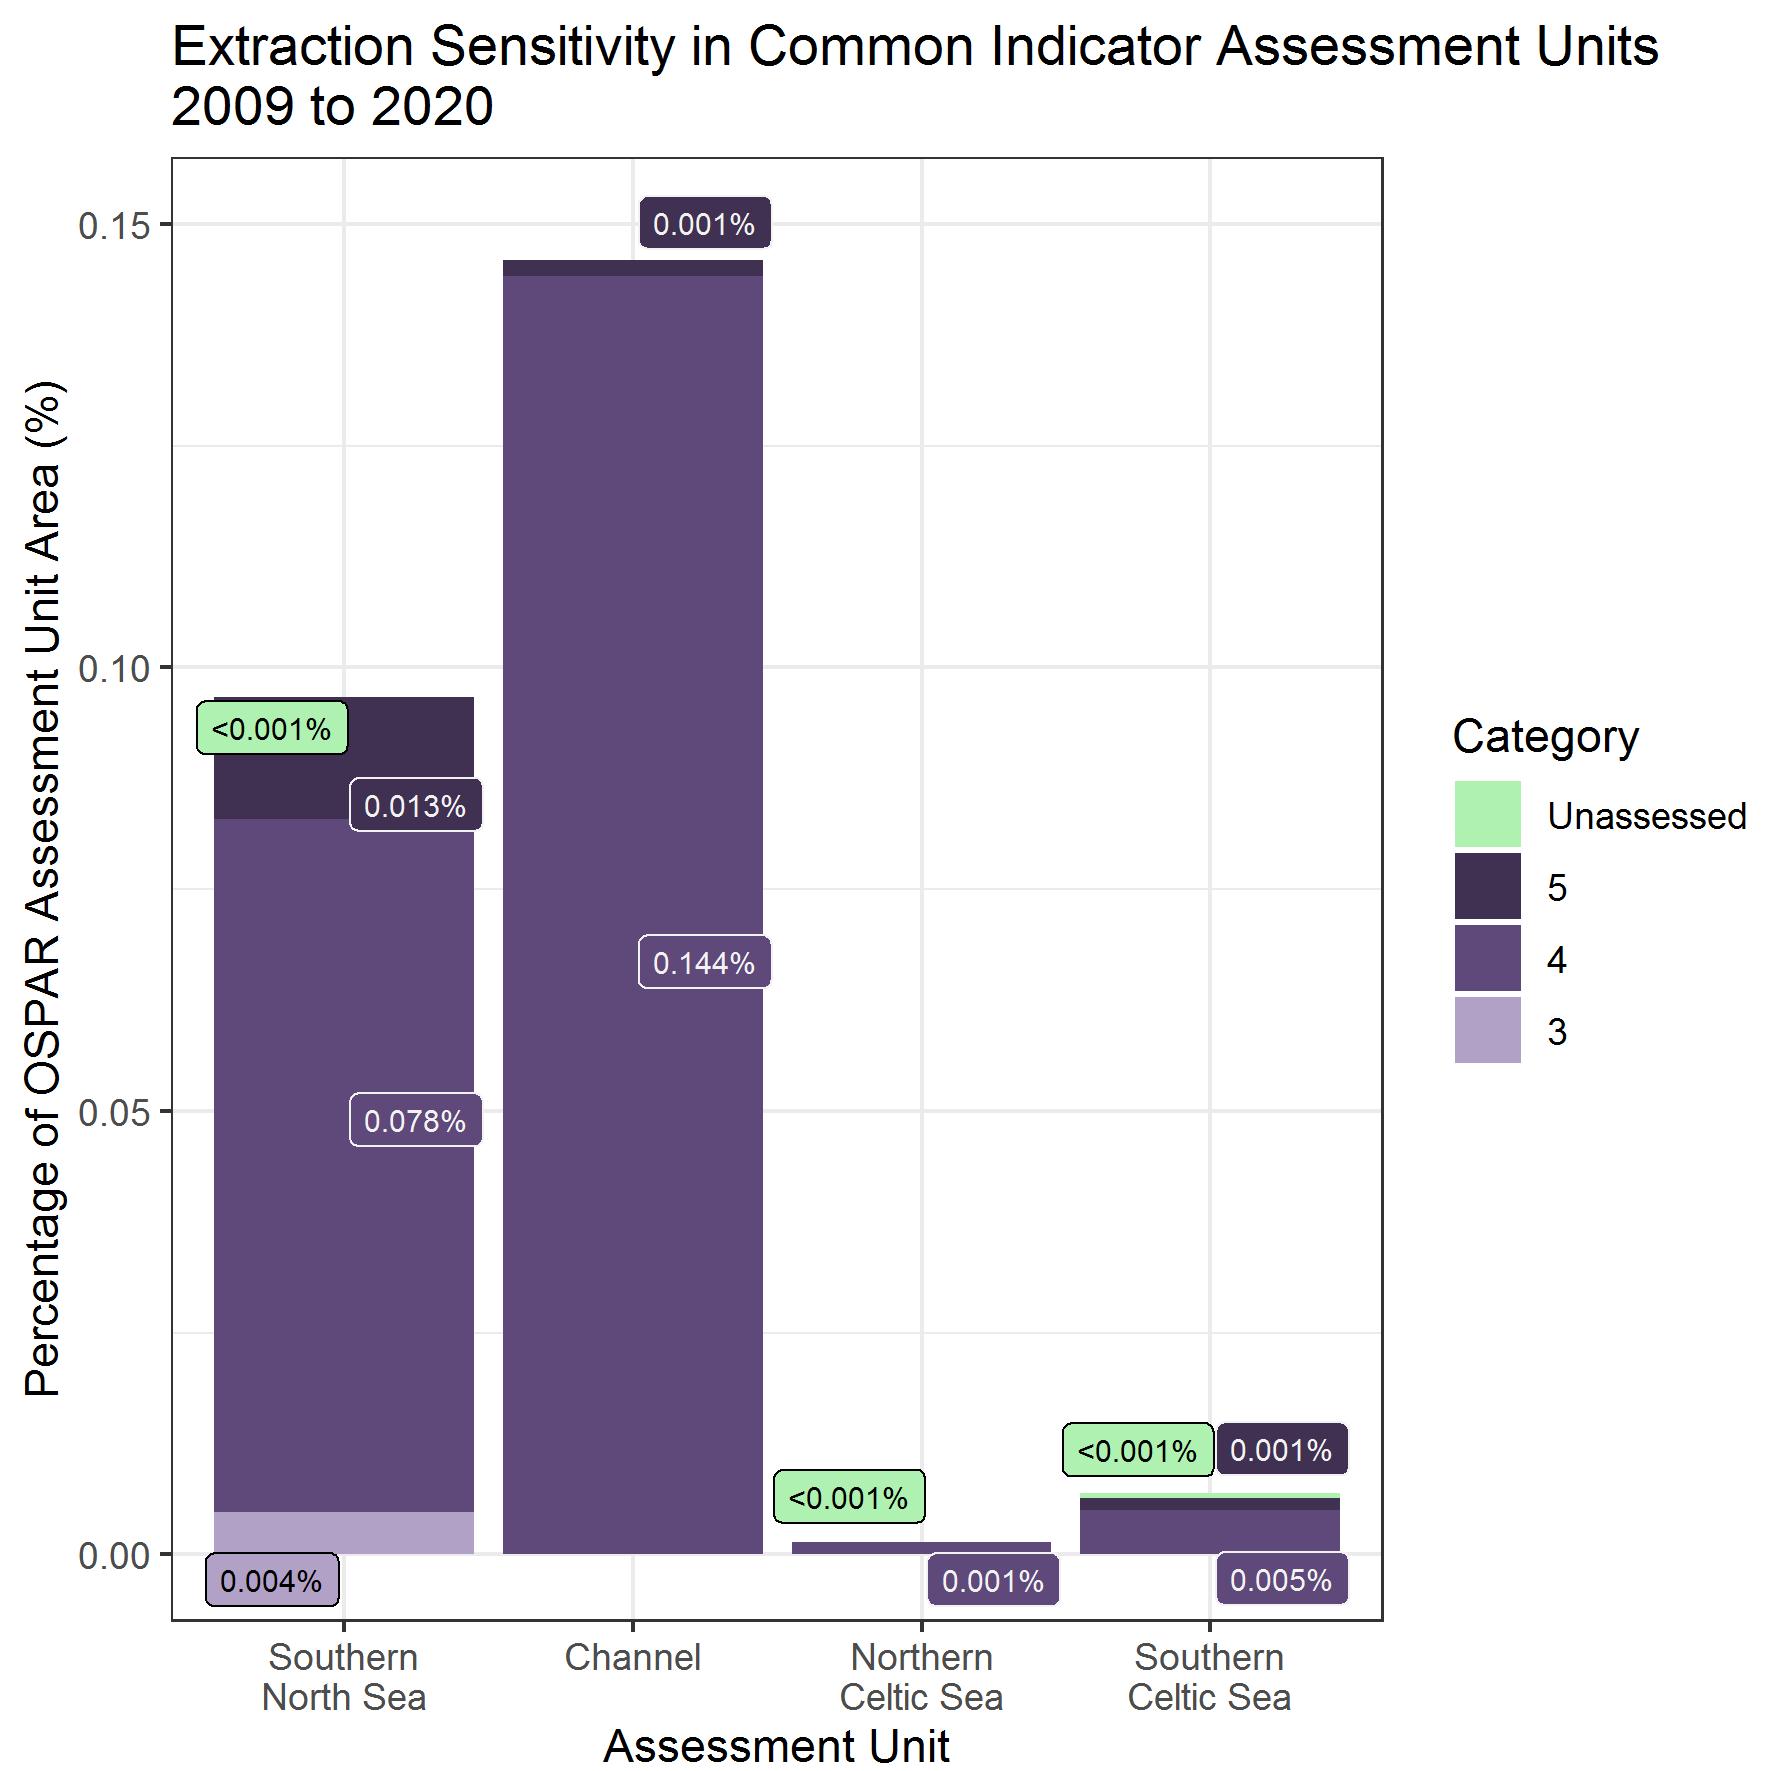
Figure v: Percentage of OSPAR Common Indicator Assessment Unit with extraction pressure
in the 2009 to 2020 assessment period for each extraction sensitivity category
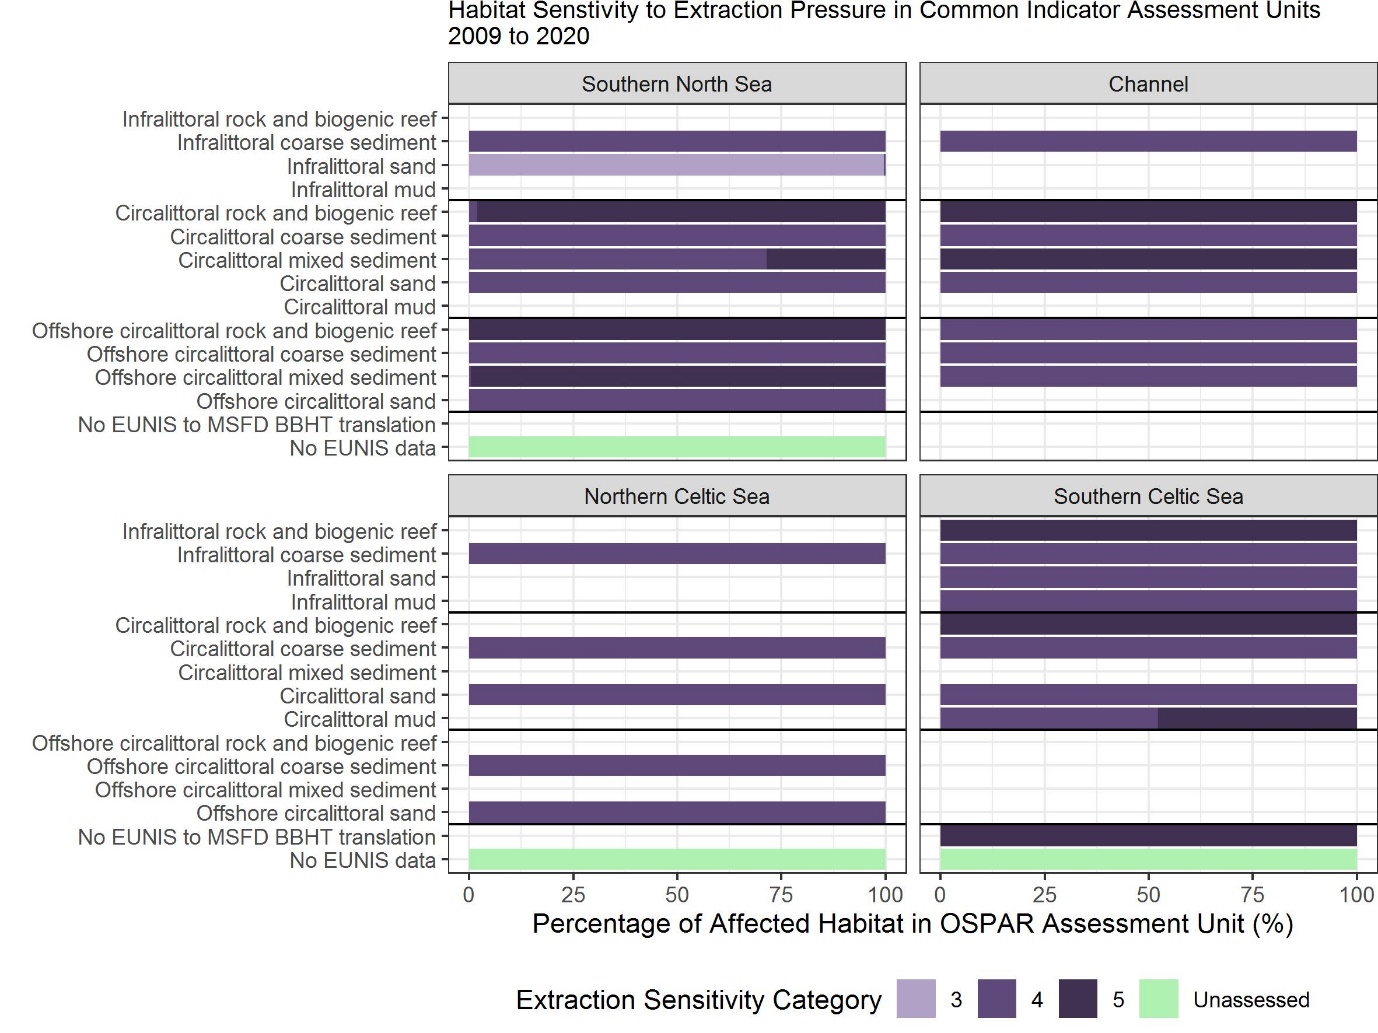
Figure w: Percentage of sensitivity categories for Broad Habitat Types in OSPAR Common Indicator Assessment Units with extraction pressure in the 2009 to 2020 assessment period
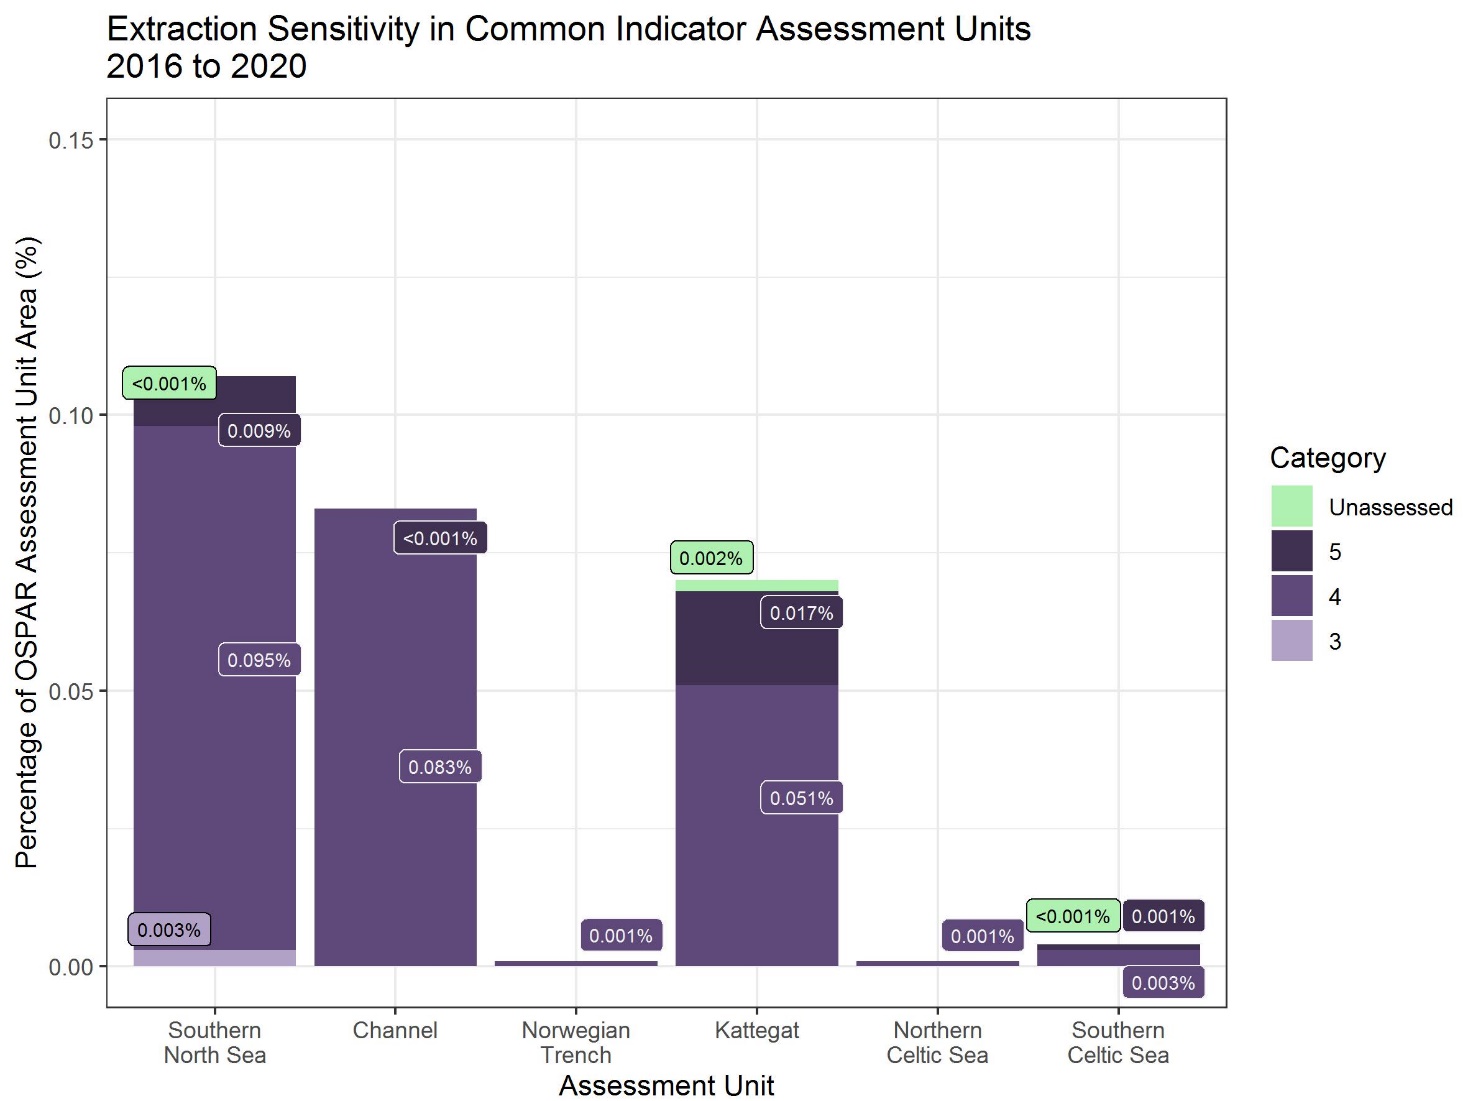
Figure x: Percentage of OSPAR Common Indicator Assessment Unit with extraction pressure
in the 2016 to 2020 assessment period for each extraction sensitivity category
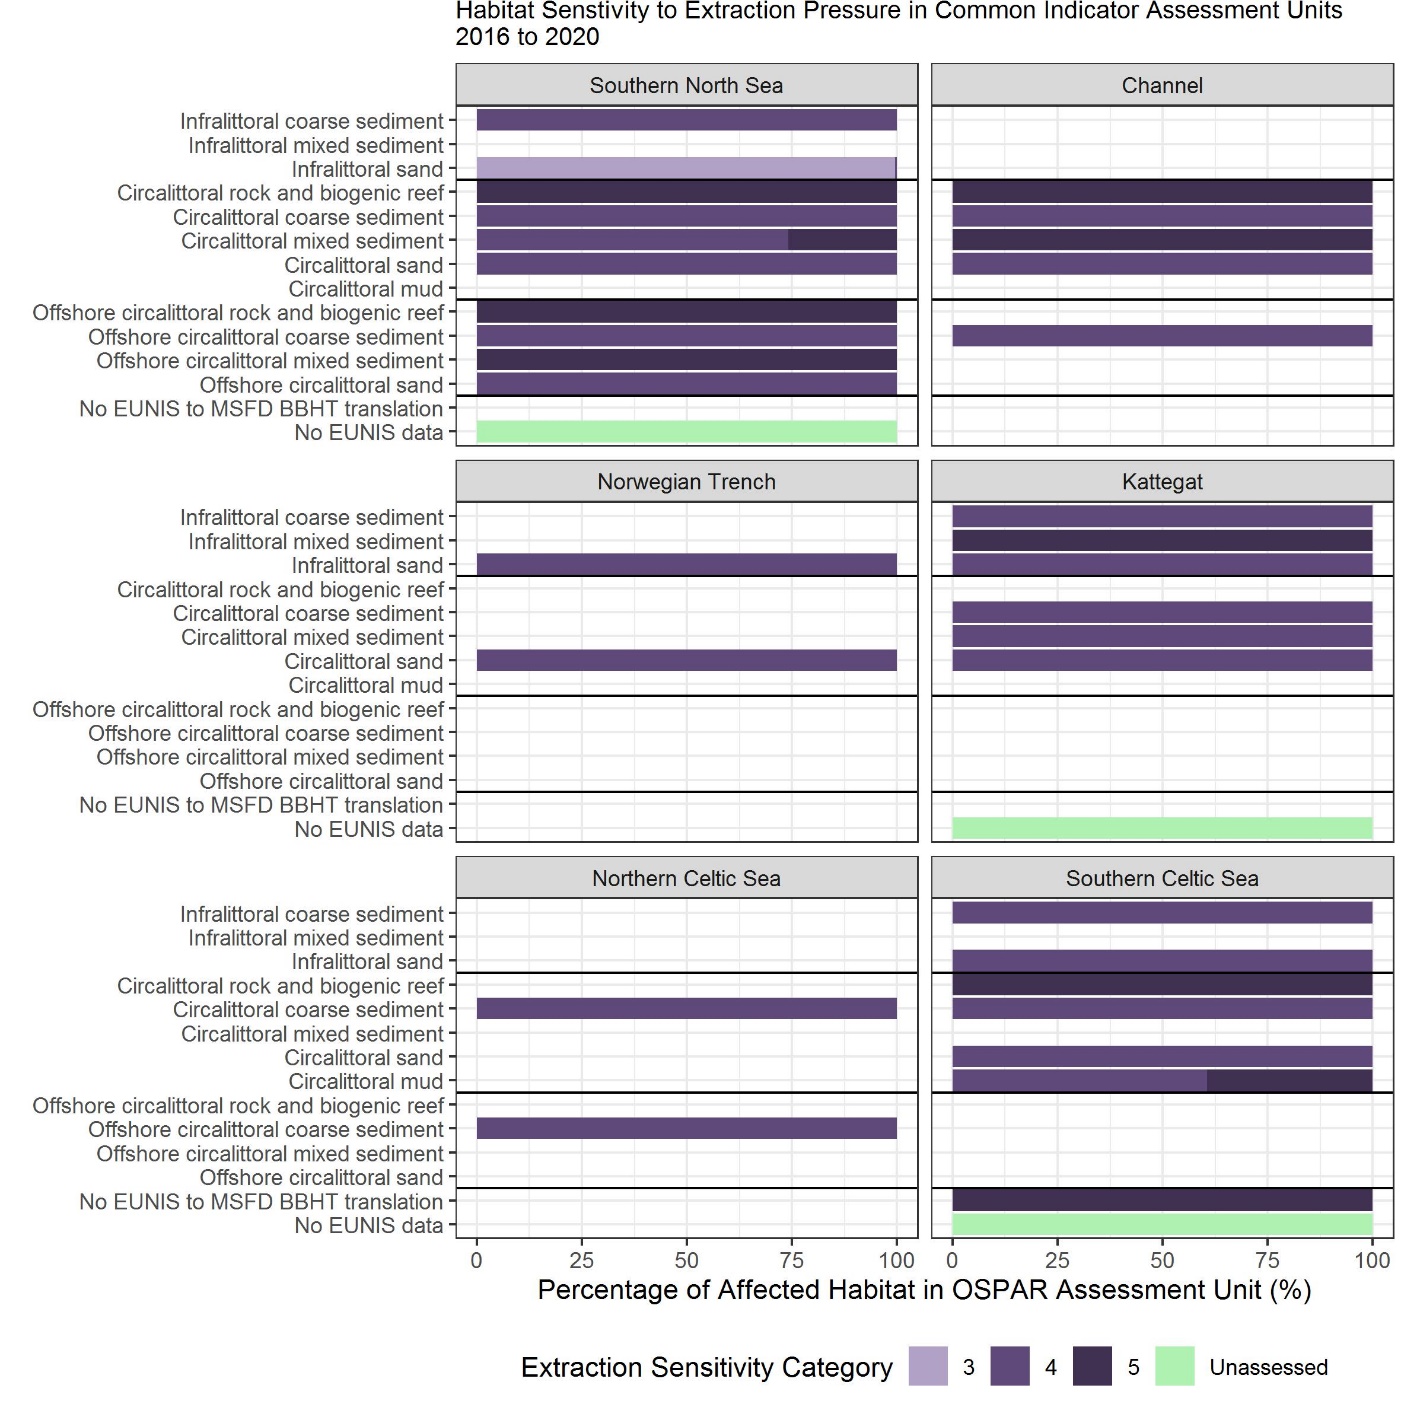
Figure y: Percentage of sensitivity categories for Broad Habitat Types in OSPAR Common Indicator Assessment Units with extraction pressure in the 2016 to 2020 assessment period
Pressure
2009 to 2020:
The overall proportion of each assessment unit with extraction pressure was low, (less than 0,15%) for the 2009 to 2020 assessment period (Figure z to Figure ad); particularly in the larger assessment units (Northern and Southern Celtic Seas, both less than 0,01%). The Channel had the largest proportion of assessment unit with extraction pressure; though it should also be noted the Channel was the smallest assessment unit assessed for the 2009 to 2020 assessment period.
Aggregated extraction pressure in the QSR assessment period had instances of all five pressure categories in the Southern North Sea, Channel and Southern Celtic Sea. The proportion of assessment unit area with extraction pressure category 2 was low when compared to other categories and was absent in the Northern Celtic Sea in the 2009 to 2020 assessment period. The Channel had the greatest proportion of area with category 5 pressure (0,05%), approximately one third of the area with pressure for the 2009 to 2020 assessment period (Figure ad).
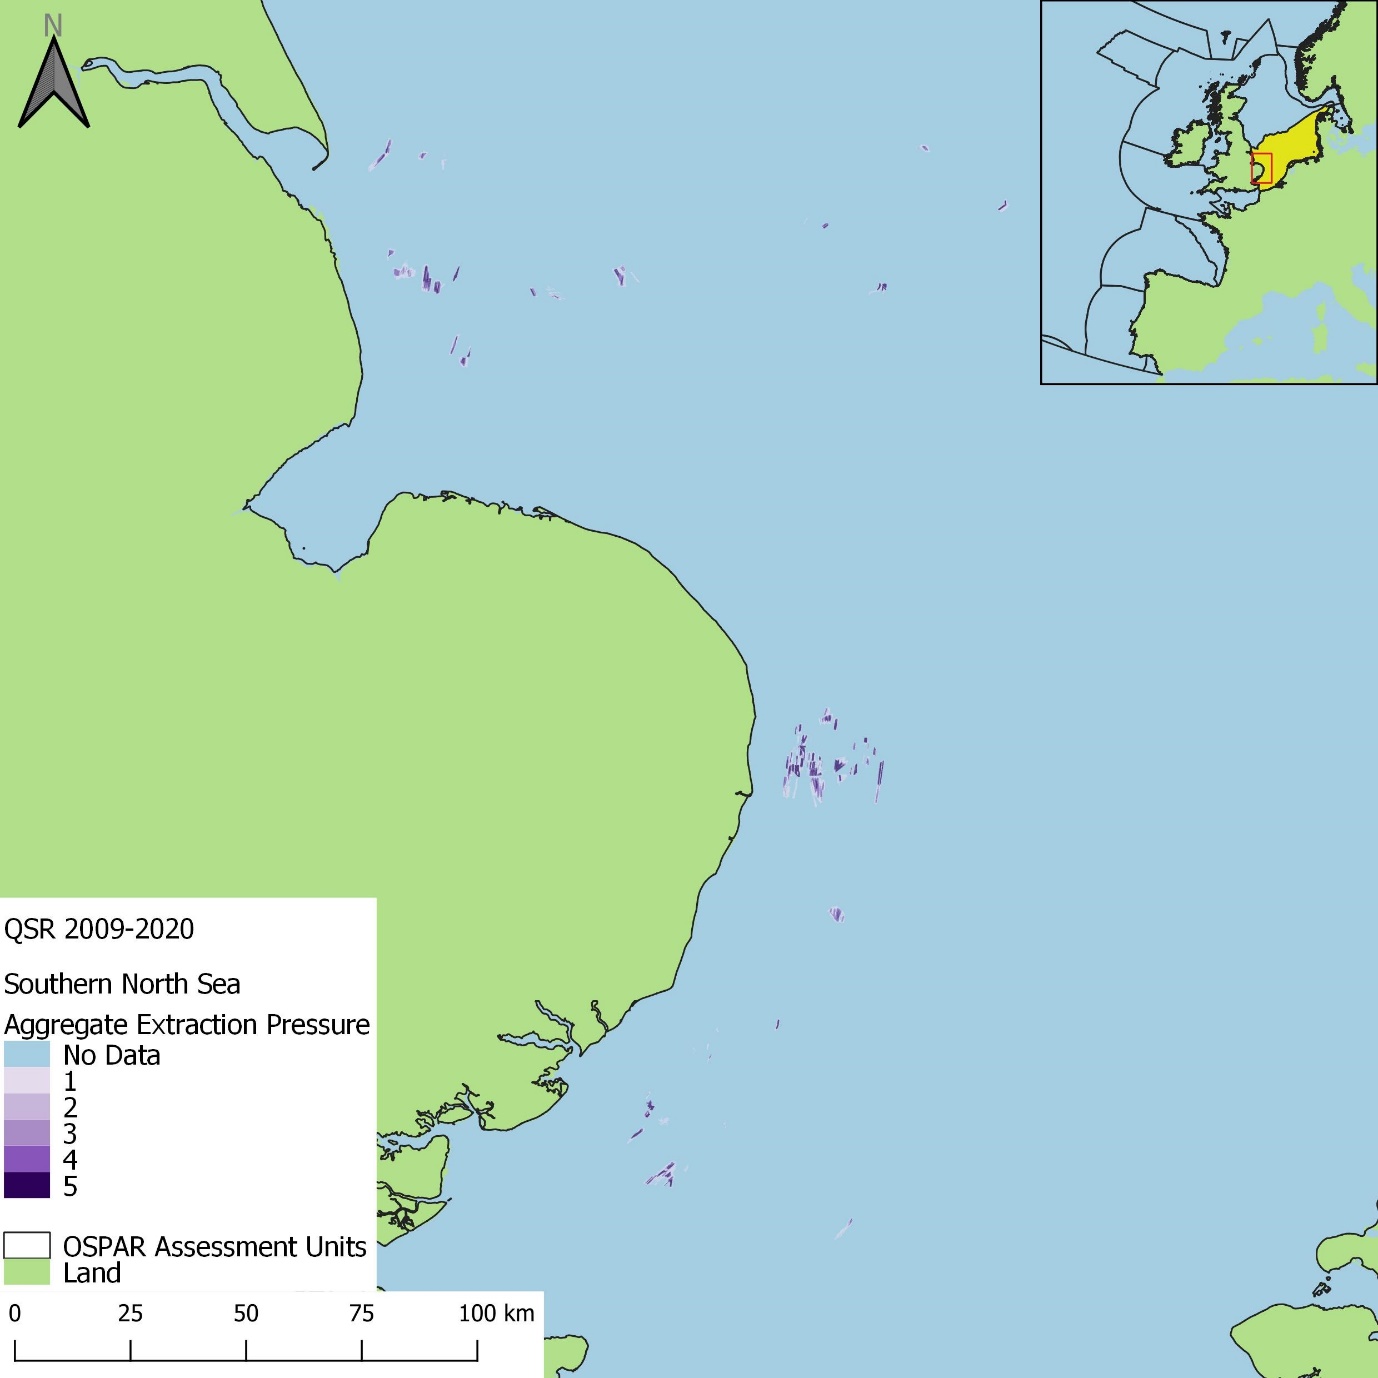
Figure z: Aggregated extraction pressure in the 2009 to 2020 assessment period, within the Southern North Sea assessment unit

Figure ab: Aggregated extraction pressure in the 2009 to 2020 assessment period, within the Northern Celtic Sea assessment unit
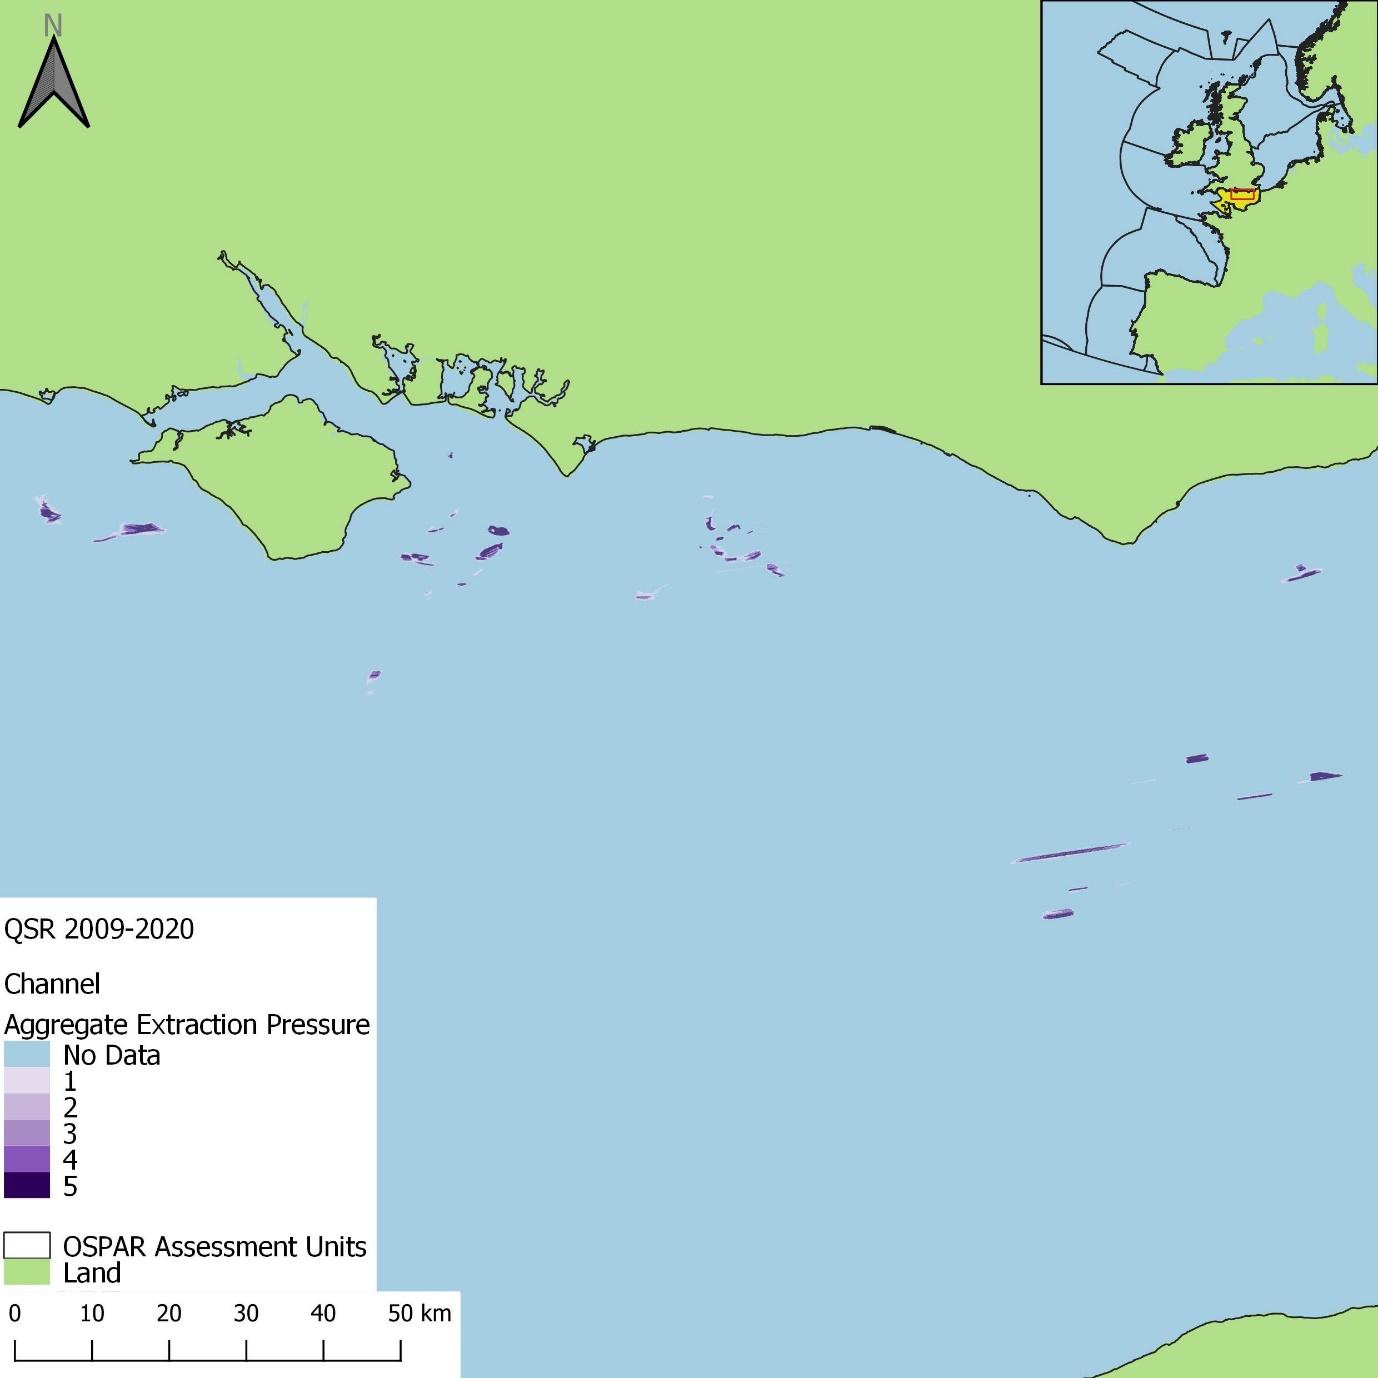
Figure aa: Aggregated extraction pressure in the 2009 to 2020 assessment period, within the Channel assessment unit
Figure ac: Aggregated extraction pressure in the 2009 to 2020 assessment period, within the Southern Celtic Sea assessment unit
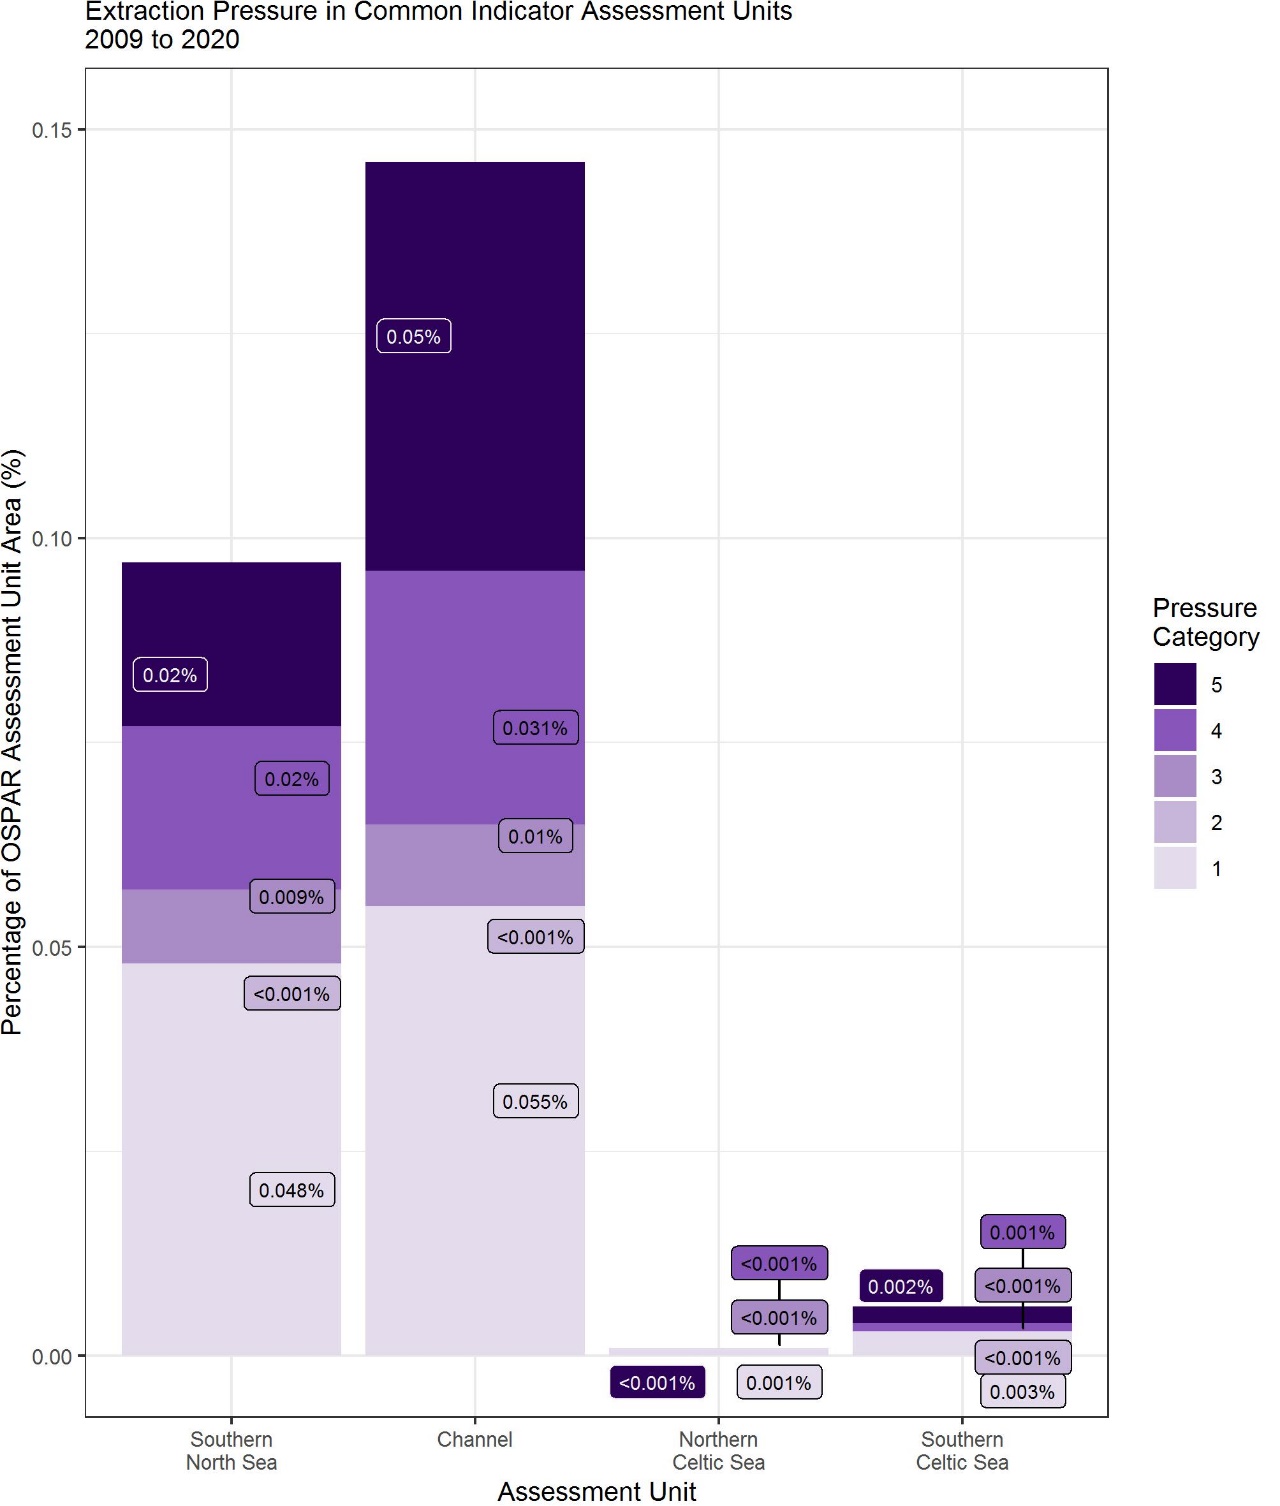
Figure ad: Percentage of OSPAR Common Indicator Assessment Unit with extraction pressure in the 2009 to 2020 assessment period
Sublittoral biogenic reefs had the largest proportion of habitat with extraction pressure (Figure ae). Only Offshore circalittoral rock and biogenic reef had extraction pressure in more than 1% of its area within an assessment unit; this occurred in the Southern North Sea (greater than 4% of habitat area; Figure af). The relatively large proportion of Offshore circalittoral rock and biogenic reef under extraction pressure in the Southern North Sea could be due to a smaller proportion of rock habitats and greater proportion of biogenic habitats in the Southern North Sea, than in the Southern Celtic Sea (both rock and biogenic habitats translate from multiple EUNIS codes to the same MSFD BHT). In the Channel and the Northern Celtic Sea, Circalittoral coarse sediment was the habitat with the greatest proportion of habitat area under extraction overall pressure; Circalittoral sand had the greatest proportion of pressure within the Southern Celtic Sea (Figure af).
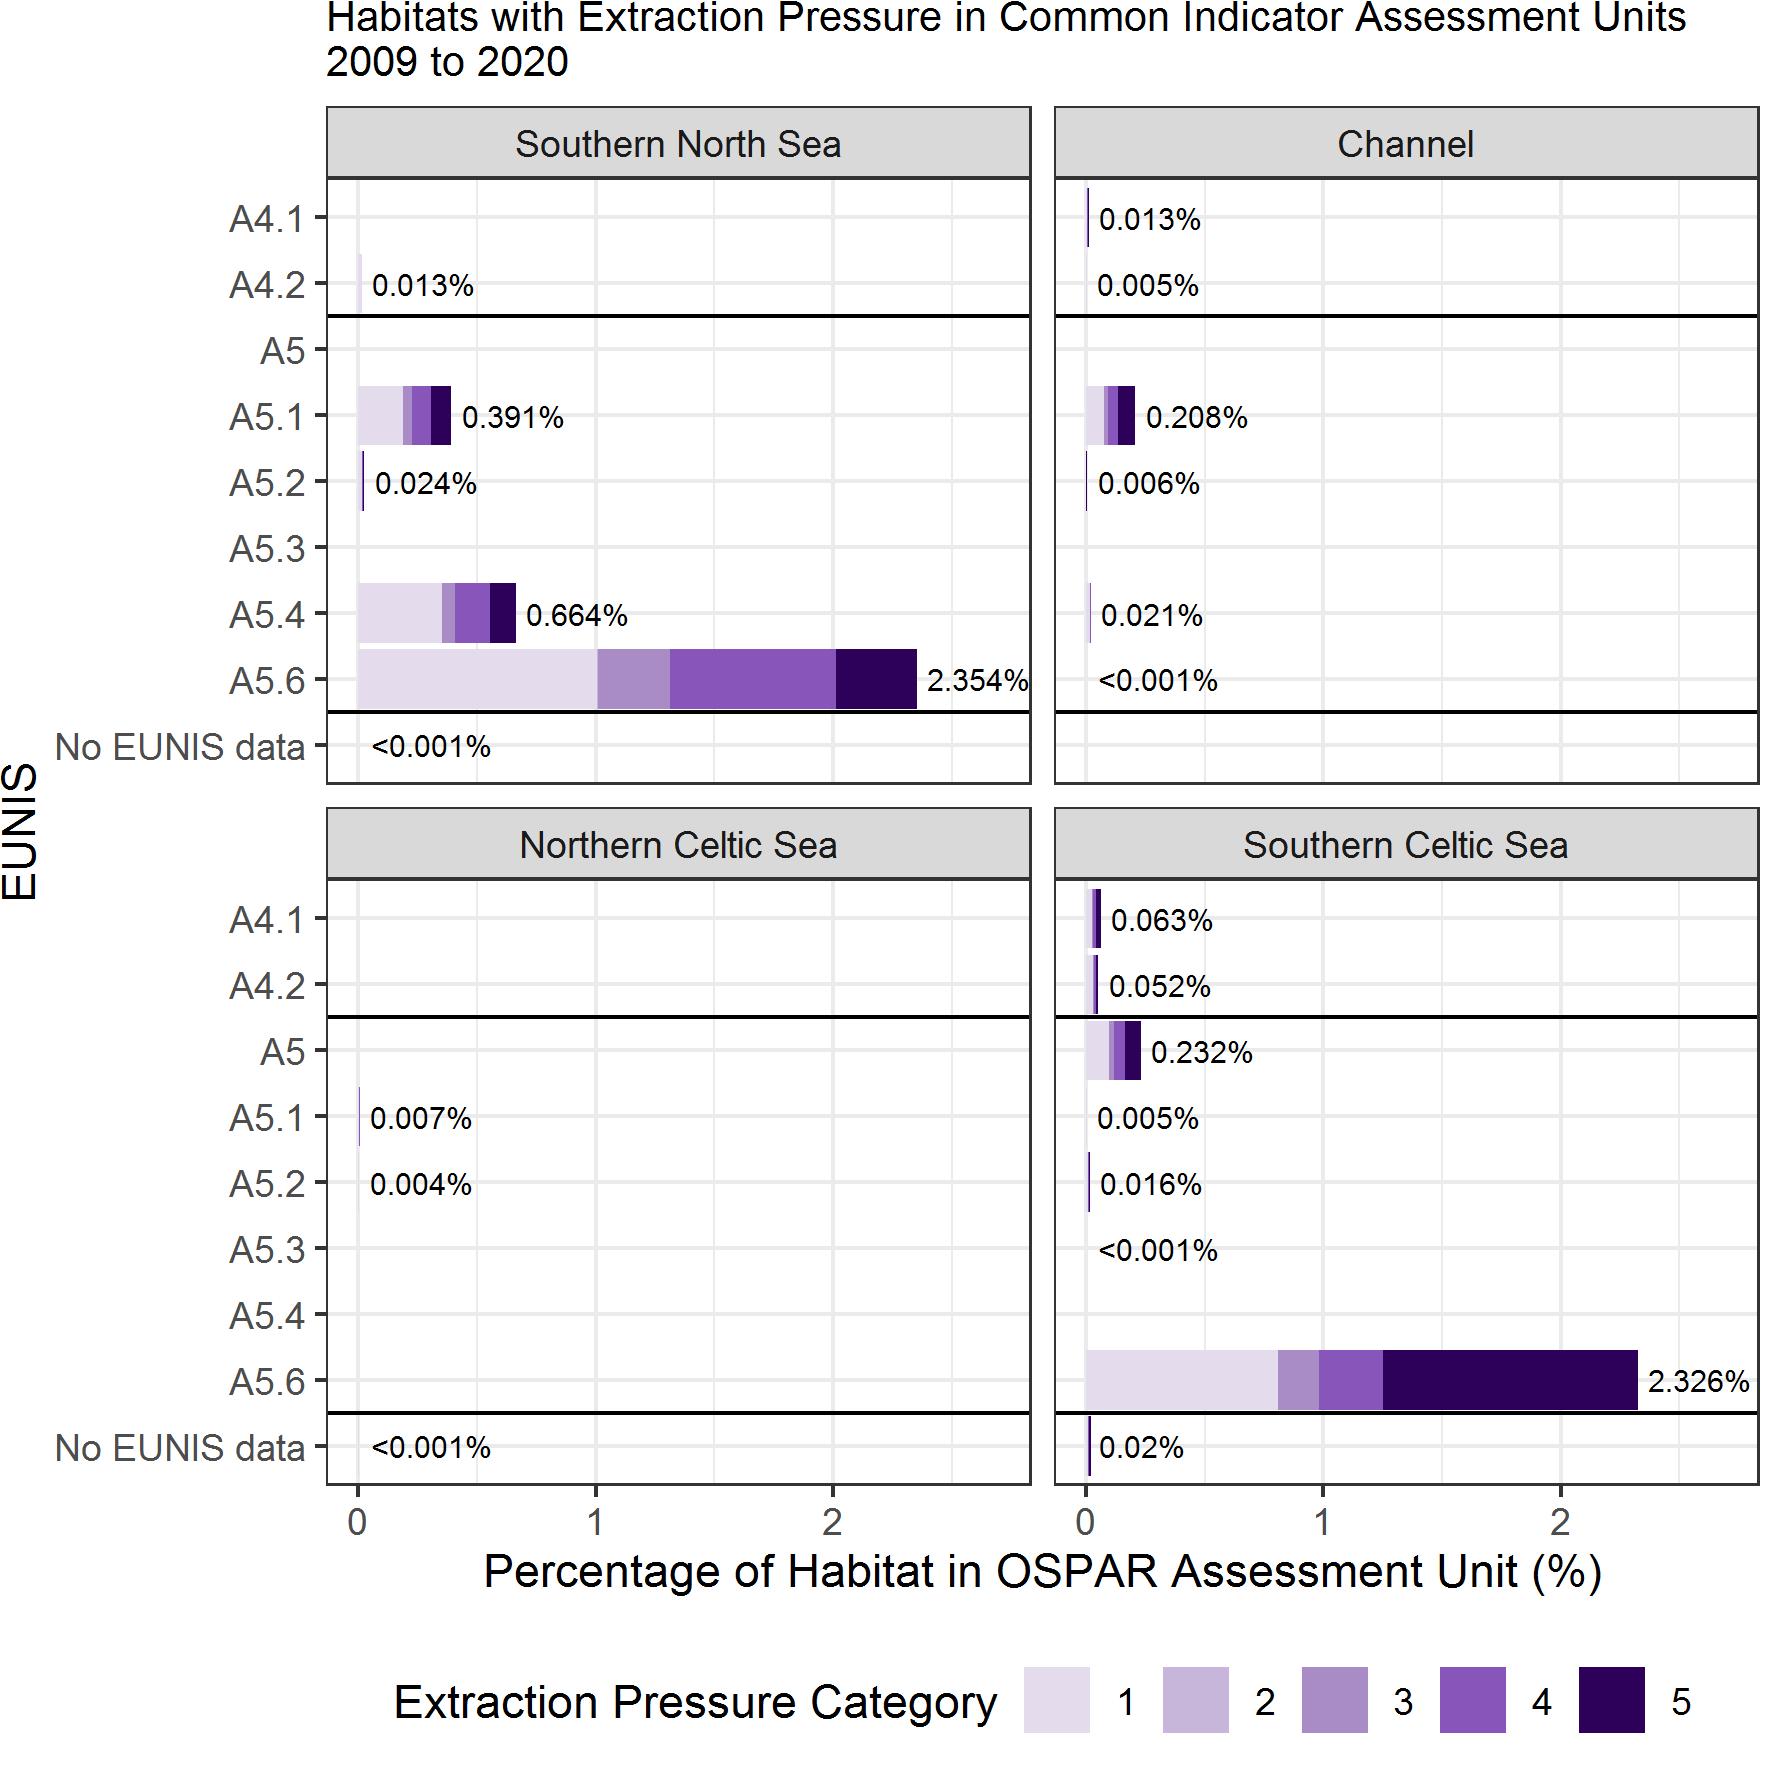
Figure ae: The percentage of EUNIS Level 3 habitat in OSPAR Common Indicator Assessment Units with extraction pressure in the 2009 to 2020 assessment period
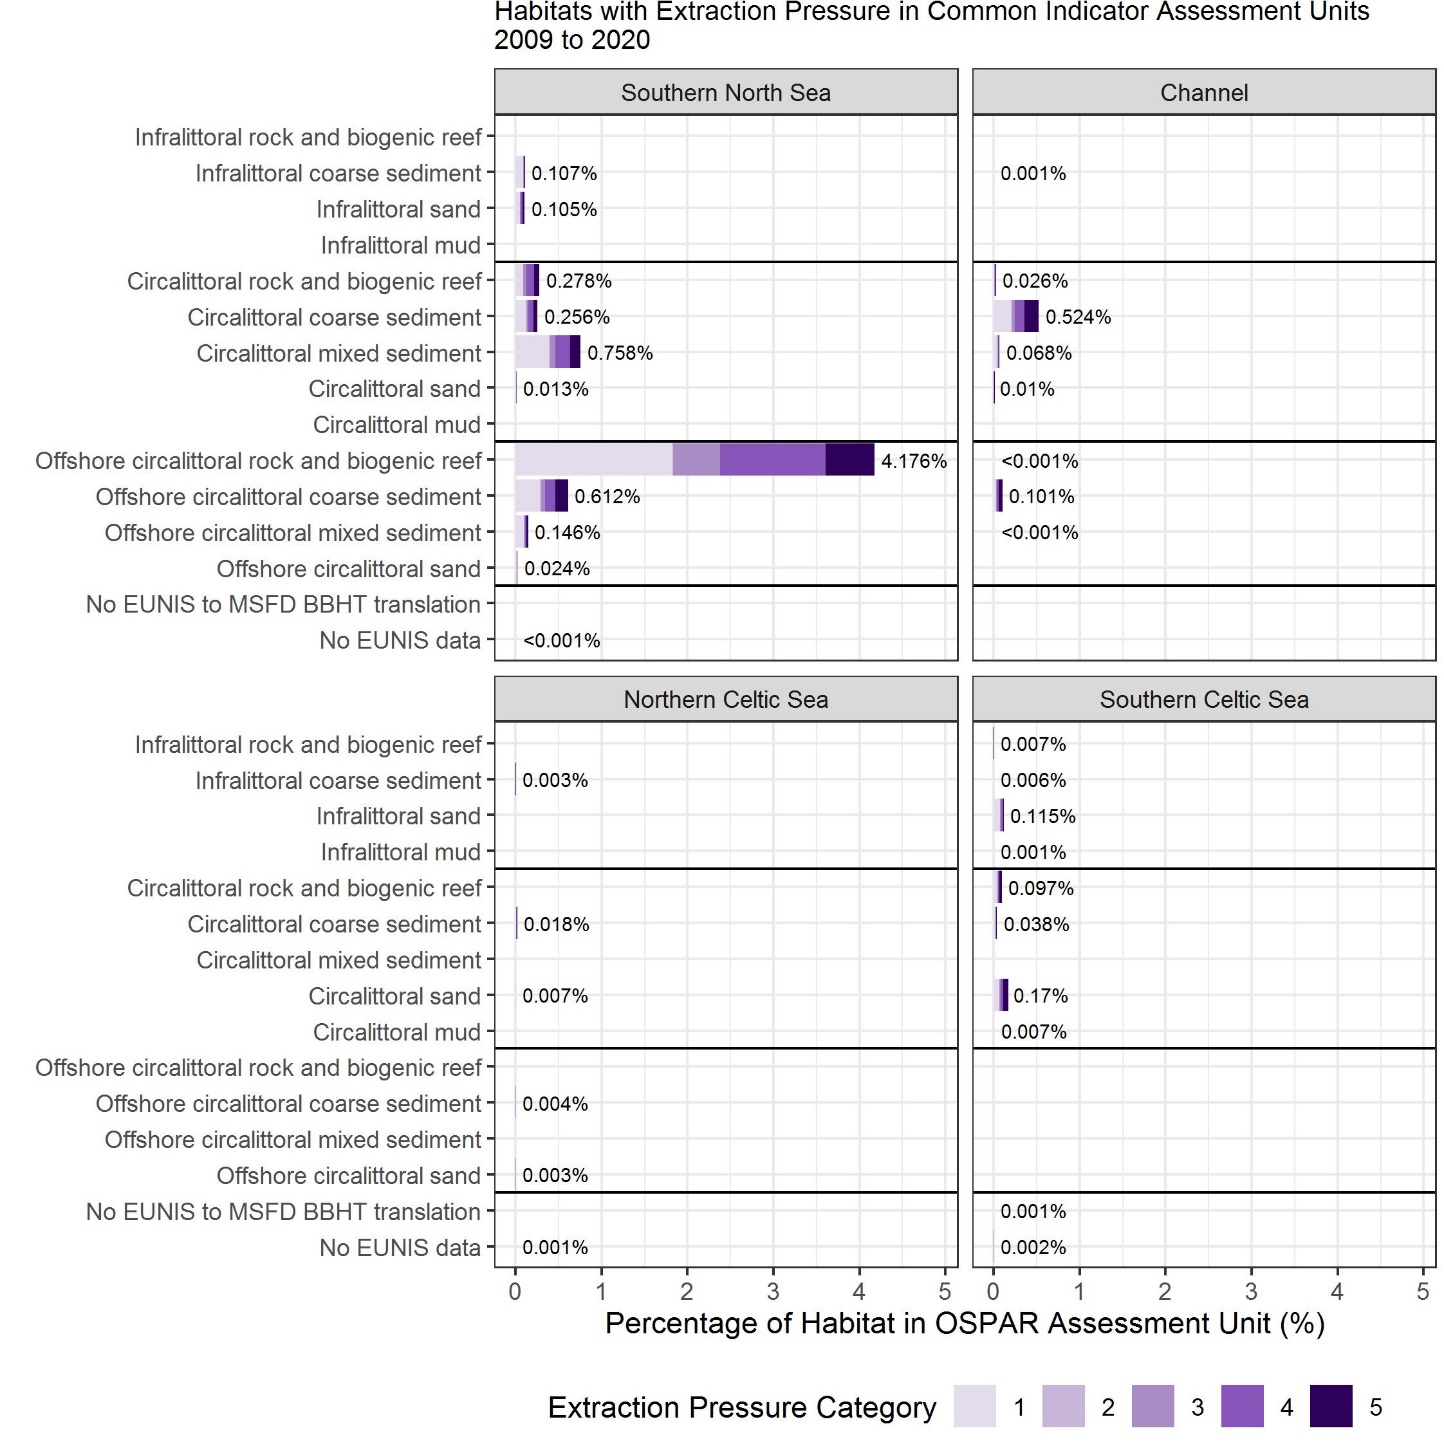
Figure af: The percentage of Broad Habitat Types in OSPAR Common Indicator Assessment Units with extraction pressure in the 2009 to 2020 assessment period
In the 2009 to 2020 assessment, extraction pressure showed widespread variability throughout assessed areas within assessment units (Figure ag to Figure aj). Extraction pressure was predominantly ‘Variable’, with the exception of the Northern Celtic Sea which had equal amounts of ‘Variable’ and ‘Non-variable’ pressure (0,001%; Figure ak). The Channel was the only assessment unit with ‘Consistent’ high pressure (categories 4 and 5) recorded for the 2009 to 2020 assessment period, therefore, no other assessment unit could be assessed in this way (Figure al).
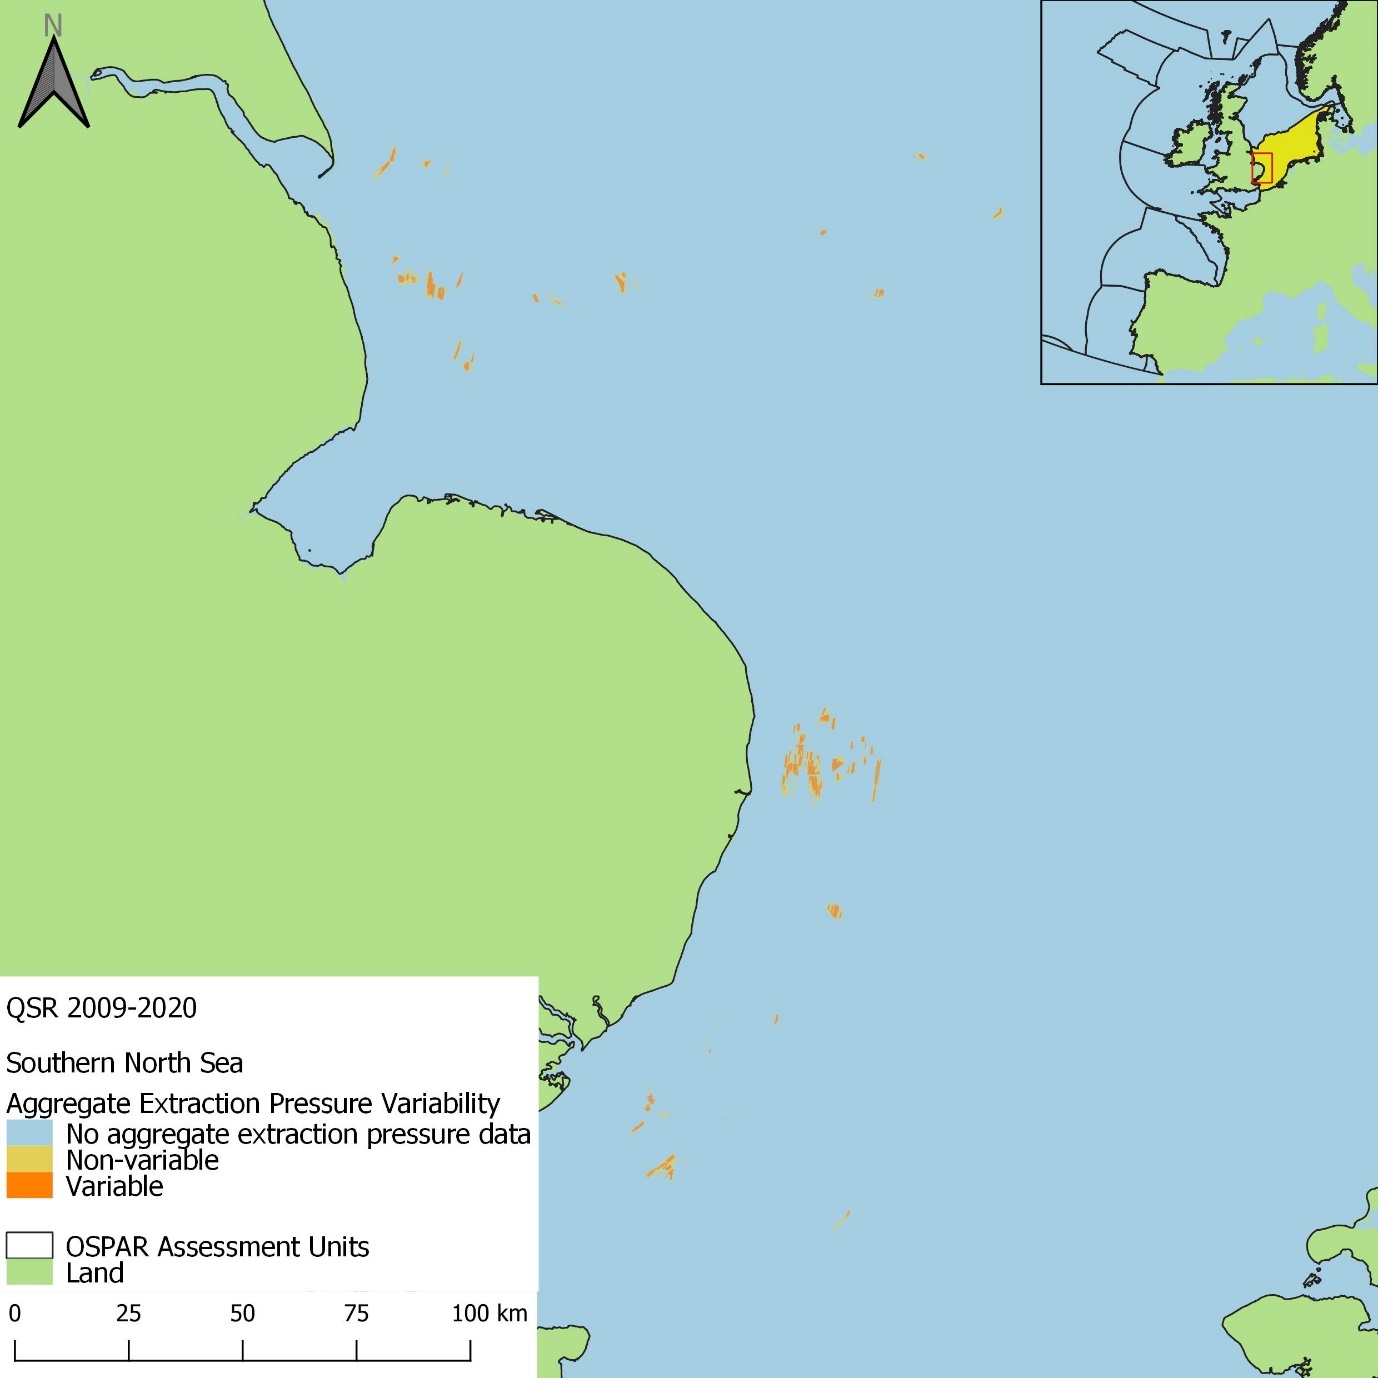
Figure ag: Spatial distribution of ‘Variable’ and ‘Non-variable’ extraction pressure in the 2009 to 2020 assessment period in the Southern North Sea assessment unit. Grid cells were categorised ‘Variable’ if a range of three or more pressure categories was observed throughout the time series

Figure ai: Spatial distribution of ‘Variable’ and ‘Non-variable’ extraction pressure in the 2009 to 2020 assessment period in the Northern Celtic Sea assessment unit. Grid cells were categorised ‘Variable’ if a range of three or more pressure categories was observed throughout the time series
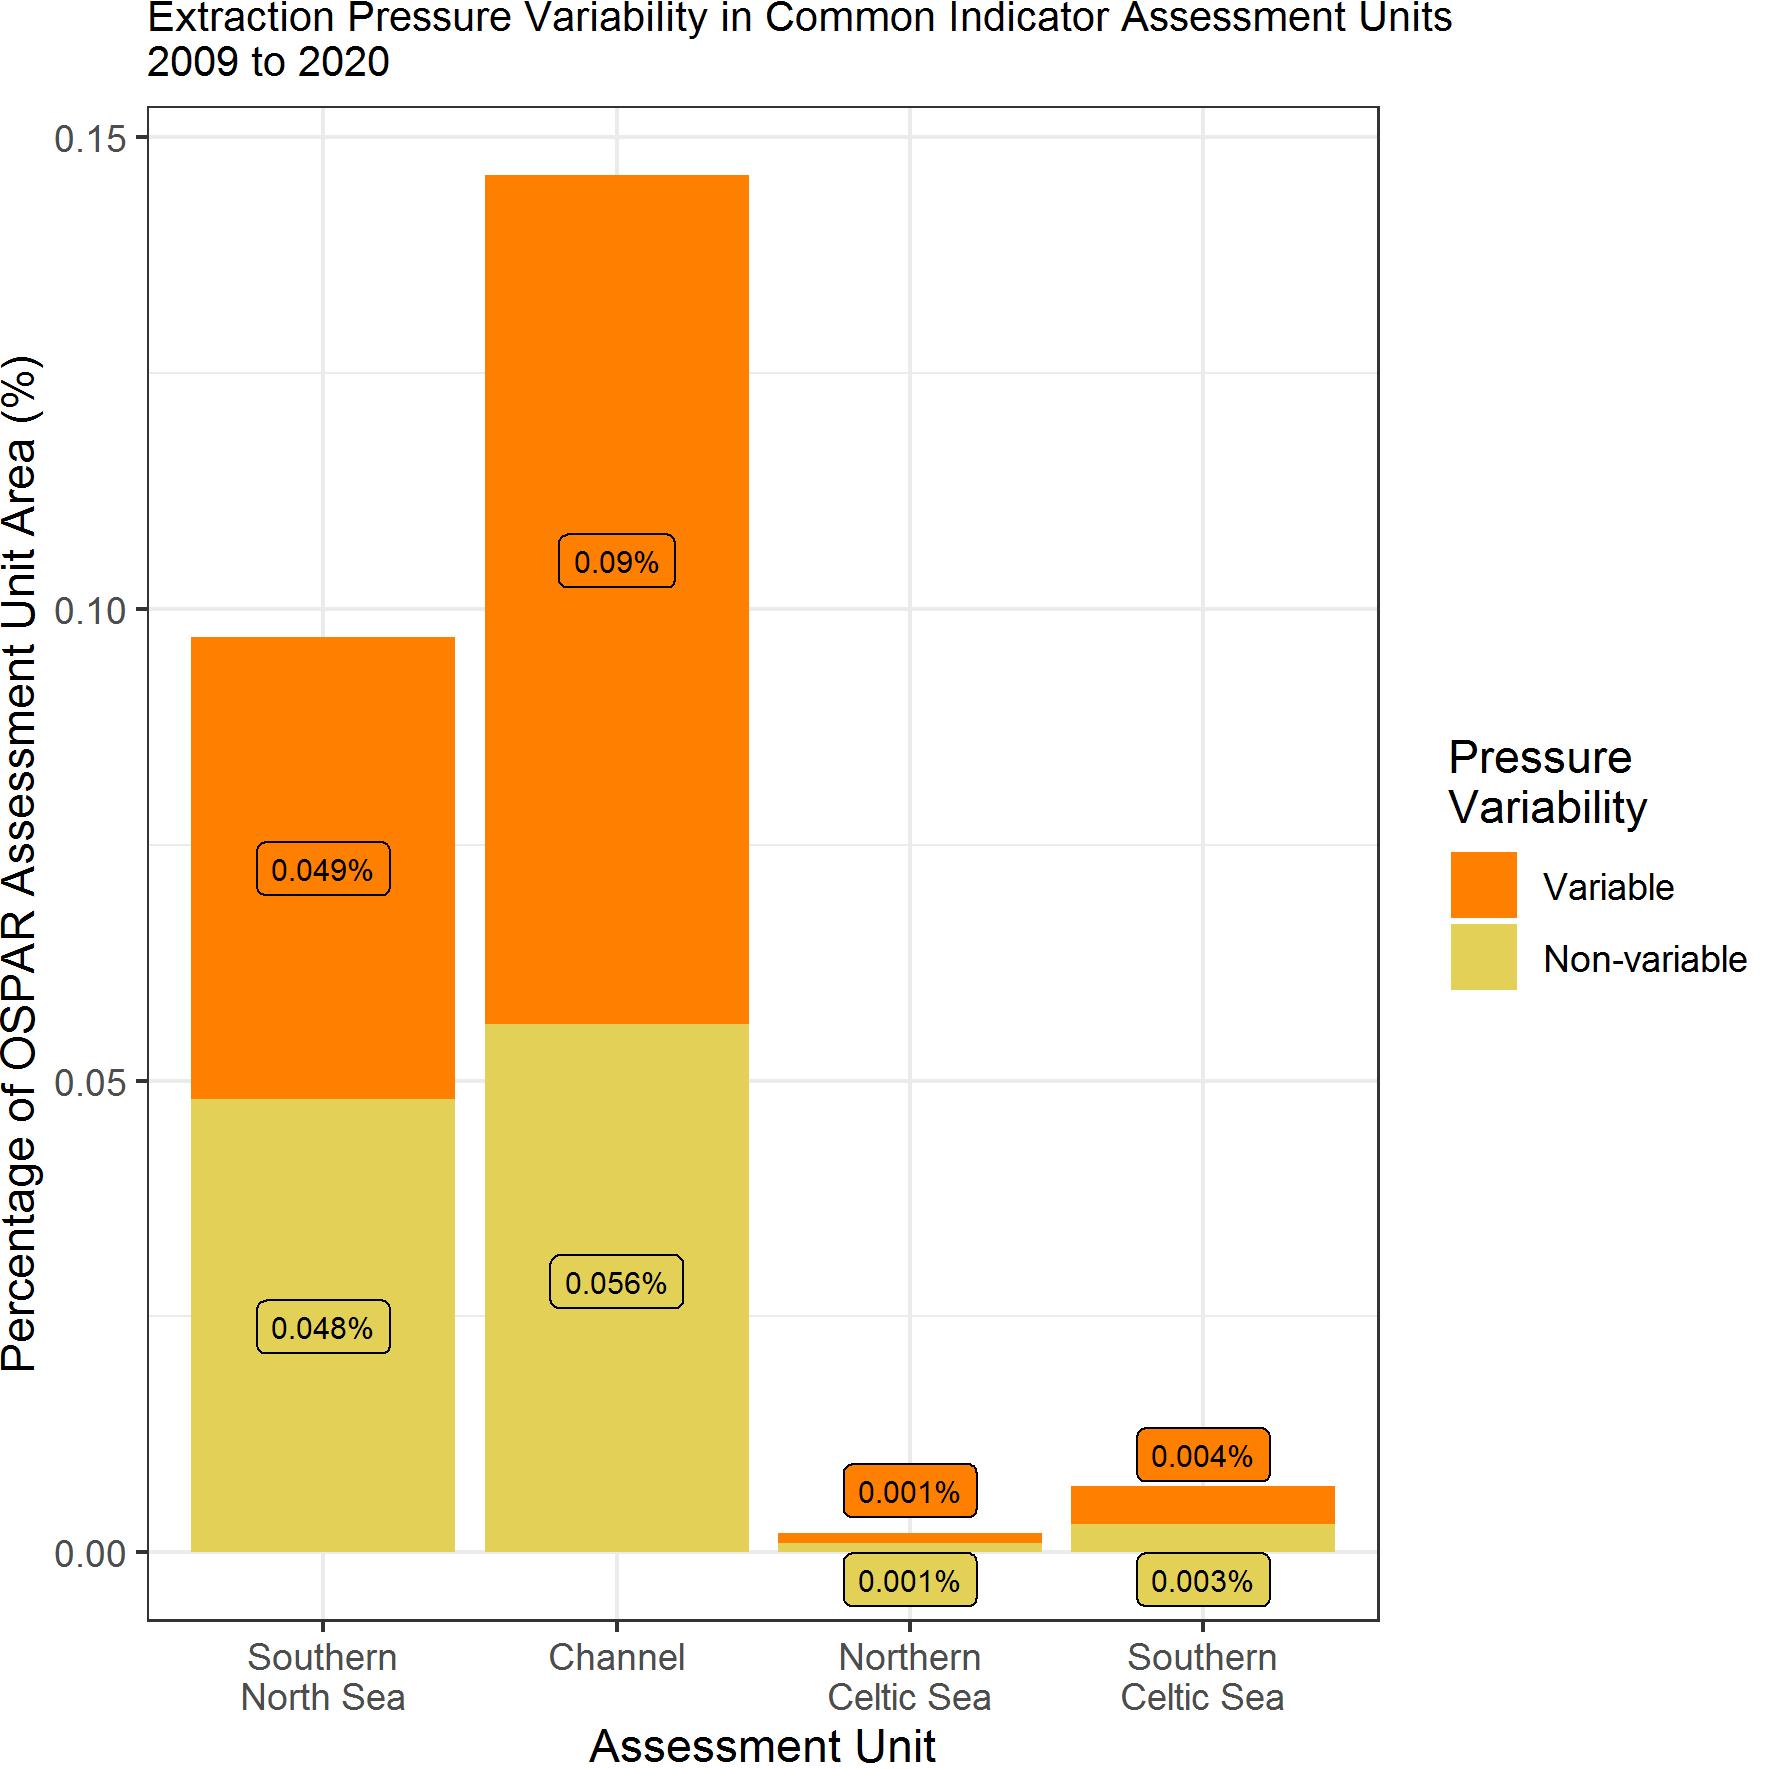
Figure ak: Percentage of OSPAR Common Indicator Assessment Unit with ‘Non-variable’ or ‘Variable’ pressure in the 2009 to 2020 assessment period; cells were categorised ‘Variable’ if a range of three or more pressure categories was observed throughout the time series
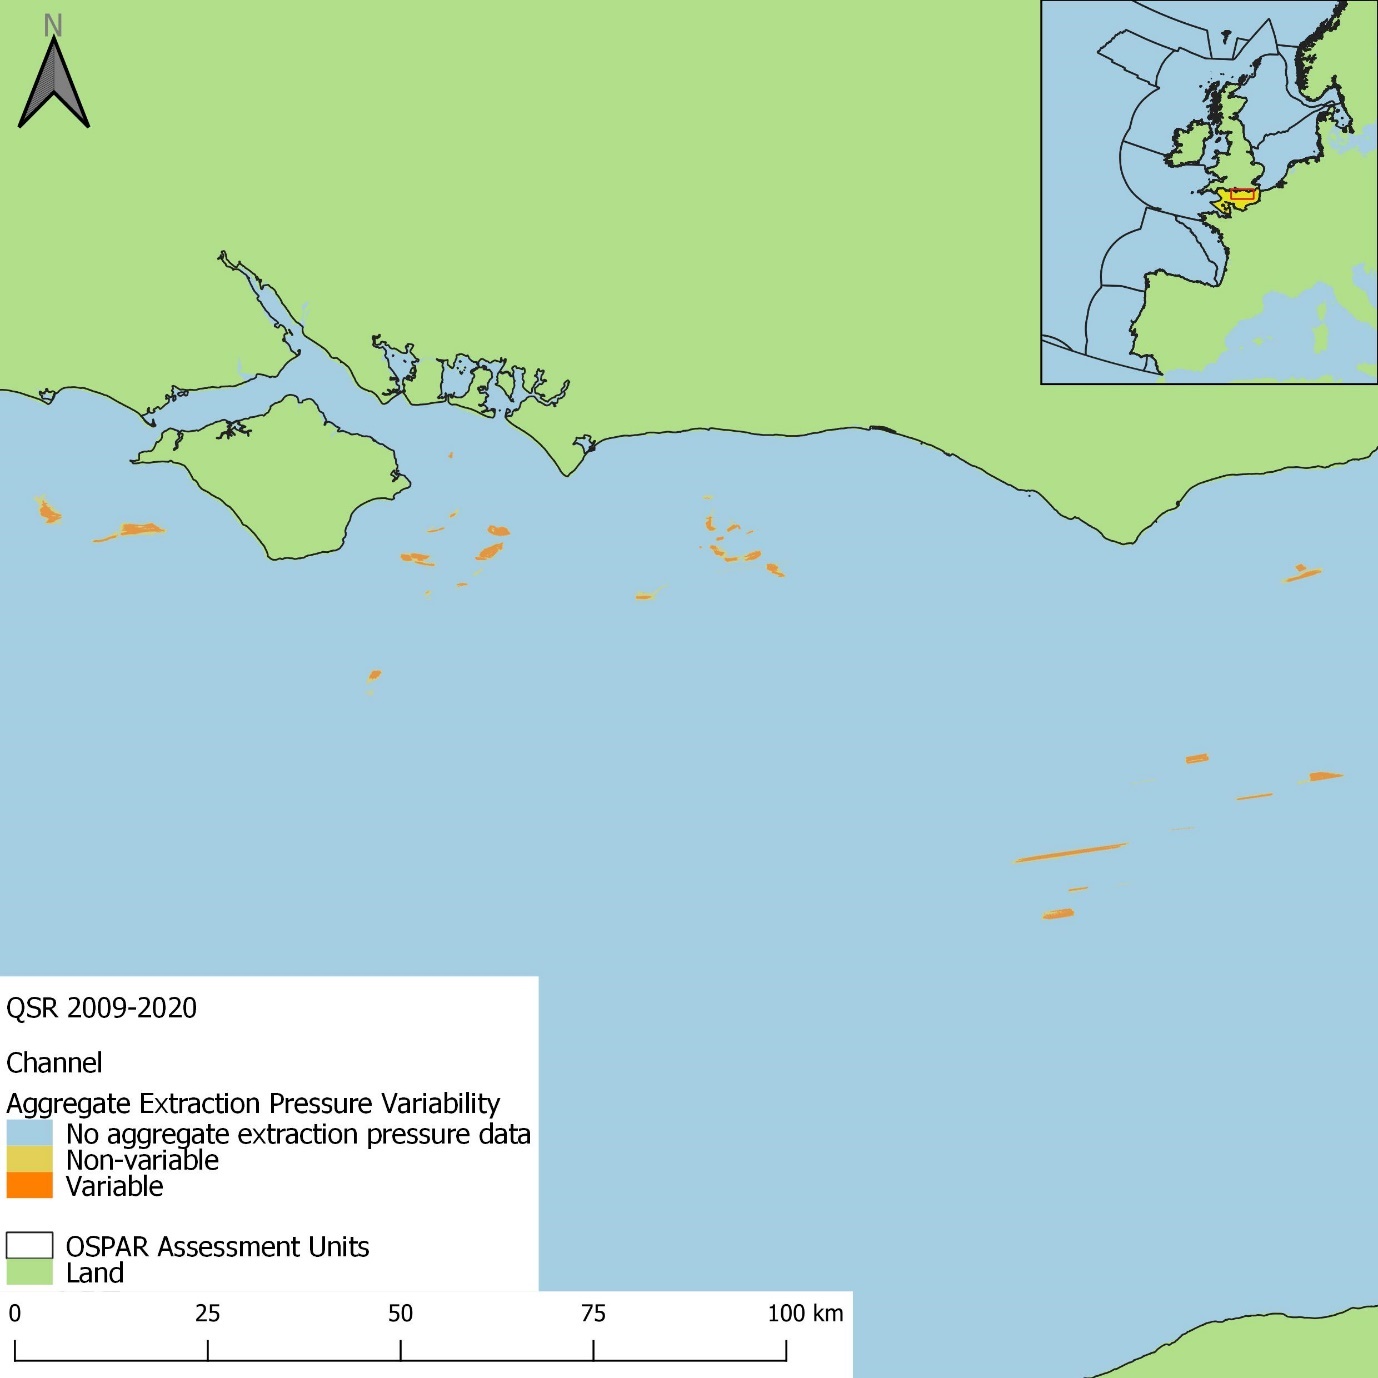
Figure ah: Spatial distribution of ‘Variable’ and ‘Non-variable’ extraction pressure in the 2009 to 2020 assessment period in the Channel assessment unit. Grid cells were categorised ‘Variable’ if a range of three or more pressure categories was observed throughout the time series
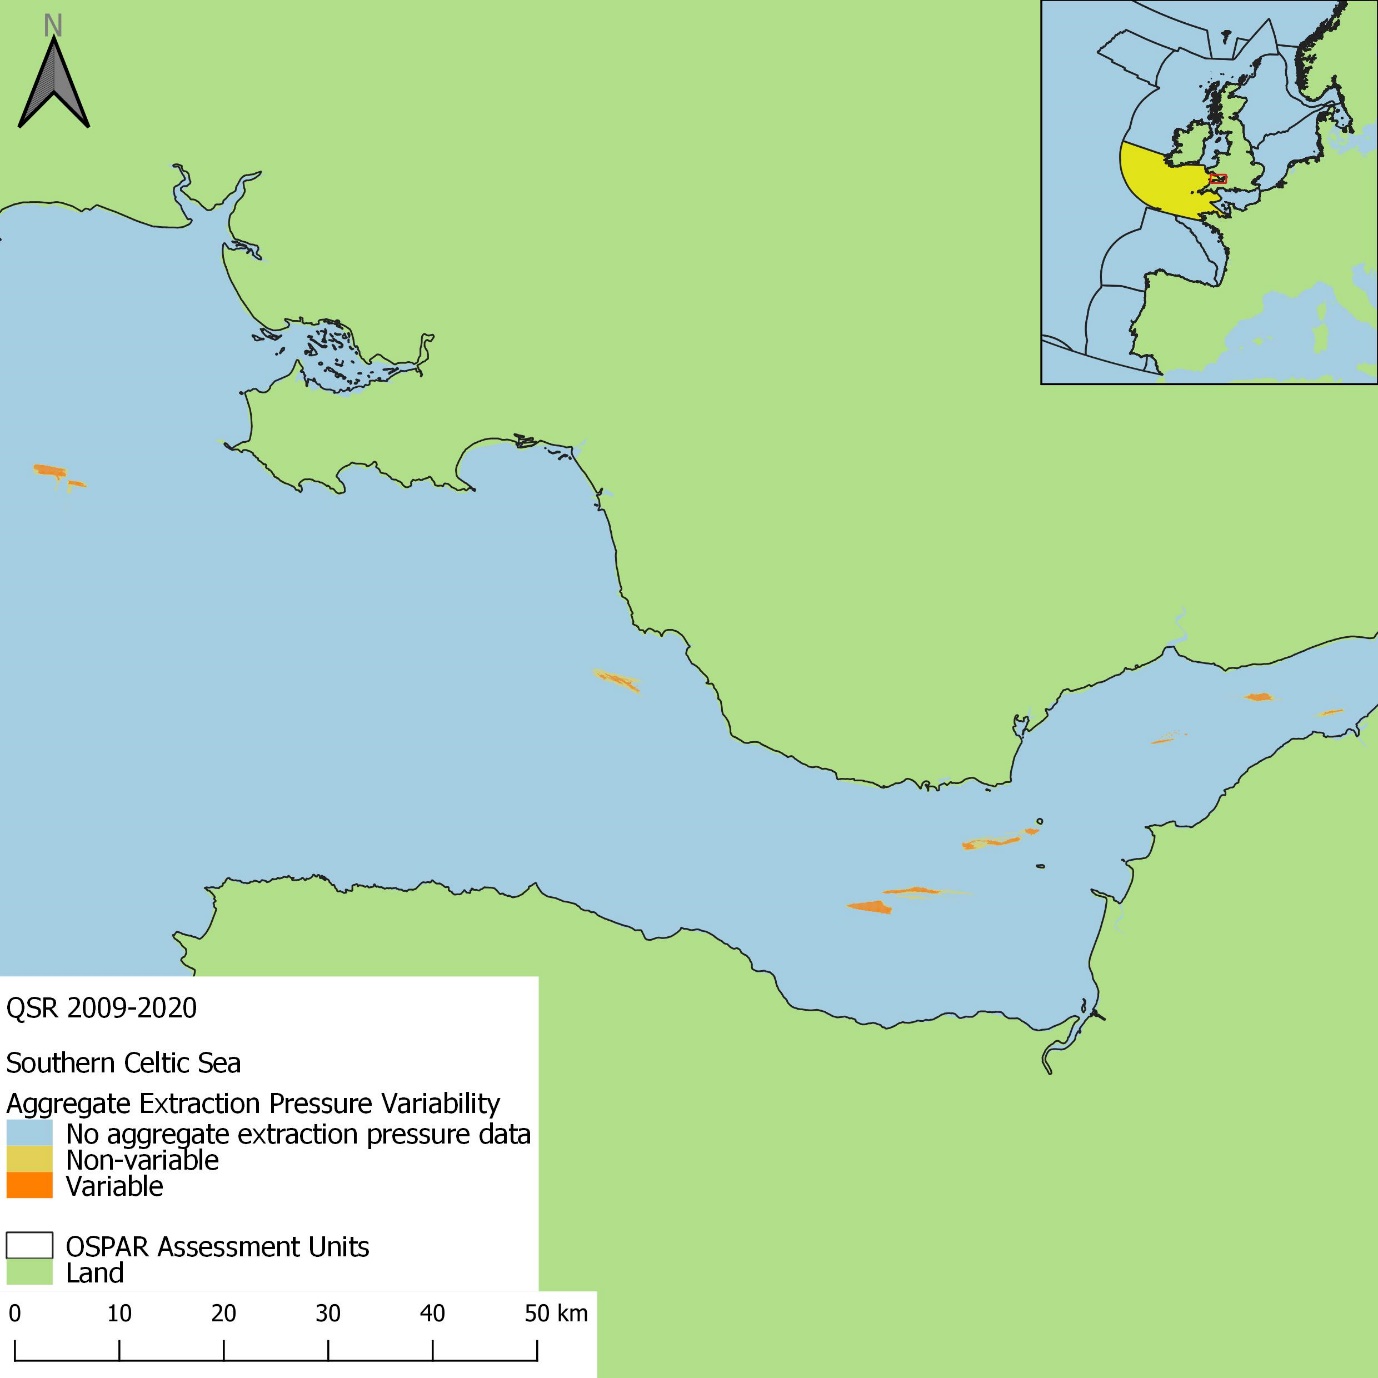
Figure aj: Spatial distribution of ‘Variable’ and ‘Non-variable’ extraction pressure in the 2009 to 2020 assessment period in the Southern Celtic Sea assessment unit. Grid cells were categorised ‘Variable’ if a range of three or more pressure categories was observed throughout the time series
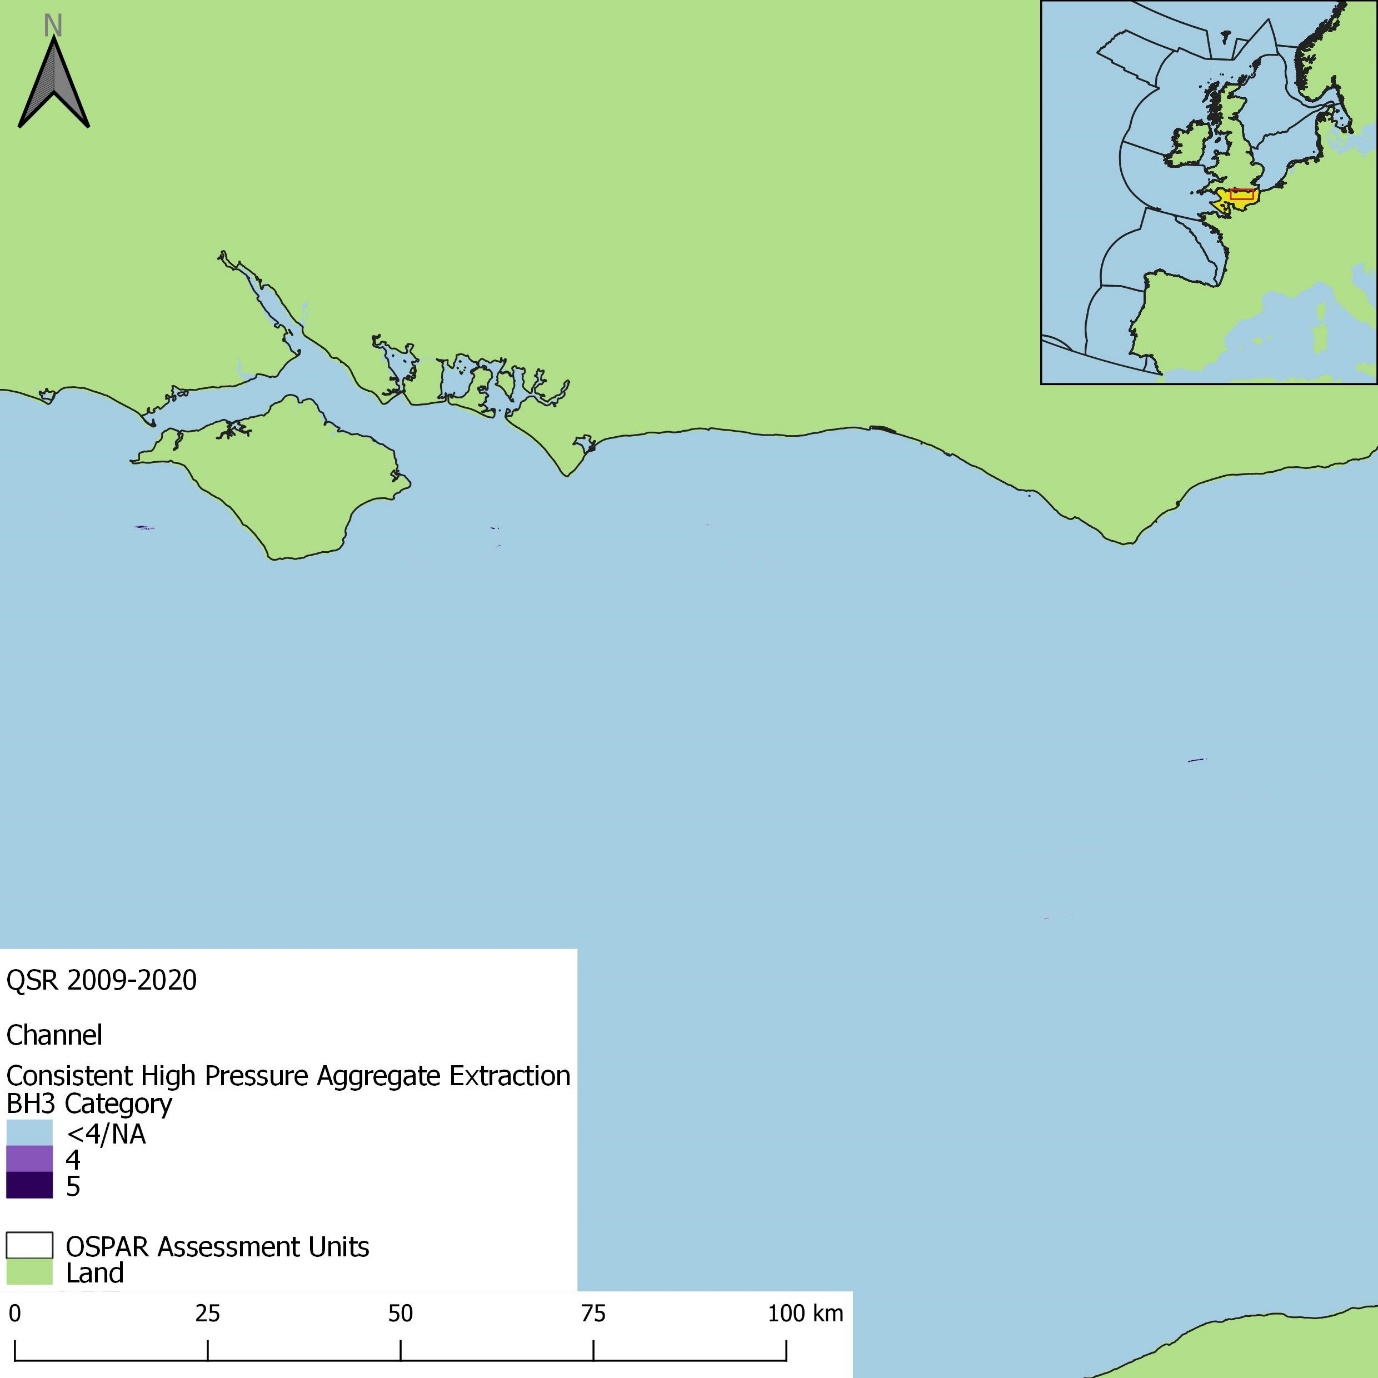
Figure al: Spatial distribution of consistently high (category 4 or 5) extraction pressure within the 2009 to 2020 assessment period in the Channel assessment period. Grid cells were considered to have ‘Consistent’ pressure if a change in less than three pressure categories was observed within the assessment period
2016 to 2020:
In the 2016 to 2020 assessment period the total proportion of each assessment unit with extraction pressure was approximately 0,1% or less (Figure as) and was comparably lower in larger assessment units (Norwegian Trench, Northern and Southern Celtic Seas). The Southern North Sea was the assessment unit with the greatest proportion of area under extraction pressure (0,107%; Figure as), although this was the only assessment unit with data from more than one Contracting Party.
All pressure categories were observed in assessment units across during the 2016 to 2020 assessment period (Figure as). Across assessment units, pressure category 1 was the most prominent category observed and category 2 the least recorded. Similar to the 2009 to 2020 assessment period, the Channel had the greatest proportion of area with category 5 pressure, approximately a third of the area with pressure.
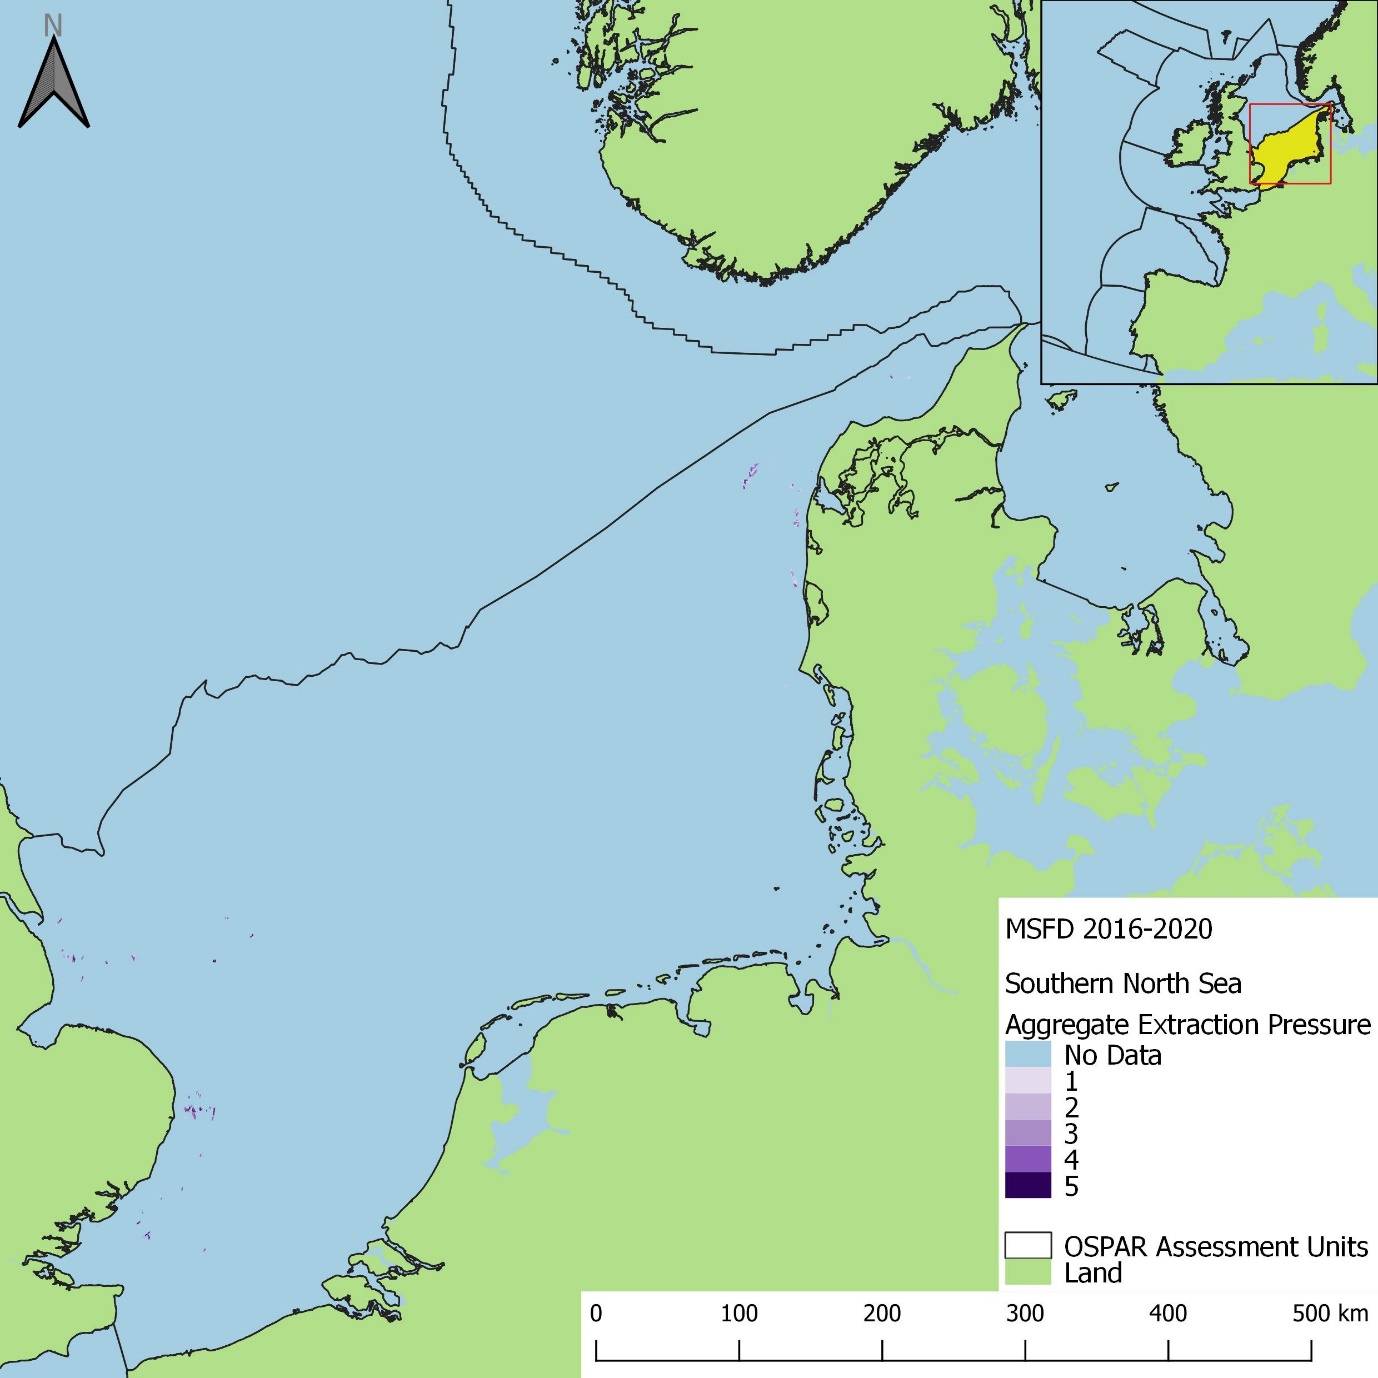
Figure am: Aggregated extraction pressure in the 2016 to 2020 assessment period, within the Southern North Sea assessment unit
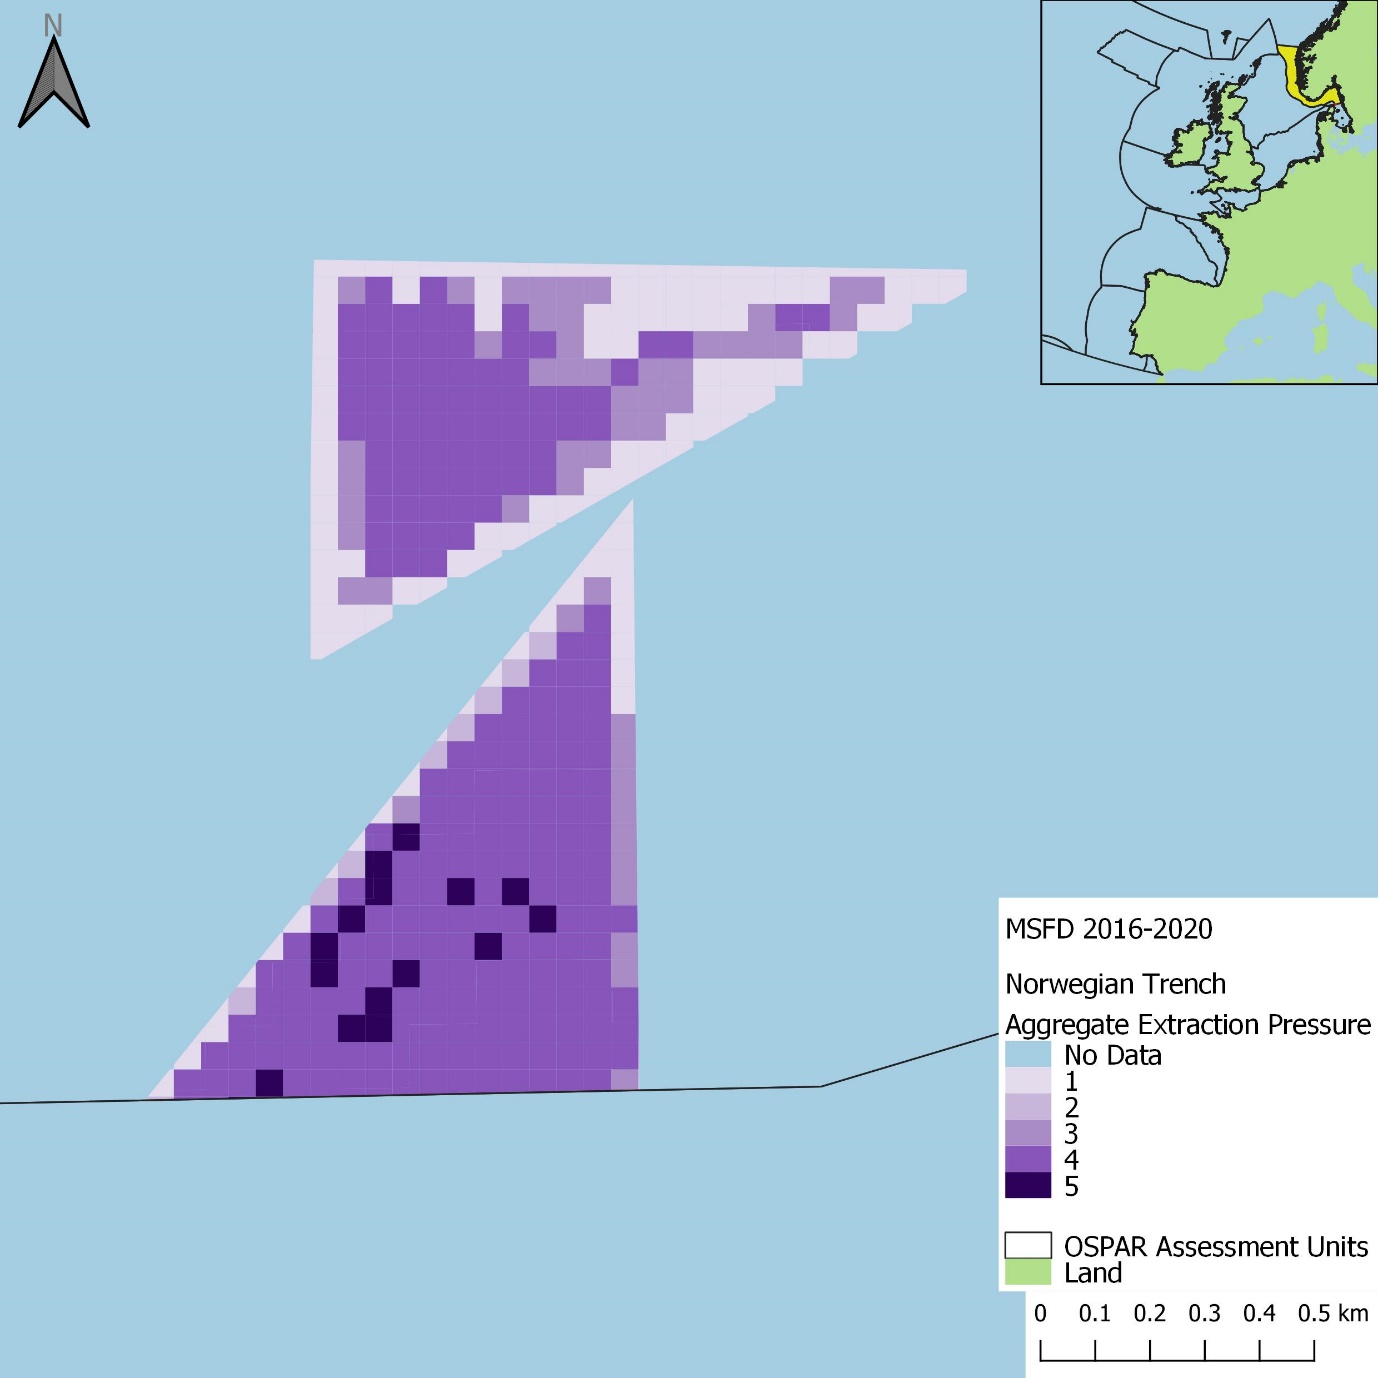
Figure ao: Aggregated extraction pressure in the 2016 to 2020 assessment period, within the Norwegian Trench assessment unit
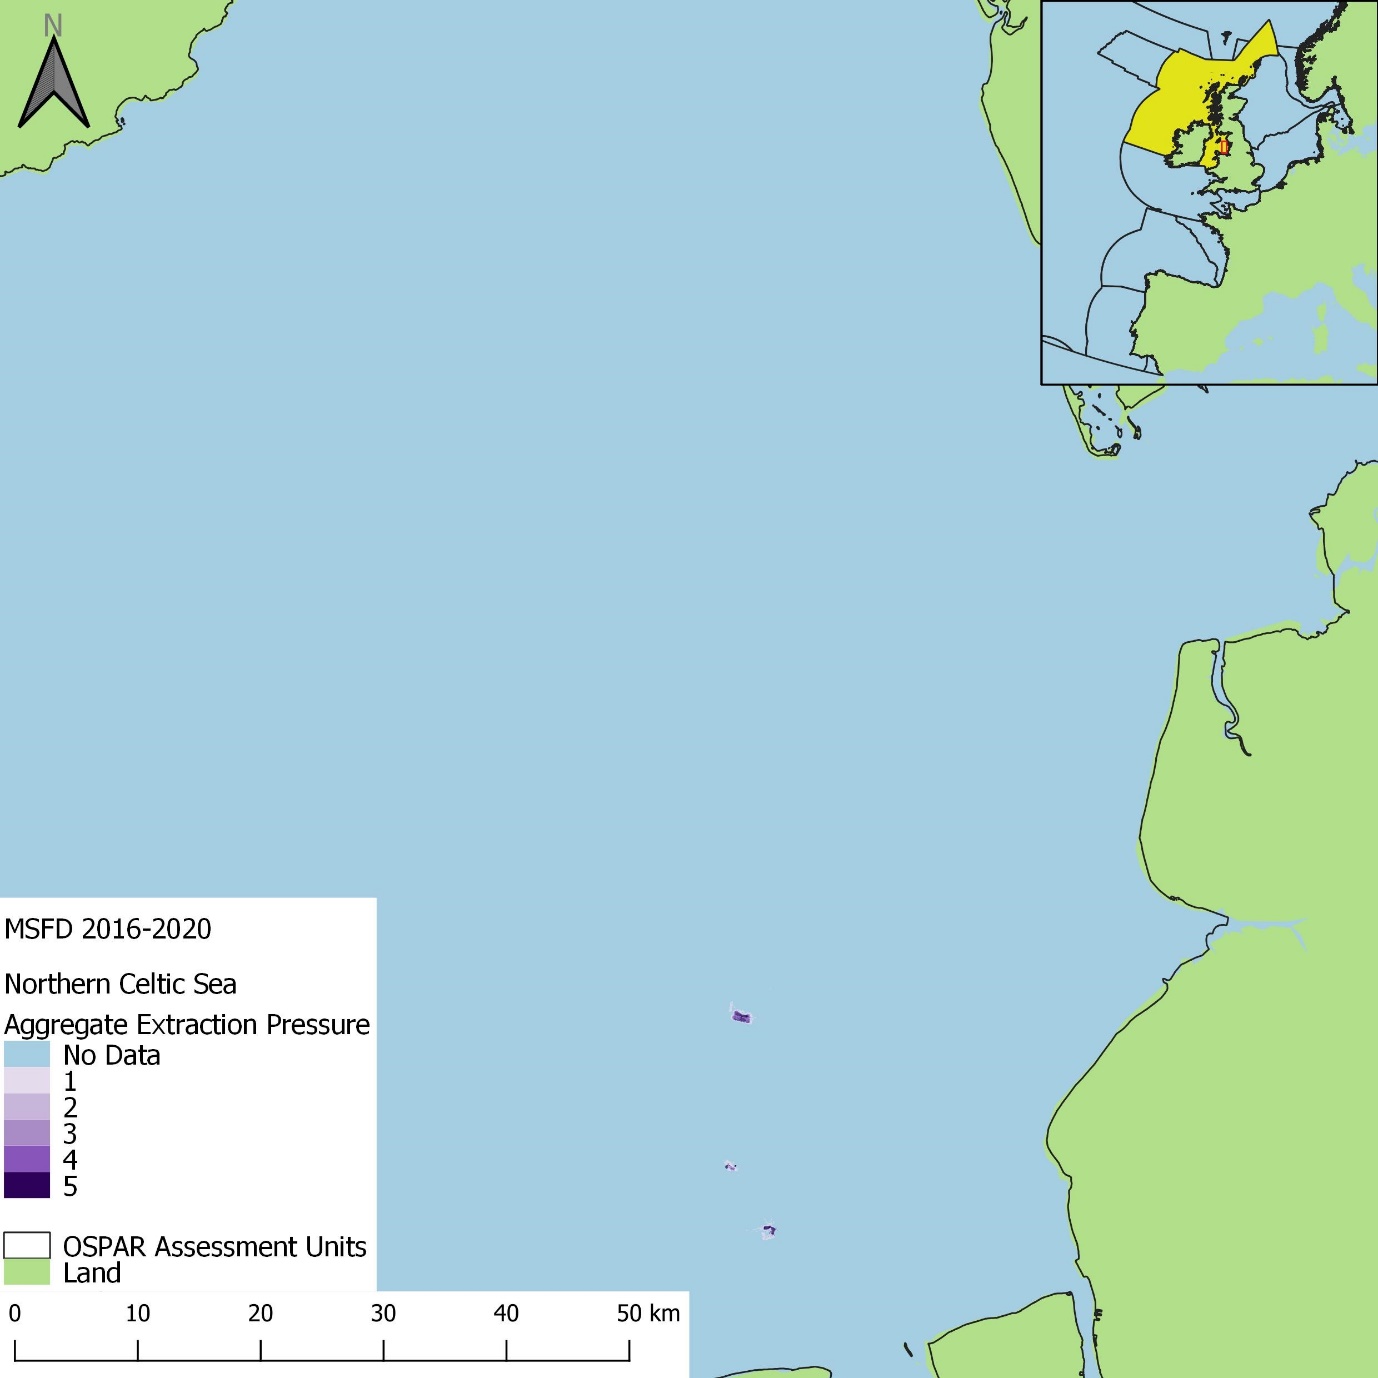
Figure aq: Aggregated extraction pressure in the 2016 to 2020 assessment period, within the Northern Celtic Sea assessment unit
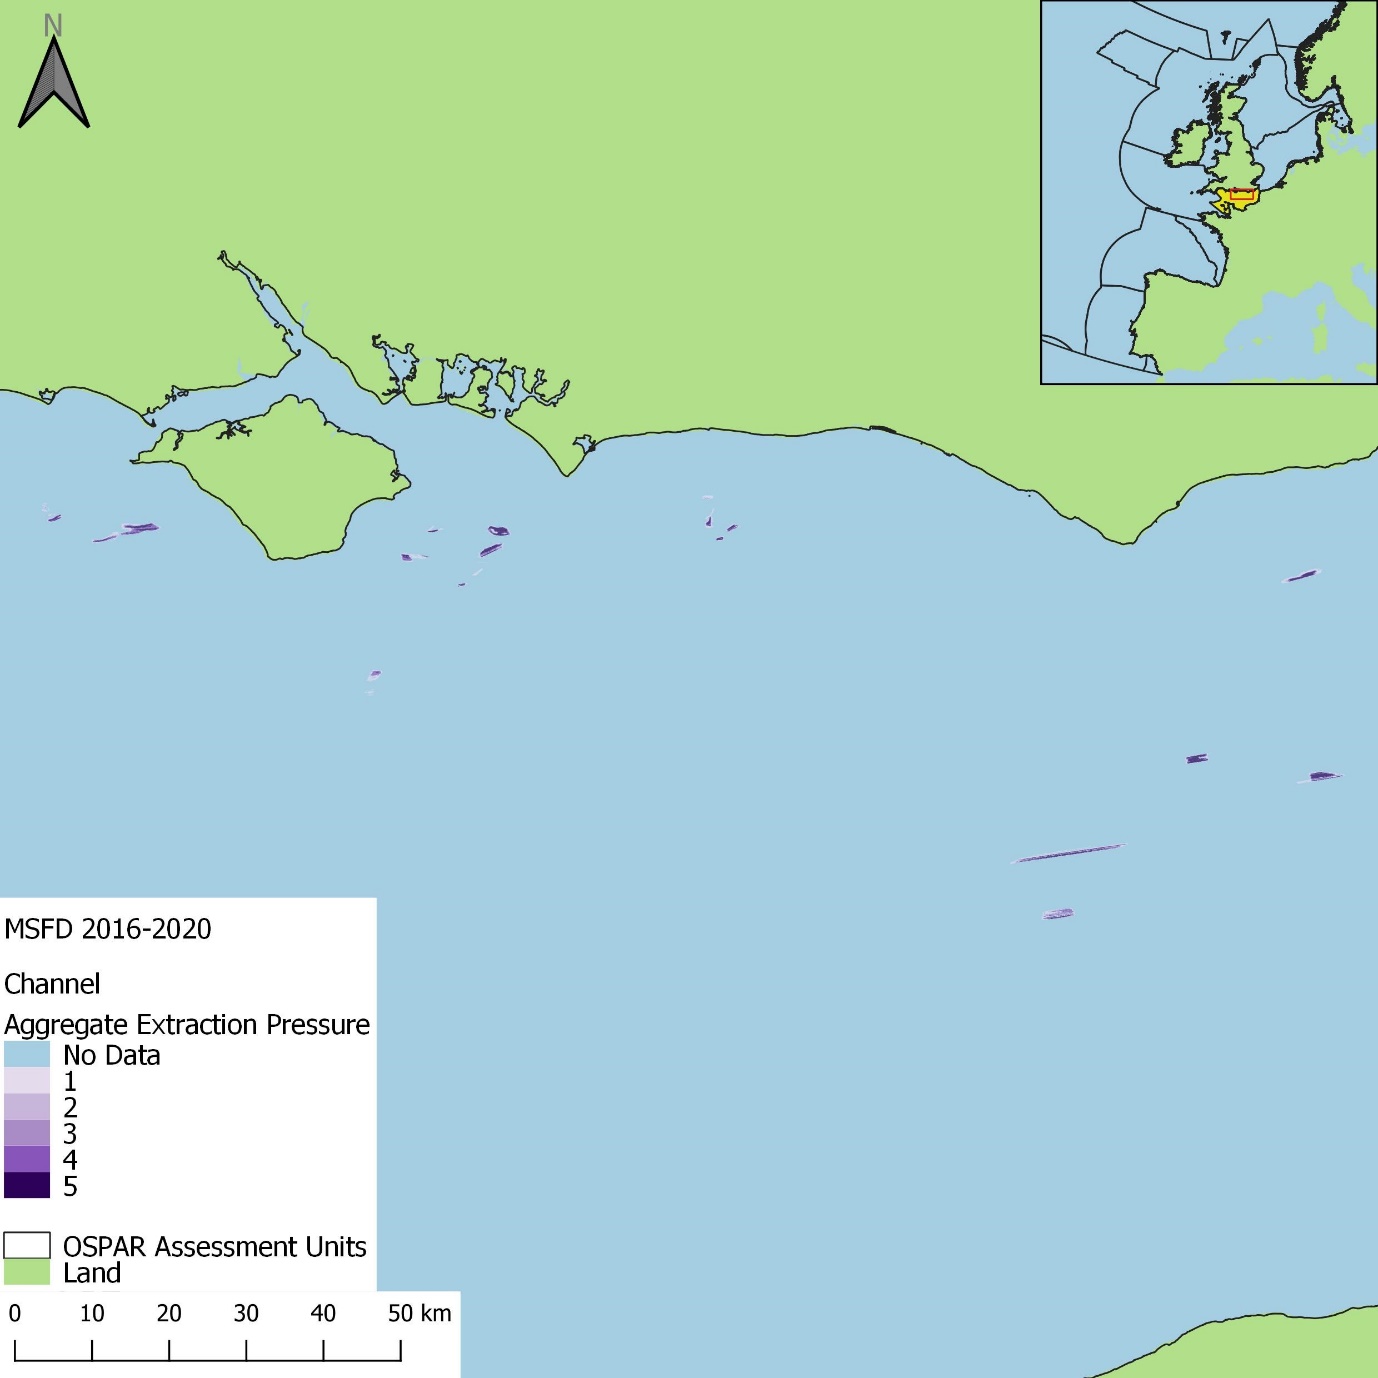
Figure an: Aggregated extraction pressure in the 2016 to 2020 assessment period, within the Channel assessment unit
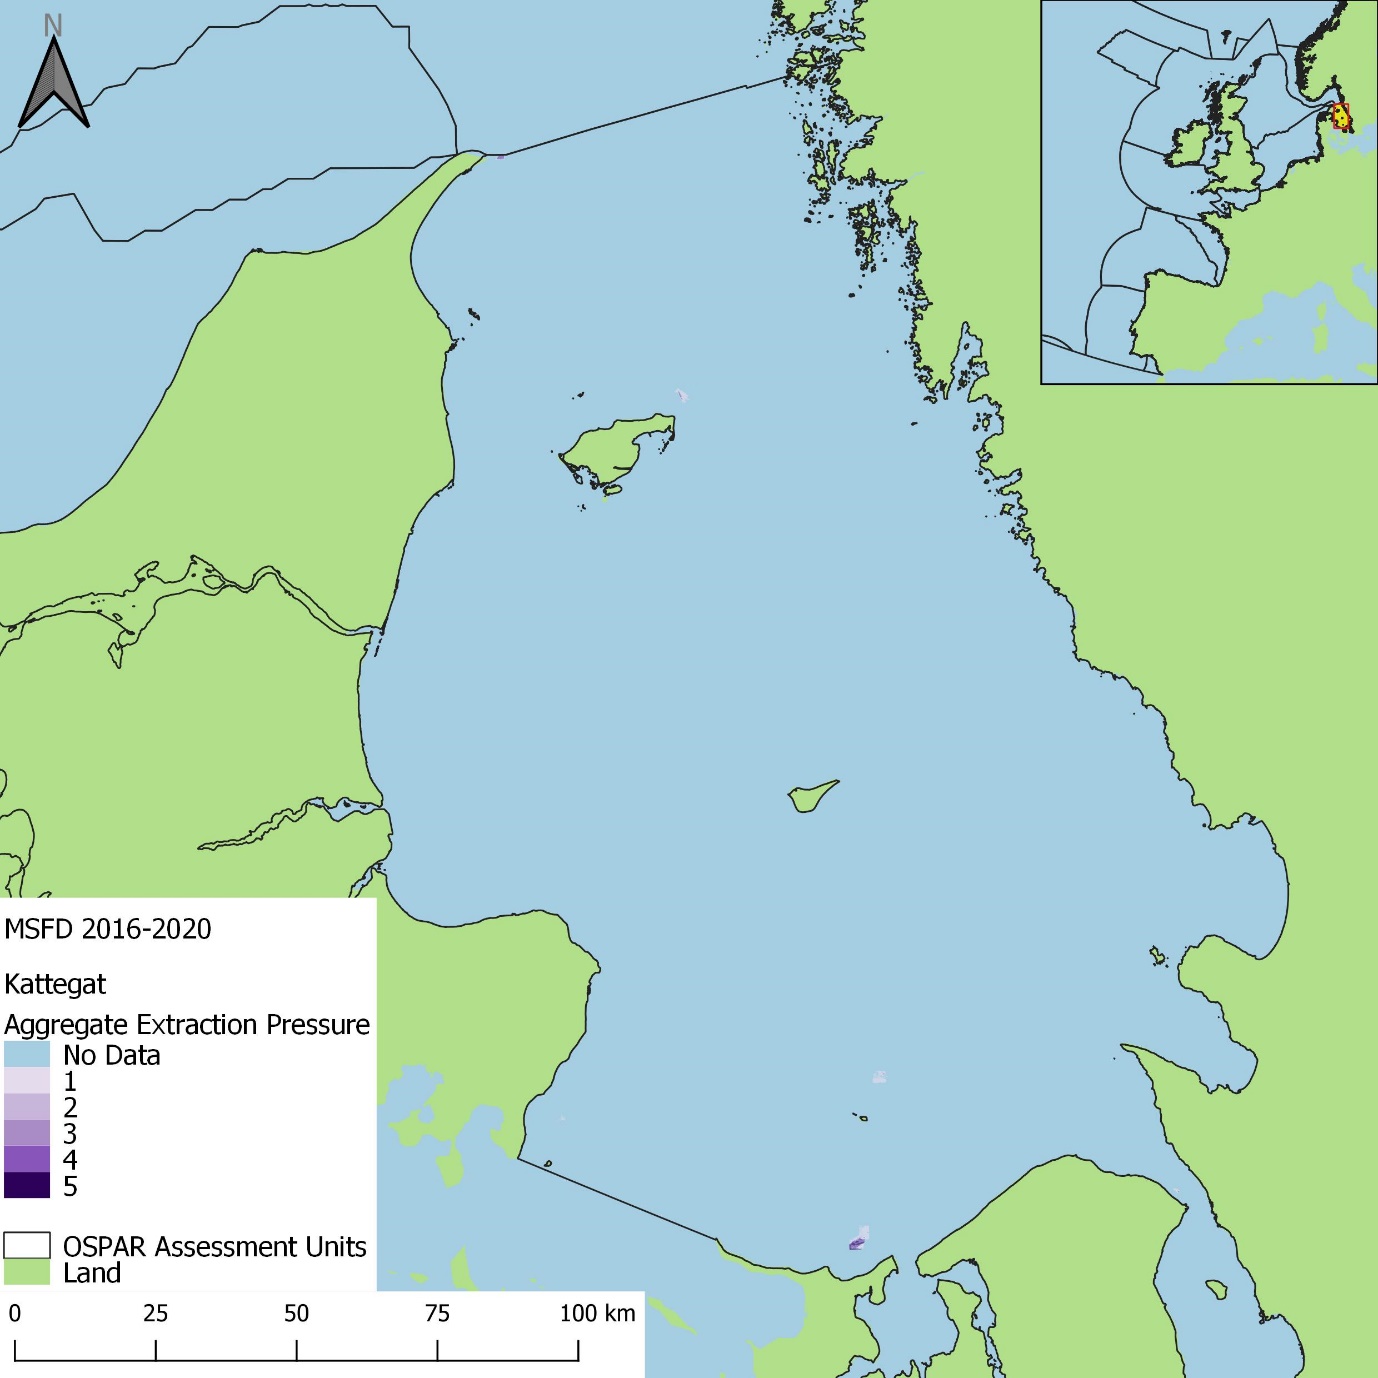
Figure ap: Aggregated extraction pressure in the 2016 to 2020 assessment period, within the Kattegat assessment unit
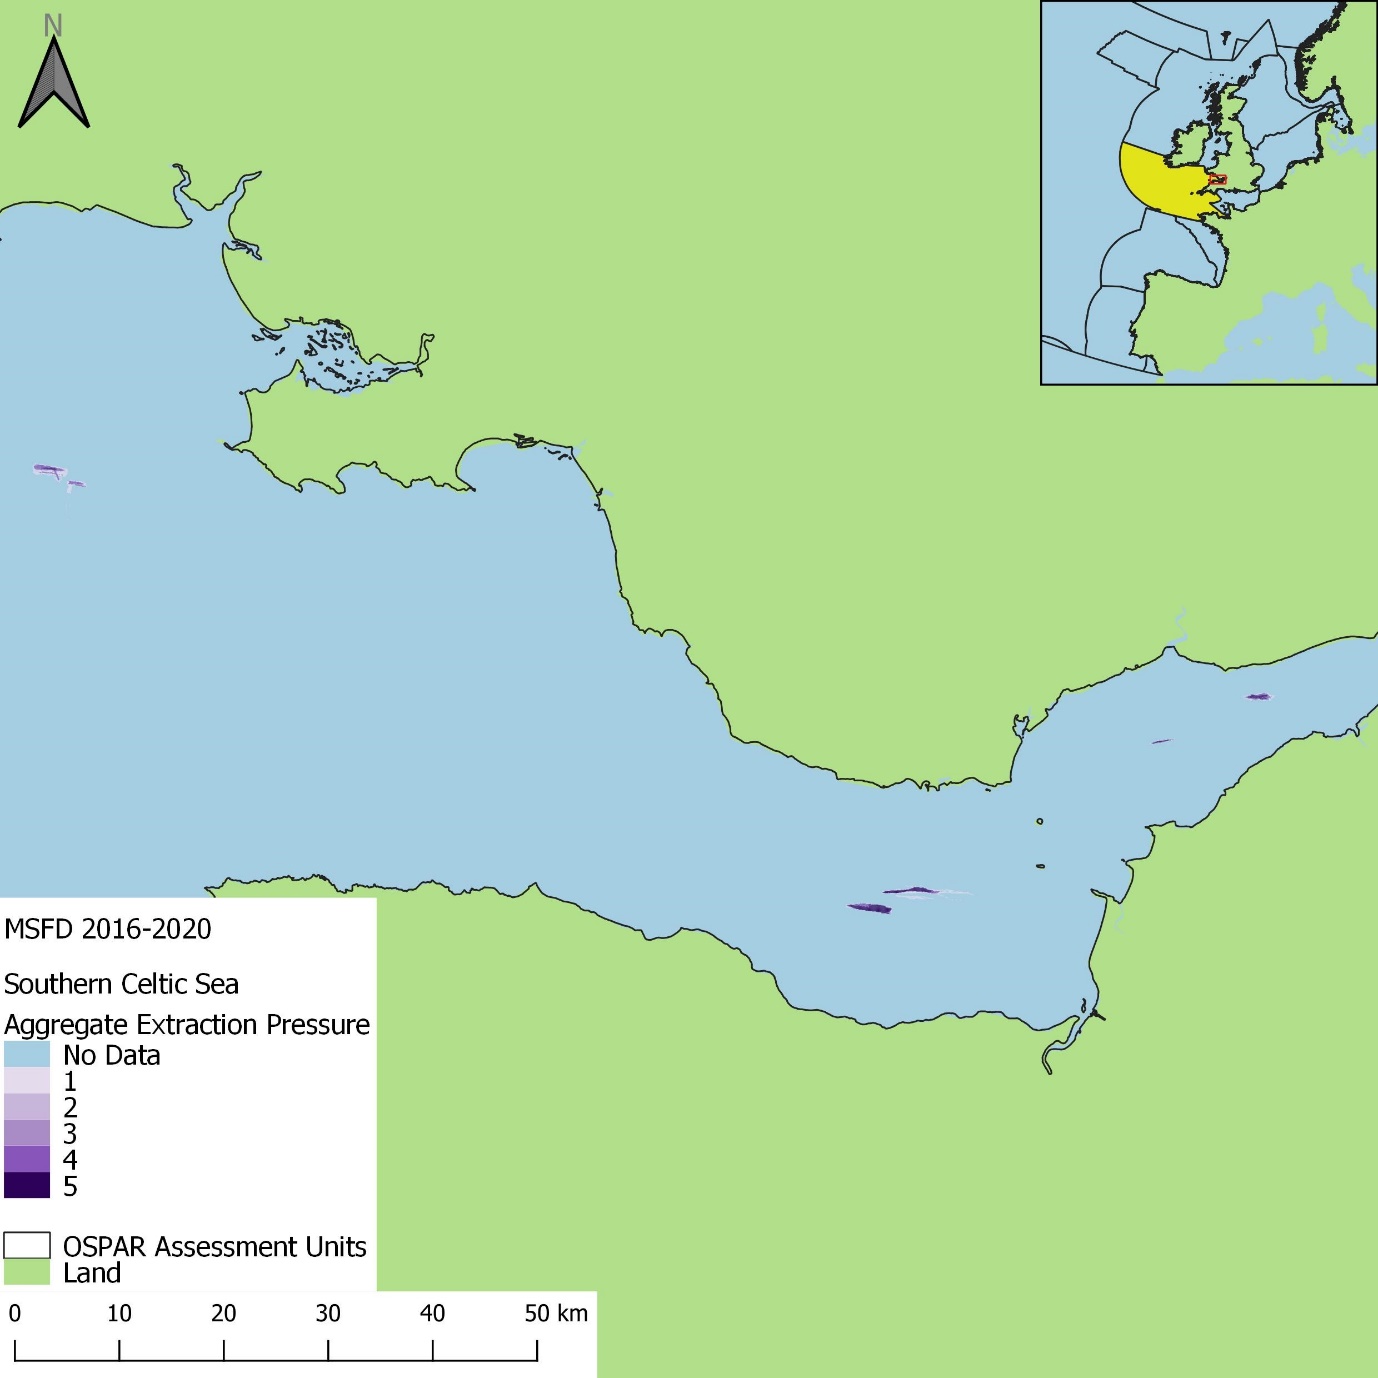
Figure ar: Aggregated extraction pressure in the 2016 to 2020 assessment period, within the Southern Celtic Sea assessment unit
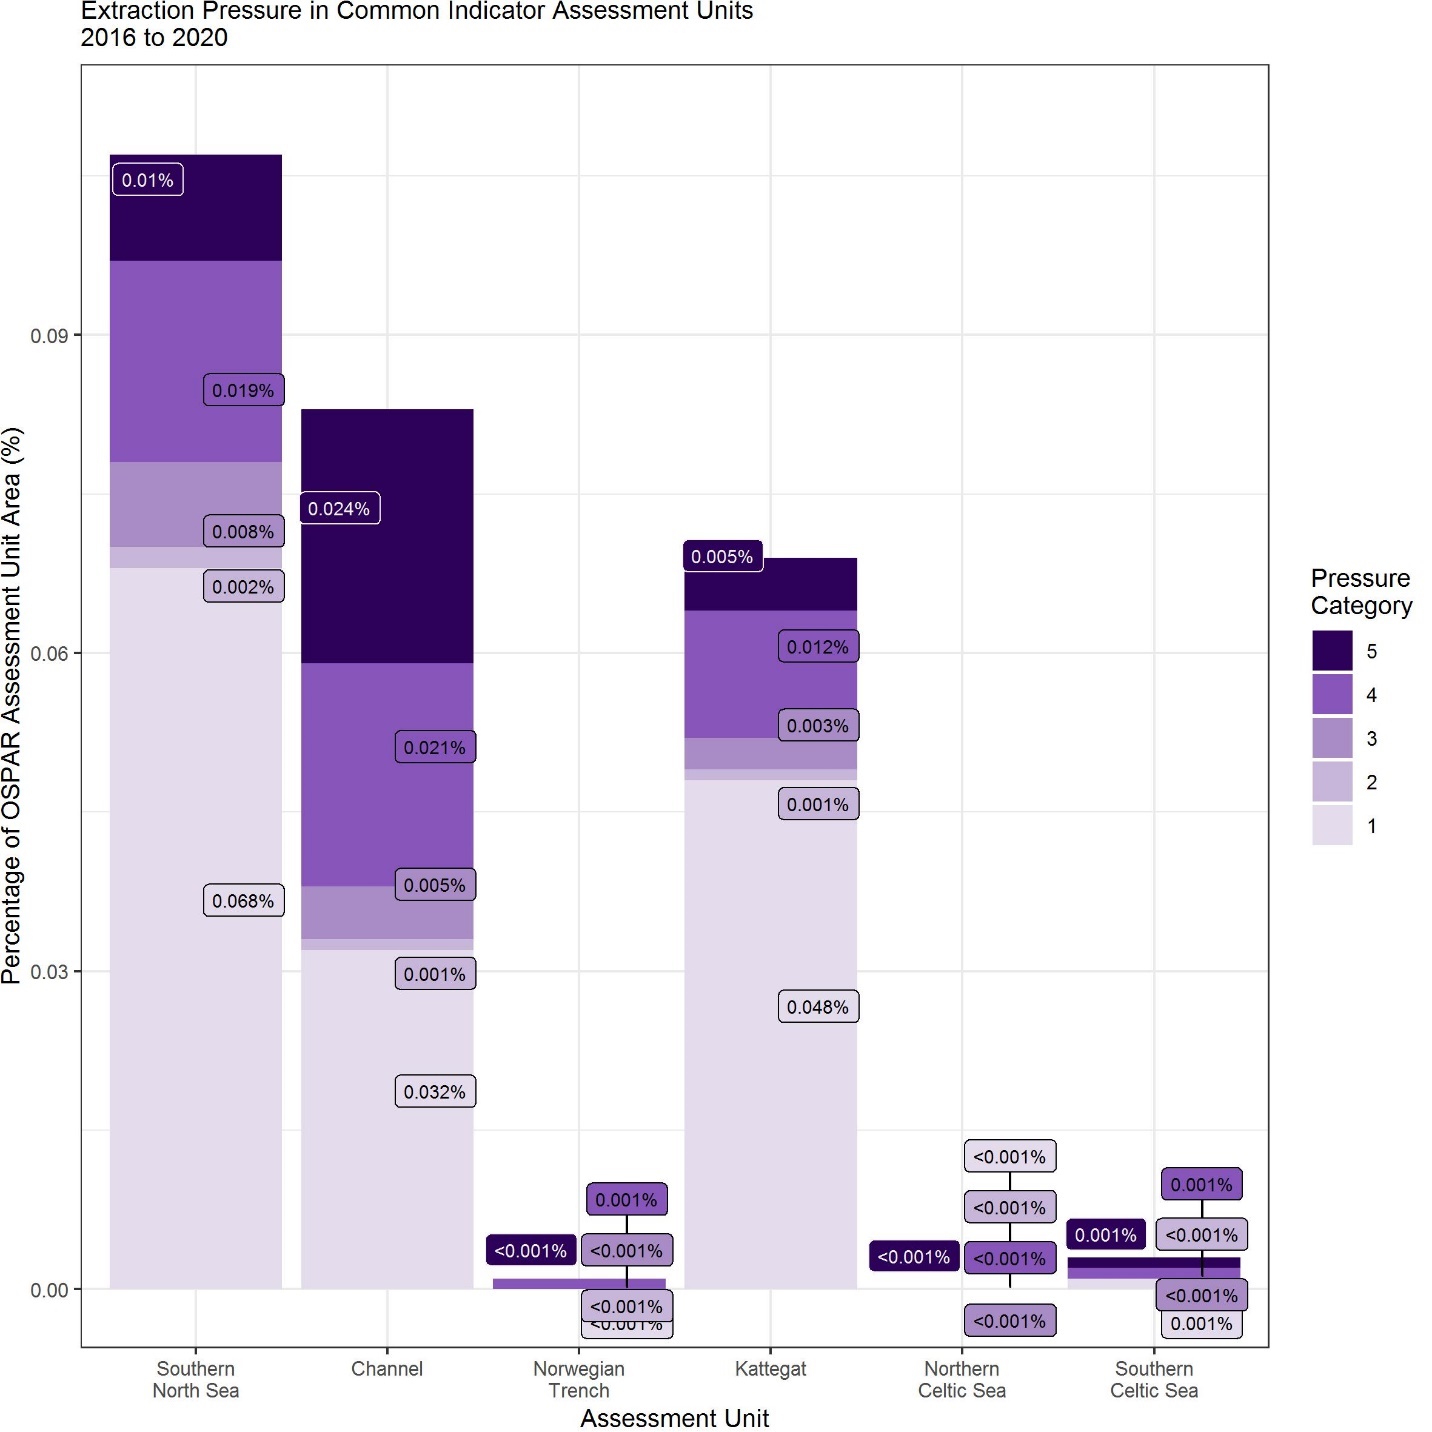
Figure as: Percentage of OSPAR Common Indicator Assessment Unit
with extraction pressure in the 2016 to 2020 assessment period
As observed in the QSR assessment period, Sublittoral biogenic reef (A5.6) in both the Southern North Sea and Southern Celtic Sea had the largest proportion of habitat area within an assessment unit with extraction pressure (Figure at). However, proportions of Sublittoral biogenic reef (A5.6) area with pressure were approximately half those impacted in the 2009 to 2020 assessment. In the Southern North Sea, Offshore circalittoral rock and biogenic reef was the BHT with the greatest proportion of area with extraction pressure in an assessment unit (total pressure recorded was over 2% of habitat in the assessment unit; Figure au). In both the Channel and the Northern Celtic Sea, the BHT with the greatest proportion of area with extraction pressure was Circalittoral coarse sediment; in the Southern Celtic Sea circalittoral sand had the greatest proportion of area with pressure. Both Infralittoral and Circalittoral sand in the Norwegian Trench had greater than 1% of habitat area with extraction pressure. Extraction pressure in the Kattegat predominantly occurred in Infralittoral coarse and mixed sediment (Figure au). With the exception of Offshore circalittoral rock and biogenic reef in the Southern North Sea, and Infralittoral and Circalittoral sand in the Norwegian Trench, all BHTs had less than 1% of habitat area within a given assessment unit with extraction pressure (Figure au).
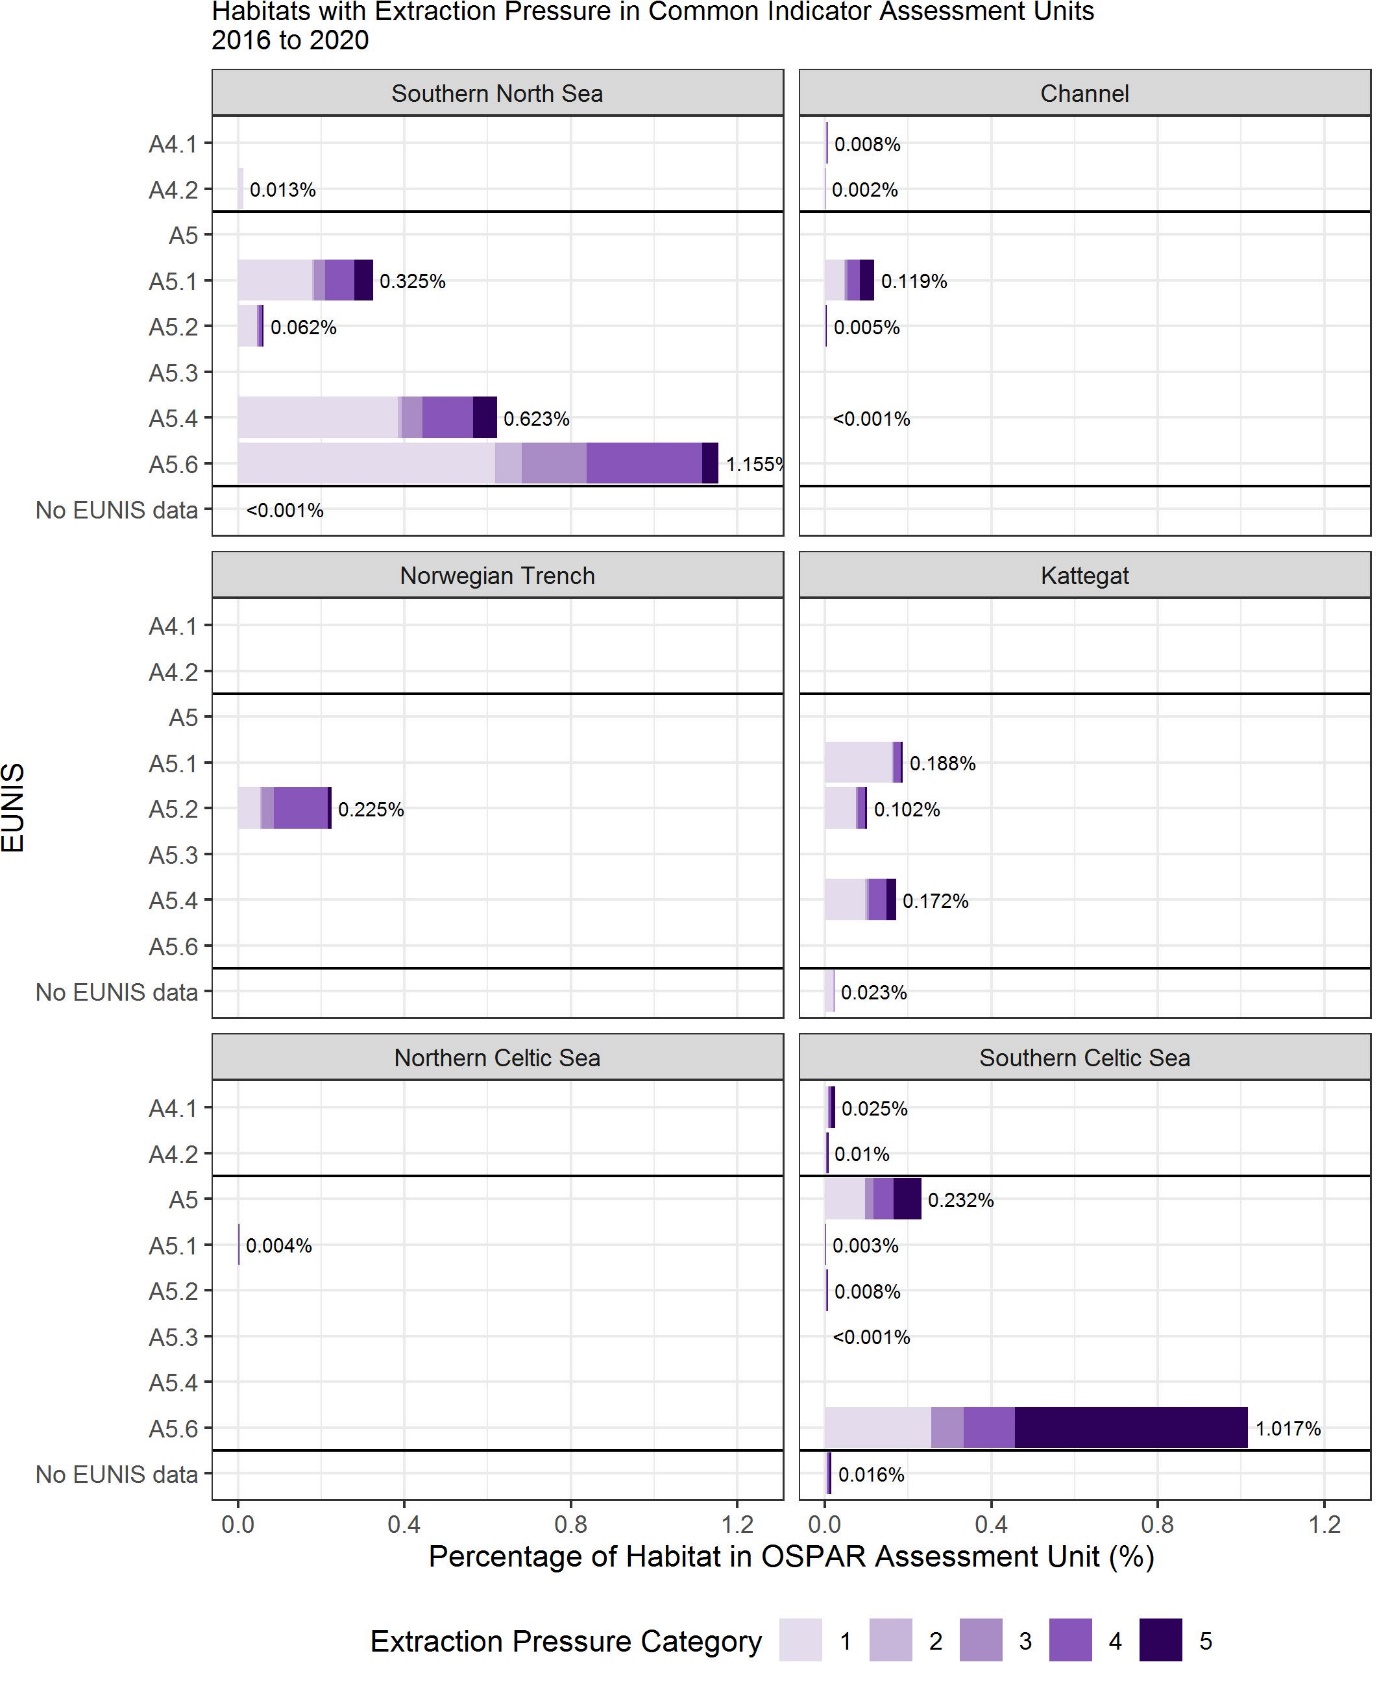
Figure at: The percentage of EUNIS Level 3 habitat in OSPAR Common Indicator Assessment Units with extraction pressure in the 2016 to 2020 assessment period
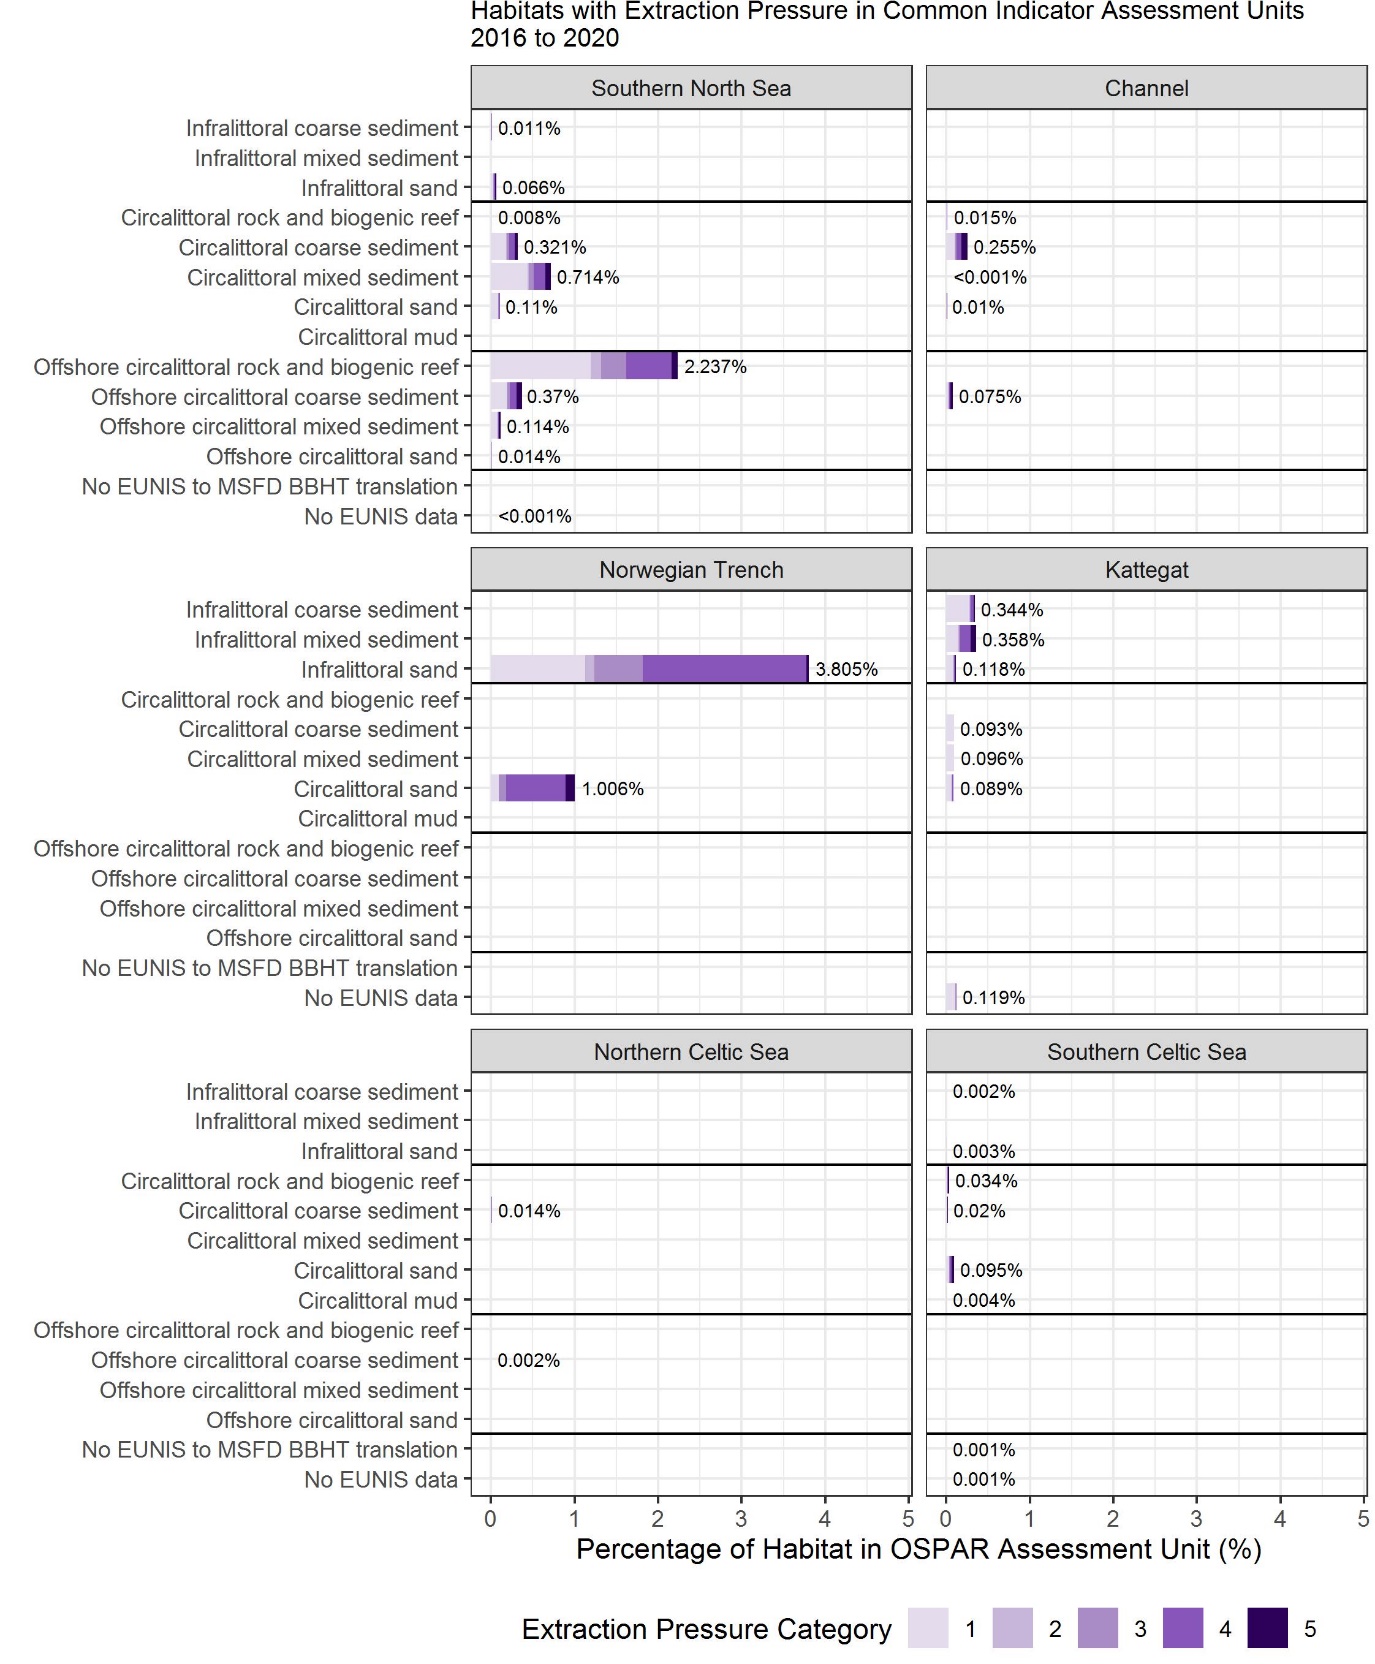
Figure au: The percentage of Broad Benthic Habitat Types in OSPAR Common Indicator Assessment Units with extraction pressure in the 2016 to 2020 assessment period. No EUNIS to MSFD BBHT translation = EUNIS habitats that couldn’t be assigned MSFD translations (e.g., lacking substrate information)
Across the shorter, MSFD assessment period of 2016 to 2020 a greater area of ‘Non-variable’ pressure was recorded than ‘Variable’ in the Southern North Sea and the Channel (Figure av to Figure bb), and all assessment units had areas of ‘Consistent’ high (categories 4 and 5) pressure over the assessment period (Figure bc to Figure bh).
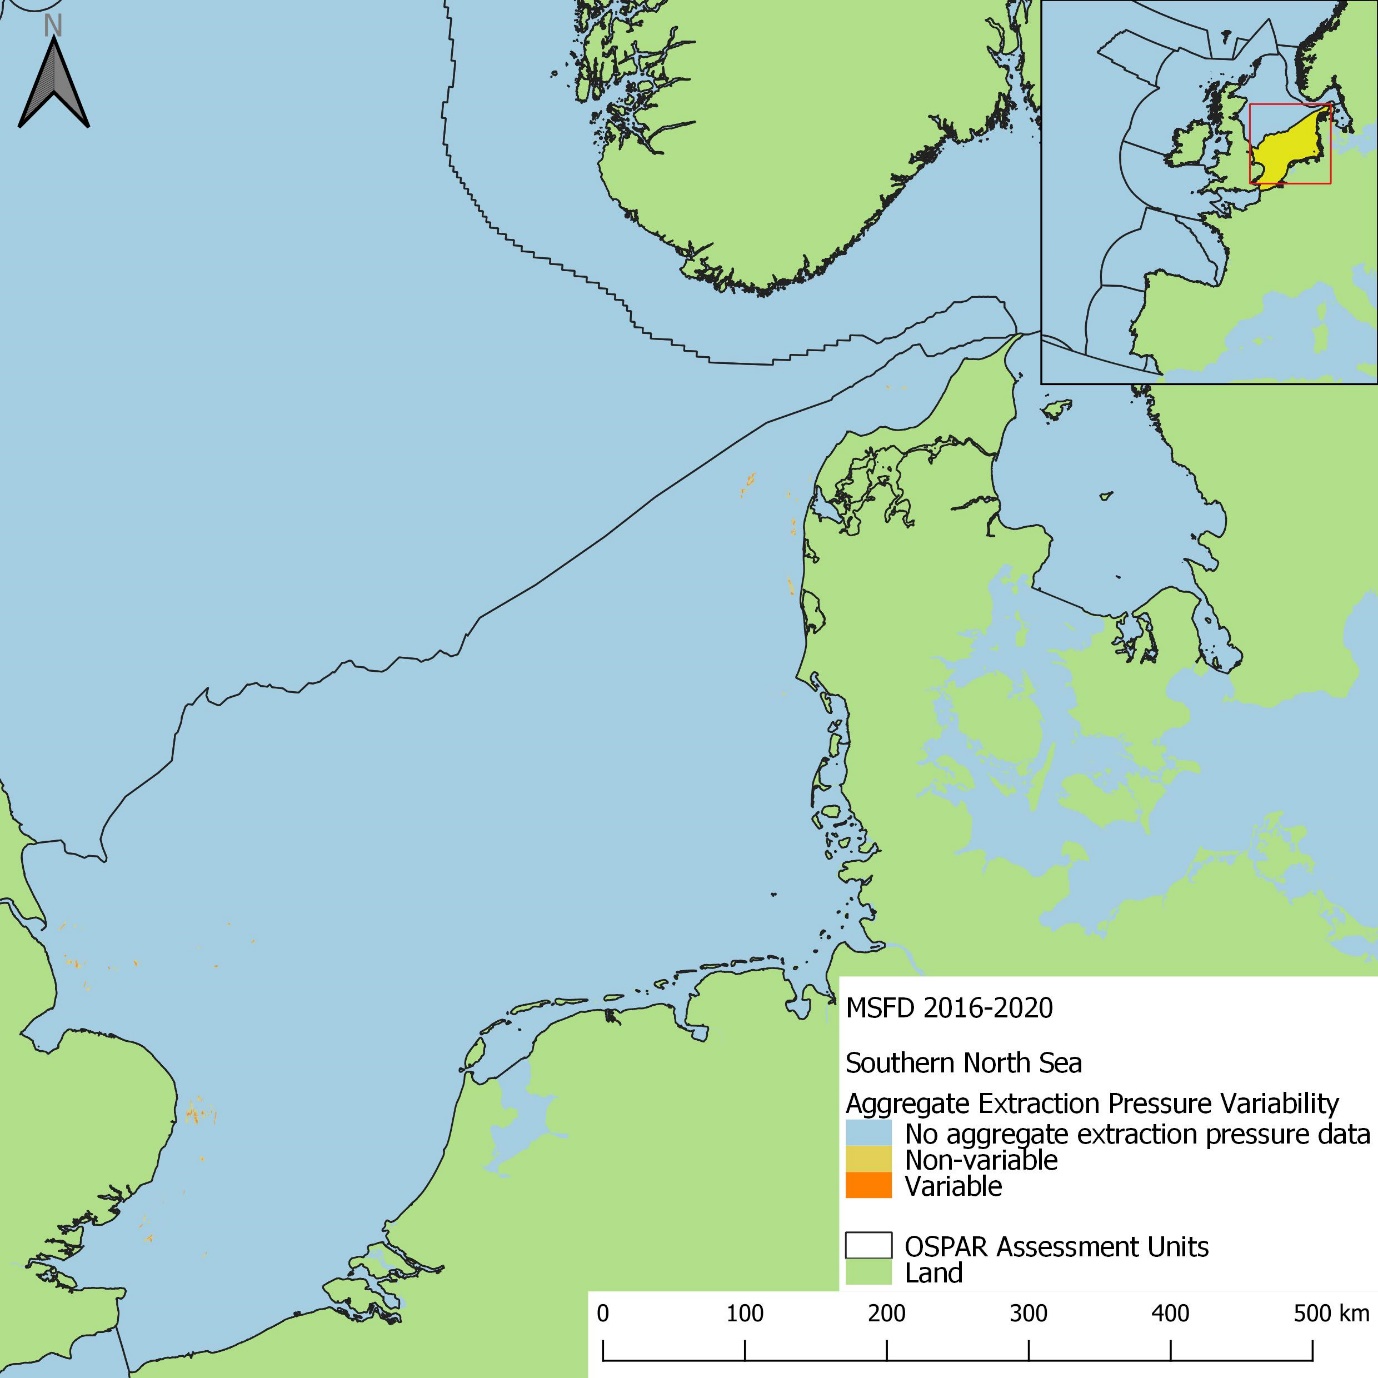
Figure av: Spatial distribution of ‘Variable’ and ‘Non-variable’ extraction pressure in the 2016 to 2020 assessment period in the Southern North Sea assessment unit. Grid cells were categorised ‘Variable’ if a range of three or more pressure categories was observed throughout the time series
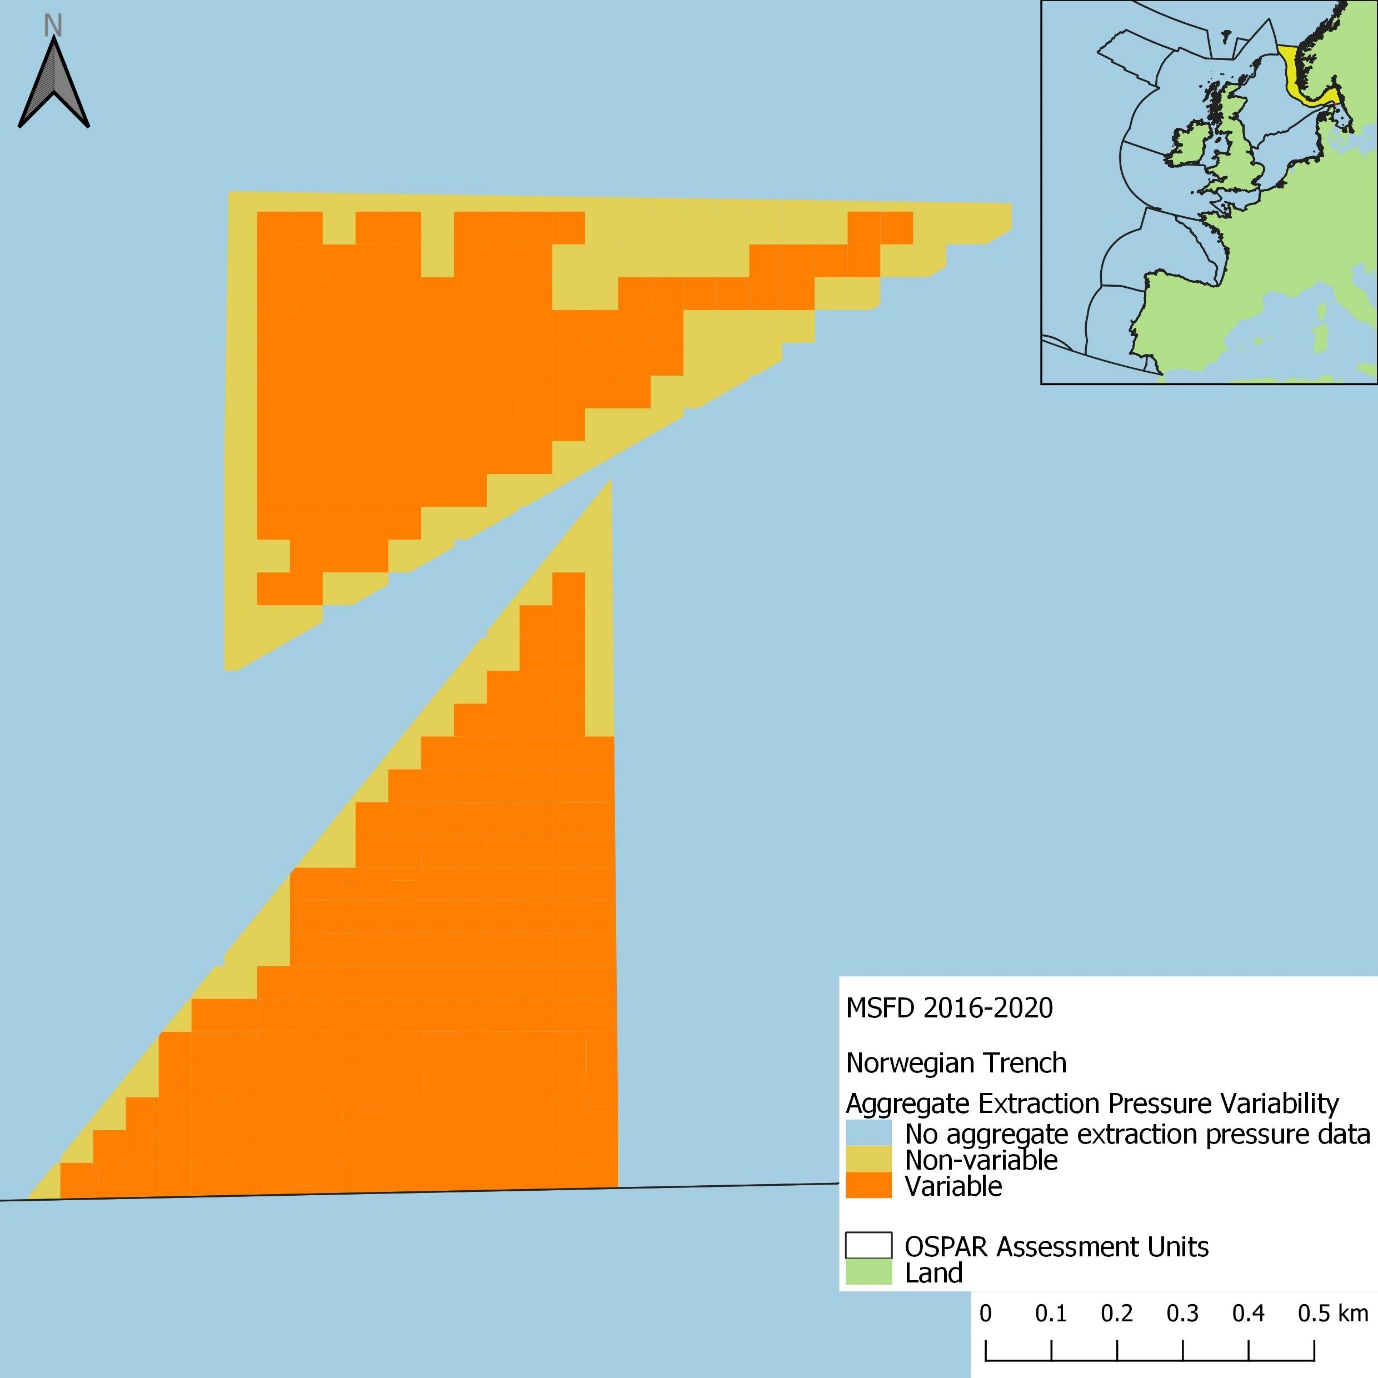
Figure ax: Spatial distribution of ‘Variable’ and ‘Non-variable’ extraction pressure in the 2016 to 2020 assessment period in the Norwegian Trench assessment unit. Grid cells were categorised ‘Variable’ if a range of three or more pressure categories was observed throughout the time series
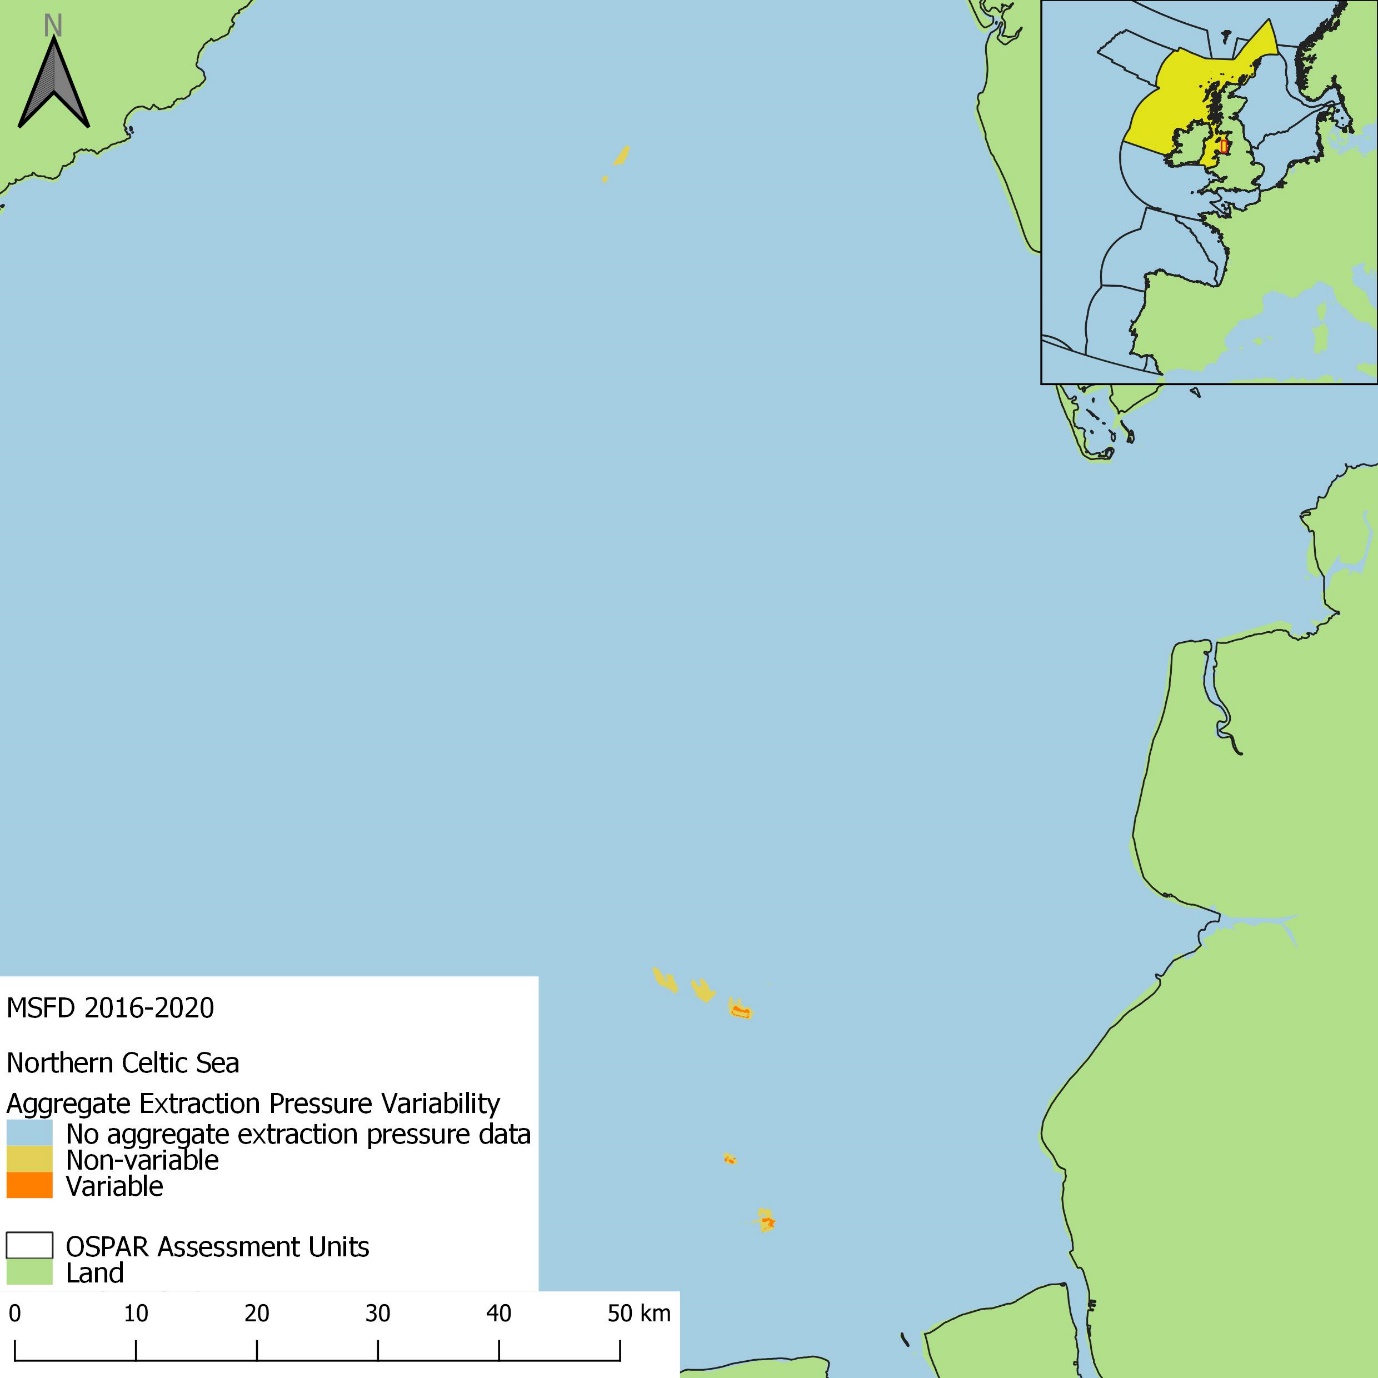
Figure az: Spatial distribution of ‘Variable’ and ‘Non-variable’ extraction pressure in the 2016 to 2020 assessment period in the Northern Celtic Sea assessment unit. Grid cells were categorised ‘Variable’ if a range of three or more pressure categories was observed throughout the time series
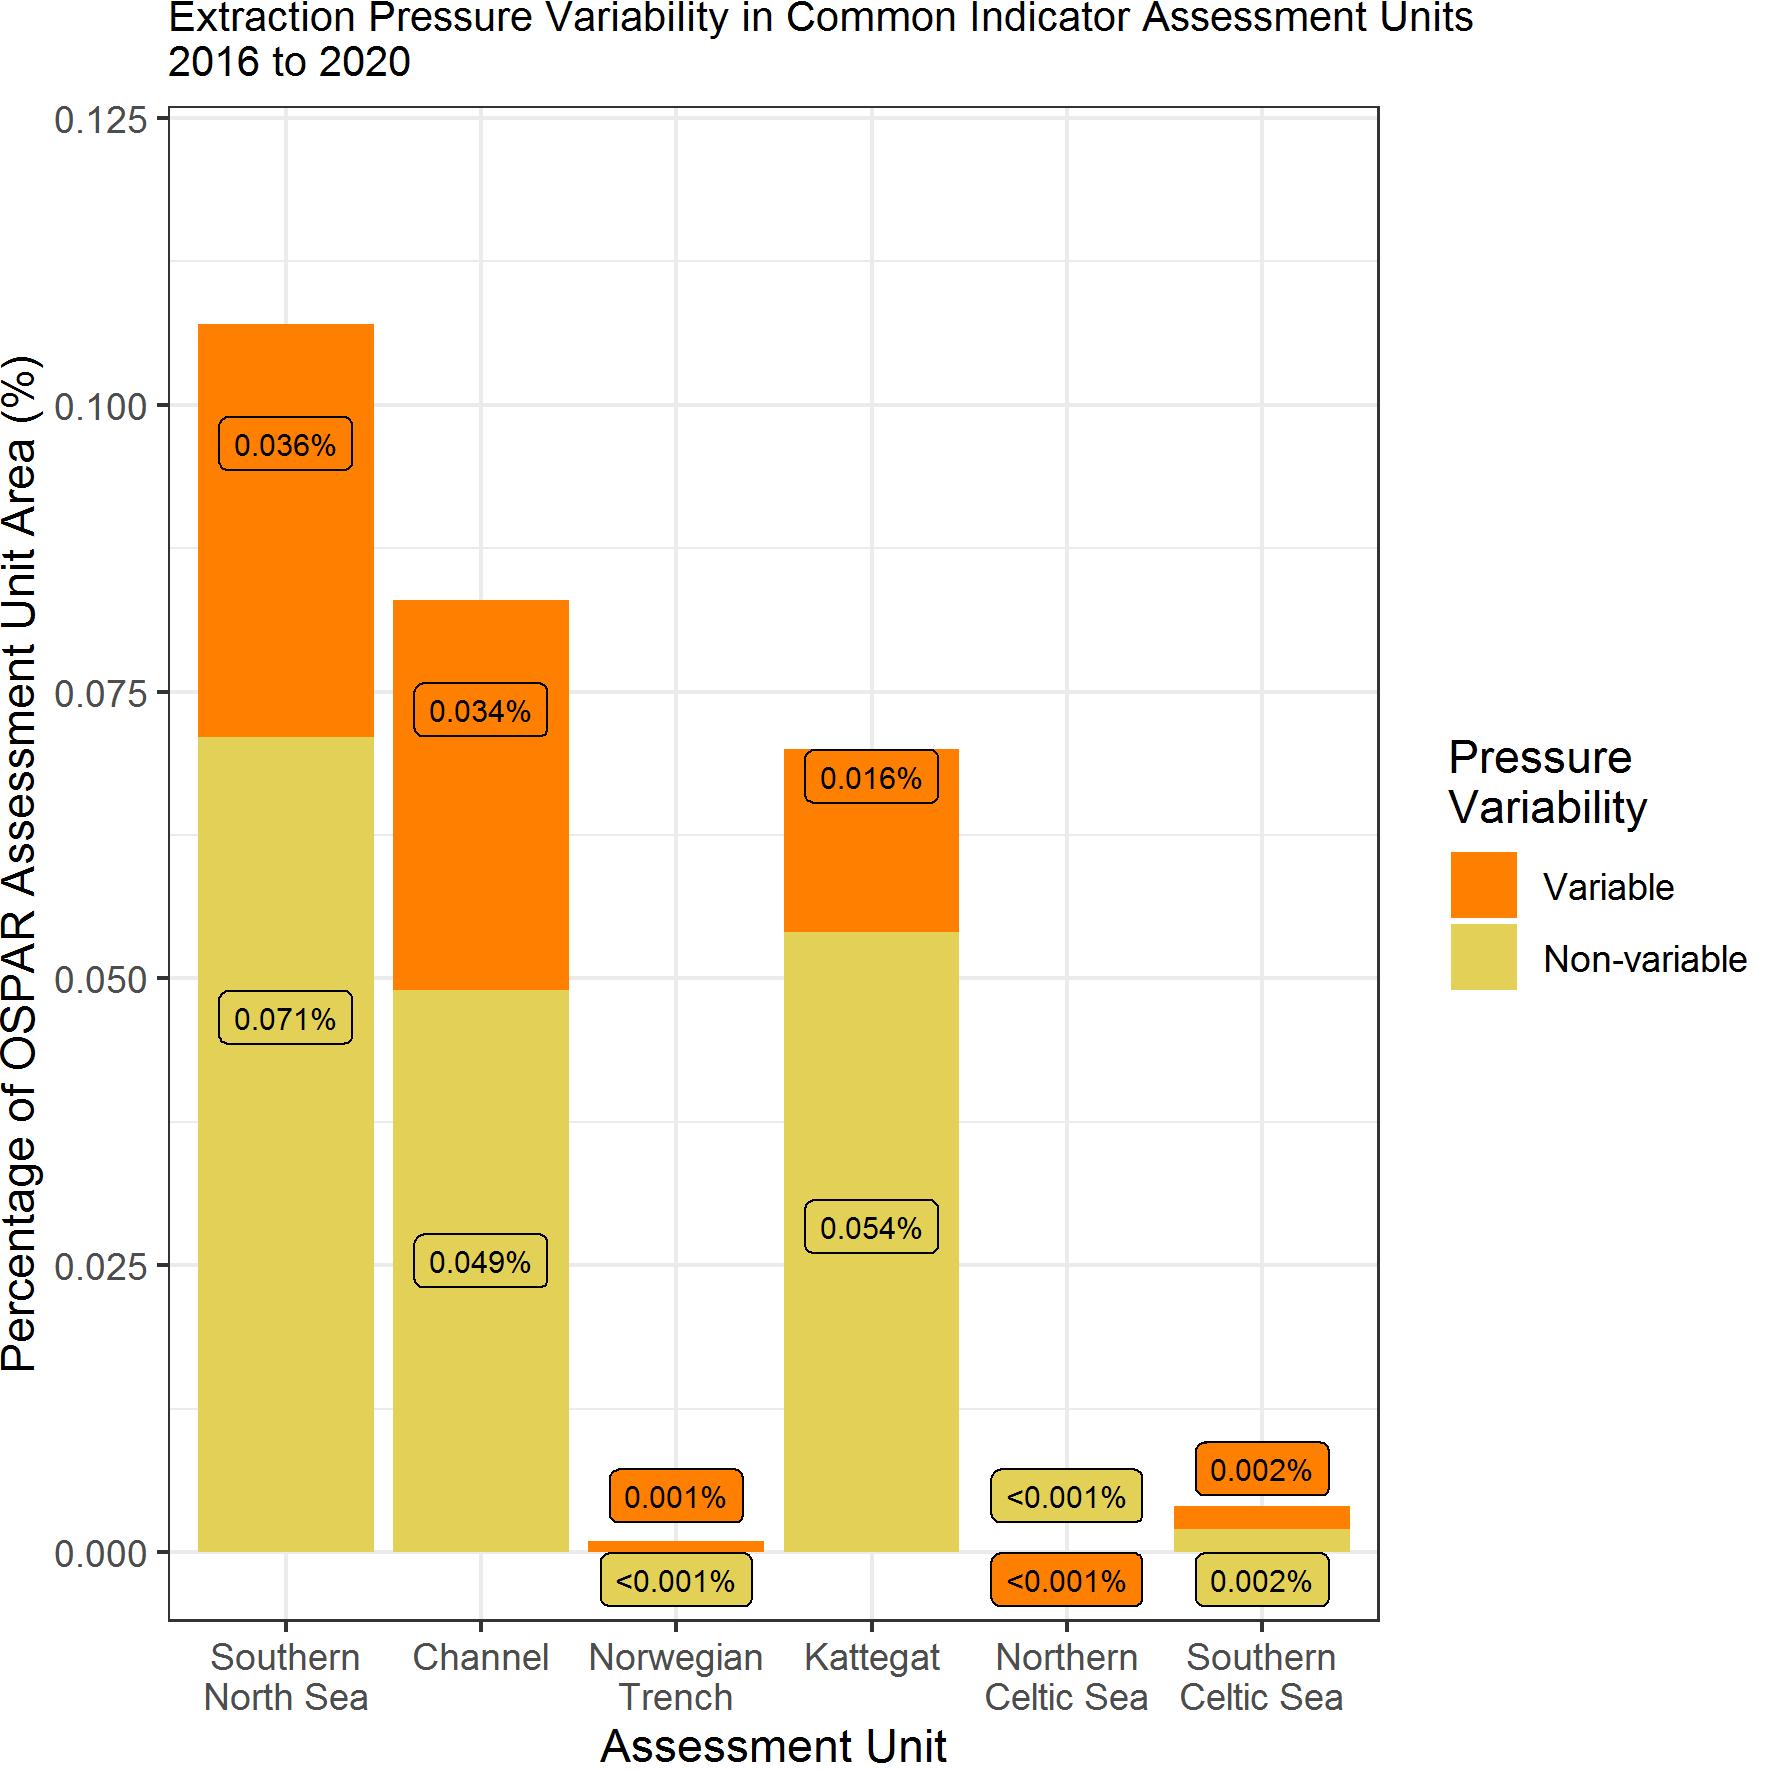
Figure bb: Percentage of OSPAR Common Indicator Assessment Unit with ‘Non-variable’ or ‘Variable’ pressure in the 2016 to 2020 assessment period; cells were categorised ‘Variable’ if a range of three or more pressure categories was observed throughout the time series
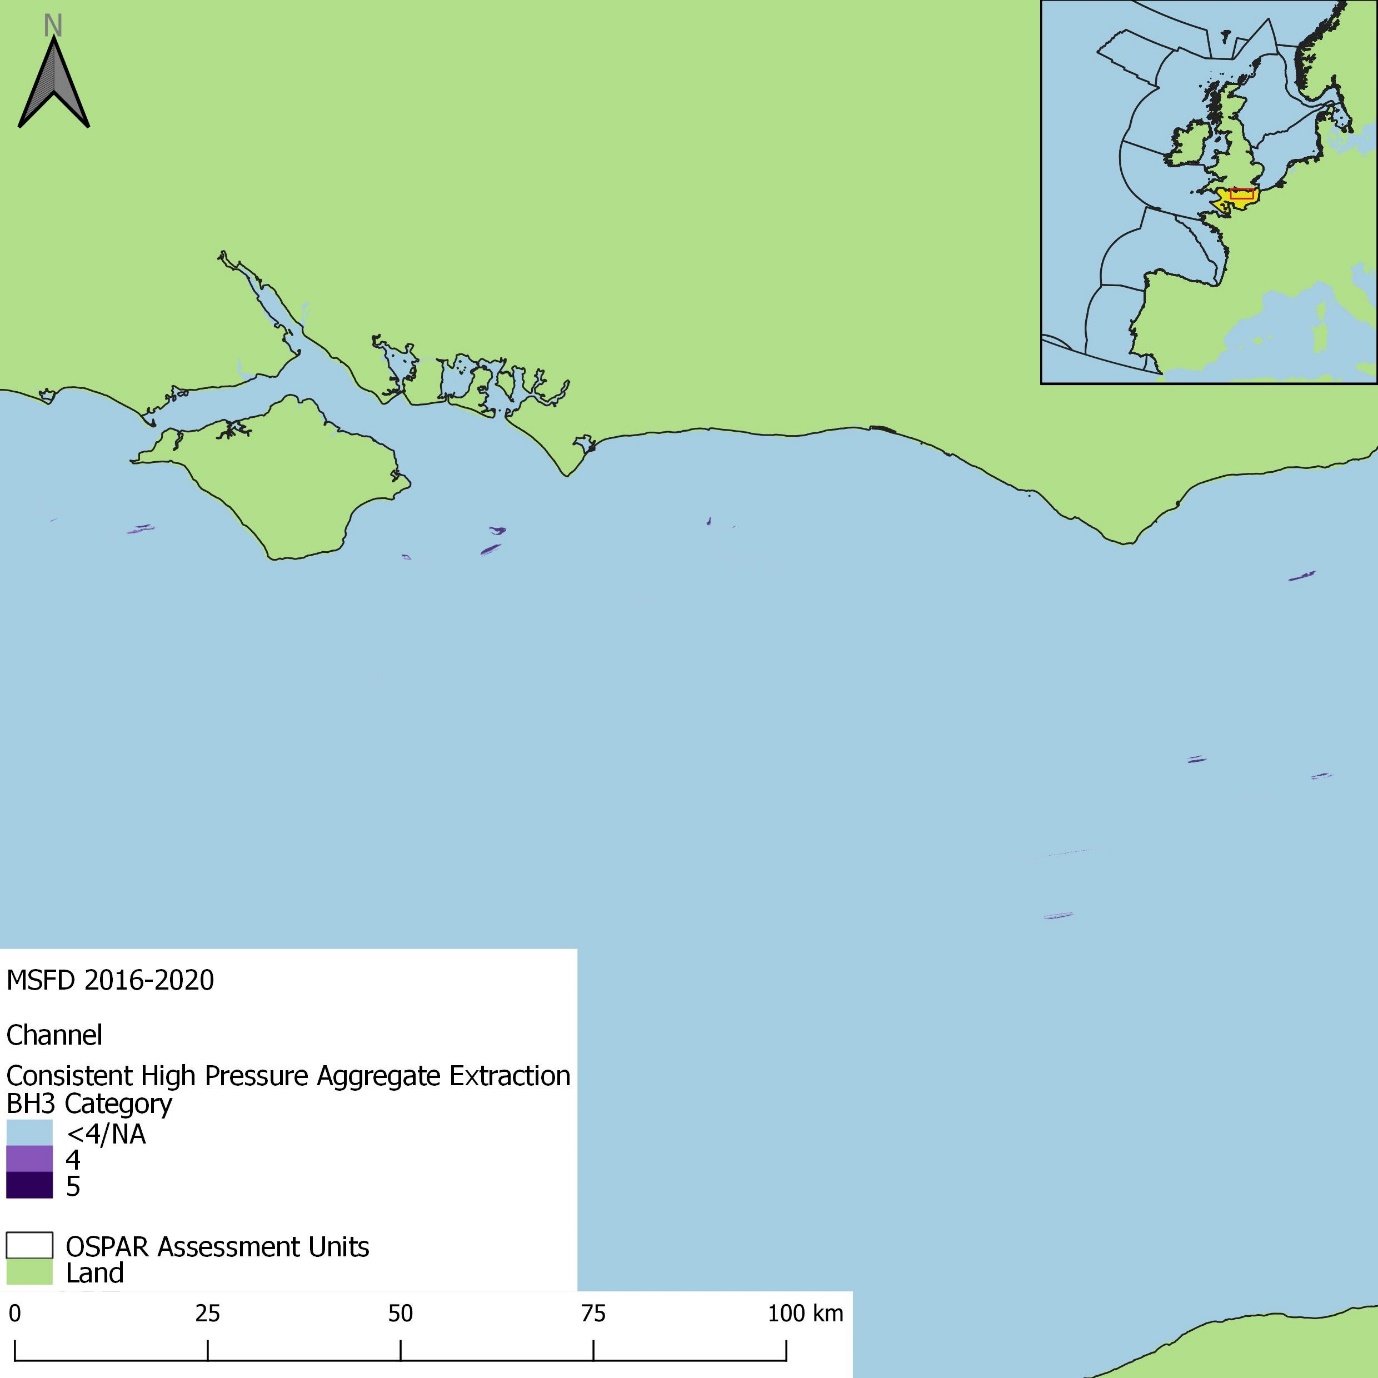
Figure bd: Spatial distribution of consistently high (category 4 or 5) extraction pressure within the 2016 to 2020 assessment period in the Channel assessment period. Grid cells were considered to have ‘Consistent’ pressure if a change in less than three pressure categories was observed within the assessment period
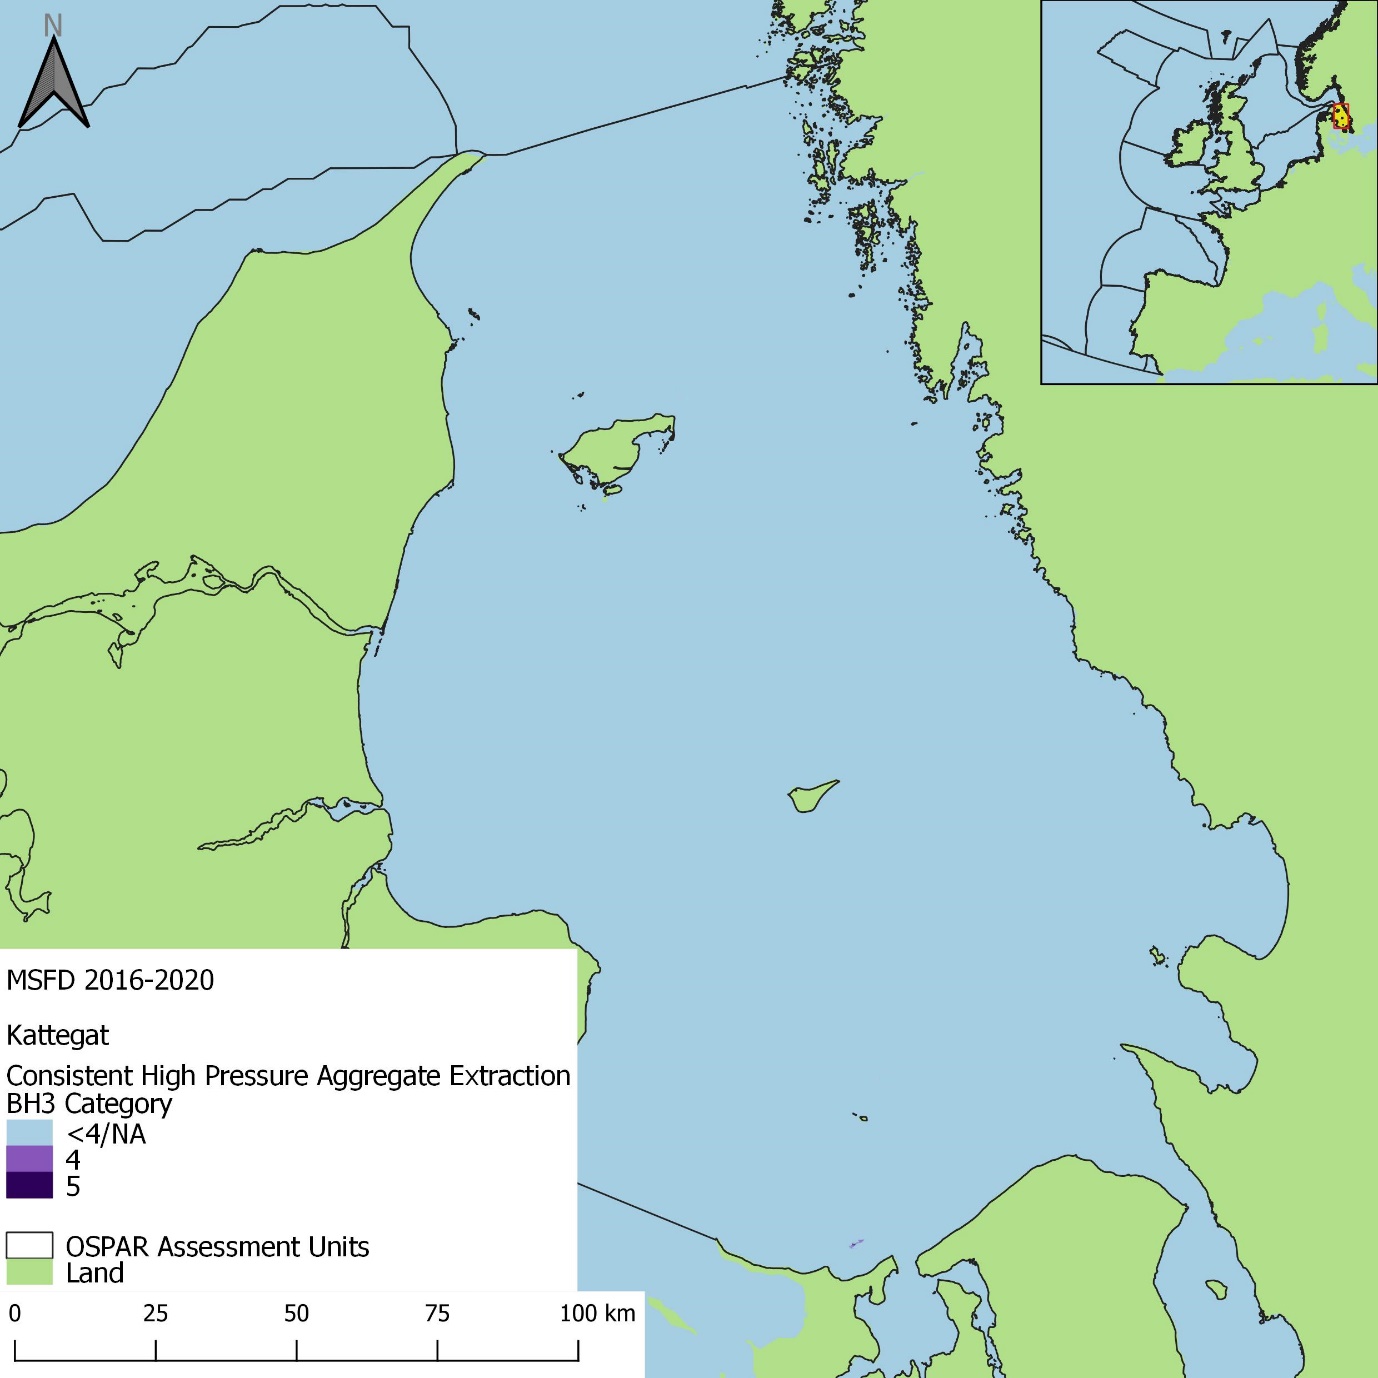
Figure bf: Spatial distribution of consistently high (category 4 or 5) extraction pressure within the 2016 to 2020 assessment period in the Kattegat assessment period. Grid cells were considered to have ‘Consistent’ pressure if a change in less than three pressure categories was observed within the assessment period
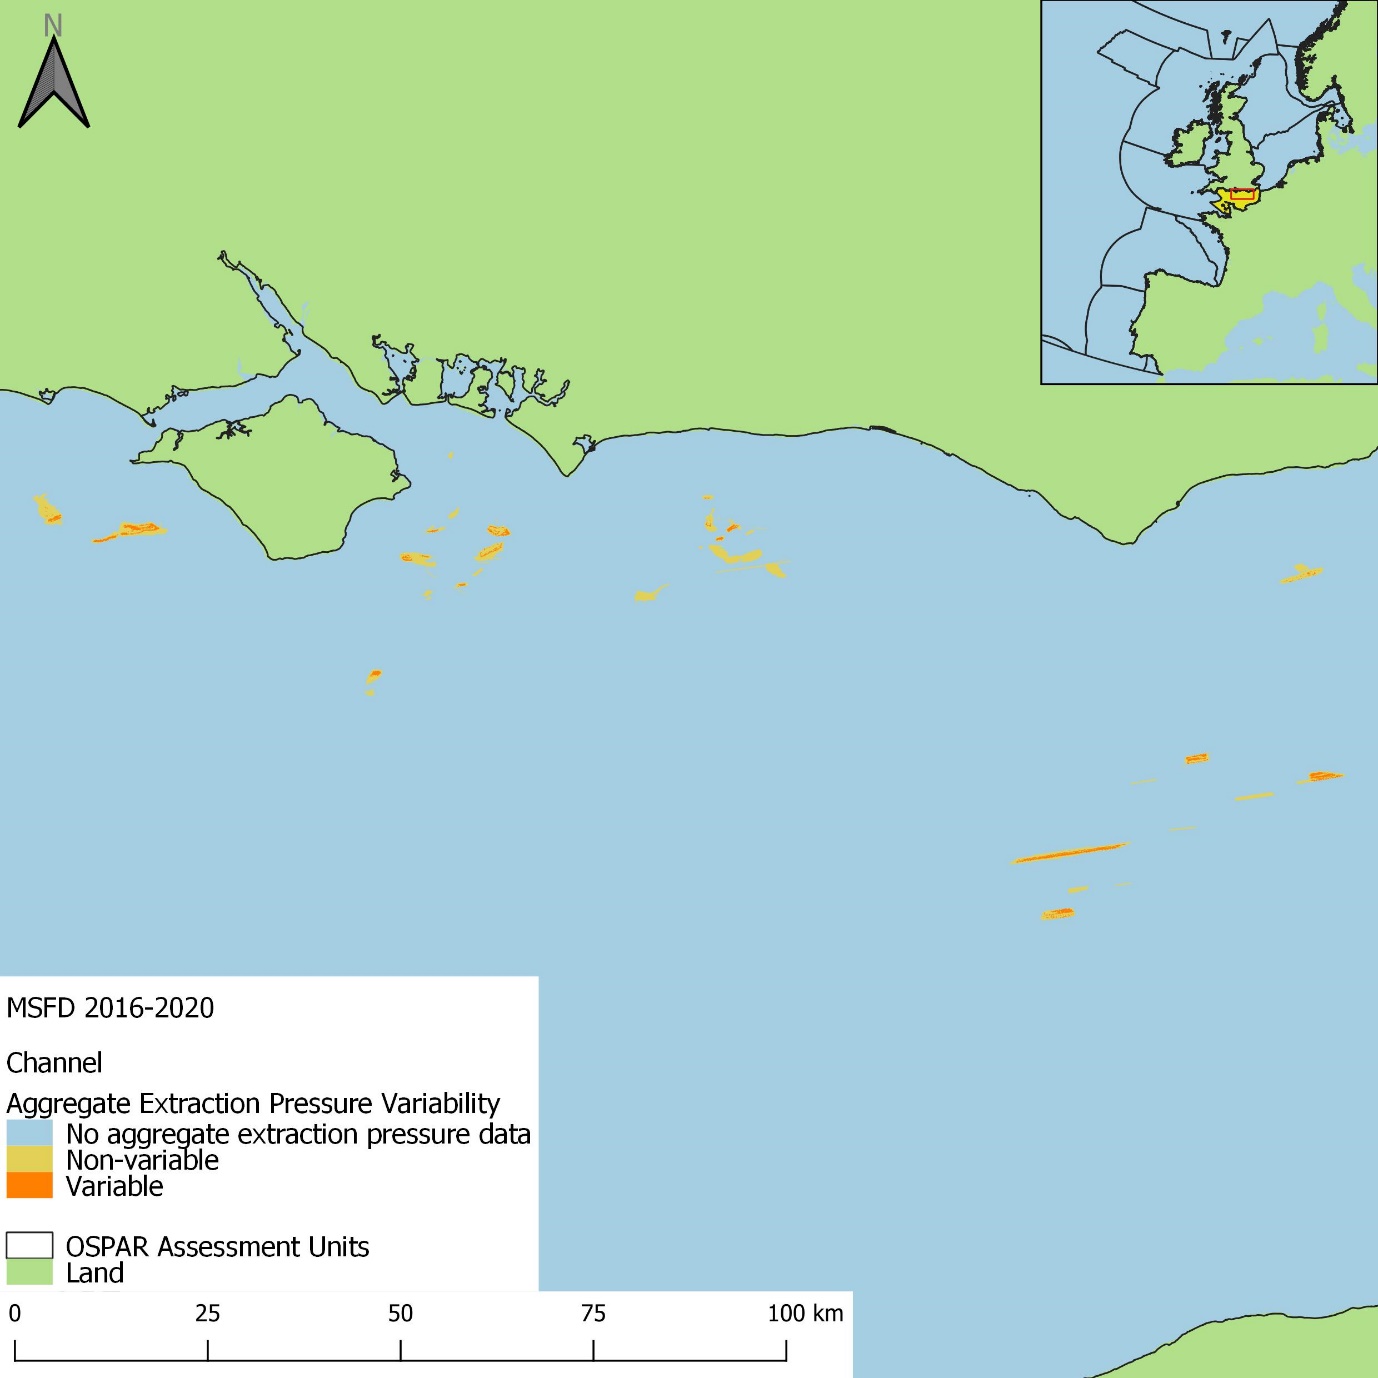
Figure aw: Spatial distribution of ‘Variable’ and ‘Non-variable’ extraction pressure in the 2016 to 2020 assessment period in the Channel assessment unit. Grid cells were categorised ‘Variable’ if a range of three or more pressure categories was observed throughout the time series
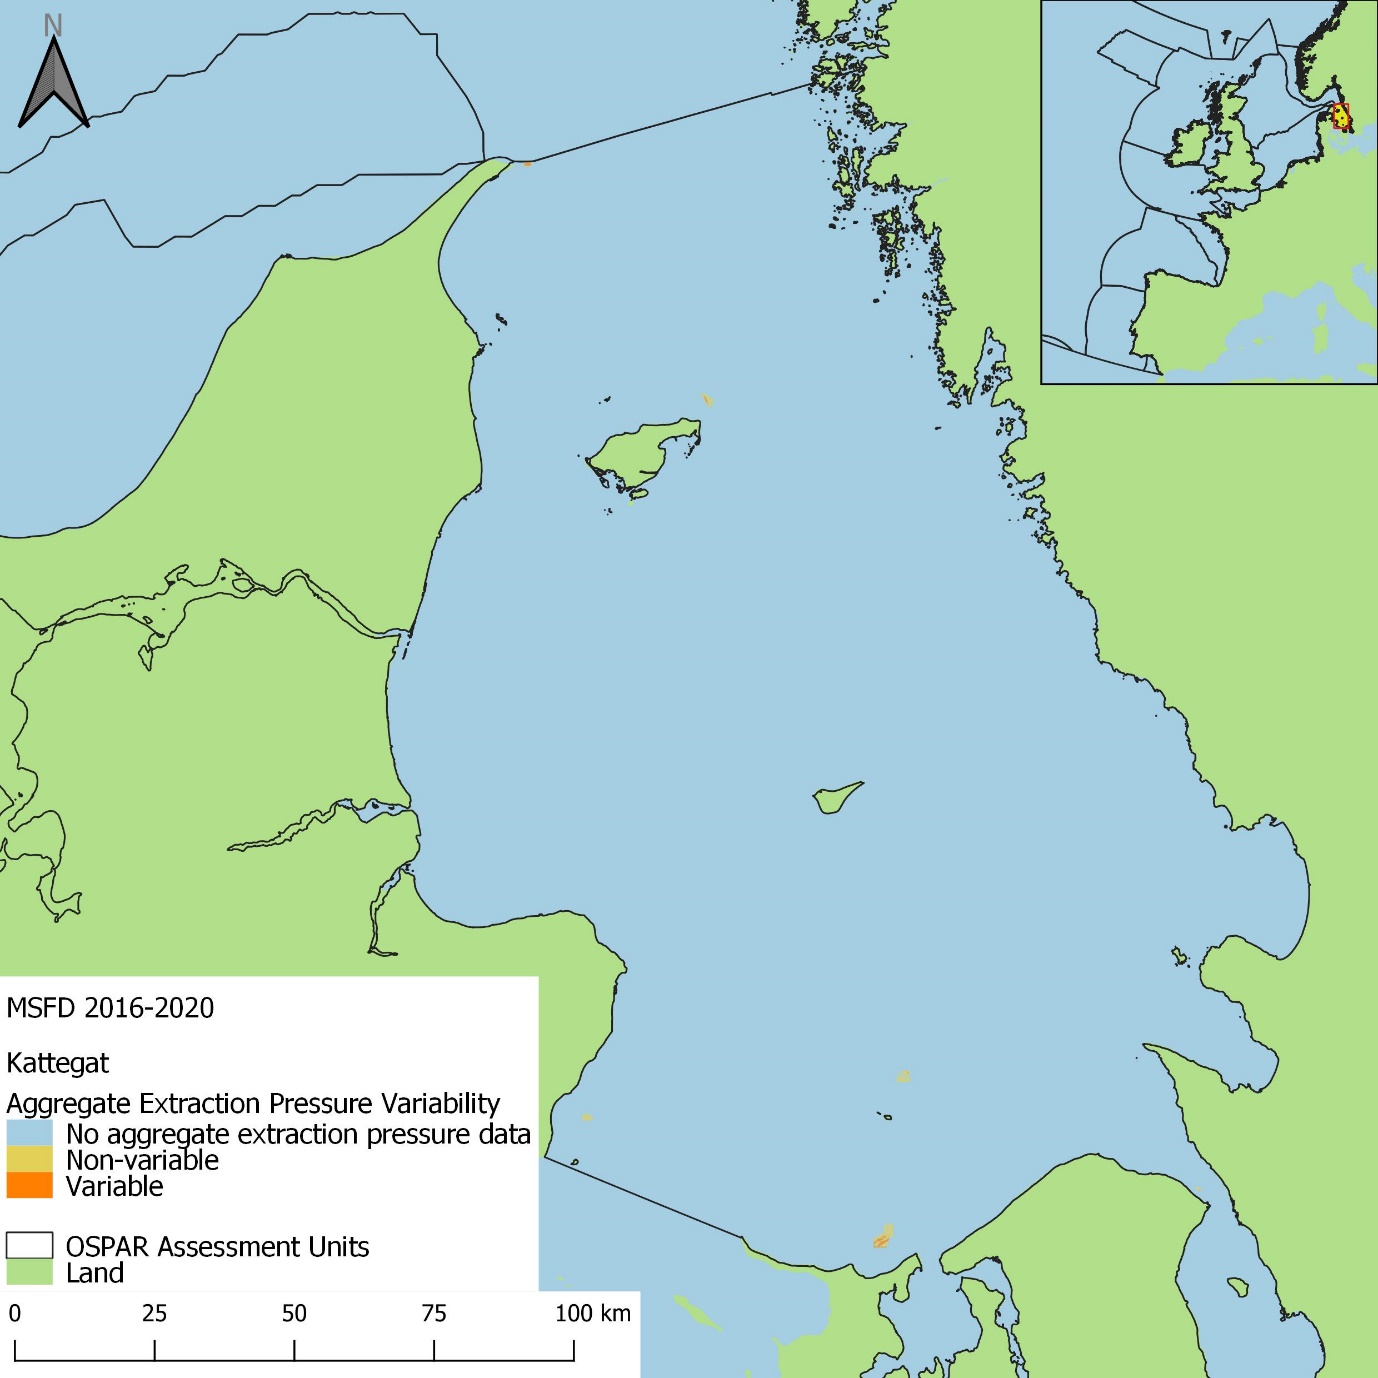
Figure ay: Spatial distribution of ‘Variable’ and ‘Non-variable’ extraction pressure in the 2016 to 2020 assessment period in the Kattegat assessment unit. Grid cells were categorised ‘Variable’ if a range of three or more pressure categories was observed throughout the time series

Figure ba: Spatial distribution of ‘Variable’ and ‘Non-variable’ extraction pressure in the 2016 to 2020 assessment period in the Southern Celtic Sea assessment unit. Grid cells were categorised ‘Variable’ if a range of three or more pressure categories was observed throughout the time series
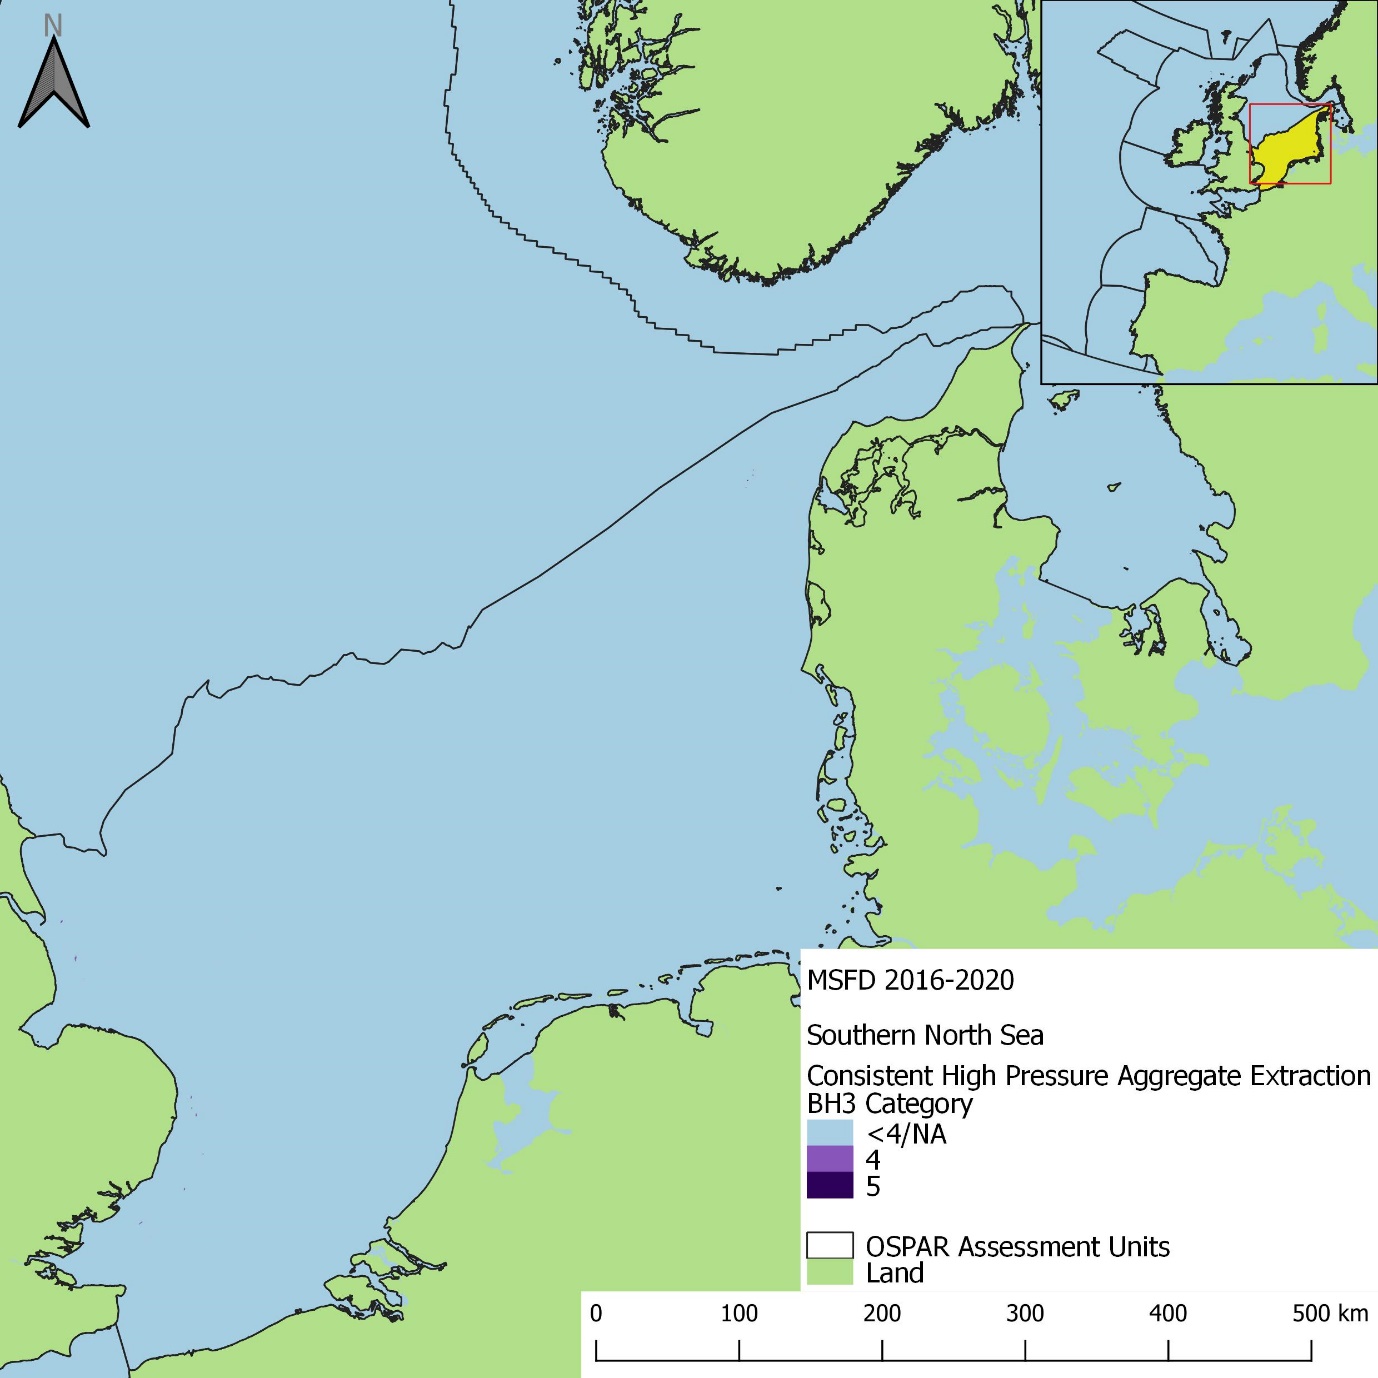
Figure bc: Spatial distribution of consistently high (category 4 or 5) extraction pressure within the 2016 to 2020 assessment period in the Southern North Sea assessment period. Grid cells were considered to have ‘Consistent’ pressure if a change in less than three pressure categories was observed within the assessment period
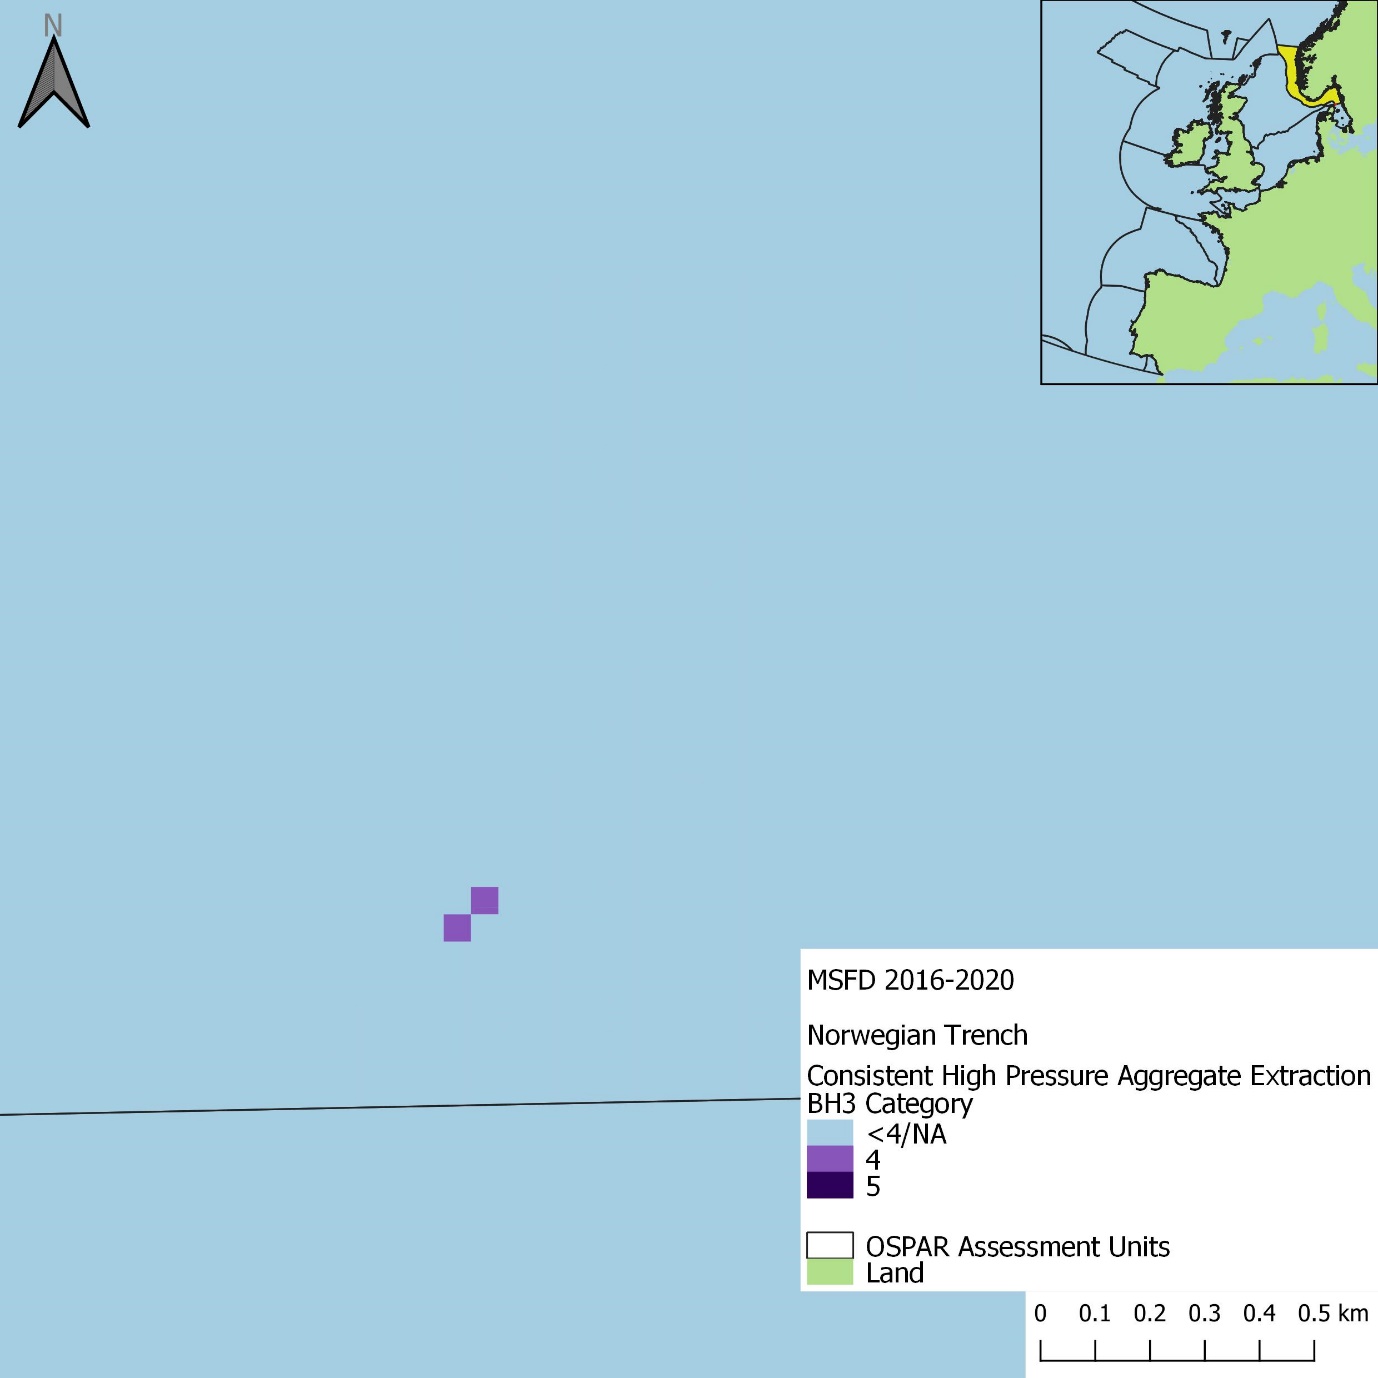
Figure be: Spatial distribution of consistently high (category 4 or 5) extraction pressure within the 2016 to 2020 assessment period in the Norwegian Trench assessment period. Grid cells were considered to have ‘Consistent’ pressure if a change in less than three pressure categories was observed within the assessment period
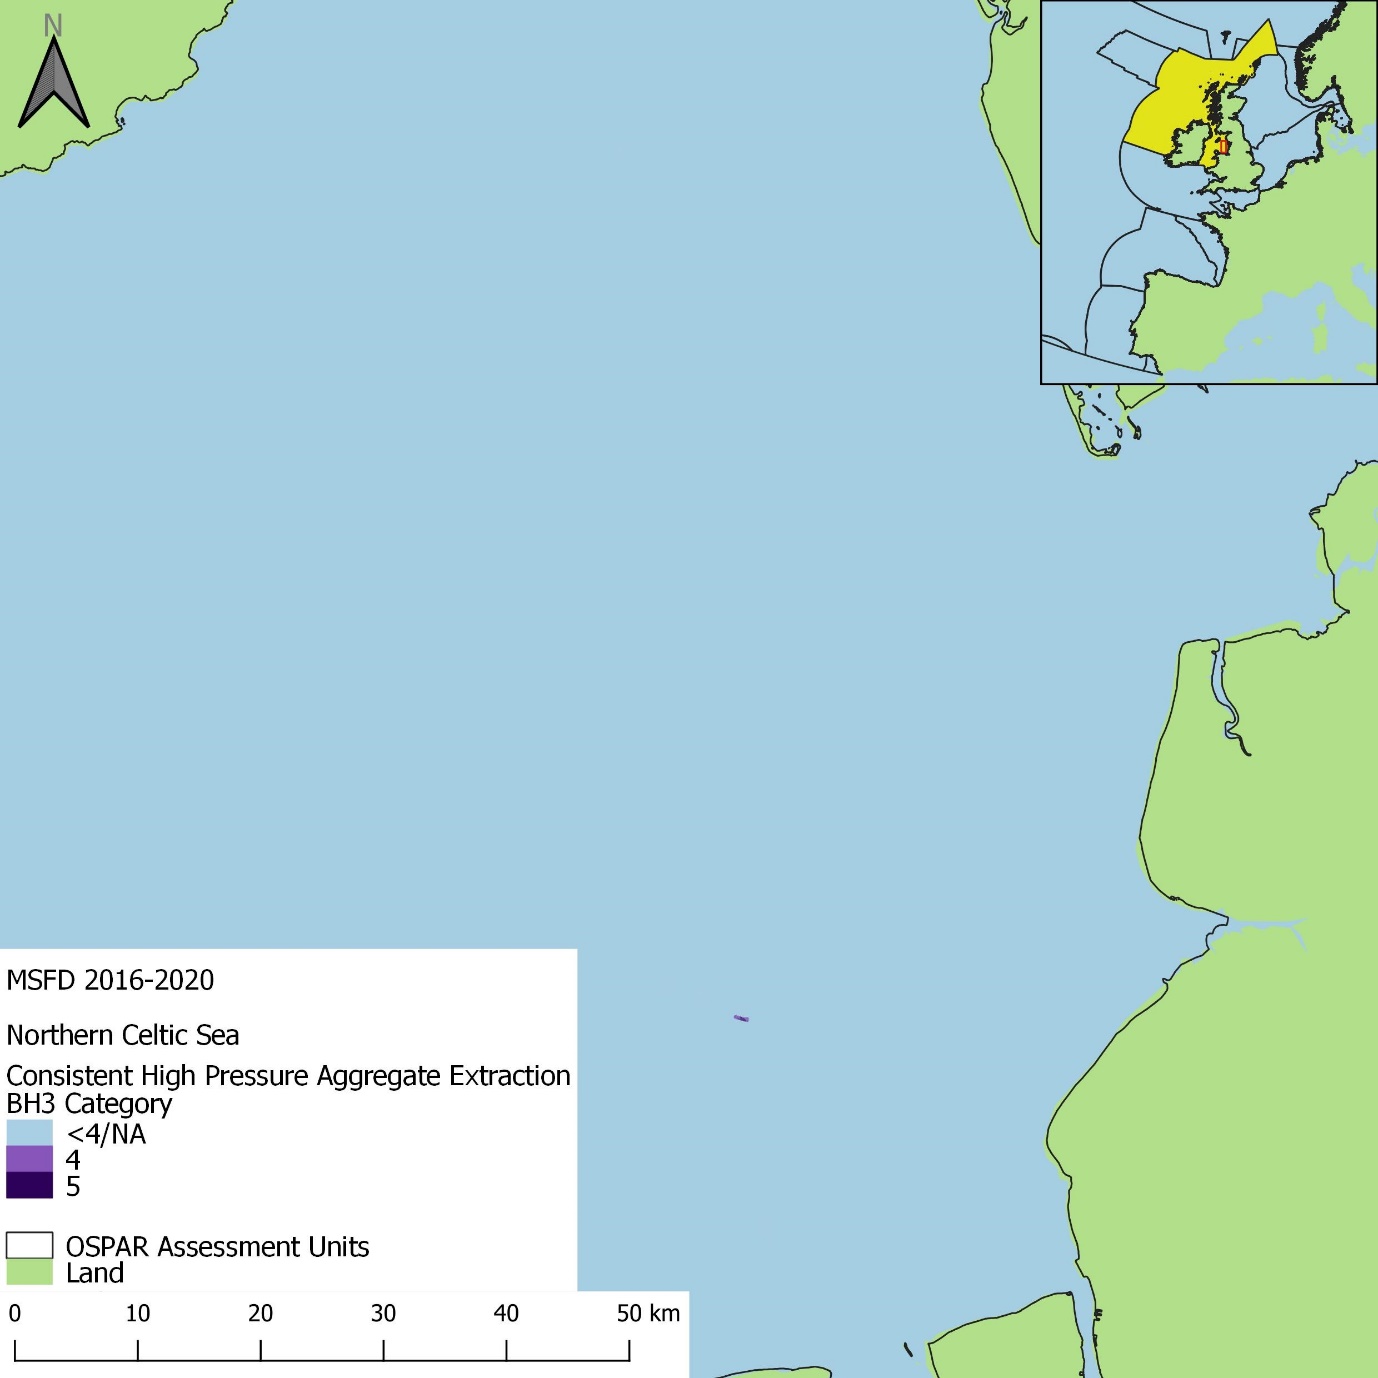
Figure bg: Spatial distribution of consistently high (category 4 or 5) extraction pressure within the 2016 to 2020 assessment period in the Northern Celtic Sea assessment period. Grid cells were considered to have ‘Consistent’ pressure if a change in less than three pressure categories was observed within the assessment period
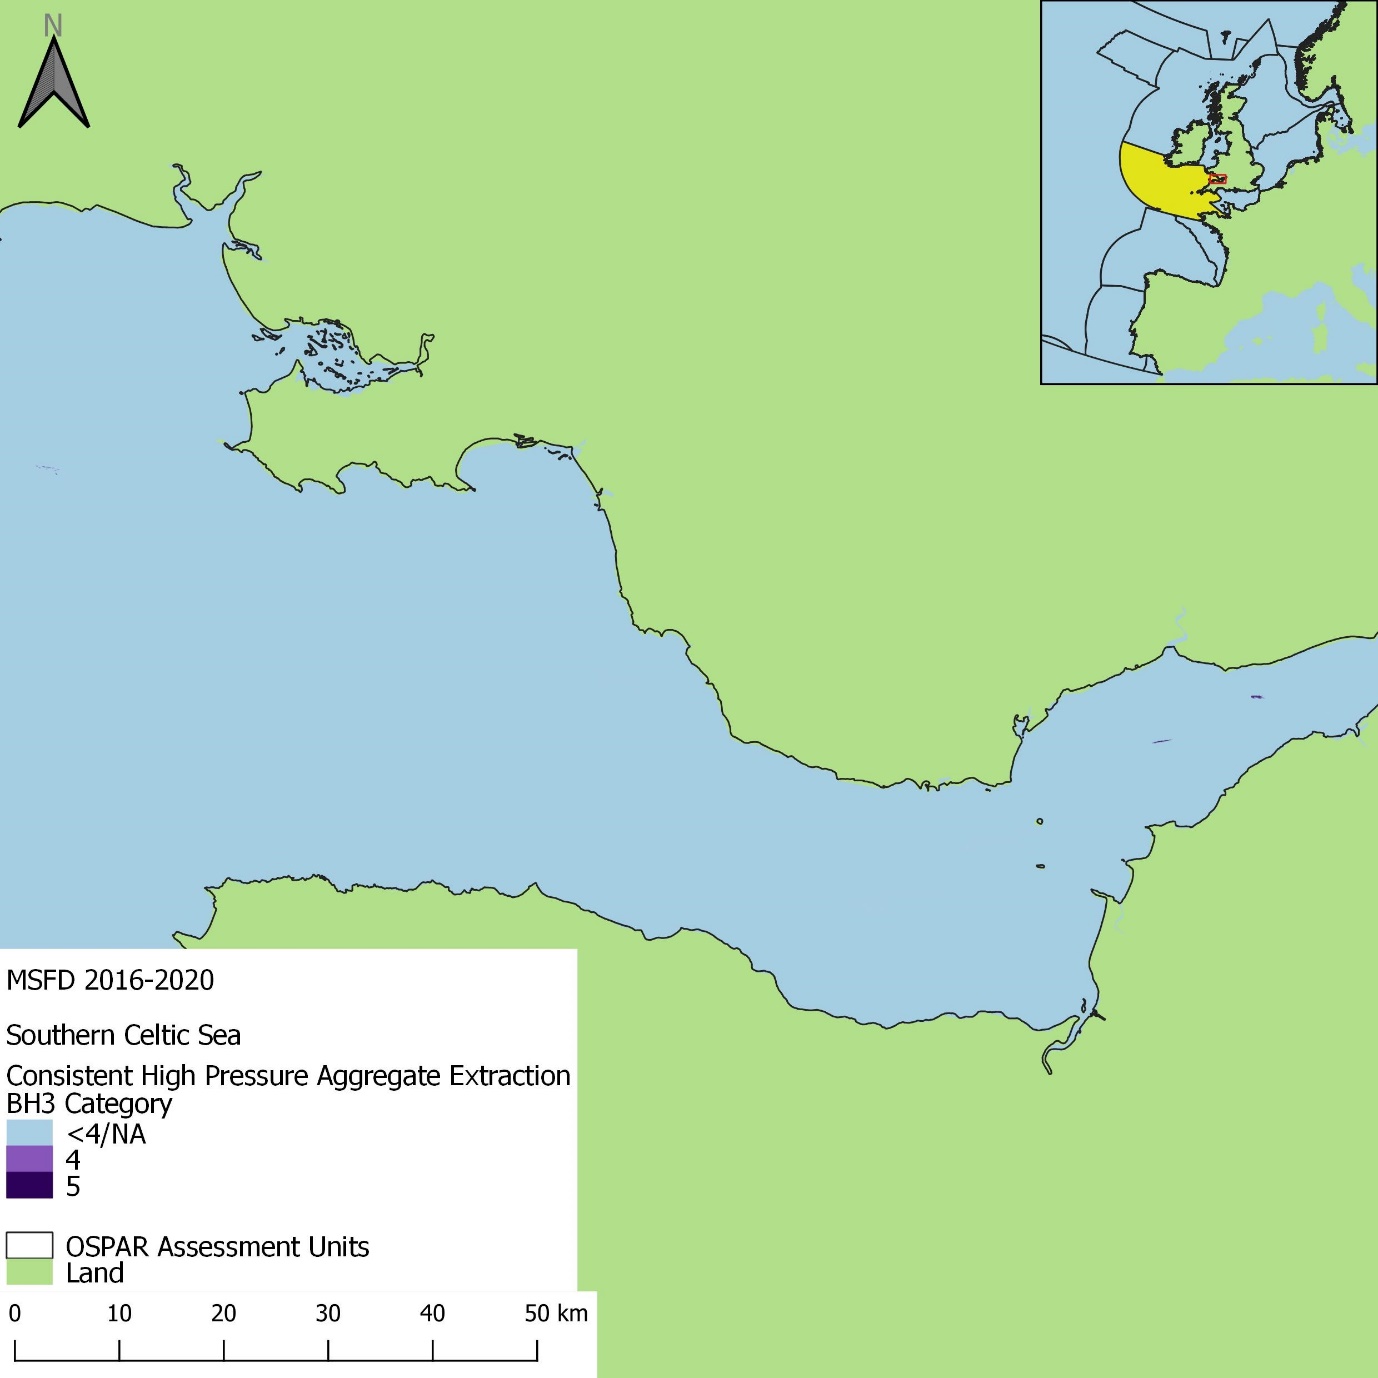
Figure bh: Spatial distribution of consistently high (category 4 or 5) extraction pressure
within the 2016 to 2020 assessment period in the Southern Celtic Sea assessment period.
Grid cells were considered to have ‘Consistent’ pressure if a change in less than three
pressure categories was observed within the assessment period
Seabed habitat disturbance
Extraction data, indicative of dredge footprint and intensity obtained from the United Kingdom were available for the following assessment units for both assessment periods, and therefore were assessed for disturbance: Southern North Sea, Channel, Northern Celtic Sea, and Southern Celtic Sea (Figure 3). Additionally, data indicative of dredge footprint and intensity obtained from Denmark were available for the Southern North Sea, Norwegian Trench, and Kattegat during the 2016 to 2020 assessment period only (Figure 4). Therefore, as extraction disturbance was only analysed based on data received from two Contracting Parties, total extraction disturbance was unavoidably underestimated within the OSPAR Maritime Area.
2009 to 2020
Overall, the percentage of the total area of assessed OSPAR Common Indicator Assessment Units (Southern North Sea, Channel, Northern Celtic Sea, and Southern Celtic Sea) under disturbance from extraction pressure in the 2009 to 2020 assessment period was minimal (Table j). ‘High’ disturbance was the most prevalent disturbance group (0,012%), closely followed by ‘Low’ disturbance (0,011%) and finally, ‘Moderate’ disturbance (0,004%). Additionally, a small proportion (<0,001%) of assessed area where extraction pressure occurred was analysed as ‘Unassessed disturbance’ due to a lack of habitat and / or sensitivity information.
The proportion of each BHT area across the Southern North Sea, Channel, Northern Celtic Sea, and Southern Celtic Sea under extraction disturbance was also minimal (Figure bi). Circalittoral mixed sediment had the greatest proportion of habitat area under ‘High’ disturbance alone (0,19%), and total disturbance (0,46%).
Table j: Percentage of total area of assessment units where extraction intensity data from the United Kingdom was present (Southern North Sea, Channel, Northern Celtic Sea, Southern Celtic Sea) under disturbance groups in the 2009 to 2020 assessment period where: ‘Low’ = disturbance categories 1-4; ‘Moderate’ = disturbance categories 5-7; ‘High’ = disturbance categories 8 and 9; ‘Unassessed Disturbance’ = area where extraction pressure was present but disturbance could not be assessed due to i) no habitat data, or ii) no sensitivity assessments for underlying habitat
| Disturbance Group | Percentage of total Common Indicator Assessment Area |
|---|---|
| Low | 0,011% |
| Moderate | 0,004% |
| High | 0,012% |
| Unassessed Disturbance | <0,001% |
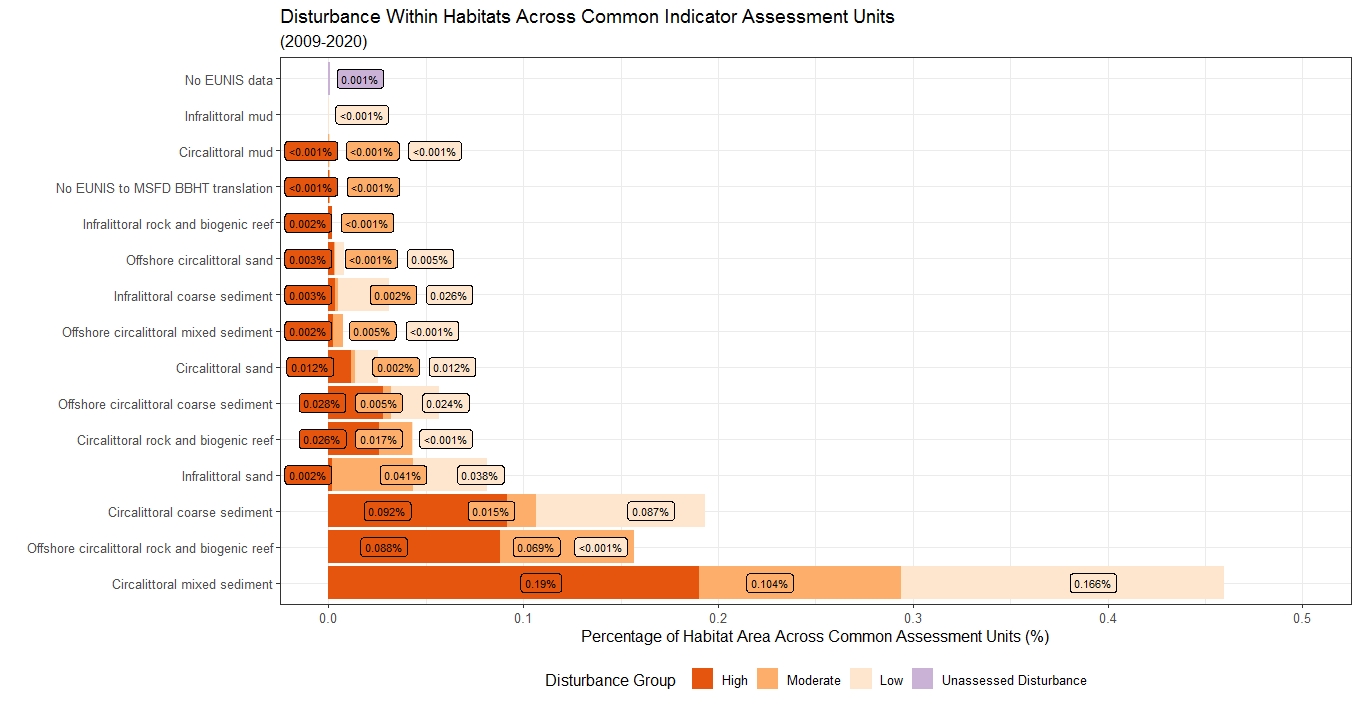
Figure bi: The percentage of each distinct Broad Habitat Type’s area across OSPAR benthic assessment units that contained extraction intensity data from the United Kingdom (Southern North Sea, Channel, Northern Celtic Sea, Southern Celtic Sea) under each of the following disturbance groups in the 2009 to 2020 assessment period: ‘High’ = disturbance categories 8 and 9; ‘Moderate’ = disturbance categories 5 to 7; ‘Low’ = disturbance categories 1 to 4; ‘Unassessed Disturbance’ = area where fishing pressure was present but disturbance could not be assessed due to i) no habitat data, or ii) no sensitivity assessments for underlying habitat
Assessment Unit Summary: Southern North Sea
Within the Southern North Sea, disturbance was recorded in 0.096% of the assessment unit, and was distributed off the east coast of England (Figure bj). The greatest proportion of disturbance was in the ‘Low’ disturbance group, (0,041%), followed by ‘High’ (0,039%) and ‘Moderate’ (0,016%) disturbance (Figure bn). Although it did not cover the greatest area, ‘High’ disturbance was consistently concentrated in the centre of areas of activity (Figure bj). Within habitats, Offshore circalittoral rock and biogenic reef had the greatest proportion of ‘High’ disturbance (2,341%) (Figure bo). The relatively large proportion of disturbance in Offshore circalittoral rock and biogenic reef BHT can be partially explained by the correspondingly small proportion of rock habitats in the Southern North Sea and the occurrence of ‘Sublittoral polychaete worm reefs on sediment’ EUNIS 2007 habitat type (A5.61) in areas of extraction activity.
Annual disturbance assessments in the waters of the United Kingdom indicated little annual variation in disturbance between 2009 to 2020 in the Southern North Sea (Figure bp). Nonetheless, all disturbance groups showed a pattern of gradual decrease in percentage coverage between 2009 and 2015, followed by a slight increase between 2015 and 2019. Despite interannual variability, ‘Low’ disturbance remained the predominant group throughout the majority of the time series, consistent with the aggregated assessment of disturbance within the Southern North Sea for the 2009 to 2020 assessment period (Figure bn and Figure bp).
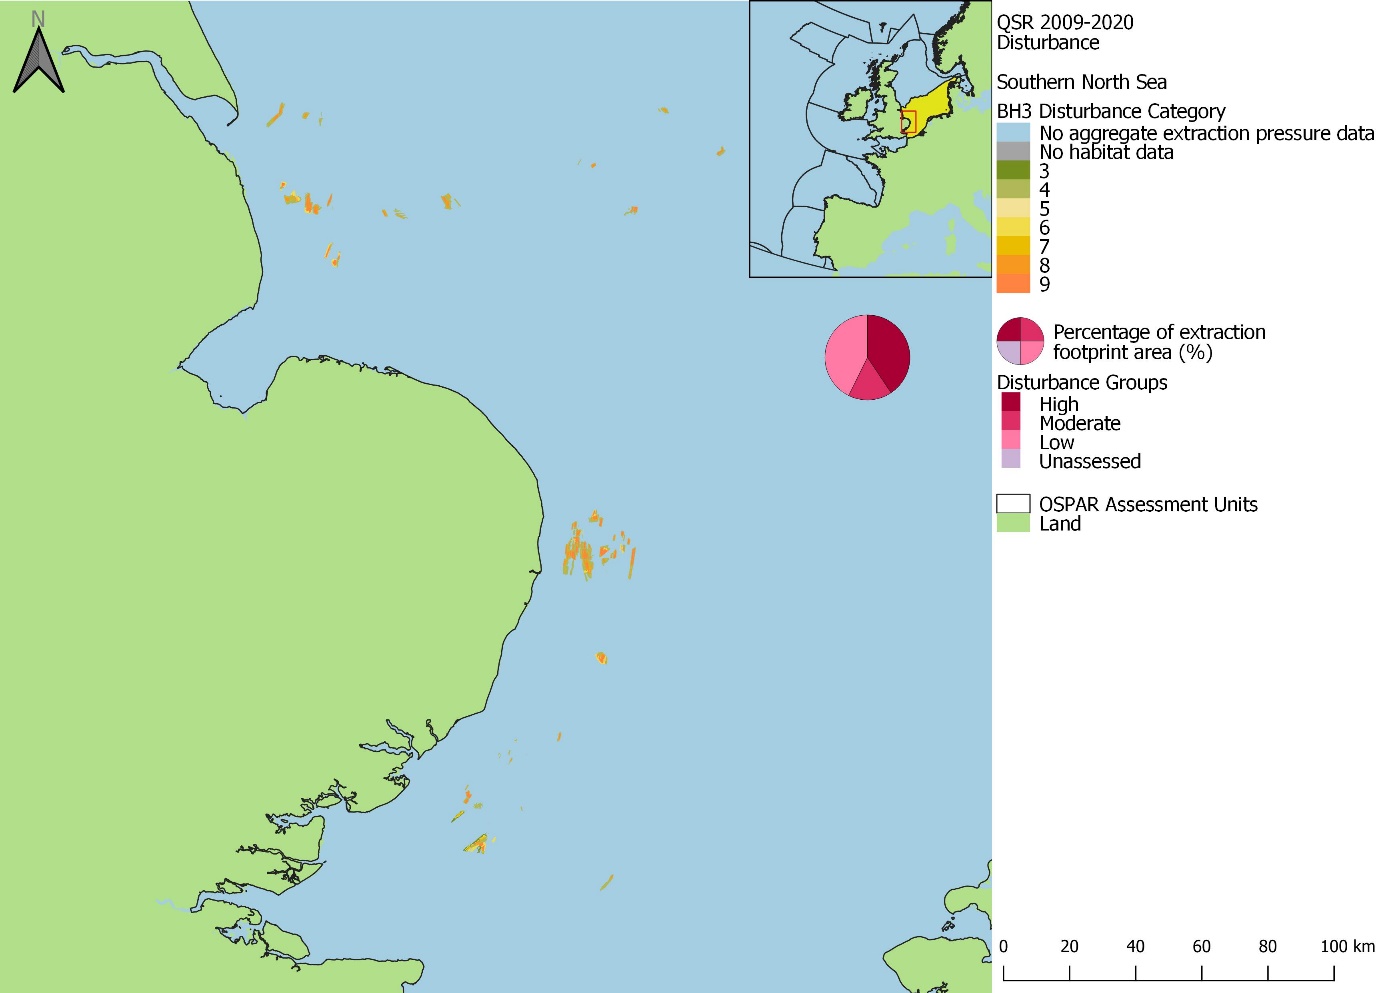
Figure bj: Spatial distribution of extraction disturbance within the Southern North Sea assessment unit in the 2009 to 2020 assessment period. Pie charts show the percentage of the extraction footprint area under each disturbance group: ‘High’ (categories 8-9), ‘Moderate’ (categories 5-7), ‘Low’ (categories 1-4), and Unassessed (area where extraction pressure was present, but disturbance could not be assessed due to i) no habitat data, or ii) no sensitivity assessments for underlying habitat)
Assessment Unit Summary: Channel
The highest proportion of disturbance within an assessment unit was recorded in the Channel (0,147%), where disturbance was distributed in the centre of the assessment unit, off the south coast of England (Figure bk and Figure bn). Additionally, the greatest proportion of assessment area under ‘High’ and ‘Low’ disturbance groups occurred within the Channel (0,082% and 0,054% respectively). However, in contrast to the Southern North Sea, the majority of disturbance in the Channel was categorised as ‘High’ disturbance, followed by ‘Low’ (0,054%) and ‘Moderate’ (0,011%) disturbance, respectively. Despite the greater prevalence of ‘High’ disturbance, areas with ‘High’ disturbance were predominantly concentrated in the centre of areas of activity in the Channel (Figure bk). Within habitats, Circalittoral coarse sediment had the greatest proportion of ‘High’ disturbance (0,276%) (Figure bo).
The greatest annual variation in percentage of assessment unit area covered by different disturbance groups between 2009 and 2020 was observed in the Channel, although percentage values remained negligible (Figure bp). Although ‘Low’ disturbance was the predominant group in 2009 and 2010, from 2011 ‘High’ disturbance consistently covered the greatest percentage of the Channel.
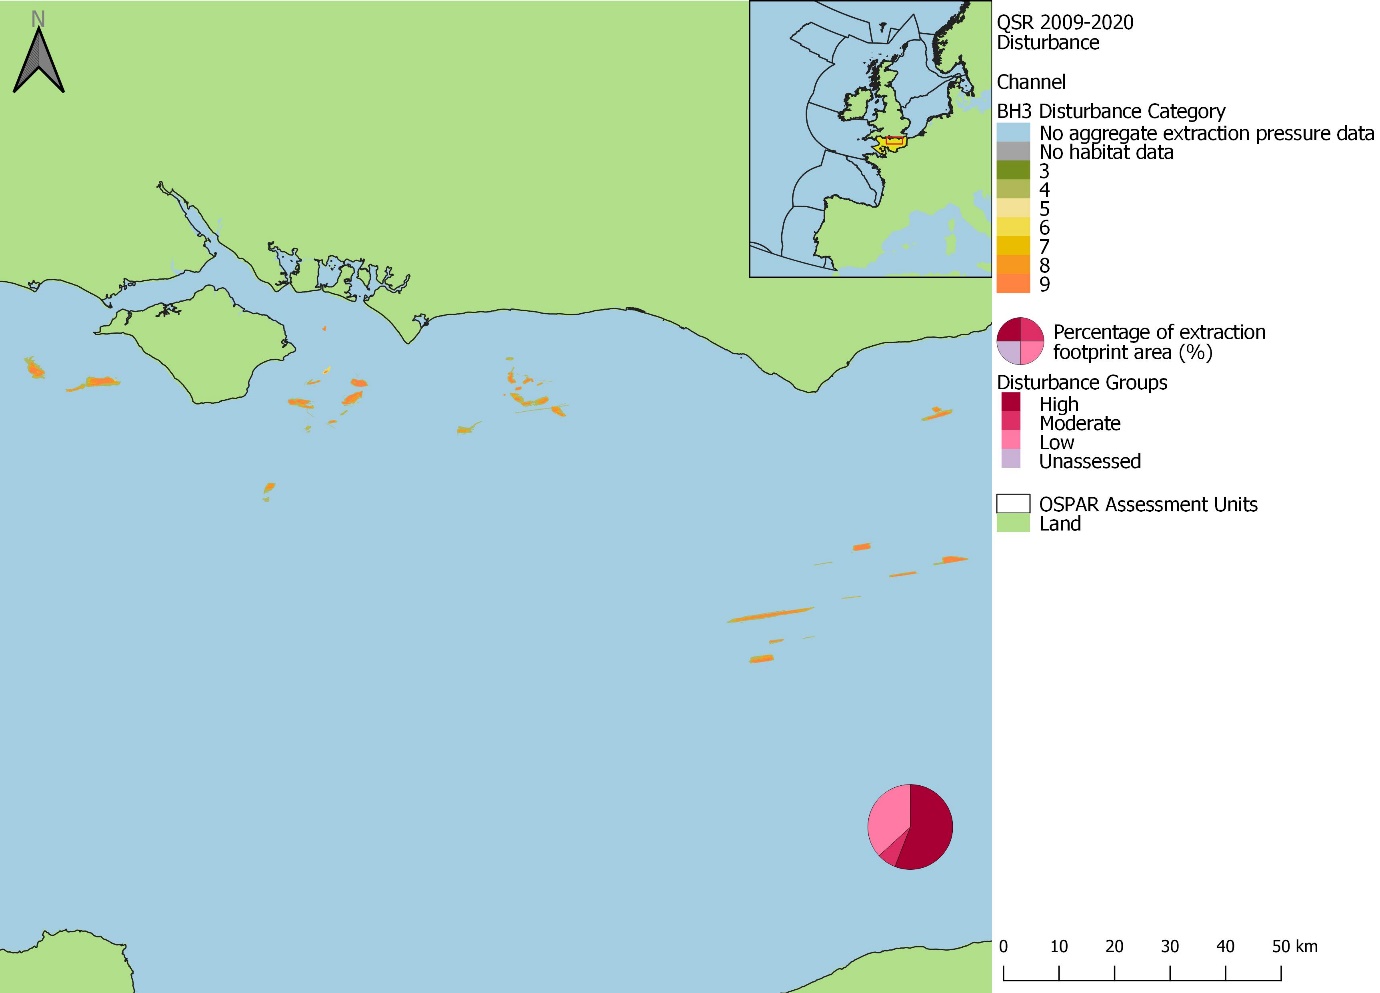
Figure bk: Spatial distribution of extraction disturbance within the Channel assessment unit in the 2009 to 2020 assessment period. Pie charts show the percentage of the extraction footprint area under each disturbance group: ‘High’ (categories 8-9), ‘Moderate’ (categories 5-7), ‘Low’ (categories 1-4), and Unassessed (area where extraction pressure was present, but disturbance could not be assessed due to i) no habitat data, or ii) no sensitivity assessments for underlying habitat)
Assessment Unit Summary: Northern Celtic Sea
The smallest proportion of disturbance was recorded in the Northern Celtic Sea assessment unit, amounting to just 0,001% of the total area (Figure bn). Disturbance was predominantly concentrated off the north coast of Wales, with a small area of activity located further north off the west coast of England (Figure bl). Due to such a small prevalence of disturbance in the Northern Celtic Sea, all individual disturbance groups covered less than 0,001% of the assessment unit (Figure bn). However, the distribution of ‘High’ disturbance remained concentrated in the centre of areas of extraction activity (Figure bl). Additionally, within habitats, ‘High’ disturbance covered the greatest percentage of Infralittoral coarse sediment and Circalittoral coarse sediment (0,002%) (Figure bo).
Due to the low prevalence of disturbance in the Northern Celtic Sea, it was not possible to visualise any trends in annual variation (Figure bp). However, the proportion of disturbance from all three groups remained at a near constant level, below 0,001%.

Figure bl: Spatial distribution of extraction disturbance within the Northern Celtic Sea assessment unit in the 2009 to 2020 assessment period. Pie charts show the percentage of the extraction footprint area under each disturbance group: ‘High’ (categories 8-9), ‘Moderate’ (categories 5-7), ‘Low’ (categories 1-4), and Unassessed (area where extraction pressure was present, but disturbance could not be assessed due to i) no habitat data, or ii) no sensitivity assessments for underlying habitat)
Assessment Unit Summary: Southern Celtic Sea
Disturbance was recorded in 0,005% of the Sothern Celtic Sea and was concentrated in the Bristol Channel and Severn Estuary, between England and Wales (Figure bm and Figure bn). ‘High’ disturbance accounted for 0,003% of the area, followed by ‘Low’ (0,002%) and ‘Moderate’ disturbance (less than 0,001%), respectively (Figure bn). Additionally, the distribution of ‘High’ disturbance remained consistently concentrated in the centre of areas of extraction disturbance (Figure bm). In the east of the Bristol Channel one area of activity had a large proportion of ‘Unassessed’ disturbance (no habitat data). Within habitats, the greatest proportion of ‘High’ disturbance occurred in Circalittoral sand (0,091%; Figure bo).
Due to the low prevalence of disturbance in the Southern Celtic Sea, it was not possible to visualise any trends in annual variation (Figure bp). However, the proportion of disturbance from all three groups remained at a near constant level, below 0,002%.
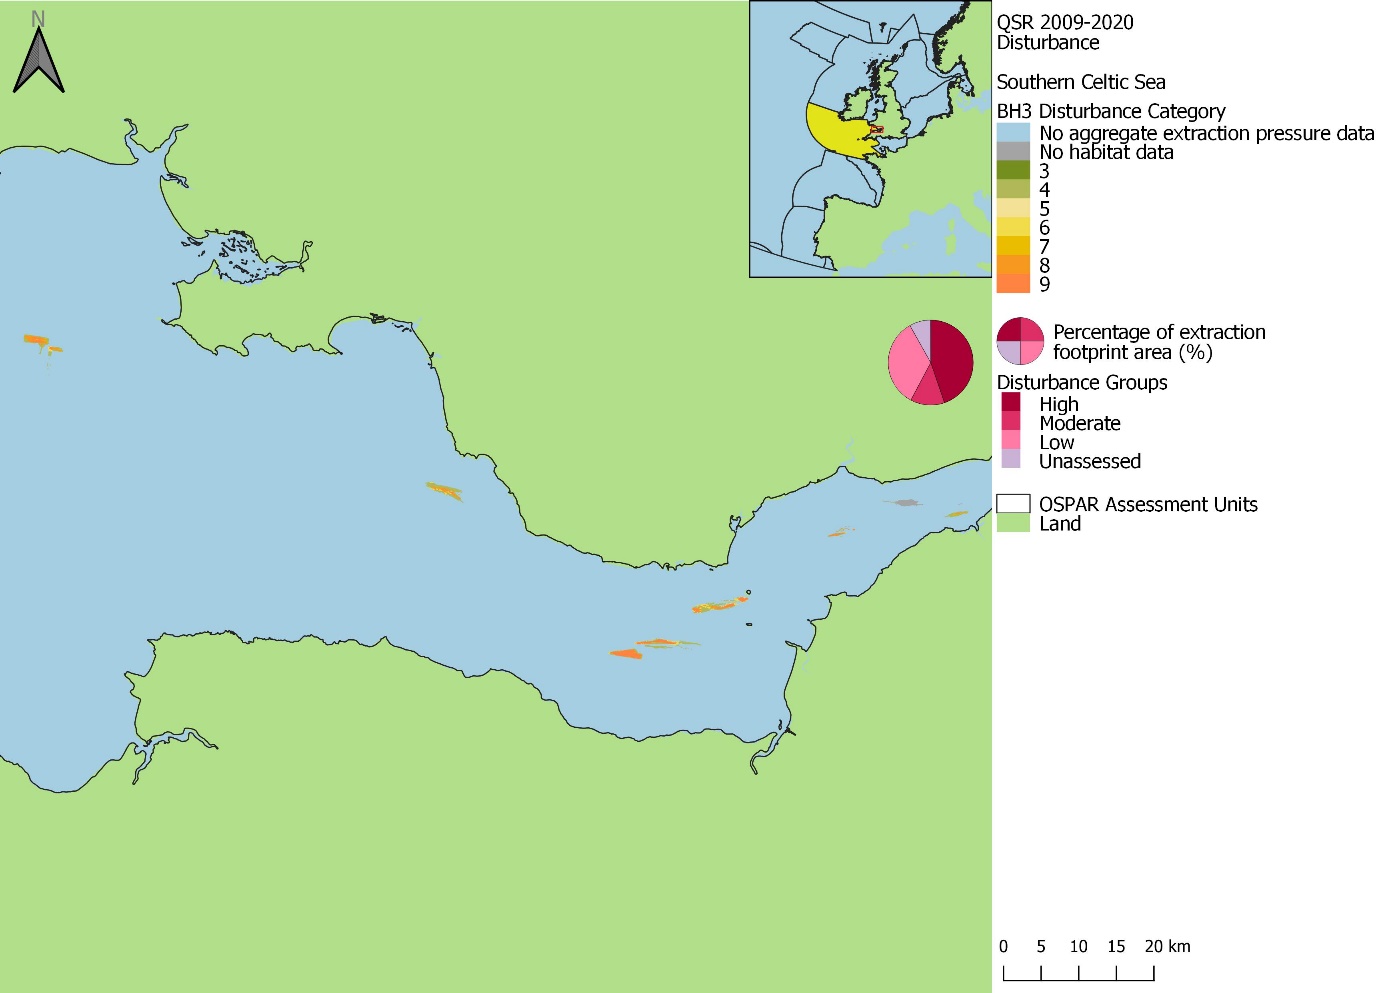
Figure bm: Spatial distribution of extraction disturbance within the Southern Celtic Sea assessment unit in the 2009 to 2020 assessment period. Pie charts show the percentage of the extraction footprint area under each disturbance group: ‘High’ (categories 8-9), ‘Moderate’ (categories 5-7), ‘Low’ (categories 1-4), and Unassessed (area where extraction pressure was present, but disturbance could not be assessed due to i) no habitat data, or ii) no sensitivity assessments for underlying habitat)
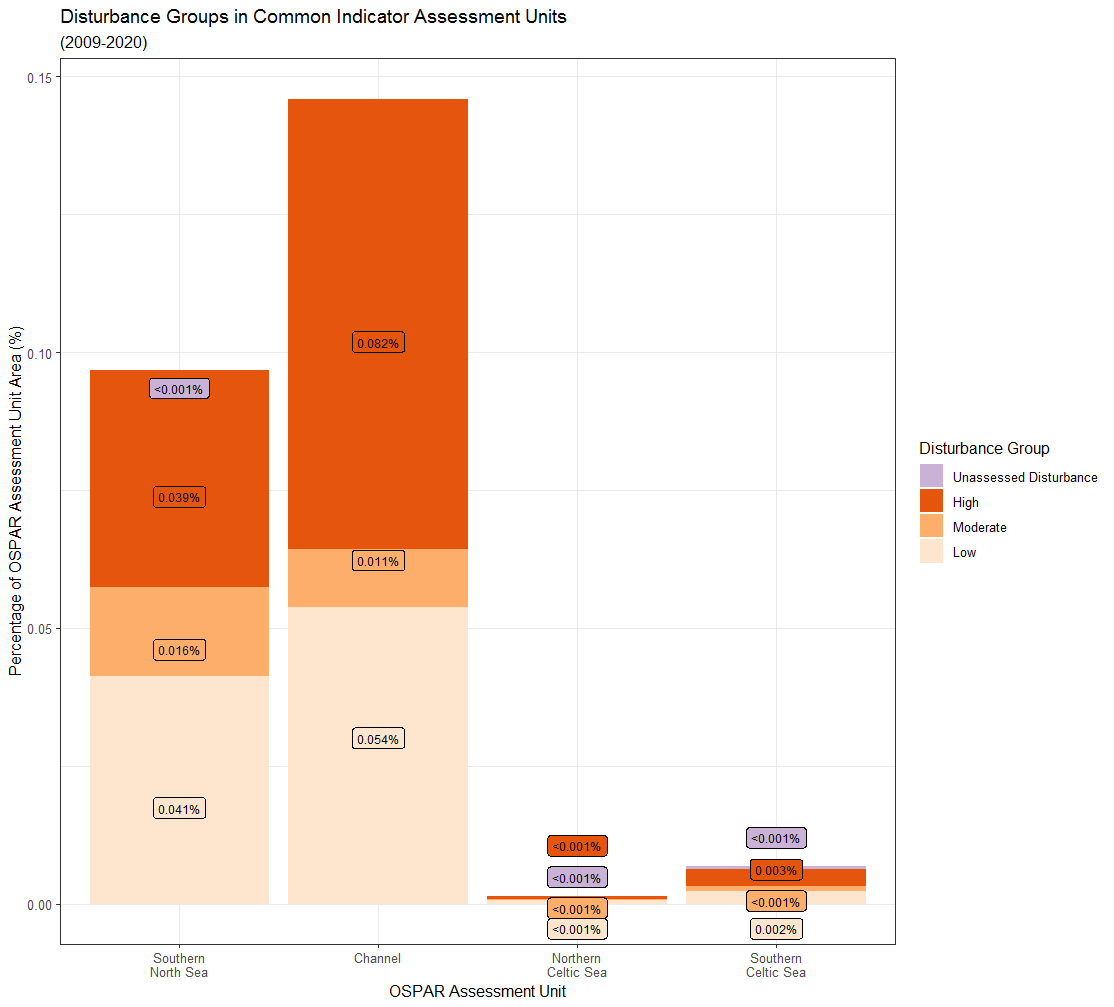
Figure bn: The percentage of OSPAR Common Indicator Assessment Units under each of the following disturbance groups in the 2009 to 2020 assessment period: ‘Unassessed Disturbance’ = area where extraction pressure was present but disturbance could not be assessed due to i) no habitat data, or ii) no sensitivity assessments for underlying habitat; ‘Low’ = disturbance categories 1-4; ‘Moderate’ = disturbance categories 5-7; ‘High’ = disturbance categories 8 and 9. Horizontal black lines represent the separation in biological zones
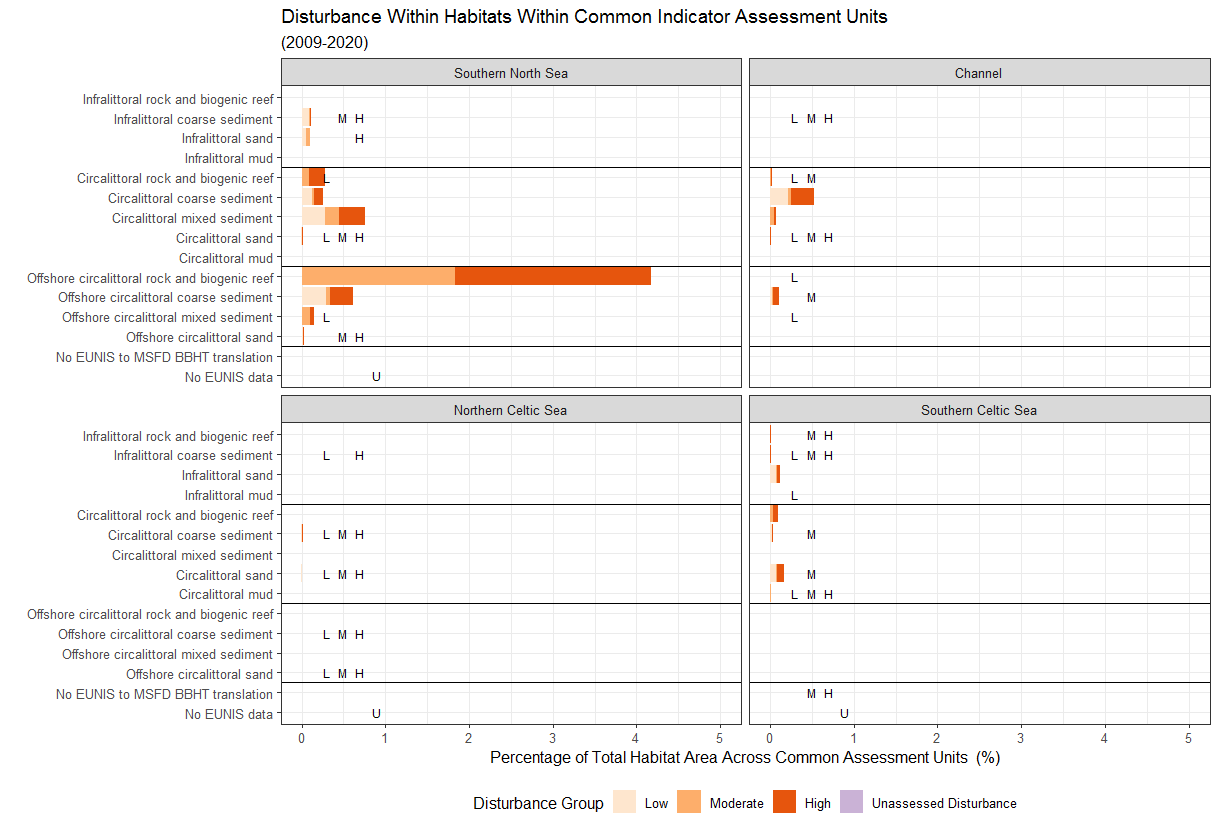
Figure bo: The percentage of Broad Habitat Type in each OSPAR common indicator assessment units) under each of the following disturbance groups in the 2009 to 2020 assessment period: ‘Unassessed Disturbance’ = area where extraction pressure was present but disturbance could not be assessed due to i) no habitat data, or ii) no sensitivity assessments for underlying habitat; ‘Low’ = disturbance categories 1-4; ‘Moderate’ = disturbance categories 5-7; ‘High’ = disturbance categories 8 and 9. Horizontal black lines represent the separation in biological zones. Disturbance groups that where present but covered <= 0,01% of a habitat area are represented by text labels where L = ‘Low’, M = ‘Moderate’, H = ‘High’, and U = ‘Unassessed Disturbance’
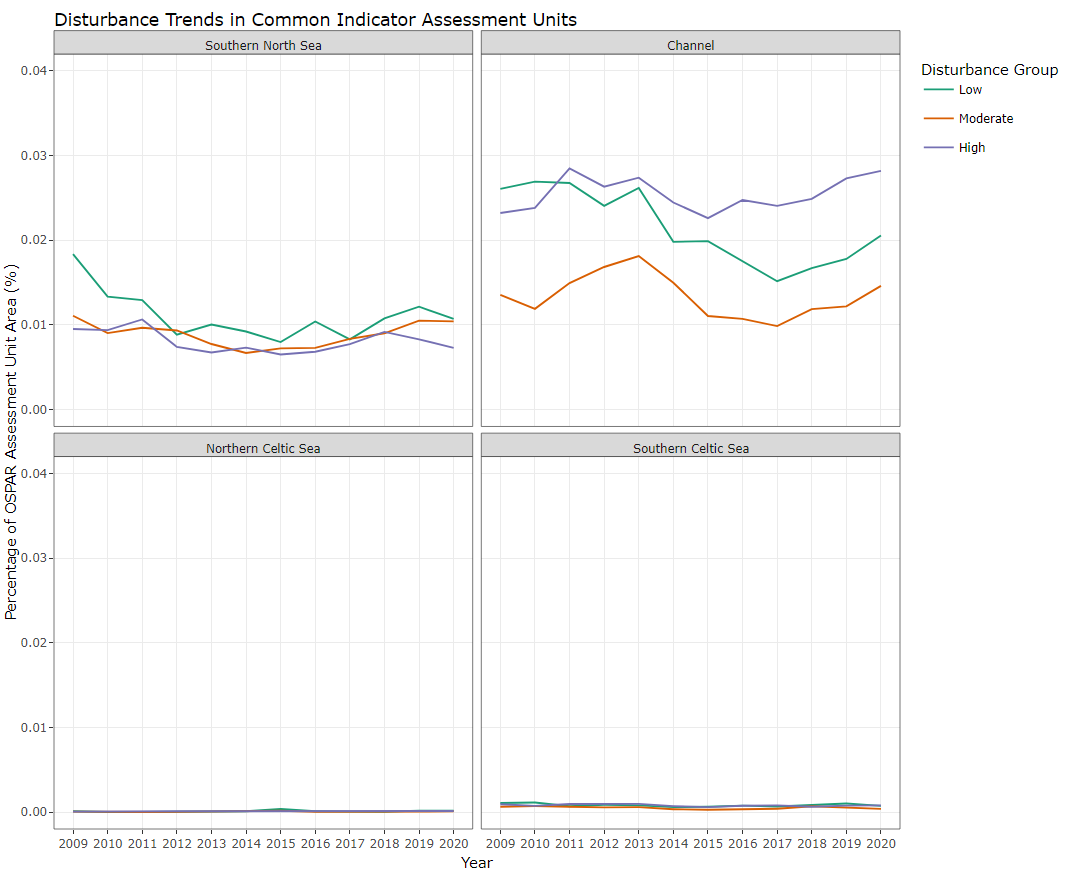
Figure bp: The annual percentage of OSPAR benthic assessment unit areas (where BH3 is agreed as an OSPAR Common Indicator) under the disturbance groups ‘Low’ (disturbance categories 1-4), ‘Moderate’ (disturbance categories 5-7) and ‘High’ (disturbance categories 8 and 9) between the years 2009 to 2020. Note, only data covering the entire assessment period is shown (United Kingdom)
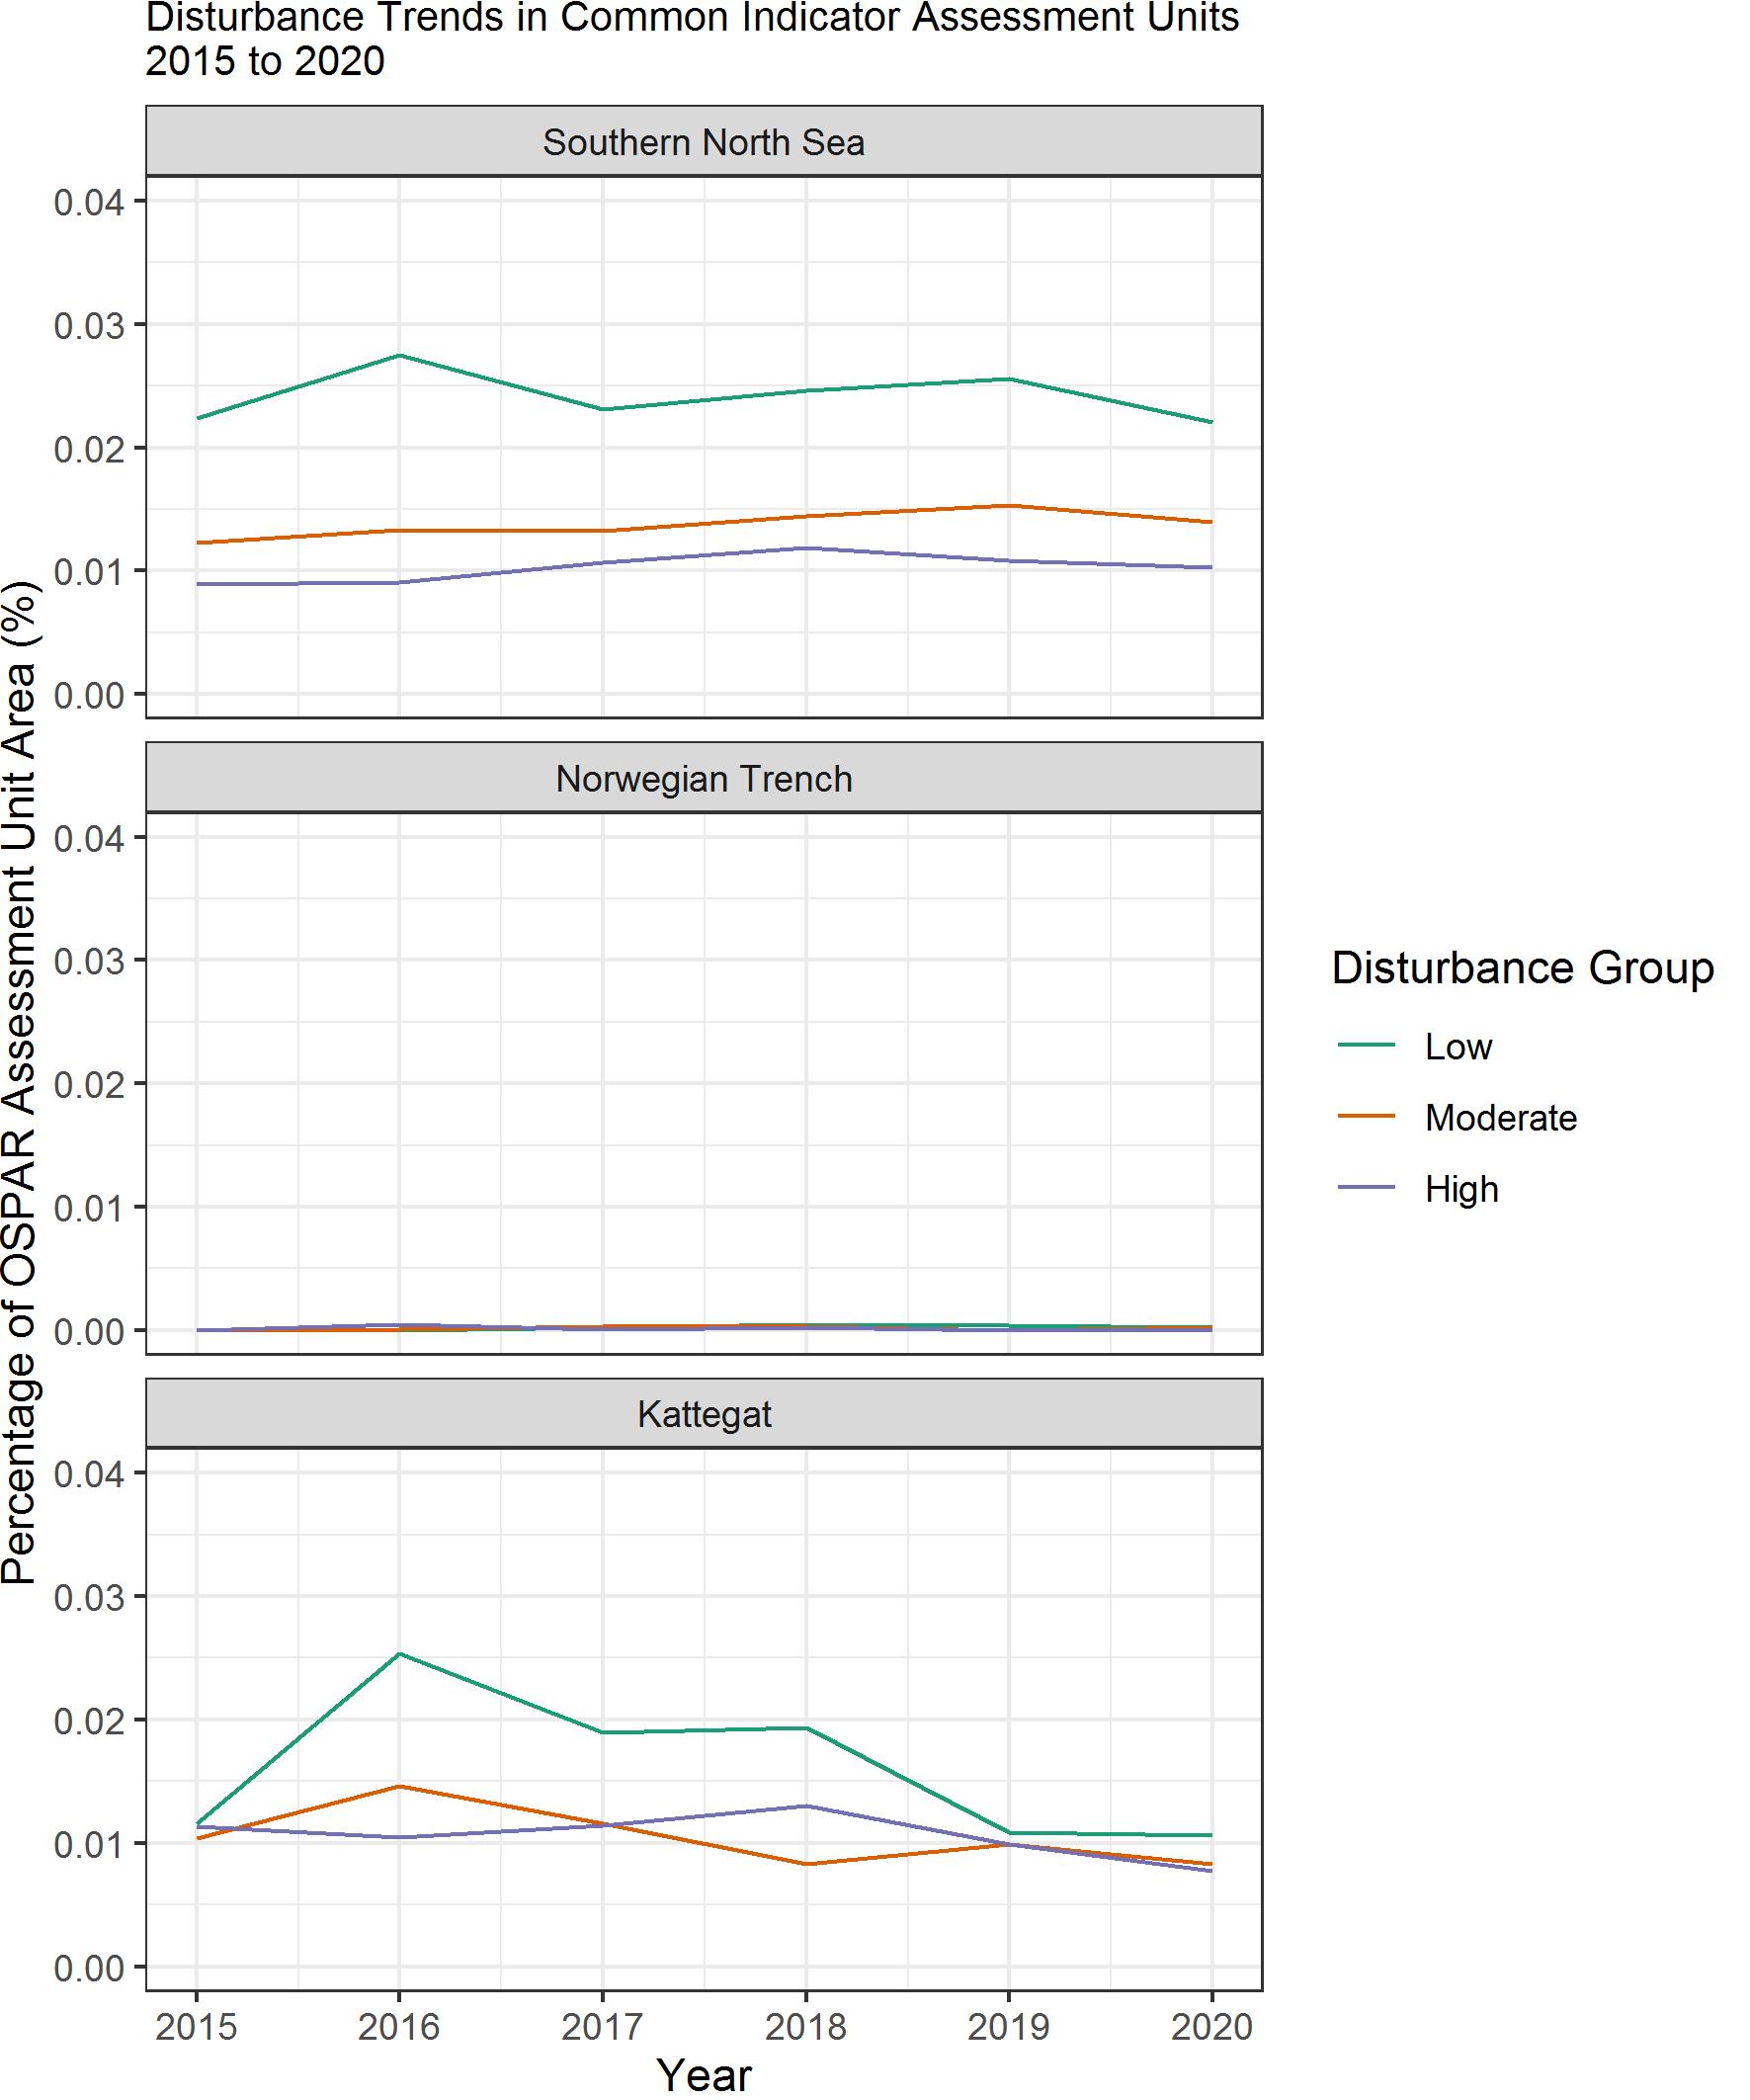
Figure bq: The annual percentage of OSPAR benthic assessment unit areas (where BH3 is agreed as an OSPAR Common Indicator) under the disturbance groups ‘Low’ (disturbance categories 1-4), ‘Moderate’ (disturbance categories 5-7) and ‘High’ (disturbance categories 8 and 9) between the years 2015 to 2020. Note, the Southern North Sea includes data from the United Kingdom and Denmark
2016 to 2020
Overall, the percentage of the total OSPAR Common Indicator area assessed (Southern North Sea, Channel, Norwegian Trench, Kattegat, Northern Celtic Sea, and Southern Celtic Sea) under disturbance from extraction pressure for the 2016 to 2020 assessment period was minimal (Table k). ‘Low’ disturbance was the most prevalent disturbance group (0,012%), followed by ‘High’ disturbance (0,007%), and finally ‘Moderate’ disturbance (0,003%). Additionally, a small proportion (<0,001%) of assessed area where extraction pressure occurred was analysed as ‘Unassessed disturbance’ due to a lack of habitat and / or sensitivity information.
The proportion of each BHT area across the Southern North Sea, Channel, Norwegian Trench, Kattegat, Northern Celtic Sea, and Southern Celtic Sea under extraction disturbance were also minimal (Figure br). Circalittoral mixed sediment had the greatest proportion of habitat area under disturbance (0,375%), and Infralittoral mixed sediment had the greatest proportion of habitat area with ‘High’ disturbance (0,12%).
Table k: Percentage of total area of assessment units where extraction intensity data from the United Kingdom and Denmark was present (Southern North Sea, Channel, Norwegian Trench, Kattegat, Northern Celtic Sea, Southern Celtic Sea) under disturbance groups in the 2016 to 2020 assessment period where: ‘Low’ = disturbance categories 1-4; ‘Moderate’ = disturbance categories 5-7; ‘High’ = disturbance categories 8 and 9; ‘Unassessed Disturbance’ = area where extraction pressure was present but disturbance could not be assessed due to i) no habitat data, or ii) no sensitivity assessments for underlying habitat
| Disturbance Group | Percentage of total Common Indicator Assessment Area |
|---|---|
| Low | 0,012% |
| Moderate | 0,003% |
| High | 0,007% |
| Unassessed Disturbance | <0,001% |
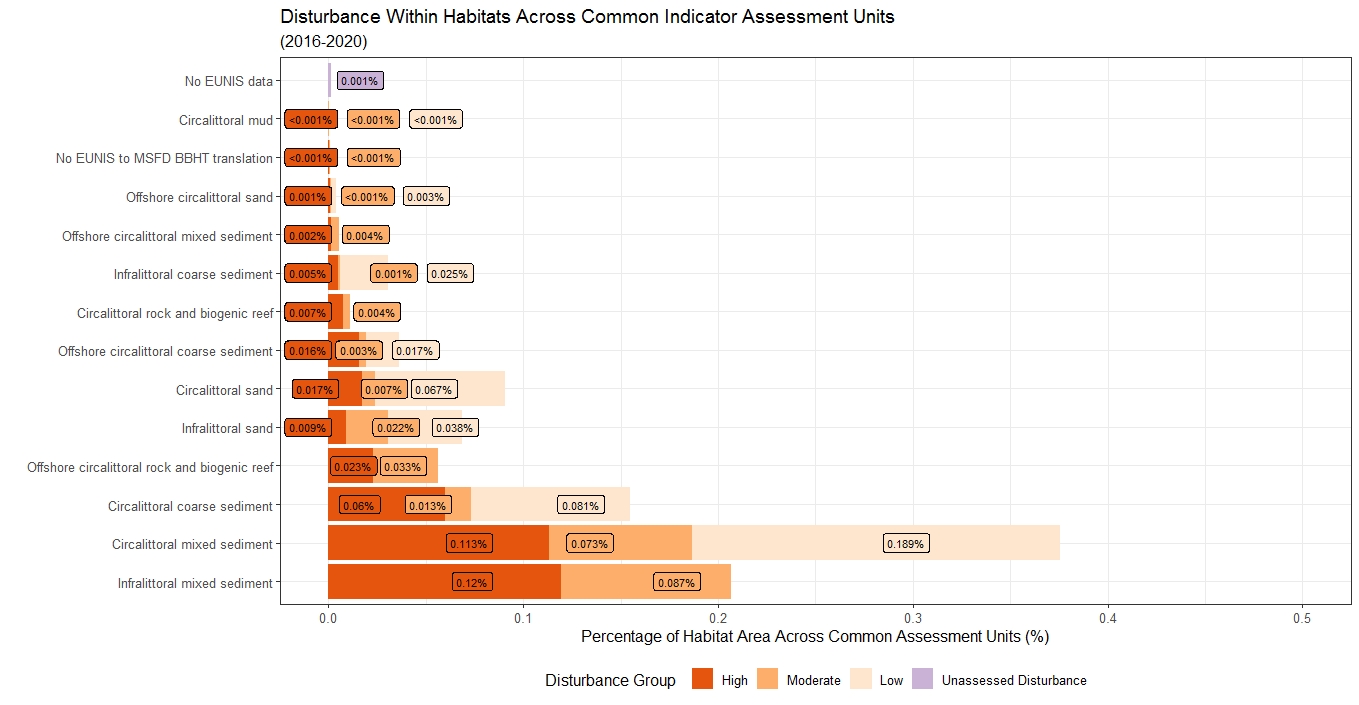
Figure br: The percentage of each distinct Broad Habitat Type’s area across OSPAR benthic assessment units where extraction intensity data was present for the United Kingdom and Denmark (Southern North Sea, Channel, Norwegian Trench, Kattegat, Northern Celtic Sea, Southern Celtic Sea) under each of the following disturbance groups in the 2016 to 2020 assessment period: ‘High’ = disturbance categories 8 and 9; ‘Moderate’ = disturbance categories 5-7; ‘Low’ = disturbance categories 1-4; ‘Unassessed Disturbance’ = area where fishing pressure was present but disturbance could not be assessed due to i) no habitat data, or ii) no sensitivity assessments for underlying habitat
Assessment Unit Summary: Southern North Sea
The 2016 to 2020 assessment of the Southern North Sea used data from two Contracting Parties (United Kingdom and Denmark), whereas other assessment units only had data from one Contracting Party in either period. Data were available in two different formats, EMS from the United Kingdom, and AIS from Denmark, and as such different methods were used to obtain BH3 pressure categories (see method for details), but results were combined to present an assessment of disturbance at the scale of the Southern North Sea. Within the Southern North Sea, disturbance was recorded in 0,107% of the assessment unit (Figure by). Areas of disturbance in the waters of the United Kingdom were broadly similar to those in the 2009 to 2020 assessment, with few areas of activity only present before 2016 (Figure bj and Figure bs). Danish AIS data were only analysed for the 2016 to 2020 assessment period due to the absence of data prior to 2015, therefore, comparisons could not be made with the 2009 to 2020 assessment period. The greatest proportion of disturbance was under the ‘Low’ group, (0,063%), followed by ‘High’ (0,029%) and ‘Moderate’ (0,015%) disturbance (Figure by). ‘High’ disturbance was consistently concentrated in the centre of areas of activity (Figure bs). Within habitats, Offshore circalittoral rock and biogenic reef had the greatest proportion of ‘High’ disturbance (2,236%) (Figure bz). The relatively large proportion of disturbance in Offshore circalittoral rock and biogenic reef BHT can be partially explained by the correspondingly small proportion of rock habitats in the Southern North Sea and the occurrence of ‘Sublittoral polychaete worm reefs on sediment’ EUNIS 2007 habitat type (A5.61) in areas of extraction activity.
The annual disturbance assessment where both Danish and United Kingdom data were available for 2015 to 2020 did not show any large variations across the time series (Figure bq). Disturbance group ‘Low’ still covered the largest proportion of area between 2015 to 2020.
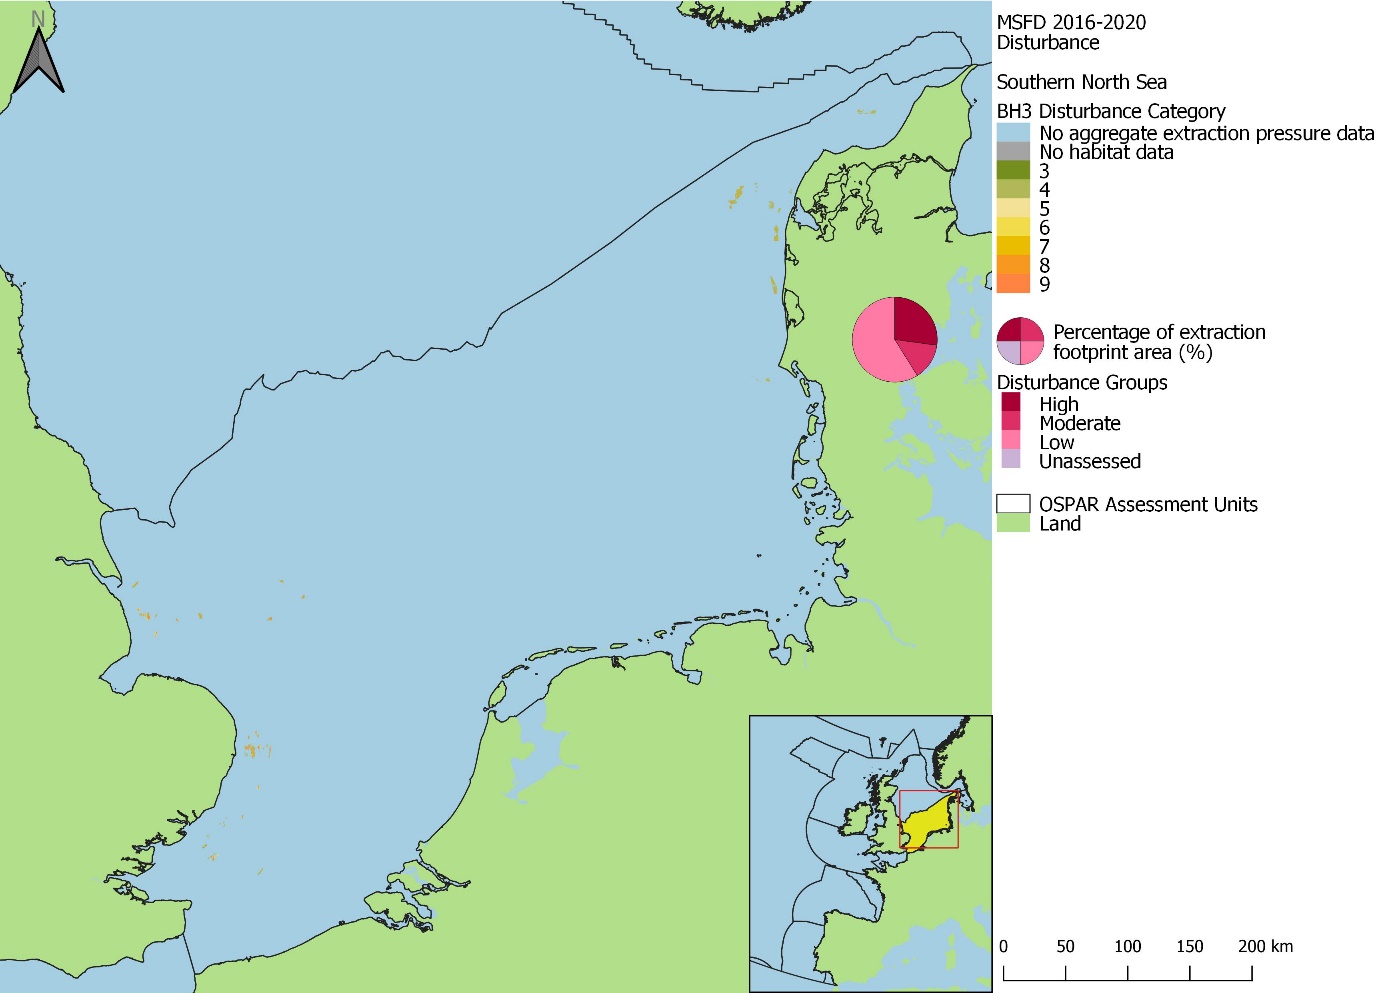
Figure bs: Spatial distribution of extraction disturbance within the Southern North Sea assessment unit in the 2016 to 2020 assessment period. Pie charts show the percentage of the extraction footprint area under each disturbance group: ‘High’ (categories 8-9), ‘Moderate’ (categories 5-7), ‘Low’ (categories 1-4), and Unassessed (area where extraction pressure was present, but disturbance could not be assessed due to i) no habitat data, or ii) no sensitivity assessments for underlying habitat)
Assessment Unit Summary: Channel
In the Channel, disturbance was recorded in 0,083% of the assessment unit; there were noticeably fewer discrete areas of activity in the MSFD assessment than present for the 2009 to 2020 period (Figure bk and Figure bt). The greatest proportion of disturbance was in the ‘High’ group (0,045%), followed by ‘Moderate’ (0,006%), and ‘Low’ (0,032%; Figure by). ‘High’ disturbance was widespread in areas of activity (Figure bt). Within habitats, Circalittoral coarse sediment had the greatest proportion of habitat area within the Channel with ‘High’ disturbance (0,134%; Figure bz).

Figure bt: Spatial distribution of extraction disturbance within the Channel assessment unit in the 2016 to 2020 assessment period. Pie charts show the percentage of the extraction footprint area under each disturbance group: ‘High’ (categories 8-9), ‘Moderate’ (categories 5-7), ‘Low’ (categories 1-4), and Unassessed (area where extraction pressure was present, but disturbance could not be assessed due to i) no habitat data, or ii) no sensitivity assessments for underlying habitat)
Assessment Unit Summary: Norwegian Trench
Disturbance was recorded in 0,001% of the Norwegian Trench assessment unit (Figure by), a lack of data between the years 2009 and 2014 meant that an assessment for the 2009 to 2020 period could not be conducted and therefore, no comparison could be made. All three disturbance groups were less than 0,001% of the assessment unit area, with ‘High’ disturbance being most prevalent (Figure by). As with disturbance in other assessment units, ‘High’ disturbance was present in the centre of both areas of activity, located close to the Skagen Odde peninsular (Figure bu). Within habitats, Infralittoral sand had the greatest percentage of habitat area within the Norwegian Trench with high disturbance alone (1,99%), and total disturbance (3,81%) (Figure bz).
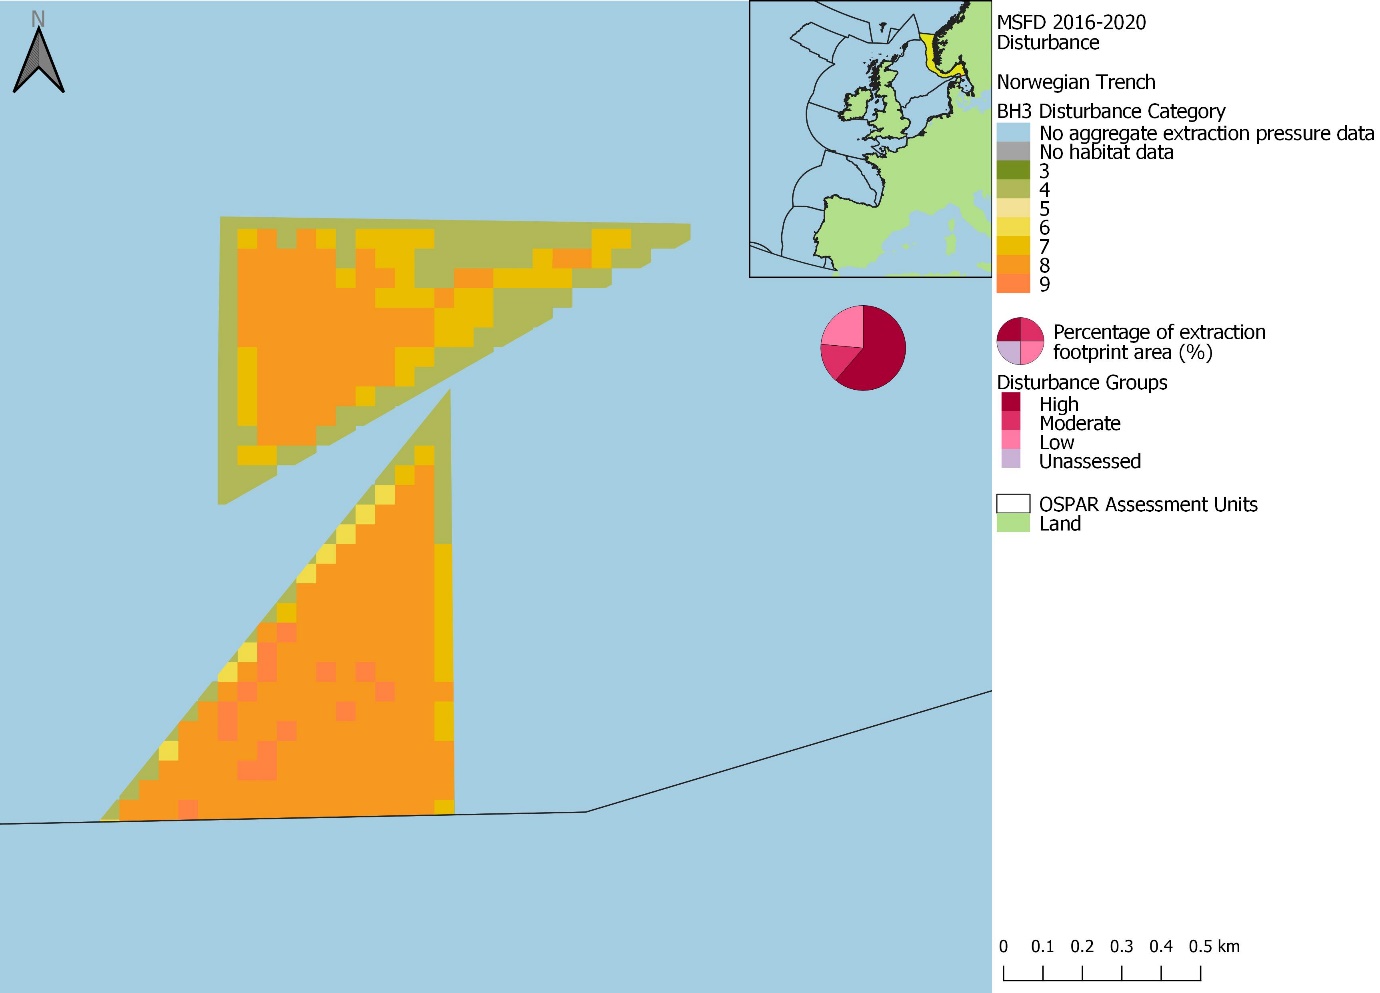
Figure bu: Spatial distribution of extraction disturbance within the Norwegian Trench assessment unit in the 2016 to 2020 assessment period. Pie charts show the percentage of the extraction footprint area under each disturbance group: ‘High’ (categories 8-9), ‘Moderate’ (categories 5-7), ‘Low’ (categories 1-4), and Unassessed (area where extraction pressure was present, but disturbance could not be assessed due to i) no habitat data, or ii) no sensitivity assessments for underlying habitat)
Assessment Unit Summary: Kattegat
In the Kattegat assessment unit, disturbance was recorded in 0,067% of the assessment unit (Figure by), similarly to the Norwegian Trench assessment unit, no comparison could be made to the QSR assessment period due to data paucity. ‘Low’ disturbance was most prevalent (0,04% of the assessment unit), followed by ‘High’ (0,018%) and ‘Moderate (0,018%) (Figure by). Infralittoral mixed sediment had the highest percentage of habitat area with ‘High’ disturbance (0,21%) alone, and total disturbance (0,36%), closely followed by Infralittoral coarse sediment (0,34%) (Figure bz).
Annual disturbance assessments between 2015 and 2020 indicated little annual variation in the percentage of the area of the Kattegat that had disturbance groups ‘Moderate’ and ‘High’ (Figure bq). Disturbance group ‘Low’ predominantly covered the largest annual area, with the greatest extent in 2016 and annual area reducing from 2016 to 2020.
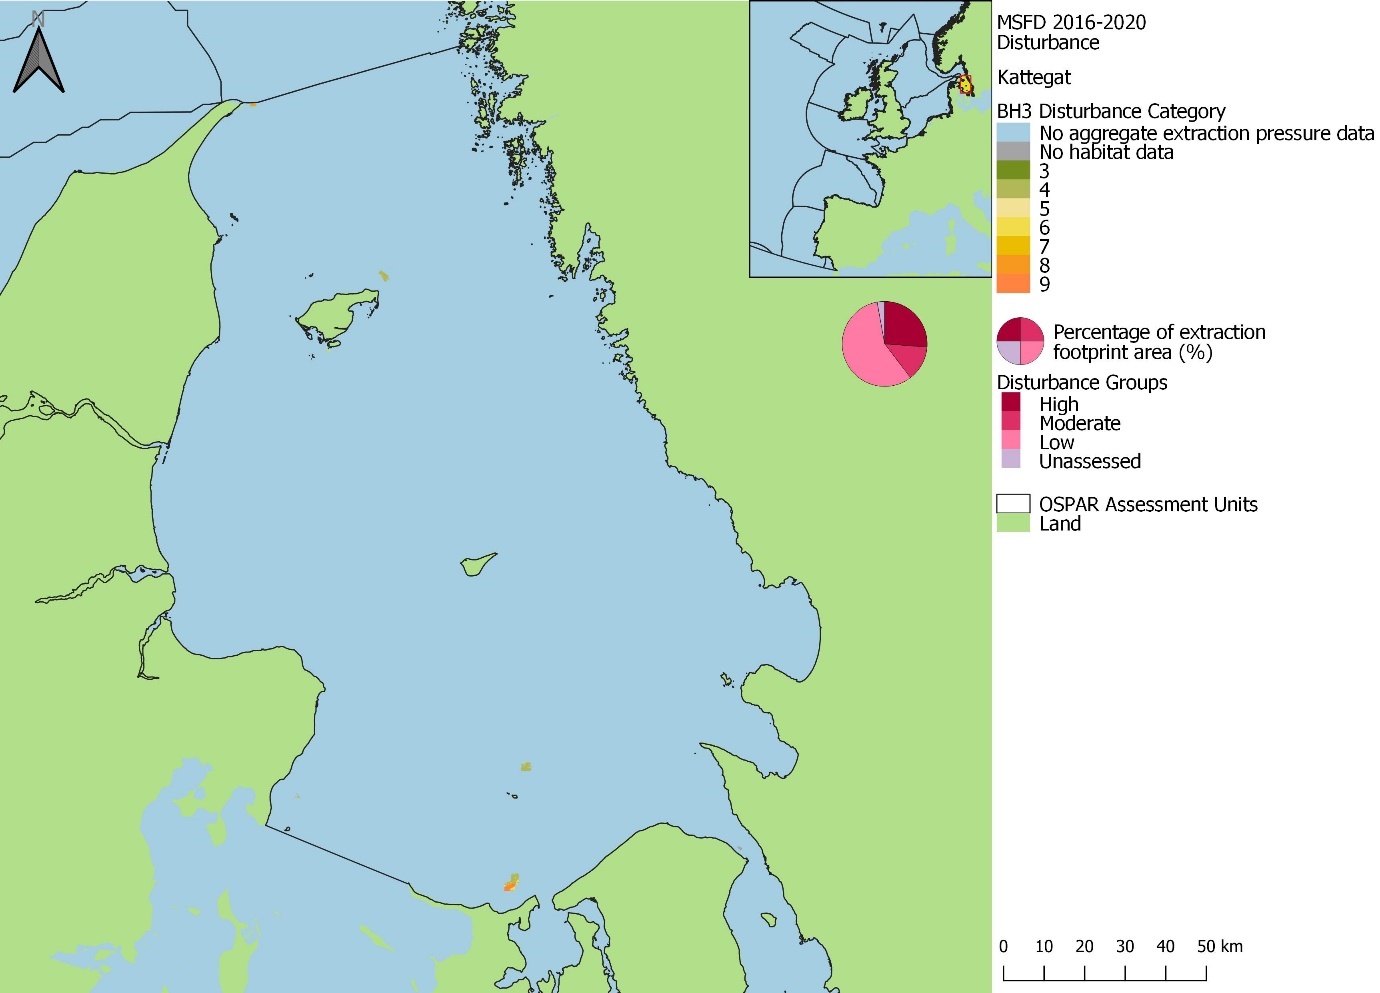
Figure bv: Spatial distribution of extraction disturbance within the Kattegat assessment unit in the 2016 to 2020 assessment period. Pie charts show the percentage of the extraction footprint area under each disturbance group: ‘High’ (categories 8-9), ‘Moderate’ (categories 5-7), ‘Low’ (categories 1-4), and Unassessed (area where extraction pressure was present, but disturbance could not be assessed due to i) no habitat data, or ii) no sensitivity assessments for underlying habitat)
Assessment Unit Summary: Northern Celtic Sea
In the Northern Celtic Sea, disturbance was recorded in less than 0,001% of the assessment unit (Figure by) and was limited to Liverpool Bay with approximately half the areas of activity seen for the 2009 to 2020 assessment (Figure bl and Figure bw). Within habitats, Circalittoral coarse sediment had the greatest proportion of habitat area within the North Celtic Sea with ‘High’ disturbance (0,005%; Figure bz).
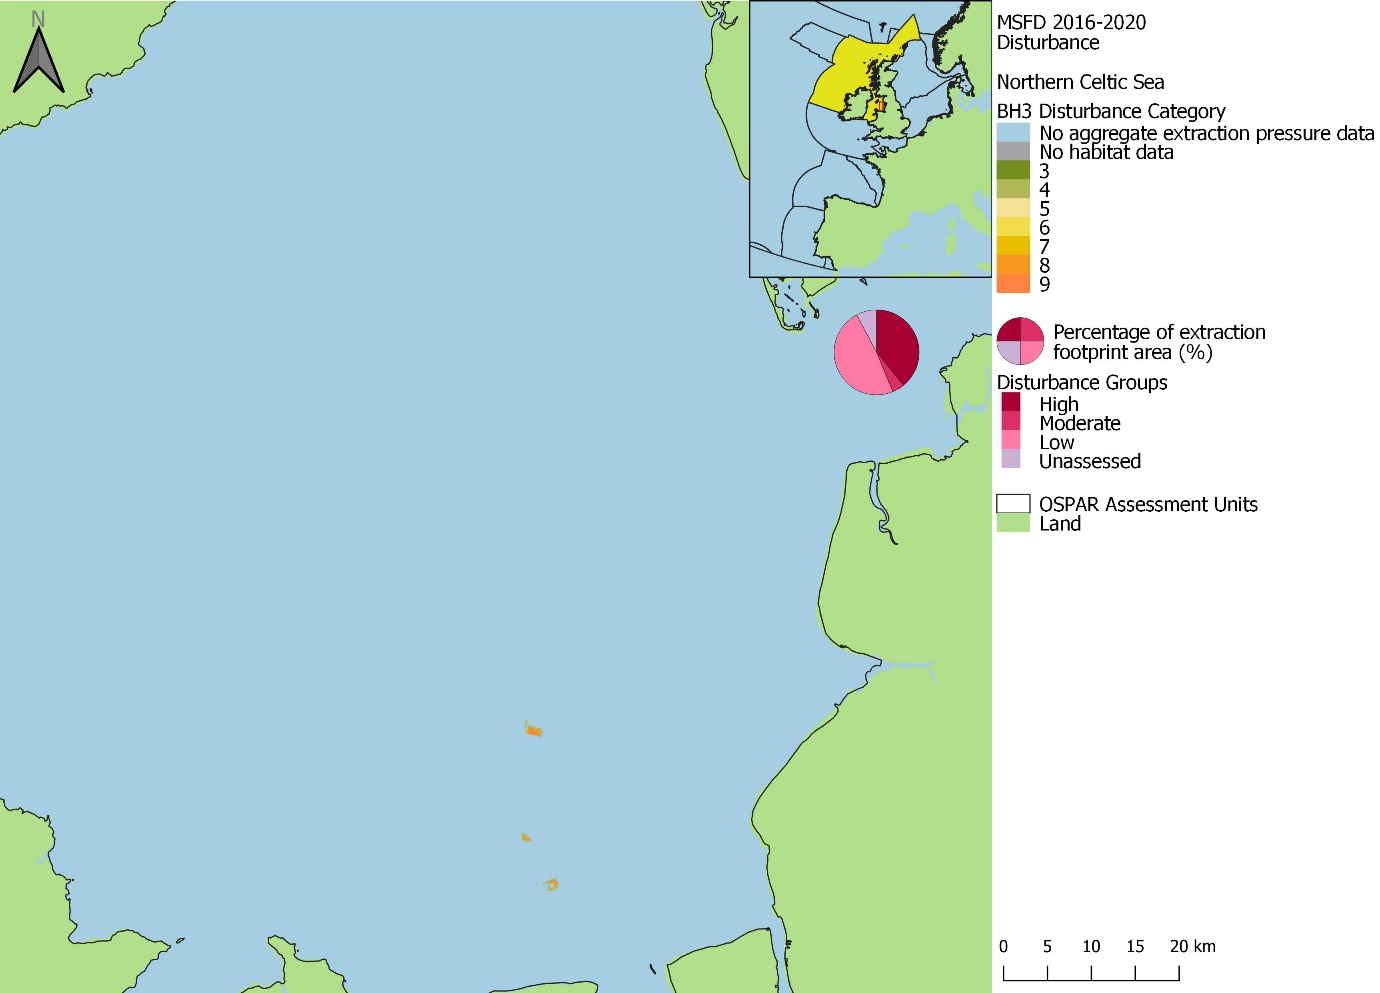
Figure bw: Spatial distribution of extraction disturbance within the Northern Celtic Sea assessment unit in the 2016 to 2020 assessment period. Pie charts show the percentage of the extraction footprint area under each disturbance group: ‘High’ (categories 8-9), ‘Moderate’ (categories 5-7), ‘Low’ (categories 1-4), and Unassessed (area where extraction pressure was present, but disturbance could not be assessed due to i) no habitat data, or ii) no sensitivity assessments for underlying habitat)
Assessment Unit Summary: Southern Celtic Sea
In the Southern Celtic Sea, disturbance was recorded in 0,003% of the assessment unit (Figure by), and there were noticeably fewer discrete areas of activity than present for the 2009 to 2020 period (Figure bm and Figure bx). The greatest proportion of disturbance was under the ‘High’ disturbance group, (0,002%), followed by ‘Low’ (0,001%) and ‘Moderate’ (less than 0,001%) disturbance (Figure by). ‘High’ disturbance was widespread in areas of activity and there was a noticeable area of activity with ‘Unassessed’ disturbance in the east of the Bristol Channel (Figure bx). Within habitats, Circalittoral sand had the highest proportion of ‘High’ disturbance (0,053%), followed by Circalittoral rock and Biogenic reef (0,023%) (Figure bz).

Figure bx: Spatial distribution of extraction disturbance within the Southern Celtic Sea assessment unit in the 2016 to 2020 assessment period. Pie charts show the percentage of the extraction footprint area under each disturbance group: ‘High’ (categories 8-9), ‘Moderate’ (categories 5-7), ‘Low’ (categories 1-4), and Unassessed (area where extraction pressure was present, but disturbance could not be assessed due to i) no habitat data, or ii) no sensitivity assessments for underlying habitat)
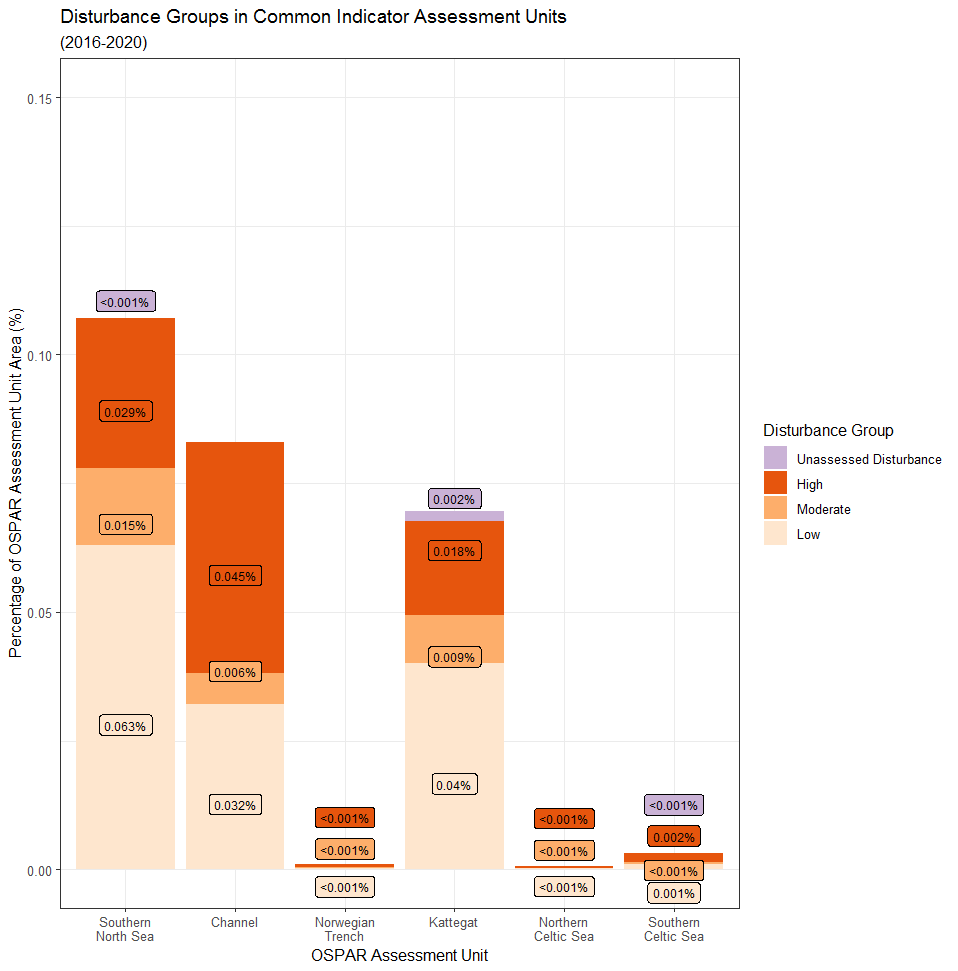
Figure by: The percentage of OSPAR Common Indicator Assessment Units under each of the following disturbance groups in the 2009 to 2020 assessment period: ‘Unassessed Disturbance’ = area where extraction pressure was present but disturbance could not be assessed due to i) no habitat data, or ii) no sensitivity assessments for underlying habitat; ‘Low’ = disturbance categories 1-4; ‘Moderate’ = disturbance categories 5-7; ‘High’ = disturbance categories 8 and 9. Horizontal black lines represent the separation in biological zones
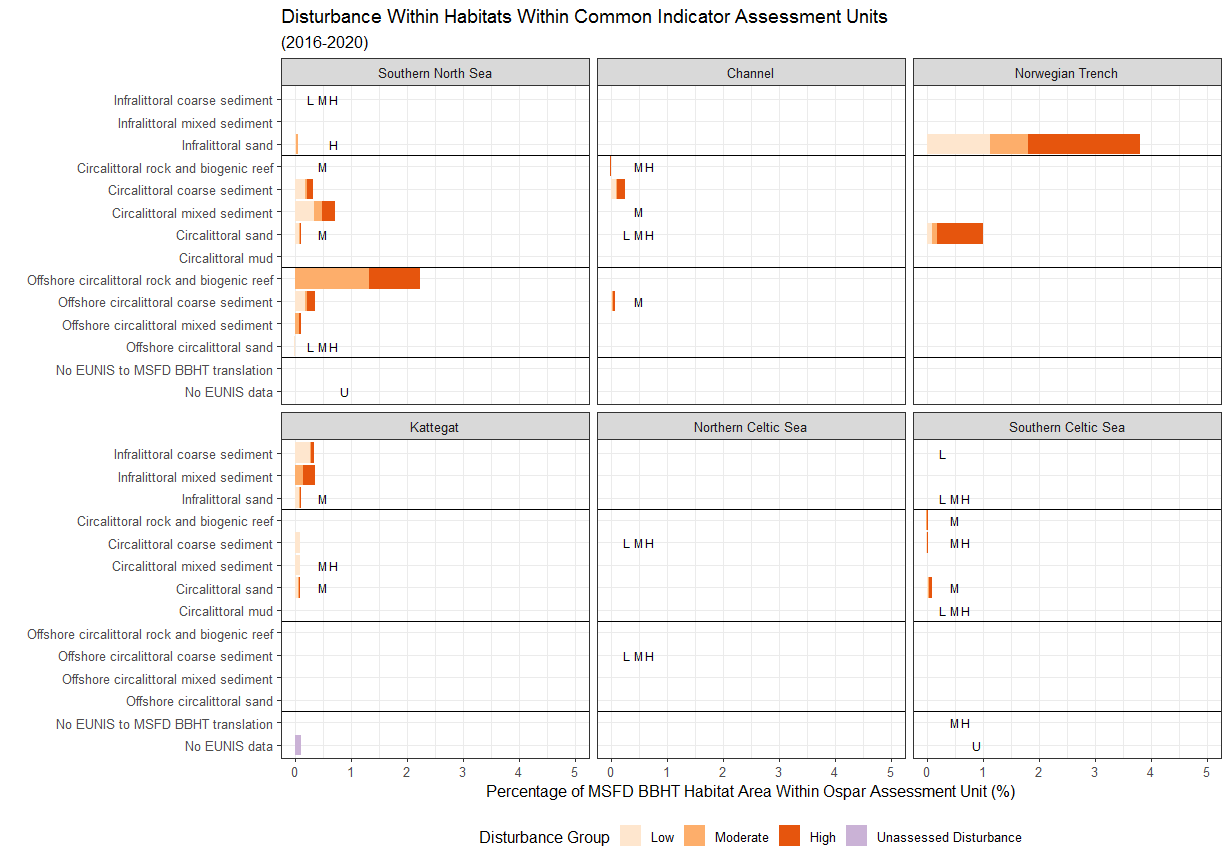
Figure bz: The percentage of Broad Habitat Type in each OSPAR Common Indicator Assessment Units under each of the following disturbance groups in the 2016 to 2020 assessment period: ‘Unassessed Disturbance’ = area where extraction pressure was present but disturbance could not be assessed due to i) no habitat data, or ii) no sensitivity assessments for underlying habitat; ‘Low’ = disturbance categories 1-4; ‘Moderate’ = disturbance categories 5-7; ‘High’ = disturbance categories 8 and 9. Horizontal black lines represent the separation in biological zones. Disturbance groups that where present but covered <= 0,01% of a habitat area are represented by text labels where L = ‘Low’, M = ‘Moderate’, H = ‘High’, and U = ‘Unassessed Disturbance’
Assessments of OSPAR Threatened and / or Declining Habitats: 2009 to 2020
The only OSPAR Threatened and / or Declining Habitat that intersected with extraction pressure was Sabellaria spinulosa reefs in the Southern North Sea assessment unit (Figure bz). Less than 2% of Sabellaria spinulosa reef area in the Southern North Sea was present in areas of extraction pressure (Figure cb). More than 1% of Sabellaria spinulosa reef area in the Southern North Sea was categorised as ‘Moderate’ or ‘High’ disturbance in the assessment period 2009 to 2020. Any reported Sabellaria spinulosa reef habitat coinciding with dredging footprint was likely to suffer detrimental effects from physical damage. However, S. spinulosa requires sand grains which it uses to construct its tubes, and expert advice from industry highlighted that it was possible that reef habitats in the vicinity of extraction could have potentially benefited from the increased suspended sediments caused by the activity. Further research is required to better understand the relationships between indirect pressures, such as sediment resuspension and the distribution of biogenic species.
Due to data limitations, it was not possible to run an assessment of disturbance to Zostera habitats, although it was unlikely that the habitat was present within aggregate extraction areas. Consultation with experts confirmed that it was unlikely for extraction to occur in areas with Zostera; aggregate producers target clean resources and permission for extraction / licensing is unlikely to be given due to the conservation status of the habitat.
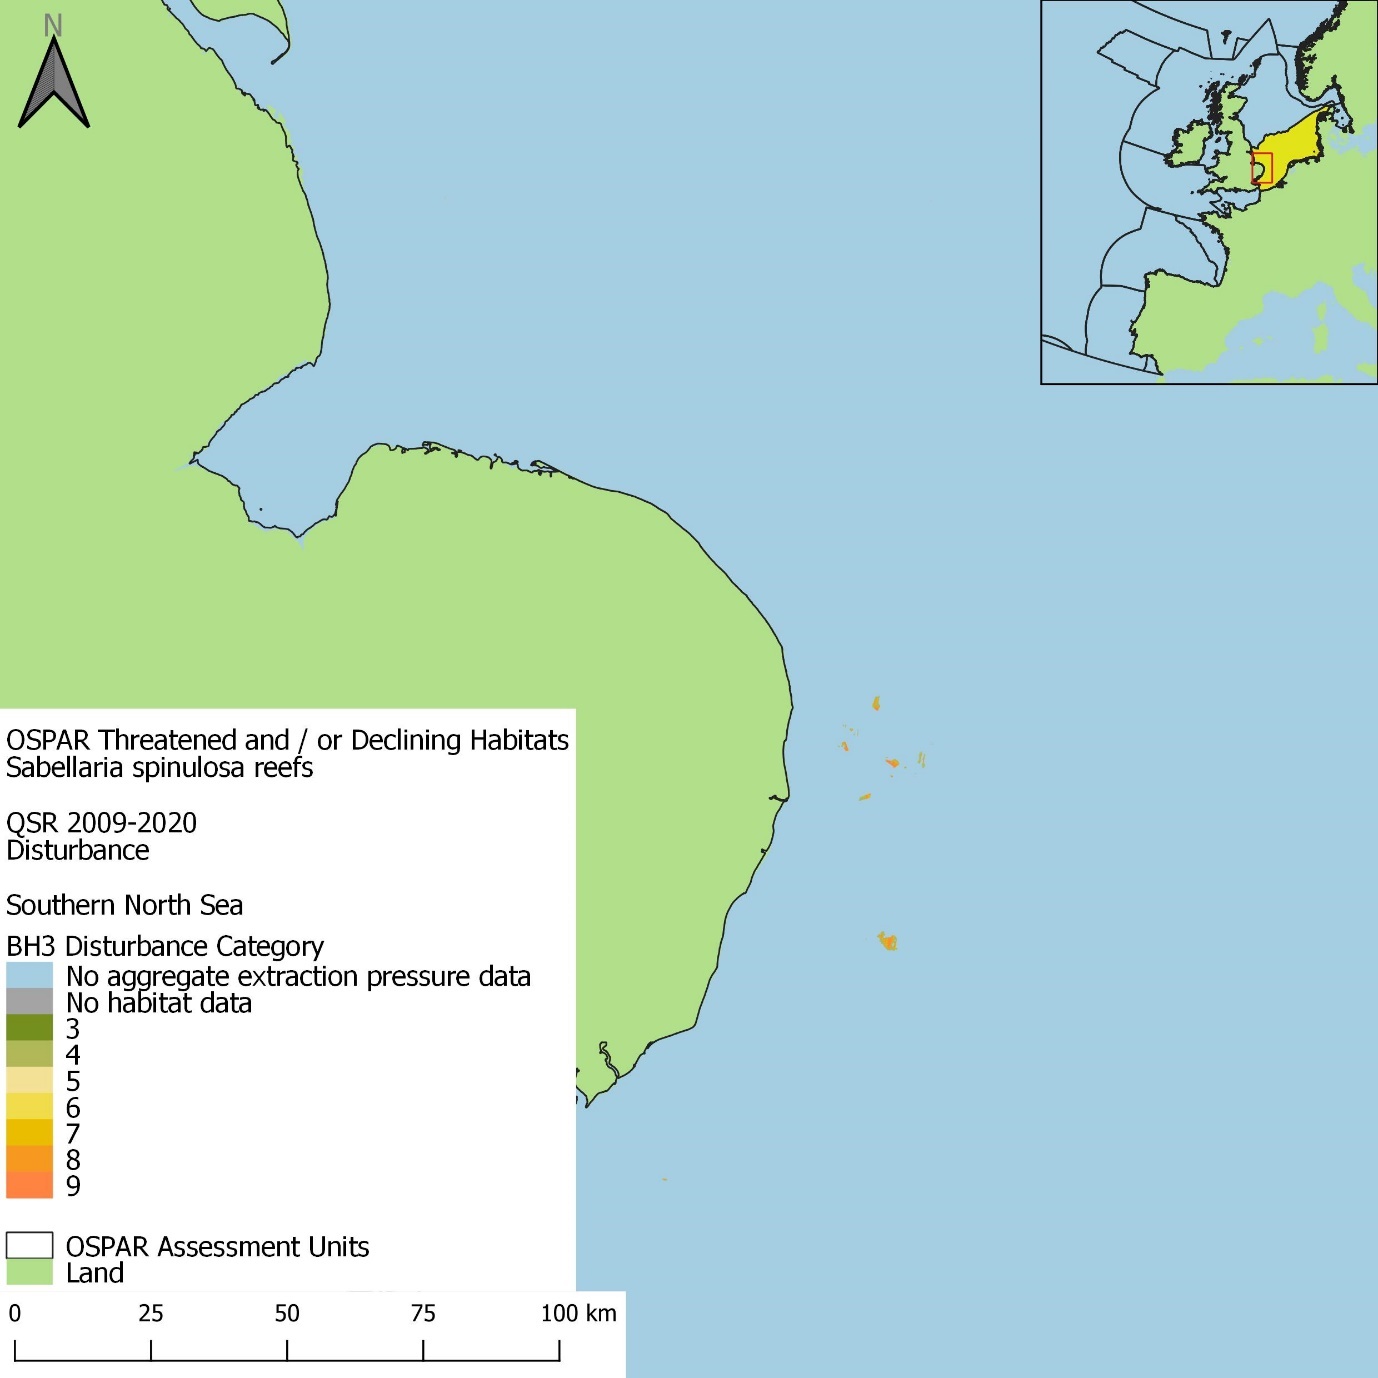
Figure ca: Spatial distribution of aggregated disturbance for OSPAR Threated and / or Declining Habitats (Sabellaria spinulosa reefs) in the 2009 to 2020 assessment period
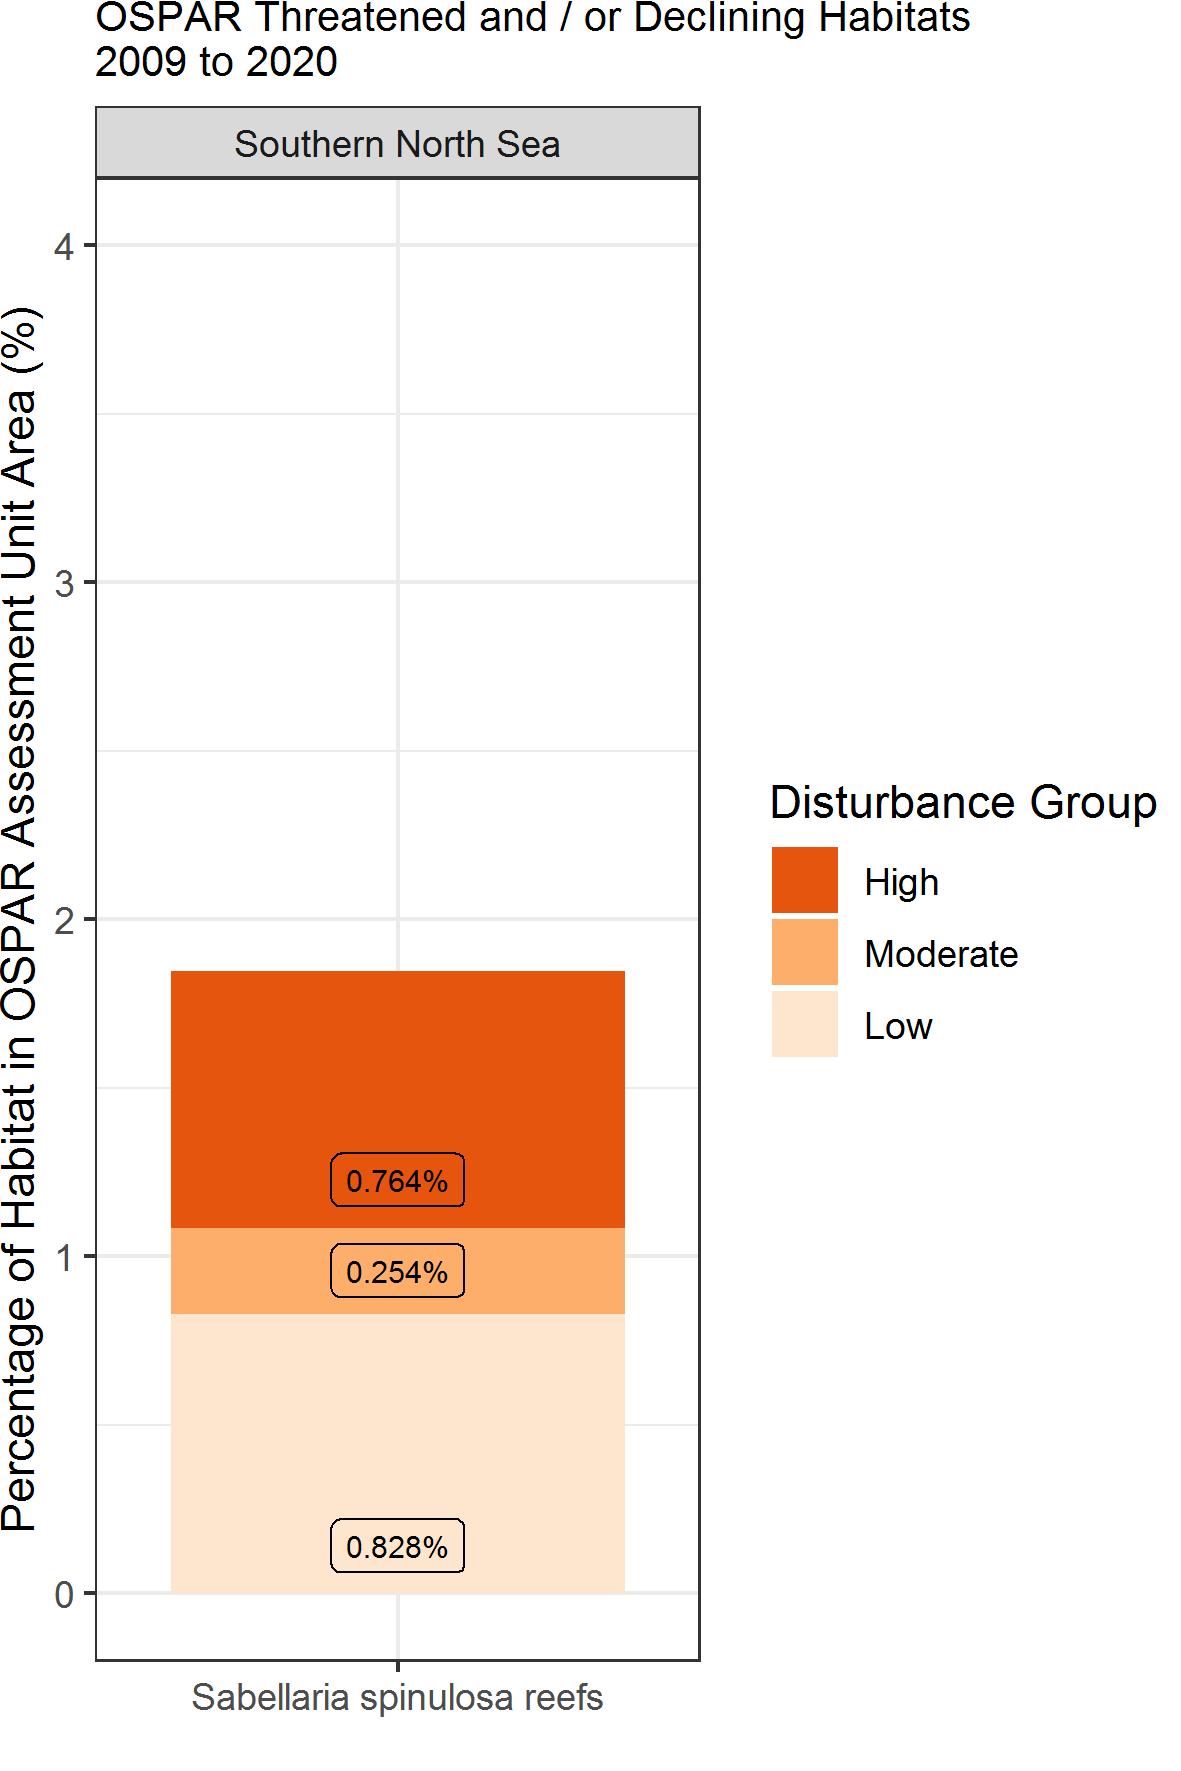
Figure cb: The percentage of OSPAR Threatened and / or Declining Habitats in each OSPAR Common Indicator Assessment Unit under each of the following disturbance groups in the 2009 to 2020 assessment period: ‘Low’ = disturbance categories 1-4; ‘Moderate’ = disturbance categories 5-7; ‘High’ = disturbance categories 8 and 9
Confidence assessment
The confidence of habitat and sensitivity input data were assessed using categorical scores (‘Low’, ‘Medium’, and ‘High’), based on the nature of the information, and combined to give an overall confidence score for aggregate extraction sensitivity (Figure cc)
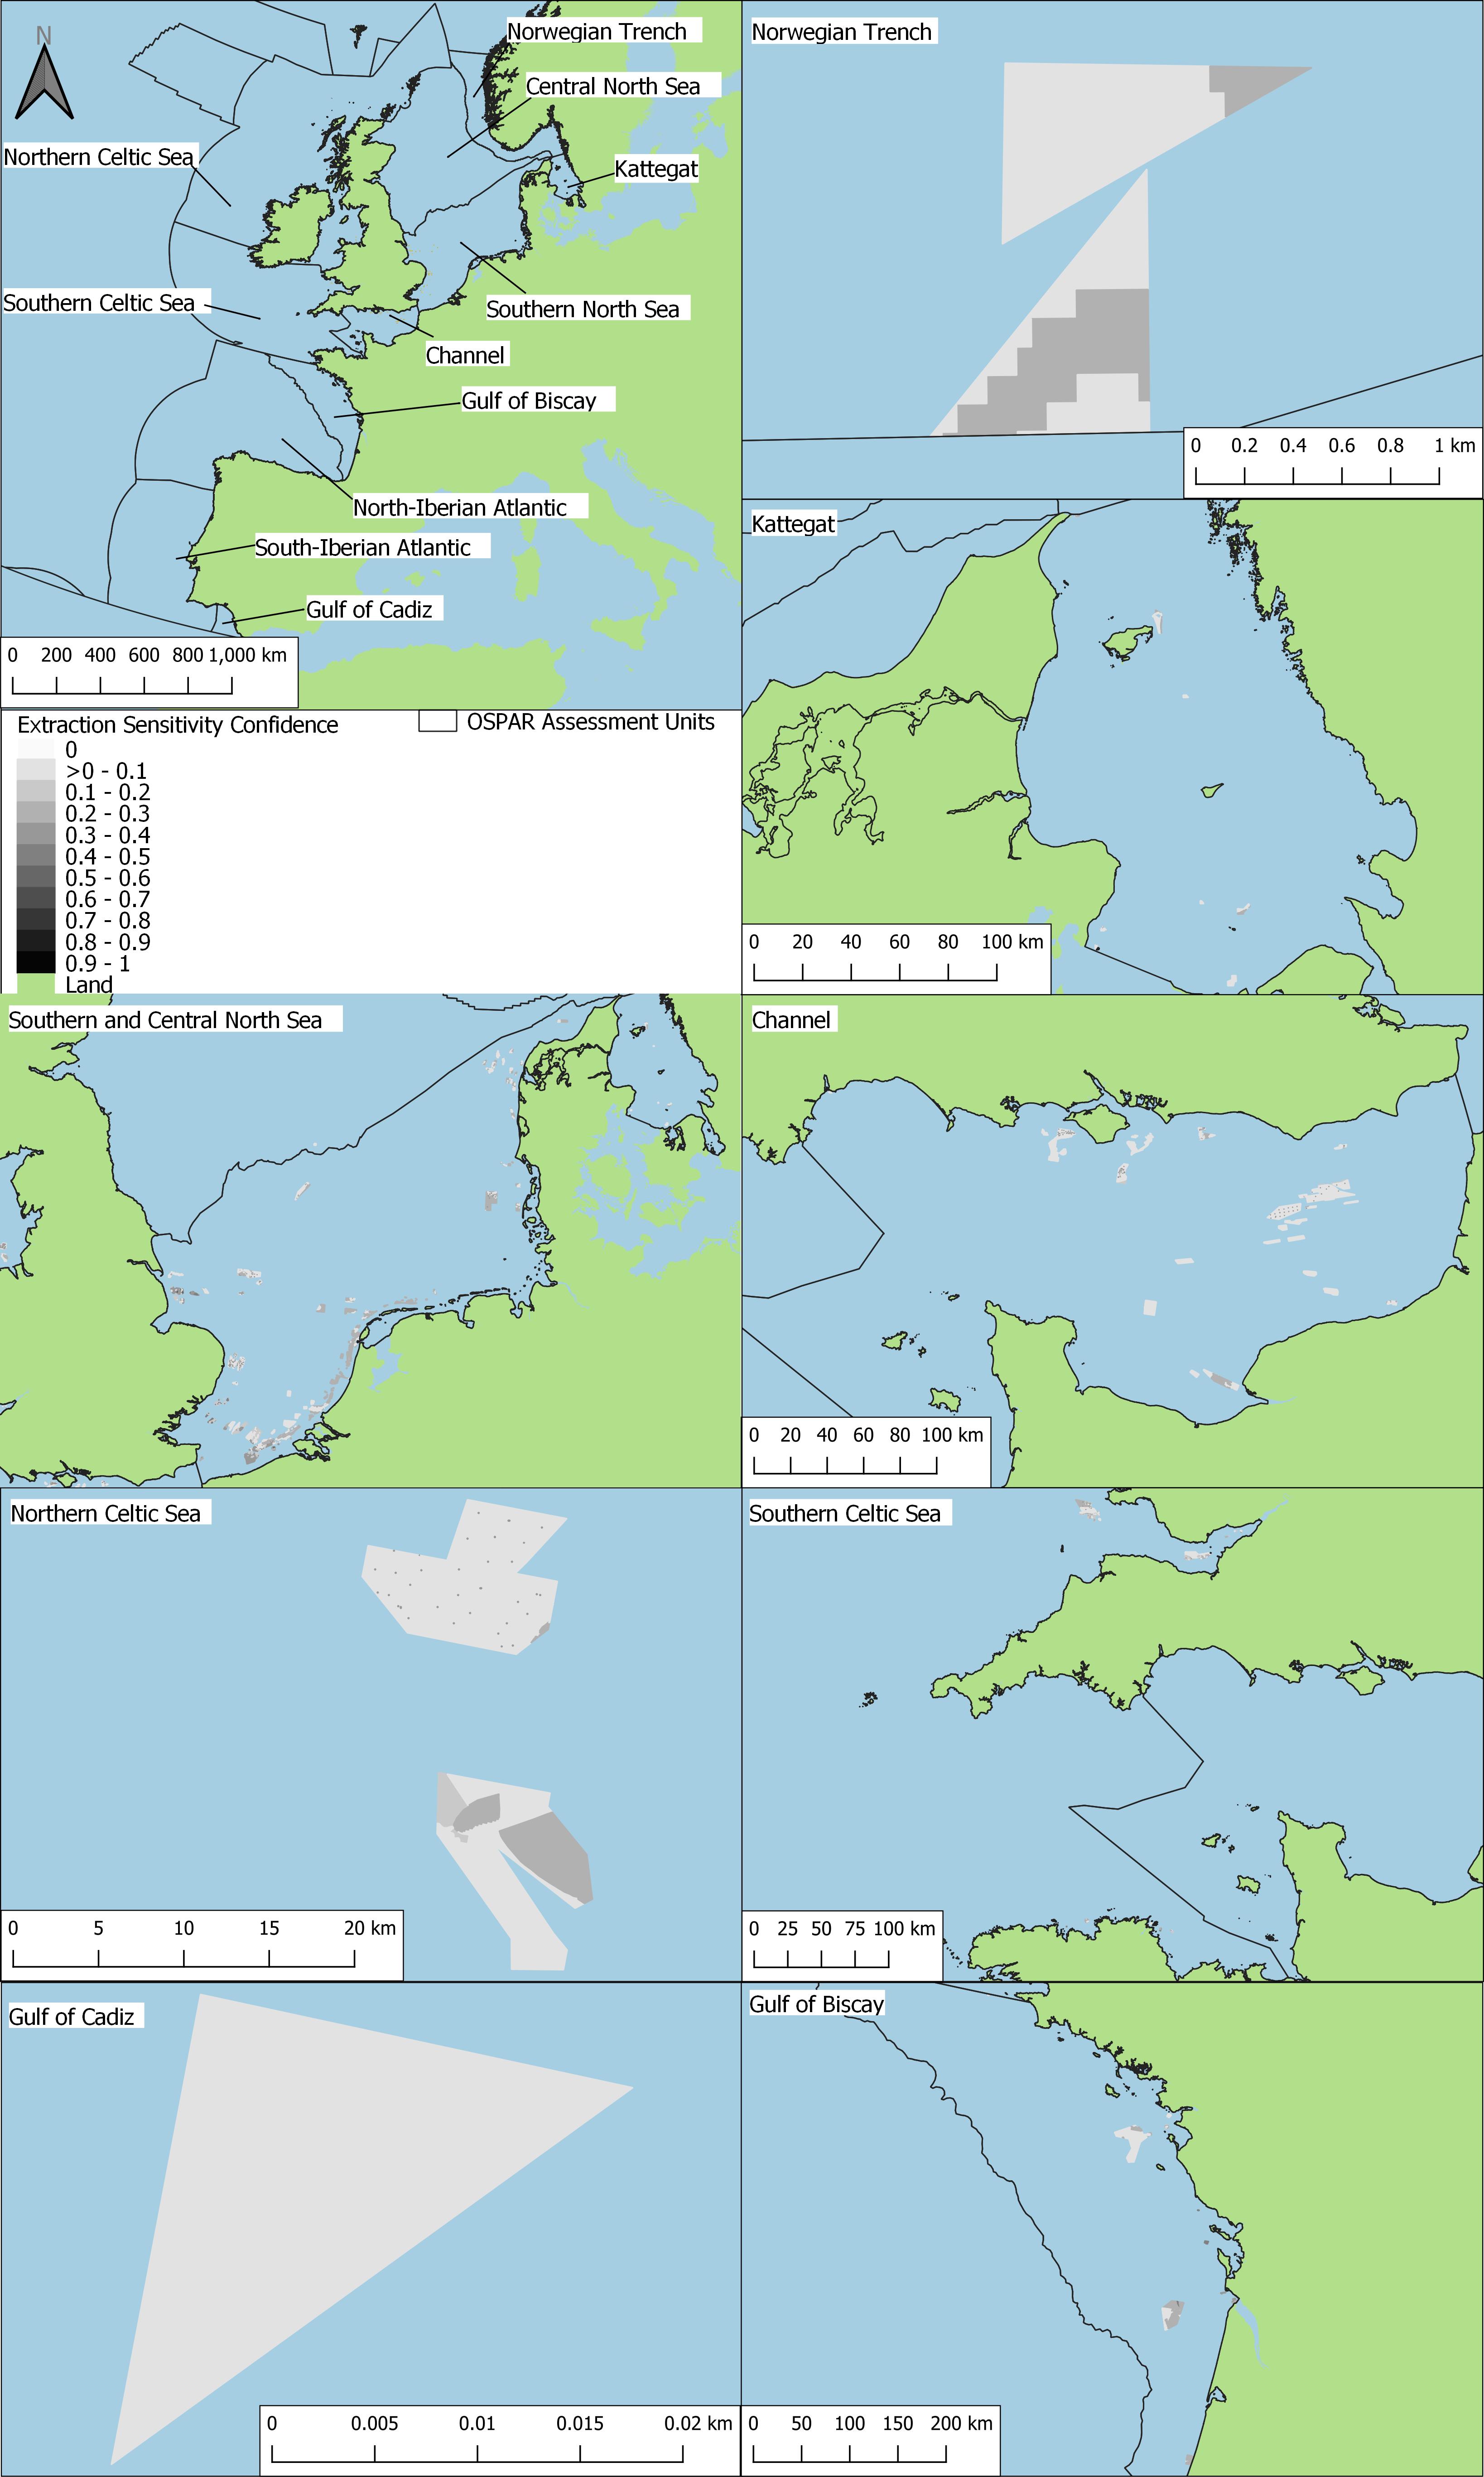
Figure cc: Confidence assessment of extraction sensitivity across indicator assessment units
Conclusion
Disturbance from aggregate extraction was limited in extent, with high-intensity pressure localised to discrete licensed areas, where permitted by regulators. Disturbance could only be calculated where sufficient extraction pressure data were available. Due to limitations of commercially sensitive extraction activity data, disturbance results were constrained to exclusive economic zones of the data providers.
Habitats affected by extraction pressure typically experienced ‘Moderate’ or ‘High’ disturbance. Across all areas assessed, sediments typically targeted by the aggregate industry (mixed sediment, coarse sediment, and sand) had the greatest proportions of area with disturbance. However, total disturbance area for any single BHT across assessment units remained less than 0,5% of the total habitat area. Additionally, within assessment units, the proportion of any habitat area under disturbance was also low and Offshore circalittoral rock and biogenic reef was the only habitat with greater than 1% area under disturbance in both QSR and MSFD assessments.
Changes in the areas of annual disturbance did not show any clear trends in increases or decreases between 2009 and 2020. Variation in the waters of the United Kingdom throughout the time series broadly followed the total active annual dredging area reported by the data provider (BMAPA, 2010 to 2021).
The BH3 QSR 2023 assessment evaluated physical disturbance to benthic habitats in the North-East Atlantic from bottom-contact fishing and commercial aggregate extraction; this component of the assessment was for aggregate extraction only and was the first quantitative evaluation of physical disturbance caused by extraction pressure using the BH3 method. Analyses were conducted over two timeframes (where data were available), facilitating decadal OSPAR QSR and national reporting commitments for OSPAR Contracting Parties, (e.g., MSFD Article 8 assessments for Member States). Assessments were undertaken where BH3 is an agreed OSPAR Common Indicator: Regions II, III and IV; no extraction pressure data, indicative of extraction intensity, were available where BH3 was an OSPAR Candidate Indicator: Regions V and I. The method has been developed, tested, and critically reviewed by national experts from Contracting Parties within the OSPAR framework to ensure scientific integrity.
It should be noted that disturbance was calculated only where extraction footprint and intensity data were available. In the QSR assessment period, extraction pressure data were available from one Contracting Party only, and in the MSFD assessment, only two Contracting Parties. Due to limited data availability, disturbance was under-represented in assessment units where additional extraction was known to take place, but data were not available.
The distribution of disturbance was limited across assessment units, with pressure localised in discrete areas and often restricted to a few years of the assessment periods. Offshore circalittoral rock and biogenic reef had the greatest proportion of habitat area within an assessment unit under disturbance, this occurred in the Southern North Sea and could be attributed to activity occurring in areas of ‘Sublittoral biogenic reefs’ EUNIS 2007 habitat type (A5.6). The relative area of Offshore circalittoral rock and biogenic reef BHT in the Southern North Sea was small (0,16% of assessment unit area), hence the high proportion of the habitat with extraction disturbance.
Biogenic structures are highly susceptible to damage from physical pressures but may respond differently to other pressures associated with extraction (e.g., resuspension of sediments). Expert advice from industry highlighted that increased sediment resuspension in the water column (because of extraction) could result in the colonisation of S. spinulosa recorded in the vicinity of extraction sites. These organisms require suspended sediment for the accretion of their biogenic structures; further research is needed to better understand the relationships between indirect pressures, such as sediment resuspension and the distribution of biogenic species. When disturbance and habitat area was combined across all assessment units with extraction pressure, Offshore circalittoral mixed sediment had the greatest proportion of habitat area with disturbance, more than 0.4% for the QSR assessment and more than 0,2% for the MSFD assessment.
It was not possible to make direct comparisons among and within assessment units, whilst varying data coverage across years and Contracting Parties remained. However, the relative area of disturbance within an assessment unit was likely to have been greatest in the Southern North Sea which had the greatest proportion of area licensed for extraction (greater than 2%). The Southern North Sea was the only assessment unit with pressure data from more than one Contracting Party and therefore, had the greatest extent of assessment unit area with disturbance in the MSFD assessment. When considering the extent of disturbance within assessment units, the greatest proportion of ‘High’ and ‘Moderate’ disturbance occurred in the Channel for both the QSR and MSFD assessments. Where data coverage was greatest, in the MSFD assessment, the Southern North Sea had the greatest proportion of area with ‘Low’ disturbance.
Sensitivity from georeferenced species records were included in the assessment, these were aligned with the method used to assess disturbance from bottom-contact fishing. However, using the same 50 m x 50 m cell resolutions as pressure data to assign in-situ species records resulted in a very limited area with species data. The relatively small area of in-situ data had minimal influence on the assessment of sensitivity to extraction pressure derived from mapped habitat information alone.
Data received for annual extraction activity in response to the OSPAR data call were not in a standardised format, and therefore calculations of Swept Area Ratio for each data source followed the method deemed most suitable for the data provider. Differences in the format of pressure data and the method used to assign pressure categories limit direct comparisons between areas of activity reported by the data providers. Danish AIS data included all tracks from dredging vessels, both when actively dredging and not dredging. These polyline data were filtered using vessel speed which aimed to remove non-dredging activity. However, this likely resulted in an overrepresentation of dredging when vessels are transiting at slow speed.
Pressure variability of extraction activity across assessment periods followed the method agreed for bottom-contact fishing. However, this categorisation of variability was derived from typical fishing activity (i.e., core fishing grounds and opportunistic fishing) at the resolution of c-square grids. The categorisation of variability in extraction pressure might be better represented with an alternative approach for typical extraction activity (localised within licensed areas) and the smaller grid cell size used for assessments of extraction activity.
In comparison to the assessment of physical disturbance from bottom-contact fishing, which derived pressure data from Vessel Monitoring Systems (VMS) and logbook records at c-square resolution, there was greater confidence in the spatial resolution of extraction pressure reported using 50 m x 50 m grid cells. The method used to categorise disturbance values from pressure-impact relationships was derived from fishery-induced mortality rates linked to bottom-contact fishing gear. Further calibration with the impacts specific to extraction activities and the relationships of pressure intensity and habitat functioning would build on the current method. Future work aims to further develop the methods used to assess aggregate extraction pressure; the QSR 2023 details the first step in operationalising the BH3 indicator for extraction activity.
The management approaches of individual Contracting Parties to the licensing and management of marine aggregates will have influence on the levels and extent of disturbance caused by the activity. Management that seeks to reduce the overall footprint of activity might lead to greater ratios of ‘High’ or ‘Moderate’ disturbance over a reduced area of seabed. Conversely, management strategies seeking to reduce intensity of activity could lead to greater extent of total area with disturbance and a higher ratio of ‘Low’ disturbance.
Knowledge Gaps
Data deficiency and an absence of agreed standardisation for data submissions were key gaps throughout the OSPAR Maritime Area, likely caused by restricted access to commercially sensitive data. Additionally, habitat information was not available in all areas where pressure was reported, and an agreed OSPAR-scale habitat classification was not available. The limited availability of reference condition habitat data and pressure-state relationships at the regional scale resulted in the reliance on expert knowledge and extrapolation of available pressure-state data. Integration with other benthic habitat indicators was not possible in the assessment and will require further testing when sufficient data are available.
Habitat data
The BH3 Indicator Assessment used the best available in-situ habitat data incorporated into the OSPAR-scale composite habitat map. However, the use of in-situ data at the scale of Common and Candidate Indicator Assessment Units alone was not feasible due to data paucity and modelled habitat maps were required to supplement in-situ data. Despite the combined use of modelled and in-situ data, habitat information was still not available for some locations, such as to the west of Ireland, limiting the total area that could be assessed for disturbance. There also remained areas where high-resolution habitat data were not publicly available, such as the Kattegat, due to data usage constraints and data confidentiality. In addition, the OSPAR Threatened and / or Declining Habitats GIS layer comprised data submitted by OSPAR Contracting Parties via data calls, which potentially included habitats with historic extents that may have changed during assessment periods, reducing their associated confidence. Furthermore, it was possible that in areas of data paucity, habitat extent may have been underreported in areas such as the deep-sea.
Increased coverage of current, representative in-situ habitat data from surveys would improve confidence in results and increase the overall accuracy of maps via reduced reliance on models and by ground-truthing interpolated data. In addition, the incorporation of industry data into habitat maps, and additional survey work of benthic habitats (e.g., via improved Benthic Monitoring Programmes in areas outside of MPAs), would help increase data coverage. In addition to improved data availability, standardised habitat classifications, with accurate translations to wider classification systems are of paramount importance to facilitate integrated assessments across the OSPAR Maritime Area. The QSR 2023 assessment delivered disturbance assessments in EUNIS 2007 with results presented in MSFD BHT classifications to support Article 8 reporting of the EU Marine Strategy Framework Directive (MSFD). However, to further future assessments, additional work is required to facilitate successful translations between commonly used habitat classifications (e.g., EUNIS 2007 and EUNIS 2019), to ensure OSPAR benthic indicator interoperability (please see further details in the QSR23 BH4 report section ‘Knowledge Gaps’).
Sensitivity data
A key knowledge gap identified in this assessment included the absence of sensitivity information for certain MSFD BHTs and Other Habitat Types (OHTs), the latter including the OSPAR T&D habitats and species, particularly in areas such as the deep-sea. More complete data on seafloor sensitivity to pressure and knowledge of activity-pressure-receptor relationships can be acquired through improved understanding of the resistance and resilience of species and habitats, alongside additional research at relevant spatiotemporal scales (e.g., EUNIS Levels 4, 5 and 6). The QSR 2023 BH3 assessment enabled detailed biotope-resolution sensitivity and disturbance assessments, which improves the accuracy of outputs when compared with the IA 2017. However, in the absence of direct sensitivity assessments, the aggregation of sensitivity from EUNIS levels 4 to 6 to levels 2 to 3, and the translations between EUNIS and MSFD classifications may have resulted in both an over and underestimation of the sensitivity of individual BHT polygons. Therefore, habitat-specific sensitivity scores require further testing and validation to help improve application to future assessments.
In addition, the mapping of sensitivity could be improved through the availability of a consistent OSPAR-scale habitat classification system (including versions, e.g., EUNIS 2007, 2019, 2022) and the availability of methods to translate between habitat classifications accurately. This would enable Contracting Parties to ensure the inter-operability of sensitivity data to facilitate integrated assessments at a North-East Atlantic scale. At the time of assessment, translations between EUNIS 2007 and EUNIS 2019 were not possible due to errors in available translation tables. Work was undertaken through EMODnet and the European Environment Agency to address the identified errors, although, outputs were not available in the required timeframes for the delivery of the QSR 2023. Therefore, this assessment used EUNIS 2007 only, and translated to MSFD BHT via biological zone and substrate data available via EMODnet.
Furthermore, sensitivity information available at the time of the assessment was most relevant to areas with a similar biogeography to the waters surrounding the United Kingdom, and therefore, would be improved with sensitivity assessments from all biogeographic areas of the OSPAR Maritime Area. Integration of other benthic indicators such as the Sentinels of Seabed (SoS) indicator (BH1) (Serrano et al., 2022) and Condition of Benthic Habitat Communities (BH2) (OSPAR, 2018) into the BH3 method will further broaden the evidence base used in assessments in biogeographic regions and will be explored in future work.
In the QSR assessment, the BH3 method was improved by experts collaborating through the OSPAR framework to account for resilient species present in less resilient habitats. However, understanding of ecosystem changes in response to physical disturbance from extraction could be furthered through the greater availability of data from unimpacted areas to serve as reference when assessing sensitivity. Studies of habitat recovery once extraction pressure has been removed (e.g., surrendered licensed areas) would also help improve assessments of resilience and predictions of disturbance magnitude.
Pressure data
The lack of annual extraction activity footprint with standardised intensity data was the largest knowledge gap and barrier to a more comprehensive and quantitative assessment of physical disturbance. An agreed common format of extraction pressure, indicative of physical pressure on the seabed at a standardised spatial resolution would give a more representative assessment of disturbance across the OSPAR Maritime Area. The intensity of pressure data, where sufficient information was available, was estimated as the area dredged, per grid cell, per year. The estimation of intensity of physical pressure could be improved with additional data such as extraction volume, if the activity was static or mobile, and the footprint of the draghead used.
Data from AIS included all vessel tracks, these were filtered to best represent active dredging but potentially still contained transiting. The wider adoption of monitoring devices that only record active dredging would help reduce any overestimation of dredging when vessels are transiting at slow speeds.
The current assessments of physical disturbance from bottom-contact fishing and aggregate extraction assess each pressure independently, future approaches combining these pressures (and any additional environmental or anthropogenic pressures) into a single cumulative pressure index could enable multiple pressure to be expressed as a single disturbance response.
Disturbance results
Knowledge gaps remain in the current understanding of biological responses to adverse effects caused by extraction pressure, and other pressures associated with physical disturbance. Calibration with the results of other benthic indicators such as the Sentinels of Seabed (SoS) indicator (BH1) (Serrano et al., 2022) and validation with indicators such as Condition of Benthic Habitat Communities (BH2b) (OSPAR, 2018) will be explored in future work. Furthermore, where improved datasets become available, data-based assessments of the effects physical pressures have on benthic faunal and floral receptors will be explored in future work to mitigate aforementioned limitations that can affect the certainty and accuracy of indicator outputs.
Geographical application
At present BH3 is still being investigated for its application in Arctic Waters and the Wider Atlantic, mainly due to limited data availability within these regions. It is anticipated that data on habitat distribution and sensitivity will be included at a later stage, to allow the analysis to address the wider spatial scale and assess variations in disturbance across OSPAR Regions more accurately.
BioConsult (2013). Seafloor integrity - Physical damage, having regard to substrate characteristics (Descriptor 6). A conceptual approach for the assessment of indicator 6.1.2: ‘Extent of the seafloor significantly affected by human activities for the different substrate types’. Report within the R & D project ‘Compilation and assessment of selected anthropogenic pressures in the context of the Marine Strategy Framework Directive’, UFOPLAN 3710 25 206.
Birchenough, S.N.R., Boyd, S.E., Vanstaen, K., Coggan, R.A. & Limpenny, D.L. (2010). Mapping an aggregate extraction site off the Eastern English Channel: A methodology in support of monitoring and management. Estuarine, Coastal and Shelf Science. Volume 87, Issue 3, 30 April 2010, Pages 420-430.
Boyd, S.E. & Rees, H.L. (2003). An examination of the spatial scale of impact on the marine benthos arising from marine aggregate extraction in the central English Channel. Estuarine, Coastal and Shelf Science. Volume 57, Issues 1–2, May 2003, Pages 1-16.
Boyd, S.E., Limpenny, D.S., Rees, H.L., Cooper, K.M. & Campbell, S. (2003). Preliminary observations of the effects of dredging intensity on the re-colonisation of dredged sediments off the southeast coast of England (Area 222). Estuarine, Coastal and Shelf Science. Volume 57, Issues 1–2, May 2003, Pages 209-22.
British Marine Aggregate Producers Association (BMAPA) & The Crown Estate (TCE), 2010 to 2021. Area involved reports – 12th to the 23rd annual report. [Online] Available at: https://bmapa.org/downloads/reference.php (Accessed September 2022)
British Marine Aggregate Producers Association (BMAPA) & The Crown Estate (TCE), (2010). Marine Aggregate Terminology - A Glossary. [Online] Available at: https://bmapa.org/documents/BMAPA_Glossary.pdf (Accessed April 2021)
British Marine Aggregate Producers Association (BMAPA) & The Crown Estate (TCE). (2017). The impacts of marine aggregate dredging. Good Practice Guidance: Extraction by Dredging of Aggregates from England’s Seabed. 9-10. [Online] Available at: https://www.bmapa.org/documents/BMAPA_TCE_Good_Practice_Guidance_04.2017.pdf (Accessed April 2021)
Castle L., Lillis H., Duncan G. & Manca E. (2021). Method for creating a EUNIS level 3 seabed habitat map integrating fine- and broad-scale maps for the North-East Atlantic. JNCC report in Prep.
Cook, A.S.C.P. & Burton, N.H.K., (2010). A review of the potential impacts of marine aggregate extraction on seabirds. Marine Environment Protection Fund (MEPF). Project 09/P130.
Cooper K., Boyd S., Eggleton J., Limpenny D., Rees H. & Vanstaen K., (2007). Recovery of the seabed following marine aggregate dredging on the Hastings Shingle Bank off the southeast coast of England. Estuarine Coastal and Shelf Science, 75(4), 547-558.
Cooper K.M., Eggleton J.D., Vize S.J., Vanstaen K., Smith R., Boyd S.E., Ware S., Morris C.D., Curtis, M. l., Limpenny D.S. & Meadows W.J., (2005). Assessment of the re-habilitation of the seabed following marine aggregate dredging-part II. Cefas Science Series Technical Report No. 130. Cefas Lowestoft. 82.
Defra, (2015). Validating an Activity-Pressure Matrix. Report R.2435. [Online] Available at: http://randd.defra.gov.uk/Default.aspx?Menu=Menu&Module=More&Location=None&Compl eted=0&ProjectID=19471 (Accessed April 2022).
Desprez, M. (2000). Physical and biological impact of marine aggregate extraction along the French coast of the Eastern English Channel: short and long-term post-dredging restoration. ICES Journal of Marine Science, 57: 1428–1438.
Desprez, M., Stolk, A., & Cooper, K.M. (2022). Marine aggregate extraction and the Marine Strategy Framework Directive: A review of existing research. ICES Cooperative Research Reports, Vol. 354. 64 pp. https://doi.org/10.17895/ices.pub.19248542.
Drabble, R. (2012) Projected entrainment of fish resulting from aggregate dredging. Marine Pollution Bulletin. Volume 64, Issue 2, February 2012, Pages 373-381.
EMODnet, (2010). MESH Confidence Assessment. [Online] Available at: http://www.emodnet-seabedhabitats.eu/default.aspx?page=1635 (Accessed: 01/12/2021).
EMODnet, (2021a). Seabed Habitats. [Online] Available at: https://emodnet.ec.europa.eu/en/seabed-habitats (Accessed: 01/12/2021).
EMODnet, (2021b). Human Activities. [Online] Available at: https://www.emodnet-humanactivities.eu/ Accessed: 01/12/2021).
European Environment Agency, (EEA), (2017). EEA marine assessment grid, Jan. 2017. European Environment Agency Geospatial Data Catalogue. [Online] Available at: https://sdi.eea.europa.eu/catalogue/srv/eng/catalog.search#/metadata/84d1f816-1913-45b1-94b7-a5721a18296c (Accessed 08/11/2021).
European Environment Agency, (EEA), (2021). EUNIS Habitat Classification. [Online] Available at: https://www.eea.europa.eu/data-and-maps/data/eunis-habitat-classification-1 (Accessed: 08/11/2021).
Grolemund, G. & Wickham, H., (2011). Dates and Times Made Easy with lubridate. Journal of Statistical Software, 40(3), 1-25. Available at: https://www.jstatsoft.org/v40/i03/
Holling C.S. (1973). Resilience and stability of ecological systems. Annual Review of Ecology and Systematics, 4(1), 1-23.
ICES (2015). Report of the Working Group on Spatial Fisheries Data (WGSFD). https://www.researchgate.net/publication/329775756_ICES_Working_Group_on_Spatial_Fisheries_Data_WGSFD_Report_2015
ICES (2016). Effects of extraction of marine sediments on the marine environment 2005– 2011. ICES Cooperative Research Report No. 330. 206 pp ISBN 978-87-7482-179-3 ISSN 1017-6195 Available at: https://doi.org/10.17895/ices.pub.5498
ICES (2019a). Workshop to evaluate and test operational assessment of human activities causing physical disturbance and loss to seabed habitats (MSFD D6 C1, C2 and C4) (WKBEDPRES2). ICES Scientific Reports. 1:69. 87 pp. http://doi.org/10.17895/ices.pub.5611
ICES (2019b). Working Group on the Effects of Extraction of Marine Sediments on the Marine Ecosystem (WGEXT). ICES Scientific Reports. 1:87. 133 pp. http://doi.org/10.17895/ices.pub.5733
JNCC (2011). Review of methods for mapping anthropogenic pressures in UK waters in support of the Marine Biodiversity Monitoring R&D Programme. Briefing paper to UKMMAS evidence groups. Presented 06/10/2011.
Kenny, A.J., Rees, H.L. (1994). The effects of marine gravel extraction on the macrobenthos: Early post-dredging recolonization. Marine Pollution Bulletin. Volume 28, Issue 7, July 1994, Pages 442-447.
Last, E.K., Matear, L., & Robson, L.M. (2020). Developing a method for broadscale & feature-level sensitivity assessments: the MarESA aggregation. JNCC Report No. 662, JNCC, Peterborough, ISSN 0963-8091.
Last, K. S., Hendrick, V. J., Beveridge, C. M., & Davies, A. J. (2011). Measuring the effects of suspended particulate matter and smothering on the behaviour, growth and survival of key species found in areas associated with aggregate dredging. pp. 70
Maher, E. & Alexander, D., 2016. Marine Rocky Habitat Ecological Groups and their Sensitivity to Pressures Associated with Human Activities, JNCC Report 589A.
Maher, E., Cramb, P., de Ros Moliner, A., Alexander, D. & Rengstorf, A., (2016), Assessing the sensitivity of sublittoral rock habitats to pressures associated with marine activities, JNCC Report No. 589B, JNCC, Peterborough, ISSN 0963-8091.
MMO. (2019). Guidance: Dredging. [Online]. Available at: https://www.gov.uk/guidance/dredging (Accessed 11/07/2023).
MST (2021). Ministry of Environment of Denmark, extraction sites. [Online] Available at: https://miljoegis.mim.dk/cbkort?profile=miljoegis-raastofferhavet (Accessed 01/12/2021)
Newell, R. C., Seiderer, L. J., & Hitchcock, D. R. (1998). The impact of dredging works on coastal waters: A review of the sensitivity to disturbance and subsequent recovery of biological resources on the seabed. Oceanography and Marine Biology. 36, 127-78.
Newell, R. C., & Woodcock, T. A. (2013). Aggregate dredging and the marine environment: an overview of recent research and current industry practice. The Crown Estate. 165pp ISBN: 978-1-906410-41-4.
NIBS (2021). Niedersächsischen Bodeninformationssystems Thematic maps, Mining production licences. [Online] Available at: https://nibis.lbeg.de/cardomap3/?lang=en (Accessed 01/12/2021)
Noordzeeloket (2022). Surface Mineral Extraction. [Online] Available at: https://www.noordzeeloket.nl/en/functions-and-use/artikel-baseline/ (Accessed 01/02/2022)
OneBenthic database. (2020). Available from https://openscience.cefas.co.uk/OneBenthicExtraction/ Accessed: 01/09/2022.
OSPAR Commission (2009). Summary assessment of sand and gravel extraction in the OSPAR maritime area. Publication number 434/2009. https://www.ospar.org/documents?v=7149
OSPAR Commission (2011). Pressure list and descriptions. Paper to ICG-COBAM 11/8/1 Add.1-E (amended version 25th March 2011) presented by ICG-Cumulative Effects. OSPAR Commission, London.
OSPAR Commission (2014). OSPAR Joint Assessment and Monitoring Programme (JAMP) 2014-2023. [Online] Available at: https://www.ospar.org/work-areas/cross-cutting-issues/jamp (Accessed 10/11/2021)
OSPAR Commission (2017a). OSPAR Intermediate Assessment 2017. OSPAR Commission. London.
OSPAR Commission (2017b). OSPAR Coordinated Environmental Monitoring Programme (CEMP) Guidelines. Common Indicator: BH3 Extent of Physical damage to predominant and special habitats (https://www.ospar.org/documents?v=37641).
OSPAR Commission (2019). QSR 2023 Guidance Document. OSPAR Agreement 2019-02. https://www.ospar.org/documents?v=40951
OSPAR Commission, (2021). Feeder Report 2021 – Extraction of non-living Resources. Version 1.0.0. [Online]. Available at: https://oap.ospar.org/en/ospar-assessments/quality-status-reports/qsr-2023/other-assessments/extraction-non-living-resources/ (Accessed 28/04/2022)
Pebesma, E. (2018). Simple Features for R: Standardized Support for Spatial Vector Data. The R Journal 10 (1), 439-446.
Python Software Foundation, (2020). Python Language Reference, version 3.7.11. Available at http://www.python.org
R Core Team (2019). R: A language and environment for statistical computing. R Foundation for Statistical Computing, Vienna, Austria. Available at https://www.R-project.org/
R Core Team (2020). R: A language and environment for statistical computing. R Foundation for Statistical Computing, Vienna, Austria. Available at https://www.R-project.org/
R Core Team (2021). R: A language and environment for statistical computing. R Foundation for Statistical Computing, Vienna, Austria. Available at https://www.R-project.org/
Robinson, L.A., Rogers S. & Frid, C.L.J., (2008). A marine assessment and monitoring framework for application by UKMMAS and OSPAR - Assessment of Pressures and Impacts. Phase II: Application for regional assessments. JNCC Contract No: C-08-0007-0027. UKMMAS, 2010. Charting Progress 2.
Robson, L.M., Fincham, J., Peckett, F.J., Frost, N., Jackson, C., Carter, A.J., & Matear, L. (2018). UK Marine Pressures-Activities Database “PAD”: Methods Report. JNCC Report No. 624, JNCC, Peterborough, ISSN 0963-8091.
Rondinini, C. (2010). Meeting the MPA network design principles of representation and adequacy: developing species-area curves for habitats. JNCC Report No. 439. JNCC, Peterborough
Schroeder, A., Gutow,L. & M. Gusky (2008). FishPact. Auswirkungen von Grundschleppnetzfischereien sowie von Sand- und Kiesabbauvorhaben auf die Meeresbodenstruktur und das Benthos in den Schutzgebieten der deutschen AWZ der Nordsee (MAR 36032/15). Report for the Bundesamt für Naturschutz.
Serrano, A., de la Torrientea A., Punzóna, A., Blancoa, M., Bellas, J., Durán-Muñoz, P., Murillo, F.J., Sacau, M., García-Alegrea, A., Antolíneza, A., Elliott, S., Guerine, L., Vina-Herbón, C.V., Marra, S., González-Irustaa, J.M., 2022. Sentinels of Seabed (SoS) indicator: Assessing benthic habitats condition using typical and sensitive species. Ecological Indicators, 140, 108979. Available at: https://oap.ospar.org/en/ospar-assessments/quality-status-reports/qsr-2023/indicator-assessments/sentinels-seabed/
The Crown Estate, (2021). Introduction. Electronic Monitoring System Annual Report 2020. [Online] Available at: https://www.thecrownestate.co.uk/media/3995/2021-ems-report.pdf (Accessed April 2022)
Tillin, H. M., Houghton, J. Saunders, E., Drabble, R., & Hull, S. C. (2011). Direct and Indirect Impacts of Aggregate Dredging. Science Monograph Series No. 1. Marine ASLF. 41pp.
ISBN: 978 0 907545 43 9.
Tillin, H.M., Hull, S.C. & Tyler-Walters, H (2010). Development of a Sensitivity Matrix (pressures-MCZ/MPA features). Defra Contract No. MB0102 Task 3A, Report No. 22. http://jncc.defra.gov.uk/pdf/MB0102_Sensitivity_Assessment%5B1%5D.pdf
Tillin, H. & Tyler-Walters, H. (2014a). Assessing the sensitivity of subtidal sedimentary habitats to pressures associated with marine activities. Phase 1 Report: Rationale and proposed ecological groupings for Level 5 biotopes against which sensitivity assessments would be best undertaken. JNCC Report No. 512A, 68 pp. Available from https://hub.jncc.gov.uk/assets/4204b127-cda2-418c-abd1-ba3589341535
Tillin, H. & Tyler-Walters, H. (2014b). Assessing the sensitivity of subtidal sedimentary habitats to pressures associated with marine activities. Phase 2 Report – Literature review and sensitivity assessments for ecological groups for circalittoral and offshore Level 5 biotopes. JNCC Report No. 512B, 260 pp. Available from: https://hub.jncc.gov.uk/assets/742cd48d-4349-4894-bbbf-d38b1c158a1c
Tillin, H.M. & Tyler-Walters, H. (2015). Finalised list of definitions of pressures and benchmarks for sensitivity assessment. 7-9.
Tyler-Walters, H., Tillin, H.M., d’Avack, E.A.S., Perry, F. & Stamp, T. (2018). Marine Evidence based Sensitivity Assessment (MarESA) – A Guide. Plymouth: Marine Biological Association.
Marine Management Organisation, (2019). Dredging Guidance: Dredging by Type. Dredging – GOV.UK. [Online] Available at: https://www.gov.uk/guidance/dredging#dredging-by-type (Accessed April 2022).
Van Loon, W.M.G.M., Boon, A.R., Gittenberger, A., Walvoort, D.J.J., Lavaleye, M., Duineveld, G.C.A., & Verschoor, A.J. (2015). Application of the Benthic Ecosystem Quality Index 2 to benthos in Dutch transitional and coastal waters, Journal of Sea Research, Volume 103, 1-13.
Van Loon, W.M.G.M., Walvoort, D.J., Van Hoey, G., Vina-Herbon, C., Blandon, A., Pesch, R., Schmitt, P., Scholle, J., Heyer, K., Lavaleye, M. & Phillips, G., (2018). A regional benthic fauna assessment method for the Southern North Sea using Margalef diversity and reference value modelling. Ecological Indicators, 89, 667-679.
Vlasblom, W.J. (2005). Designing Dredging Equipment: Chapter 2 Trailing suction hopper dredger. Pp 13.
Wickham, H., Averick, M., Bryan, J., Chang, W., McGowan, L.D.A., François, R., Grolemund, G., Hayes, A., Henry, L., Hester, J., Kuhn, M., Pedersen, T., Miller, E., Bache, S., Müller, K., Ooms, J., Robinson, D., Seidel, D., Spinu, V., Takahashi, K., Vaughan, D., Wilke, C., Woo, K. and Yutani, H., (2019). Welcome to the tidyverse. Journal of Open-Source Software, 4(43), 1686.
Contributors
Lead Authors: Liam Matear and Cristina Vina-Herbon
Supporting Authors: Kirsty Woodcock, Stephen Duncombe-Smith, Adam Smith, Petra Schmitt, Axel Kreutle, Emma Curtis and Kate Wade
Supported by: OSPAR Benthic Habitat Expert Group (OBHEG), Intersessional Correspondence Group on the Coordination of Biodiversity Assessment and Monitoring (ICG-COBAM), OSPAR Biodiversity Committee (BDC)
Delivered by
This work was co-funded by the European Maritime and Fisheries Fund through the project: “North-east Atlantic project on biodiversity and eutrophication assessment integration and creation of effective measures (NEA PANACEA)”, financed by the European Union’s DG ENV/MSFD 2020, under agreement No. 110661/2020/839628/SUB/ENV.C.2.
 |  |
Citation
Matear, L., Vina-Herbon, C., Woodcock, K.A., Duncombe-Smith, S.W., Smith, A.P., Schmitt, P., Kreutle, A., Curtis, E.J., and Wade, K. 2023. Extent of Physical Disturbance to Benthic Habitats: Aggregate Extraction. In: OSPAR, 2023: The 2023 Quality Status Report for the Northeast Atlantic. OSPAR Commission, London. Available at: https://oap.ospar.org/en/ospar-assessments/quality-status-reports/qsr-2023/indicator-assessments/phys-dist-habs-agg-ex/
| Assessment type | Indicator Assessment |
|---|---|
| Summary Results | https://odims.ospar.org/en/submissions/ospar_ospar_phy_disturb_agg_msfd_2023_06/ |
| SDG Indicator | 14.2 By 2020, sustainably manage and protect marine and coastal ecosystems to avoid significant adverse impacts, including by strengthening their resilience, and take action for their restoration in order to achieve healthy and productive oceans |
| Thematic Activity | Biological Diversity and Ecosystems |
| Relevant OSPAR Documentation | OSPAR Publication 2009-434 Summary assessment of sand and gravel extraction in the OSPAR maritime area |
| Linkage | https://oap.ospar.org/en/ospar-assessments/quality-status-reports/qsr-2023/other-assessments/extraction-non-living-resources/ |
| Date of publication | 2023-06-30 |
| Conditions applying to access and use | https://oap.ospar.org/en/data-policy/ |
| Data Results | . |
| Data Snapshot | . |