

Abondance et répartition des cétacés
D1 - Diversité Biologique
D1.1 - Répartition des espèces D1.2 - Taille des populations D4.3 - Abondance/répartition des groupes trophiques/espèces clés
Message clé:
Les cétacés sont très répandus et abondants dans la zone maritime OSPAR. Leur surveillance est difficile. On ne relève aucun signe de modification de l’abondance du dauphin à nez blanc, du petit rorqual et du marsouin depuis 1994; on ne dispose pas de preuves suffisantes pour d’autres espèces. La répartition du marsouin et du petit rorqual s’est déplacée vers le Sud dans la mer du Nord au sens large.
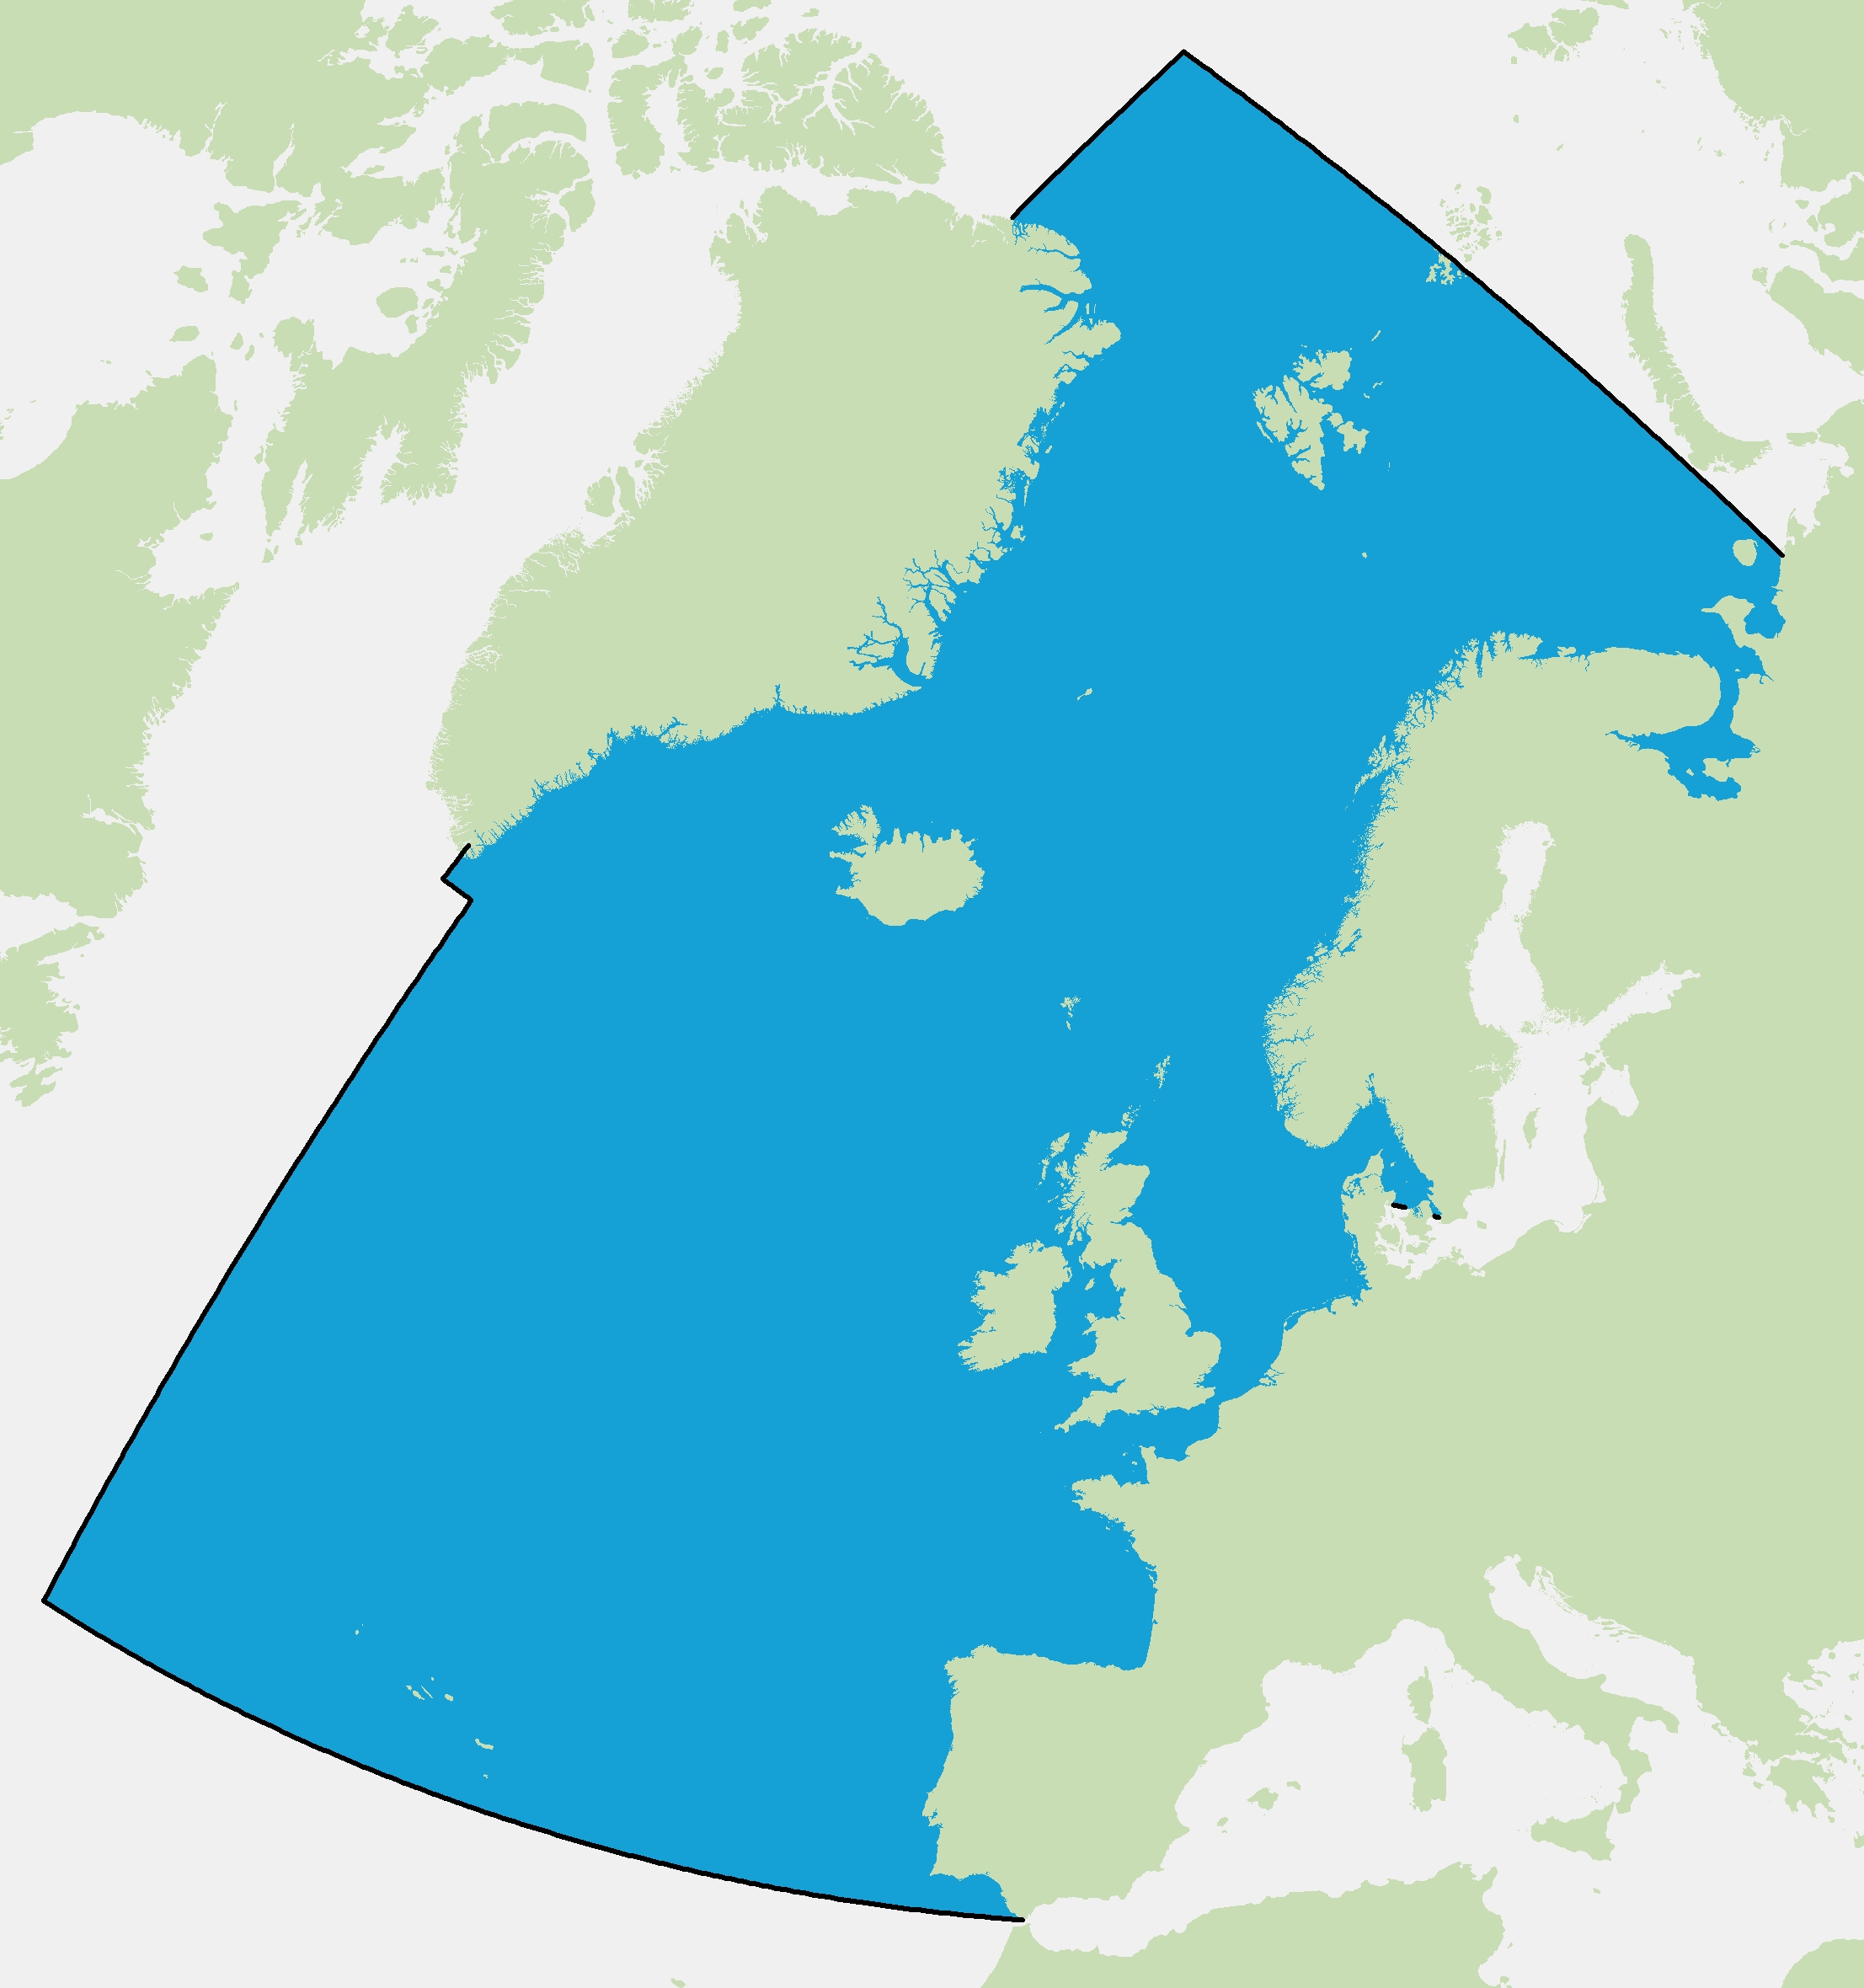
Assessed Area

Printable Summary
Contexte
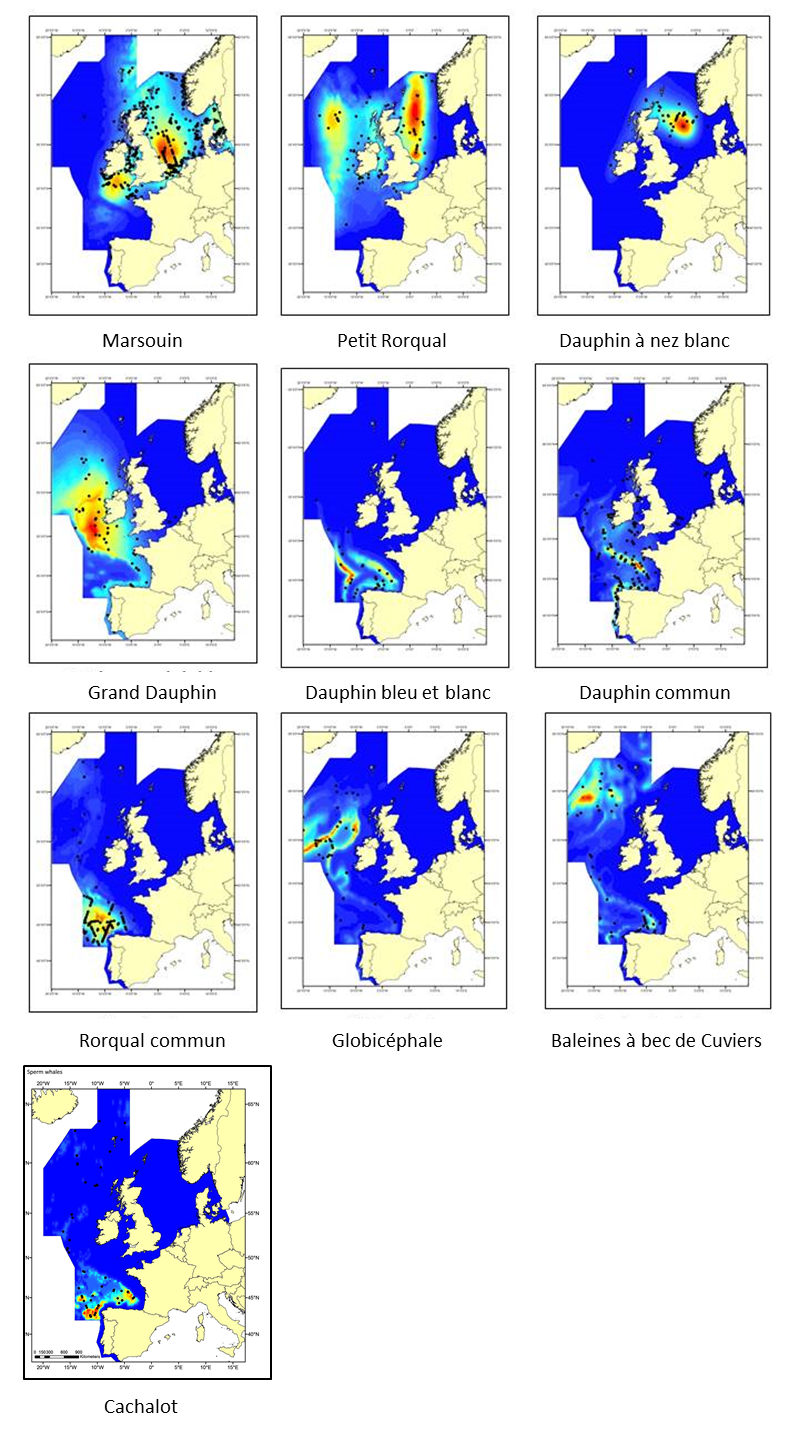
Figure 1: Cartographie de la densité, sur la base d’une modélisation, de diverses espèces de cétacés à partir d’analyses de données des SCANS-II, CODA et T-NASS regroupées concernant les étés 2005 et 2007 dans l’Atlantique européen
Les cétacés sont largement répandus dans la zone et le nombre relativement faible de chevauchements dans les zones très utilisées prévues met en évidence que les espèces utilisent l’environnement de diverses manières. SCANS-II: Abondance de petits cétacés dans l’Atlantique européen et la mer du Nord). CODA: Offshore Répartition et abondance des cétacés au large de l’Atlantique européen (CODA, 2009). T-NASS: « Trans North Atlantic Sightings Survey »
Les cétacés sont une composante importante de la biodiversité marine dans l’Atlantique du Nord-Est. L’abondance et la répartition des cétacés, en leur qualité de superprédateurs, sont des indicateurs fondamentaux de l’état de l’environnement, tel que l’intégrité du réseau trophique. On a enregistré récemment 36 espèces de cétacés dans la mer du Nord au sens large, les mers Celtiques et le golfe de Gascogne et la côte ibérique. Il s’agit pour la plupart d’espèces océaniques très dispersées que l’on voit rarement et dont la surveillance est très difficile. Cet indicateur est donc limité à l’évaluation des espèces sur lesquelles on dispose de données plus solides. Les informations proviennent essentiellement de quelques études exclusives à grande échelle.
Certaines activités humaines affectent l’abondance et la répartition des cétacés. Dans le passé, l’élimination directe d’individus, due à la chasse, a eu des effets sérieux sur les populations. De nos jours, les captures accessoires de la pêche sont l’une des causes principales de la mortalité de petits cétacés. On sait que d’autres pressions, telles que la pollution chimique ou sonore, affectent les animaux individuels mais l’on ne comprend par encore leurs effets sur ces populations.
Cette évaluation étudie les informations sur l’abondance et la répartition et, si possible, évalue l’état des espèces suivantes: marsouin, grand dauphin du large, dauphin à nez blanc, dauphin commun à bec court, dauphin bleu et blanc, petit rorqual, rorqual commun, globicéphale noir, cachalot et baleines à bec de Cuviers (ces dernières à titre de groupe d’espèces conjuguées). Toutes ces espèces sont également évaluées dans le cadre de la Directive habitats de l’Union européenne. Le grand dauphin côtier et l’orque sont considérés séparément dans l’évaluation intermédiaire de 2017.
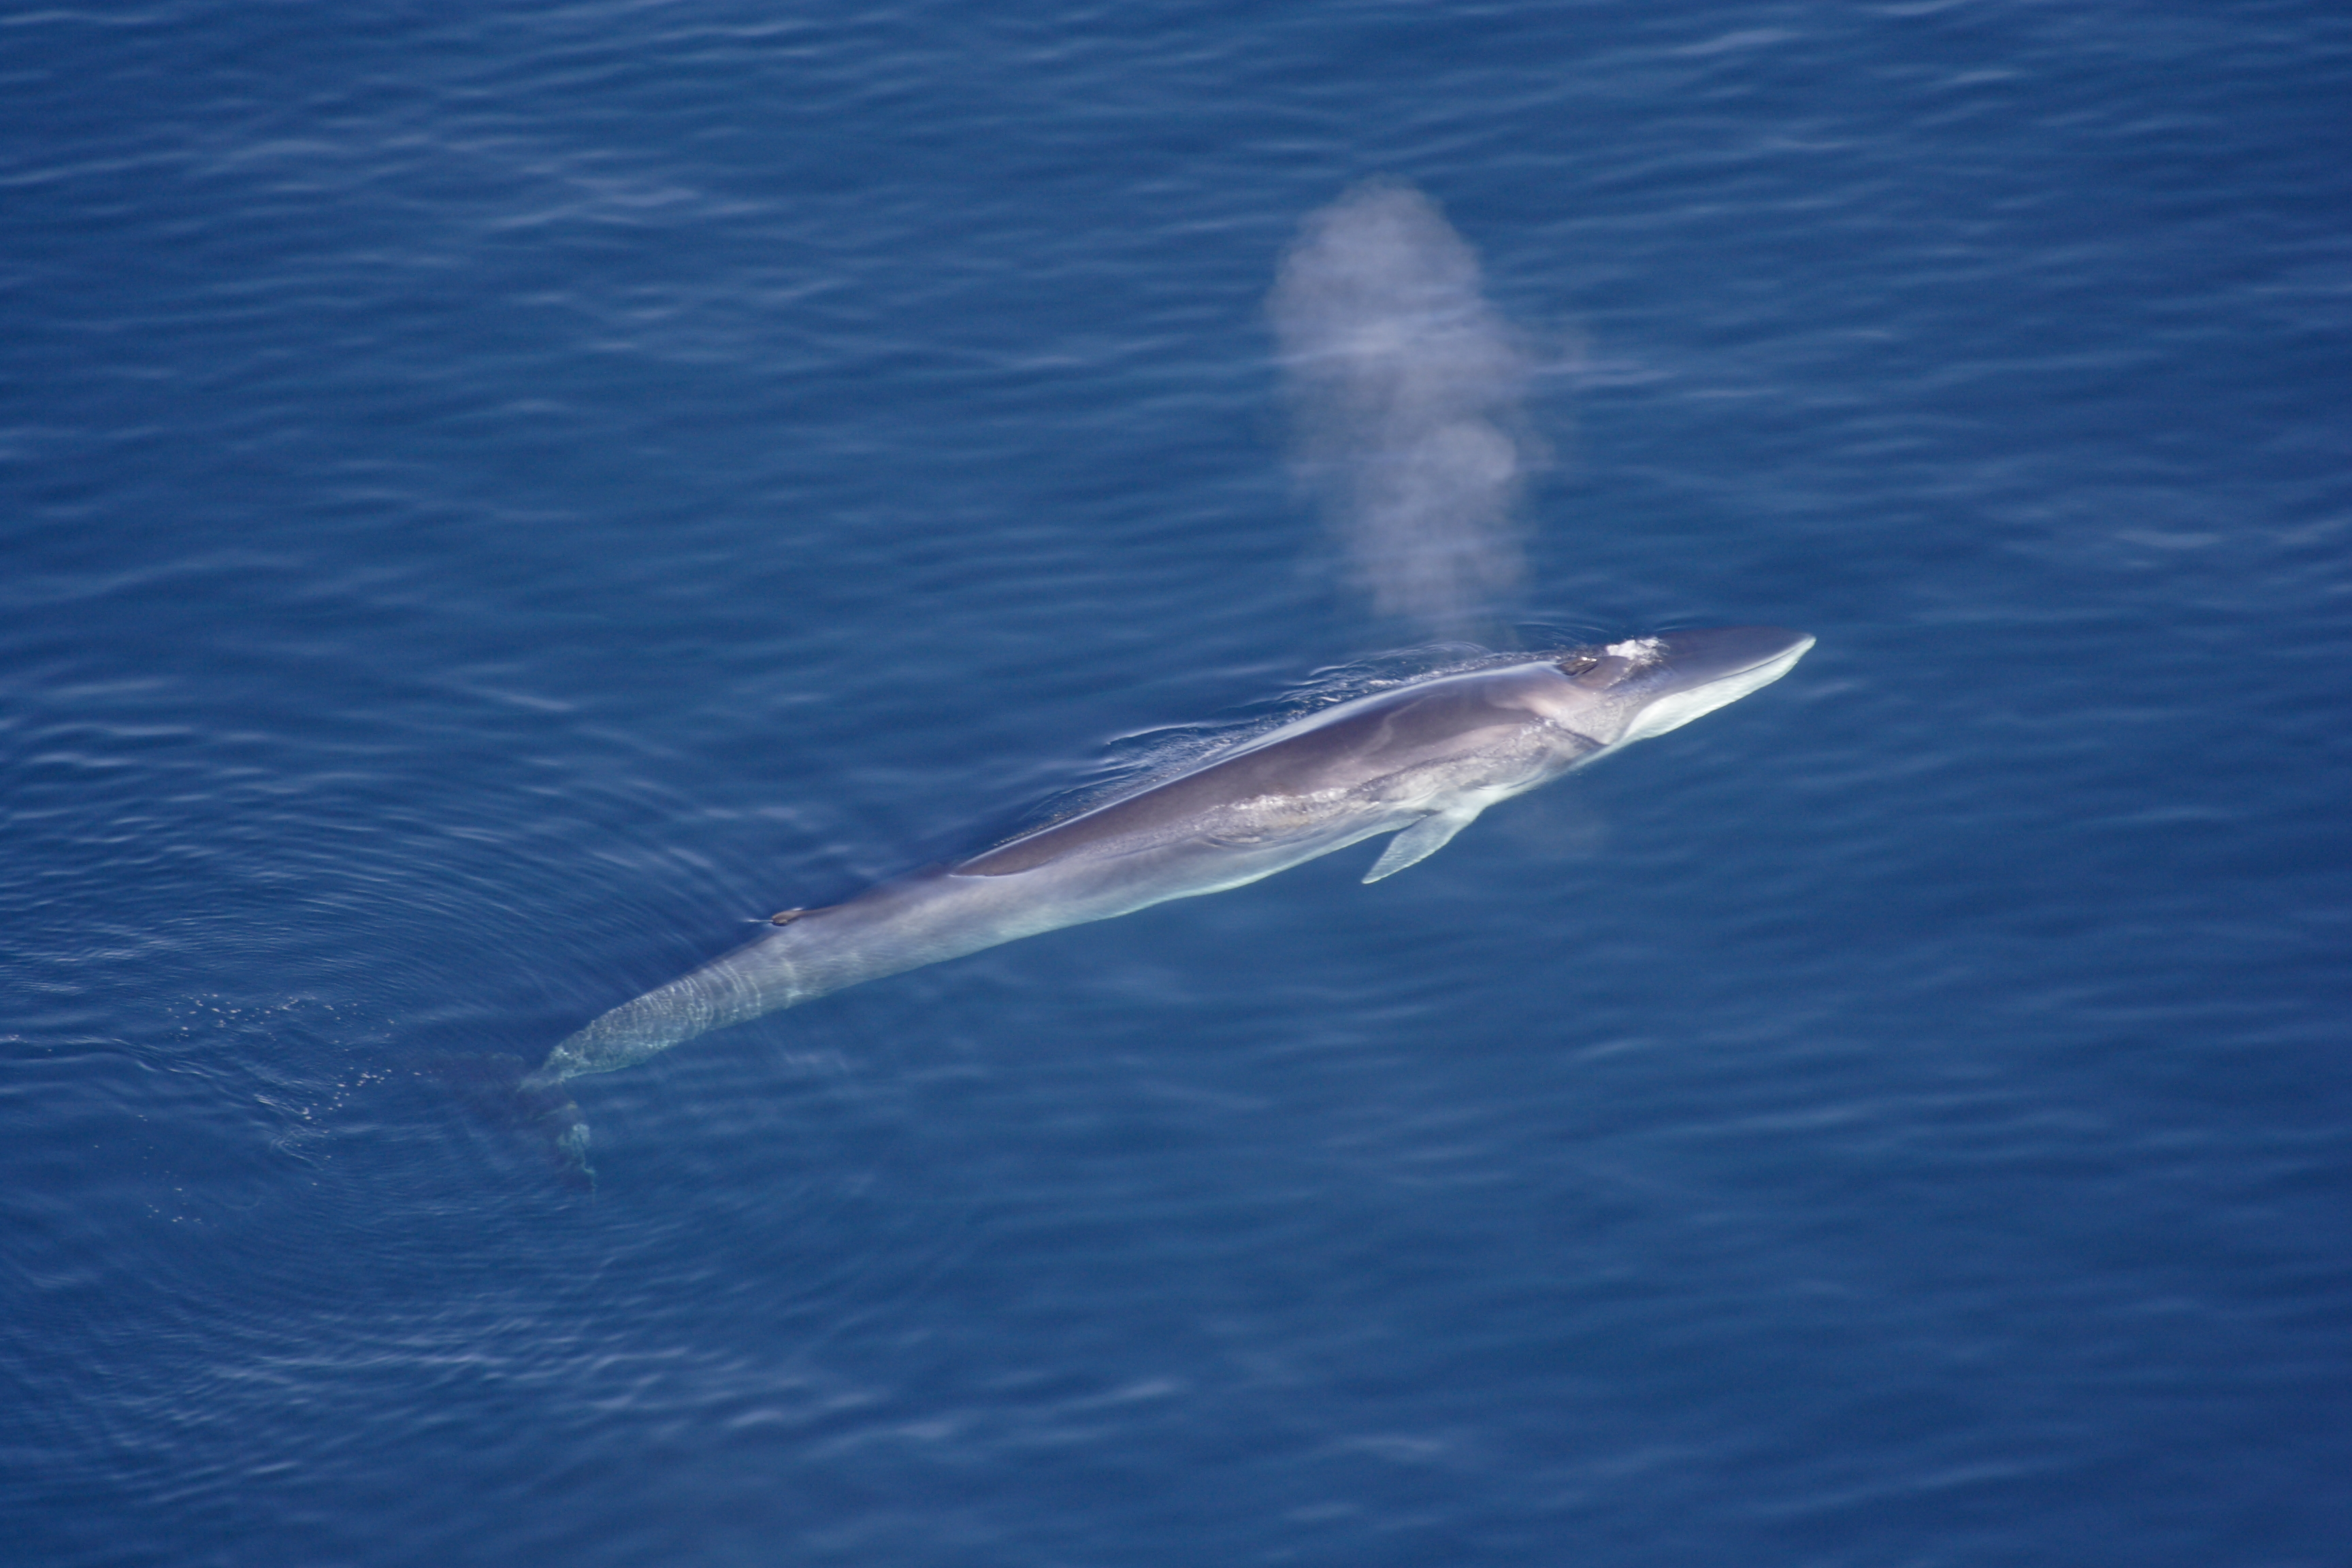
Rorqual commun (Balaenoptera physalus) (avec la permission de Aqqa Rosing-Asvid)
Cetaceans make up an important component of marine biodiversity in the North-East Atlantic Ocean, as is clearly shown by their distribution and density. Data from the systematic large-scale surveys in 2005 (Small Cetaceans in the European Atlantic and North Sea; SCANS II) and 2007 (Cetacean Offshore Distribution and Abundance in the European Atlantic; CODA) and the Trans North Atlantic Sightings Survey (T-NASS) have been analysed using models that relate the density of species to features of their habitat to produce maps of predicted density distribution in the North-East Atlantic Ocean (Figure 1). These plots indicate that cetaceans are distributed widely across this area and the relatively small amount of overlap in predicted high-use areas highlights how the different species utilise the marine area in different ways, at least in summer. These and other similar data have been analysed to provide abundance estimates.
Results of these analyses show that whales, dolphins and porpoises are abundant throughout the North-East Atlantic Ocean. Although 36 species of cetacean have been recorded within the Greater North Sea, Celtic Seas, and the Bay of Biscay and Iberian Coast (Waring et al., 2009) many are widely dispersed oceanic species that are rarely seen in these waters and thus very difficult to monitor systematically, regularly and frequently. Accordingly, this indicator assessment is mainly dedicated to assessing those species for which consistently robust information on abundance and distribution are available.
This indicator assessment considers information on abundance and distribution. The status of the following species is assessed: harbour porpoise (Phocoena phocoena), the offshore population of bottlenose dolphin (Tursiops truncatus) (coastal populations are considered separately in the Intermediate Assessment), white-beaked dolphin (Lagenorhynchus albirostris), short-beaked common dolphin (Delphinus delphis), striped dolphin (Stenella coeruleoalba), minke whale (Balaenoptera acutorostrata), fin whale (B. physalus), long-finned pilot whale (Globicephala melas), sperm whale (Physeter macrocephalus), and beaked whales (the latter as a combined species group, Ziphiidae).
Human Pressures
Cetaceans are subject to a range of human pressures, some of which have been shown to have negative impacts at the individual level, ranging from increased stress and higher energetic costs, through sub-lethal effects on reproduction and immune function, to mortality. In more serious cases, effects may manifest at population level (Hammond et al., 2008; MAGRAMA, 2012; JNCC, 2013). These pressures include incidental bycatch in fishing gear (Silva et al., 2011; Arbelo et al., 2013; ICES, 2014a), collisions with ships (Laist et al., 2001; Panigada et al., 2006; Evans et al., 2011; Arbelo et al., 2013), underwater noise generated by shipping or seismic activities (Evans and Nice, 1996; Gordon et al., 2003; David, 2006; Arbelo et al., 2013; Jepson et al., 2013), prey depletion caused by overfishing, habitat loss or degradation, pollution (Berggren et al., 1999; Bennett et al., 2001; Beineke et al., 2005; Davison et al., 2011; Law et al., 2012; Méndez-Fernandez et al., 2014a,b; Murphy et al., 2015; Jepson et al., 2016), marine debris (Laist, 1987, 1997; WDCS, 2011; ASCOBANS, 2013; Baulch and Perry, 2014; Lusher et al., 2015), pressures related to offshore development of oil, gas and renewable energy, including underwater noise as well as potential habitat loss or collision risk associated with installations (Wilson et al., 2007; Bailey et al., 2014), and climate change (Evans and Bjørge, 2013).
The threats / pressures listed in Table a represent those considered to have most relevance for marine mammals (OSPAR, 2012; ICES, 2015). Pressure and threat levels are classified as high, medium or low for each species-region combination, and are assessed on an individual to population level using the following criteria:
- High (H): evidence or strong likelihood of negative population effects, mediated through effects on individual mortality, health and/or reproduction
- Medium (M): evidence or strong likelihood of impact at individual level on survival, health or reproduction but effect at population level is not clear
- Low (L): possible negative impact on individuals but evidence is weak and / or occurrences are infrequent.
- No Information (NI): cases where there was little or no information on the impact on marine mammals and cases where the threat was absent or irrelevant for a particular region-species combination.
Results reflect both regional differences in pressures and differences in species ecology or habitat. Thus species feeding on cephalopods are more likely to ingest plastic bags, beaked whales are particularly susceptible to mid-frequency long-signal sonar sound, and coastal species are generally exposed to higher levels of pollutants.
| PRESSURE CATEGORY | Harbour porpoise | Common dolphin | White beaked dolphin | Atlantic white sided dolphin | Risso's dolphin | Minke whale | Long finned pilot whale | ||
|---|---|---|---|---|---|---|---|---|---|
| Pollution & Other Chemical Changes | Contaminants | H | M | M | M | M | L | M | |
| Nutrient enrichment | L | L | L | L | L | L | L | ||
| Physical Loss | Habitat loss | ||||||||
| Physical Damage | Habitat degradation | L | L | L | L | L | L | L | |
| Other Physical Pressures | Litter (inc.microplastics and discarded fishing gear) | L | L | L | L | L | M | L | |
| Underwater noise changes | Military Sonar | M | M | M | M | M | M | M | |
| Seismic surveys | M | M | M | M | M | M | M | ||
| Pile driving | M | M | M | M | M | M | M | ||
| Shipping | M | M | M | M | M | M | M | ||
| Barrier to species movement (offshore windfarm, wave or tidal device arrays) | L | L | L | L | L | L | L | ||
| Death or injury by collision | Death or injury by collision (with ships) | L | M | L | L | L | M | L | |
| Death or injury by collision (with tidal devices) | Risk of collision leading to death or injury is considered possible, but no evidence of such an occurrence to date | ||||||||
| Biological Pressures | Introduction of microbial pathogens | L | L | L | L | L | L | L | |
| Removal of target and non-target species (prey depletion) | M | L | L | L | L | M | L | ||
| Removal of non-target species (bycatch) | H | M | L | L | L | M | L | ||
| Disturbance (e.g. wildlife watching) | L | L | L | L | L | L | L | ||
| Deliberate killing + hunting | Does not occur | L | L | ||||||
Risk is defined as likelihood of negative population effects, mediated through effects on individual mortality, health and/or reproduction; H = high risk; M = medium risk; L = low risk; NI = no information.
Note: Although they are not addressed in this IA, Risso’s dolphin and white-sided dolphin are included in this Table a because they were hunted in the Faroe Islands (at least until 2010).
Historical Data on Abundance and Distribution
There is very little information about historical distribution (pre-1980) for any species of cetacean in the area assessed and no information about historical abundance. Methods to estimate cetacean abundance were first developed in the 1980s (Hammond, 1986; Hiby and Hammond, 1989). Development in analytical and survey methods continues. The most recent methods are used during the SCANS surveys (Hammond et al., 2002, 2013). Information on cetacean population size was previously limited to the use of catch-per-unit-effort analyses to inform whaling.
Data on strandings have been recorded for more than 100 years, but these can provide only very limited information on the presence at sea of offshore species, and it is not possible to use these data to infer population trends without additional information on causes of death, search effort and drifting of dead animals. In some cases, strandings data can provide information about distribution, such as with harbour porpoise, for which stranding numbers inclined steeply in the Southern North Sea due to a shift in distribution, with a relatively high level of strandings up to date.
Quality Status Report 2010
No comparable quantitative assessment of the distribution and abundance of wide-ranging cetaceans was included in the Quality Status Report 2010. The report highlighted human pressures on marine mammals more generally, such as bycatch, increased shipping and bioaccumulation of persistent hazardous substances.
Wide-ranging cetaceans are also assessed under the European Union Habitats Directive Article 17 reporting in 2013 (EU, 2013).
Methods
The data used to infer distribution and to estimate abundance mostly derived from large-scale aerial and shipboard surveys that used line transect methodology to generate robust estimates of abundance: SCANS (Small Cetacean Abundance in the North Sea; (Hammond et al., 2002), SCANS-II (Small Cetacean Abundance in the European Atlantic and North Sea; Hammond et al., 2013), CODA (Cetacean Offshore Distribution and Abundance in the European Atlantic; CODA, 2009) and SCANS-III; Hammond et al., 2017). The results of other large-scale surveys using similar methods have also been used: North Atlantic Sightings Surveys (NASS) ( www.nammco.no ) and Norwegian Independent Line Transect Surveys (NILS) for minke whales (e.g. Solvang et al., 2015). Smaller-scale (mostly national) surveys have been conducted using the same or a similar methodology, such as in Belgium, Denmark, France, Germany, the Netherlands, and Sweden (Scheidat et al., 2008; Viquerat et al., 2014; Gilles et al., 2016; Laran et al., 2017). The large-scale surveys provide information on distribution and abundance over a large area but are infrequent, and only undertaken in summer. The smaller-scale surveys are undertaken more often, and sometimes reveal seasonal patterns at a local scale.
MSFD Criterion D1.1 – Species Distribution
Where possible, information on species distribution has been obtained from modelled density surfaces fitted to data collected during large-scale surveys (e.g. Gilles et al., 2016; Rogan et al., 2017). Where this was not possible, distribution was derived from the distribution of animals seen on these and other surveys.
MSFD Criterion D1.2 – Population Size
Abundance was estimated using line transect distance sampling methods (design-based estimates; Hammond et al., 2013). Shipboard survey methods mostly used two observation teams on the same vessel so that animals missed on the transect line and any responsive movement could be accounted for in the analysis. However, for some species in some years, sufficient data were not available for such extended analytical methods to be used. Several aerial surveys used tandem aircraft or the circle-back procedure for harbour porpoises (Phocoena phocoena) to correct for animals missed on the transect line (Hiby and Lovell, 1998; Hiby, 1999); this was extended to dolphin species and minke whales (Balaenoptera acutorostrata) in SCANS-III in 2016. In other cases, conventional aerial survey methods were used, corrected for availability and observer bias where possible (Hammond et al., 2013).
Wide-scale surveys were conducted in France in 2011 and 2012 (see Laran et al., 2017). Irish data from the aerial surveys of cetaceans undertaken in 2015-2017 as part of the ObSERVE programme. While data was not available for this assessment it should be available for future assessment.
Metrics
D1.1 – Species Distribution
Density surface models have been used to predict the distribution of those species for which sufficient data are available from large-scale purpose-designed surveys. For recent data for which results from density surface models are not yet available, maps of observed sightings provide information on distribution.
D1.2 – Population Size
Abundance of animals per species has mostly been estimated using data collected from large-scale purpose-designed aerial or shipboard surveys using line-transect distance sampling methods (Buckland et al., 2001); these are known as design-based estimates (e.g. Hammond et al., 2013). Some abundance estimates come from models fitted to these data to generate a density surface from which abundance is derived; these are known as model-based estimates (e.g. Gilles et al., 2016).
Baselines
Although the baseline should derive from historical data, these data are not available for any cetacean species. Historical abundance and distribution are therefore unknown. Even if numbers are suspected to have declined, they could probably not realistically be restored because today’s marine environment is very different, in part due to climate change and human impact. Consequently, a recent baseline must be used, which should then be assessed as a normal situation, or one that is already known to be degraded. The most useful baselines for wide-ranging cetacean species derive from the results of large-scale surveys (e.g. CODA, 2009; Hammond et al., 2002, 2013).
For most species, only two abundance estimates are currently available so a robust assessment of a trend involving change from a baseline is not possible. For harbour porpoise and white-beaked dolphin (Lagenorhynchus albirostris) in the Greater North Sea there are three estimates available (SCANS, SCANS-II and SCANS-III) so an assessment of sorts is possible. For minke whale, there are eight estimates available in the North Sea from SCANS and Norwegian surveys from 1989 to 2016 allowing a more robust assessment. For harbour porpoise in the Kattegat / Belt Seas, there are four estimates available.
Spatial Scope
Assessment Units (AUs) for assessing abundance and distribution were defined for a number of species (ICES, 2014b) in separate regions, or in the OSPAR Maritime Area. For harbour porpoise, six AUs have been defined (Figure a). For bottlenose dolphin (Tursiops truncatus), ten AUs have been defined for the relatively small coastal populations (covered in a separate section of the Intermediate Assessment) and a single offshore AU for the relatively large and wide-ranging population(s) of bottlenose dolphin living offshore. Currently, a single AU covering all European Atlantic waters has been defined for minke whale, white-beaked dolphin and short-beaked common dolphin (Delphinus delphis). No AUs have been defined for other species included in this document.
Assessment Value
No assessment value has been applied in this assessment.
Definition of Trends
Declining means a decreasing trend of ≥5% over 10 years (significance level p<0.05).
Increasing means an increasing trend of ≥5% over 10 years (significance level p<0.05).
Stable means population changes of <5% over 10 years.
This percentage (i.e. 5%) is derived from the International Union for the Conservation of Nature (IUCN) criterion to detect a 30% decline over three generations for a species, which equates to slightly less than 0.5% per year for Odontocetes.
Power Analysis
Power analyses were performed for species for which there are three or more comparable estimates of regional abundance from SCANS and other surveys, using previously estimated coefficients of variation (CV). The datasets comprised abundance estimates from three surveys over 22 years for harbour porpoise, three surveys over 22 years for white-beaked dolphin, and eight surveys over 27 years for minke whale. These data have 80% power (the conventional acceptable level) to detect an annual rate of change, at a significance level (p value) of 0.05, of 1.5% for harbour porpoise, 2.5% for white-beaked dolphin, and 0.5% for minke whale.
These annual rates of change decrease to <1% for harbour porpoise and 2% for white-beaked dolphin following an additional survey after six years.
The power to detect trends could be improved by increasing the frequency of the large-scale surveys.
Technical Explanation for the Reanalysis of Scans (1994) and Scans-II (2005) Data
SCANS-III surveyed the entire European continental shelf by aerial survey, except for the Kattegat and Belt Seas area, which were surveyed by ship. Most of these waters were surveyed by ship In SCANS and SCANS-II. Methodologies employed for ship (two-team ‘tracker’) and aerial survey (circle-back) should generate unbiased estimates of abundance for most species (harbour porpoise, dolphin species and minke whale) so estimates for these species from ship and aerial surveys are, therefore, comparable.
However, there is a choice of two models to estimate detection probability when the two-team ‘tracker’ method has been employed on a ship survey. One method, called the point (or trackline) independence model, provides robust estimates of abundance incorporating estimates of the probability of detection of animals on the transect line, so-called g(0), which is assumed to be 1 in conventional line transect analysis. In this method a detection function is fitted to the primary team data to estimate average detection probability assuming g(0) = 1, and a second detection function is fitted to primary detections conditional on those detections being first seen by the tracker team to estimate g(0). This is the preferred model for two-team ‘tracker’ data analysis.
The other method, called the full independence model, fits the second conditional detection function but does not fit the first conventional detection function. This model should be used to correct for bias introduced when there is movement of animals in response to the approaching survey ship. However, it is not a robust model and tends to underestimate abundance because of non-independence in tracker and primary sightings.
The full independence model was used to estimate abundance of all species from the ship surveys in SCANS in 1994 and SCANS-II in 2005. The point independence model had not yet been developed in 1994. In 2005, there was weak evidence of responsive movement for some species so a cautious approach was adopted at the time leading to estimates that were likely to be negatively biased. However, this creates a problem of comparison with estimates between SCANS, SCANS-II and SCANS-III in any assessment of trend. Aerial surveys are not subject to responsive movement and the circle-back methods used should be unbiased. In SCANS-III, there was no evidence of movement of animals in response to the survey ships so the more robust point independence detection function model was used for all species.
The solution implemented has been to reanalyse the SCANS and SCANS-II data using the more robust point independence model of detection probability so that estimates are comparable between 1994, 2005 and 2016.
In addition, the g(0) estimates for dolphin species and for minke whale in the SCANS-III aerial survey have been used to correct estimates of abundance for white-beaked dolphin, common dolphin, bottlenose dolphin and minke whale from the SCANS-II aerial survey, in place of the corrections previously used for availability only, based on dive data from other studies.
The end result of the re-analysis of the SCANS I and II data is that estimates for 1994 and 2005 for most species are different (and generally larger) to those published in 2002 and Hammond et al., 2013.
Résultats
La cartographie de la répartition de la densité des cétacés dans la mer du Nord au sens large, les mers Celtiques, et le golfe de Gascogne et la côte ibérique indique que les cétacés sont largement répandus dans la zone maritime OSPAR (Figure 1). Le nombre relativement faible de chevauchements dans les zones très utilisées prévues met en évidence que les espèces utilisent la zone marine de diverses manières. Les marsouins se limitent principalement aux eaux du plateau continental. Le dauphin bleu et blanc, le rorqual commun, le cachalot, la baleine à bec de Cuvier et les globicéphales se trouvent essentiellement dans les eaux profondes au delà de la bordure du plateau. Le grand dauphin, le dauphin à nez blanc, les dauphins communs et les petits rorquals se trouvent sur le plateau et dans les eaux profondes. L’étude la plus récente du SCANS III, réalisée en 2016, a obtenu des estimations de l’abondance des populations de marsouin, de dauphin commun, de dauphin bleu et blanc, de dauphin à nez blanc, de grand dauphin, de rorqual commun, de petit rorqual, de globicéphale, de cachalot et de baleines à bec de Cuvier (Figure 2). L’étude du SCANS III n’a cependant pas couvert les eaux d’Irlande et d’Islande.
On ne dispose pas d’informations suffisantes pour évaluer les modifications de la répartition dans le temps, à l’exception du marsouin dans le Kattegat / les mers Belt (données exhaustives pour 1994, 2005, 2012 et 2016) et le marsouin, le dauphin à nez blanc et le petit rorqual en mer du Nord, sur lesquels les données sont exhaustives pour 1994, 2005 et 2016 et des années supplémentaires pour le petit rorqual. Entre 1994 et 2005, la répartition du marsouin en mer du Nord s’est nettement déplacée, étant à l’origine essentiellement au Nord et désormais essentiellement au Sud; ce déplacement s’est maintenu en 2016 et plus d’observations ont été faites dans l’ensemble de la Manche en 2016 que les années précédentes. Une tendance similaire, quoique plus faible, est établie pour le petit rorqual. La répartition du dauphin à nez blanc ne semble pas avoir changé entre 1994 et 2016.
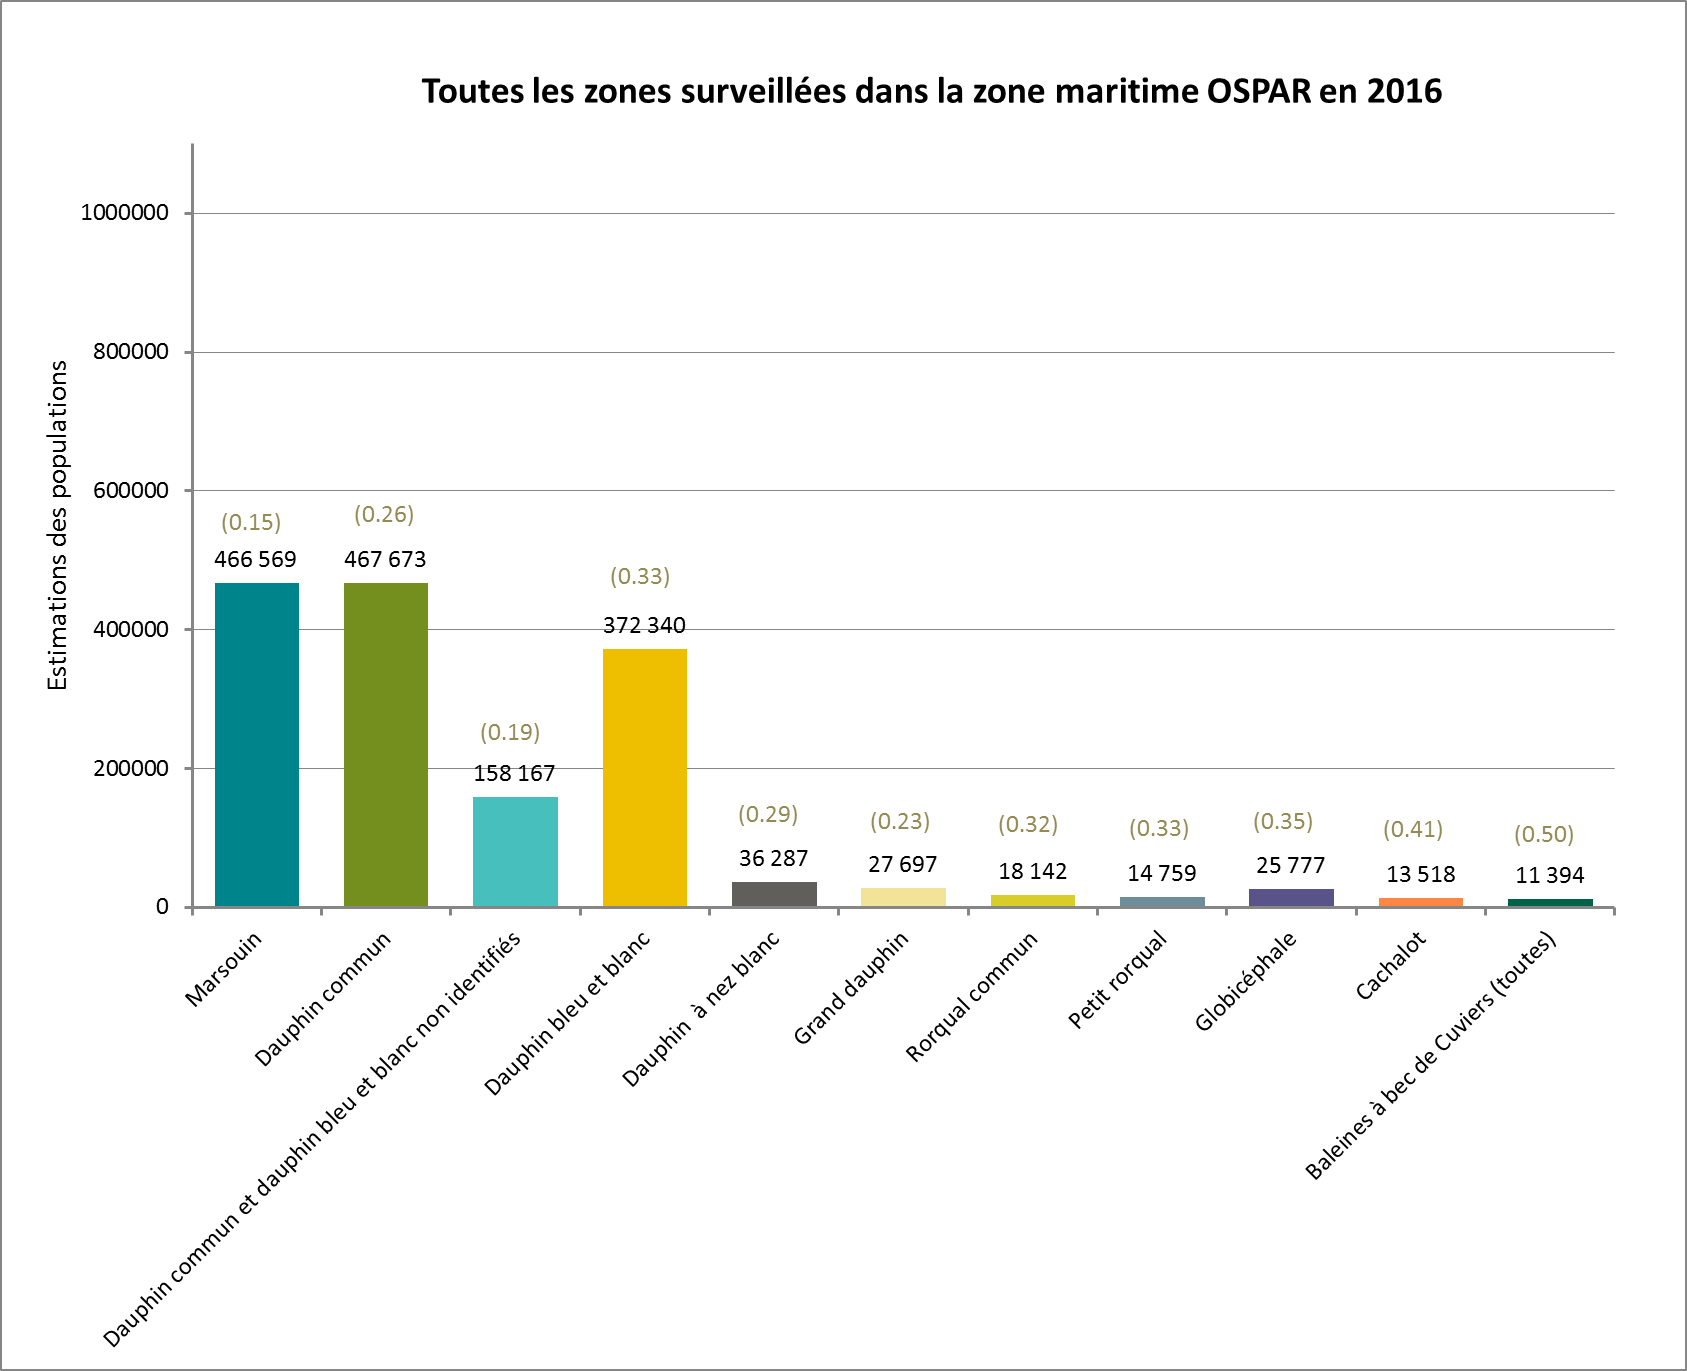
Figure 2: Estimations de l’abondance des populations par l’étude du SCANS III en 2016, comprenant les valeurs des coefficients de variation (cv)
Trois autres estimations comparables de l’abondance sont disponibles seulement pour le marsouin, le dauphin à nez blanc et le petit rorqual en mer du Nord, et le marsouin dans le Skagerrak / le Kattegat / les mers Belt. On ne relève aucune tendance de l’abondance de ces espèces dans ces régions. Dans le cas d’autres espèces, il n’est pas possible d’évaluer avec confiance si les populations diminuent, sont stables ou augmentent. Les estimations les plus récentes de l’abondance pour 2016 sont cependant similaires ou supérieures aux estimations antérieures pour des zones comparables.
La méthodologie inspire une confiance modérée et les données disponibles inspirent une confiance faible.
SCANS III
The most recent SCANS III survey in 2016 yielded population abundance estimates for harbour porpoise, common dolphin, striped dolphin, white-beaked dolphin, bottlenose dolphin, fin whale, minke whale, pilot whale, sperm whale and beaked whales (Table b).
| Species | Estimate (CV) | Area |
|---|---|---|
| Harbour porpoise | 26,700 (0.25) | Part of AU (SCANS III blocks B, C2, D, E, F) |
| Harbour porpoise | 2,898 (0.32) | Part of AU (SCANS-III blocks AA, AB, AC) |
| Harbour porpoise | 345,373 (0.18) | All of AU (SCANS III blocks S, T, U, V, R, Q, P, O, M, N, L, C1) |
| Harbour porpoise | 24,370 (0.23) | Part of AU (SCANS III blocks G, H, I, J, K) |
| Harbour porpoise | 42,324 (0.30) | Most of AU (SCANS III block 2) |
| Common dolphin | 467,673 (0.26) | All areas surveyed in the OSPAR Maritime Area |
| Common + striped | 158,167 (0.19) | All areas surveyed in the OSPAR Maritime Area |
| Striped dolphin | 372,340 (0.33) | All areas surveyed in the OSPAR Maritime Area |
| White-beaked dolphin | 36,287 (0.29) | All areas surveyed in the OSPAR Maritime Area |
| Bottlenose dolphin | 27,697 (0.23) | All areas surveyed in the OSPAR Maritime Area |
| Fin whale | 18,142 (0.32) | All areas surveyed in the OSPAR Maritime Area |
| Minke whale | 14,759 (0.33) | All areas surveyed in the OSPAR Maritime Area |
| Pilot whale | 25,777 (0.35) | All areas surveyed in the OSPAR Maritime Area |
| Sperm whale | 13,518 (0.41) | All areas surveyed in the OSPAR Maritime Area |
| Beaked whales (all) | 11,394 (0.50) | All areas surveyed in the OSPAR Maritime Area |
The areas surveyed in Table a are outlined in Figure a. The area in green to the west of Ireland was surveyed in summer 2016 by the Irish ObSERVE project. No data were available from this area when undertaking this assessment, however it could be included in any update of this assessment in future. The area in yellow was surveyed in summer 2015 by the NASS project.
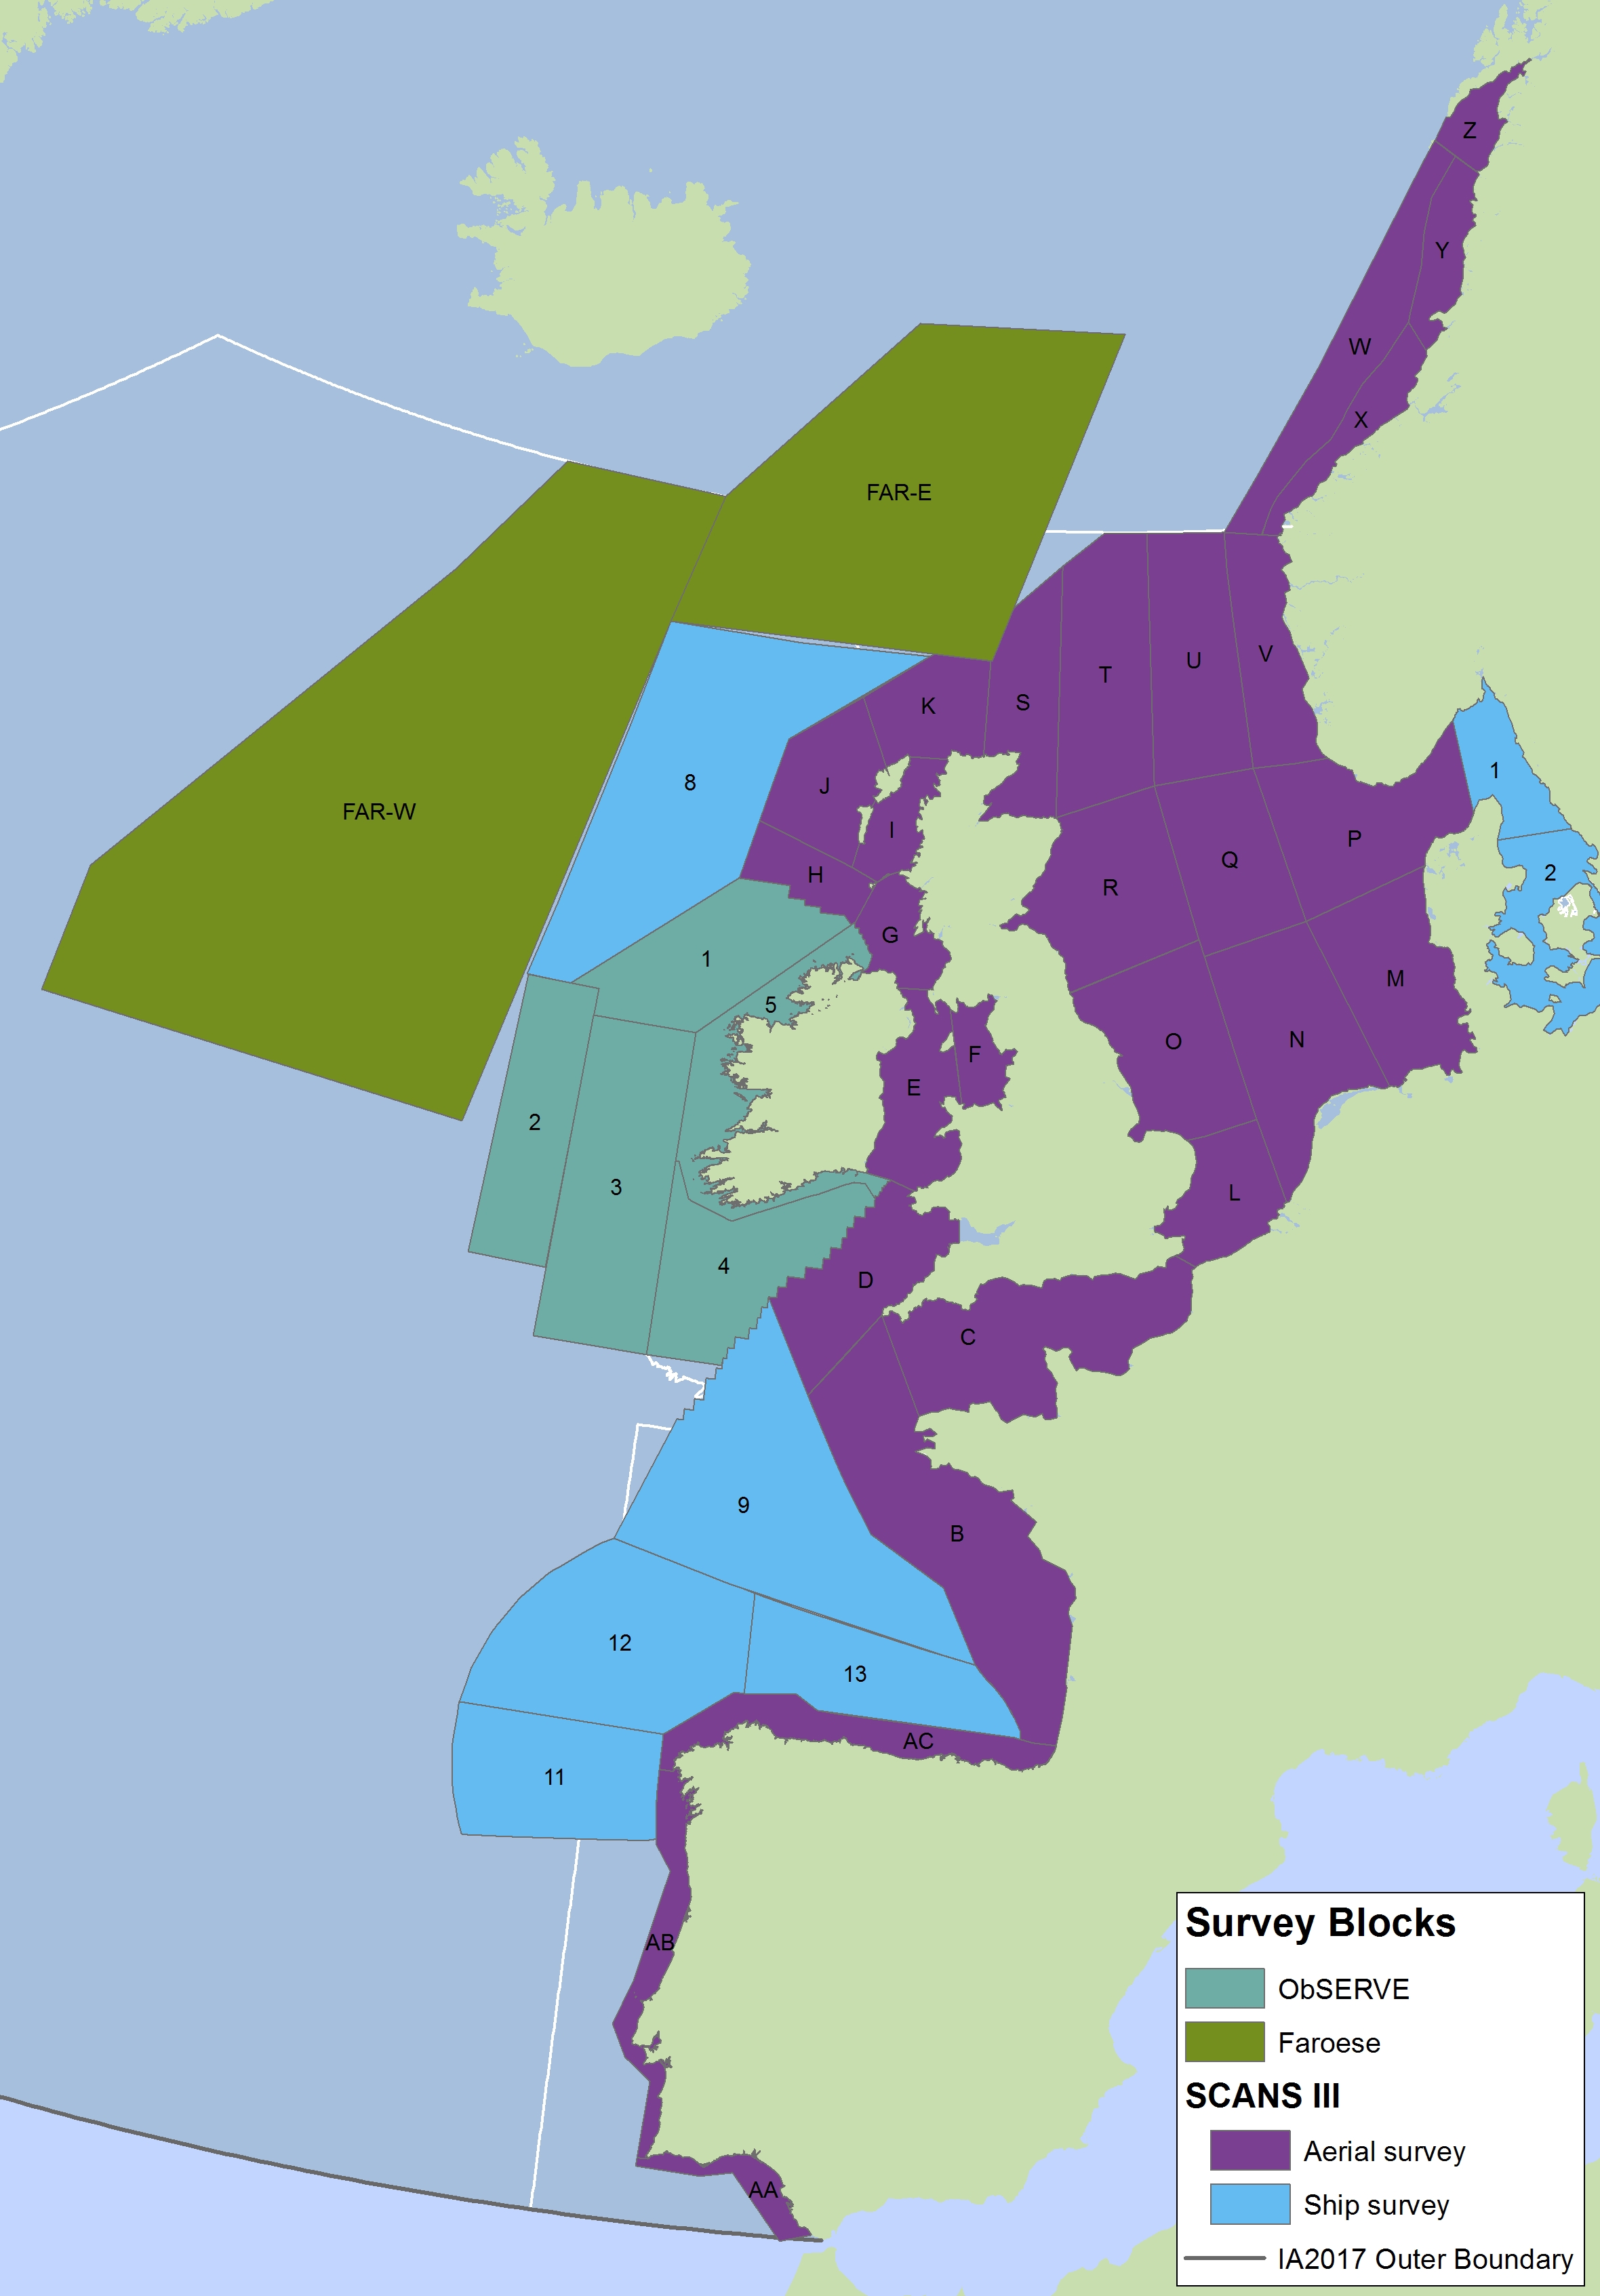
Figure a: Assessment units from the SCANS-III survey (Hammond et al., 2017)
The SCANS aerial survey is marked in purple, blue is SCANS ship-based survey, green is Irish ObSERVE survey and yellow is NASS project survey. The area in green to the west of Ireland was surveyed in summer 2016 by the Irish ObSERVE project. No data were available from this area when undertaking this assessment, however it could be included in any update of this assessment in future. The area in yellow was surveyed in summer 2015 by the NASS project.
D1.1 – Species Distribution
Harbour Porpoise
Harbour porpoises (Phocoena phocoena) are distributed throughout the shelf waters of the Greater North Sea, Celtic Seas and the Bay of Biscay and Iberian Coast. The Iberian Peninsula constitutes a separate population (Fontaine et al., 2007), while all other areas except the Kattegat / Belt Seas are sub-areas of the North-East Atlantic / Greater North Sea population. The area around the northern border of the Kattegat / Belt Seas probably contains a mix of two different populations (Sveegaard et al., 2015).
The presence of harbour porpoises is influenced by oceanographic and human pressure variables. Water depth, surface salinity, temperature differences within the water column, eddy activity, current speed, coarseness of surface sediments, seabed slope and ship density have been identified as relevant influencing factors, although the interactions depend on the area and habitat type (Pierpoint, 2008; Marubini et al., 2009; Embling et al., 2010; Isojunno et al., 2012; Booth et al., 2013; Heinänen and Skov, 2015).
A comparison of harbour porpoise distribution between the SCANS and SCANS-II data sets show a marked difference in summer distribution, with a southern shift in the main concentrations of animals between 1994 and 2005 (Figure b1). This shift in distribution is supported by data from smaller scale surveys which show increasing numbers of porpoises occurring in French, Belgian, Dutch and German waters (e.g. Gilles et al., 2009, 2011; Haelters et al., 2011; Scheidat et al., 2012; Peschko et al., 2016) and decreasing numbers in the Northern North Sea (Øien, 1999, 2005, 2010). The shift in harbour porpoise distribution is believed to be related to changes in prey distribution or abundance (Hammond et al., 2013).
Data from the SCANS-III survey in 2016 have not yet been analysed to generate density surfaces but the pattern of estimated density in survey blocks (Hammond et al., 2017) shows the shift has been maintained (Figure b2). More sightings were made throughout the English Channel in 2016 than in previous surveys.
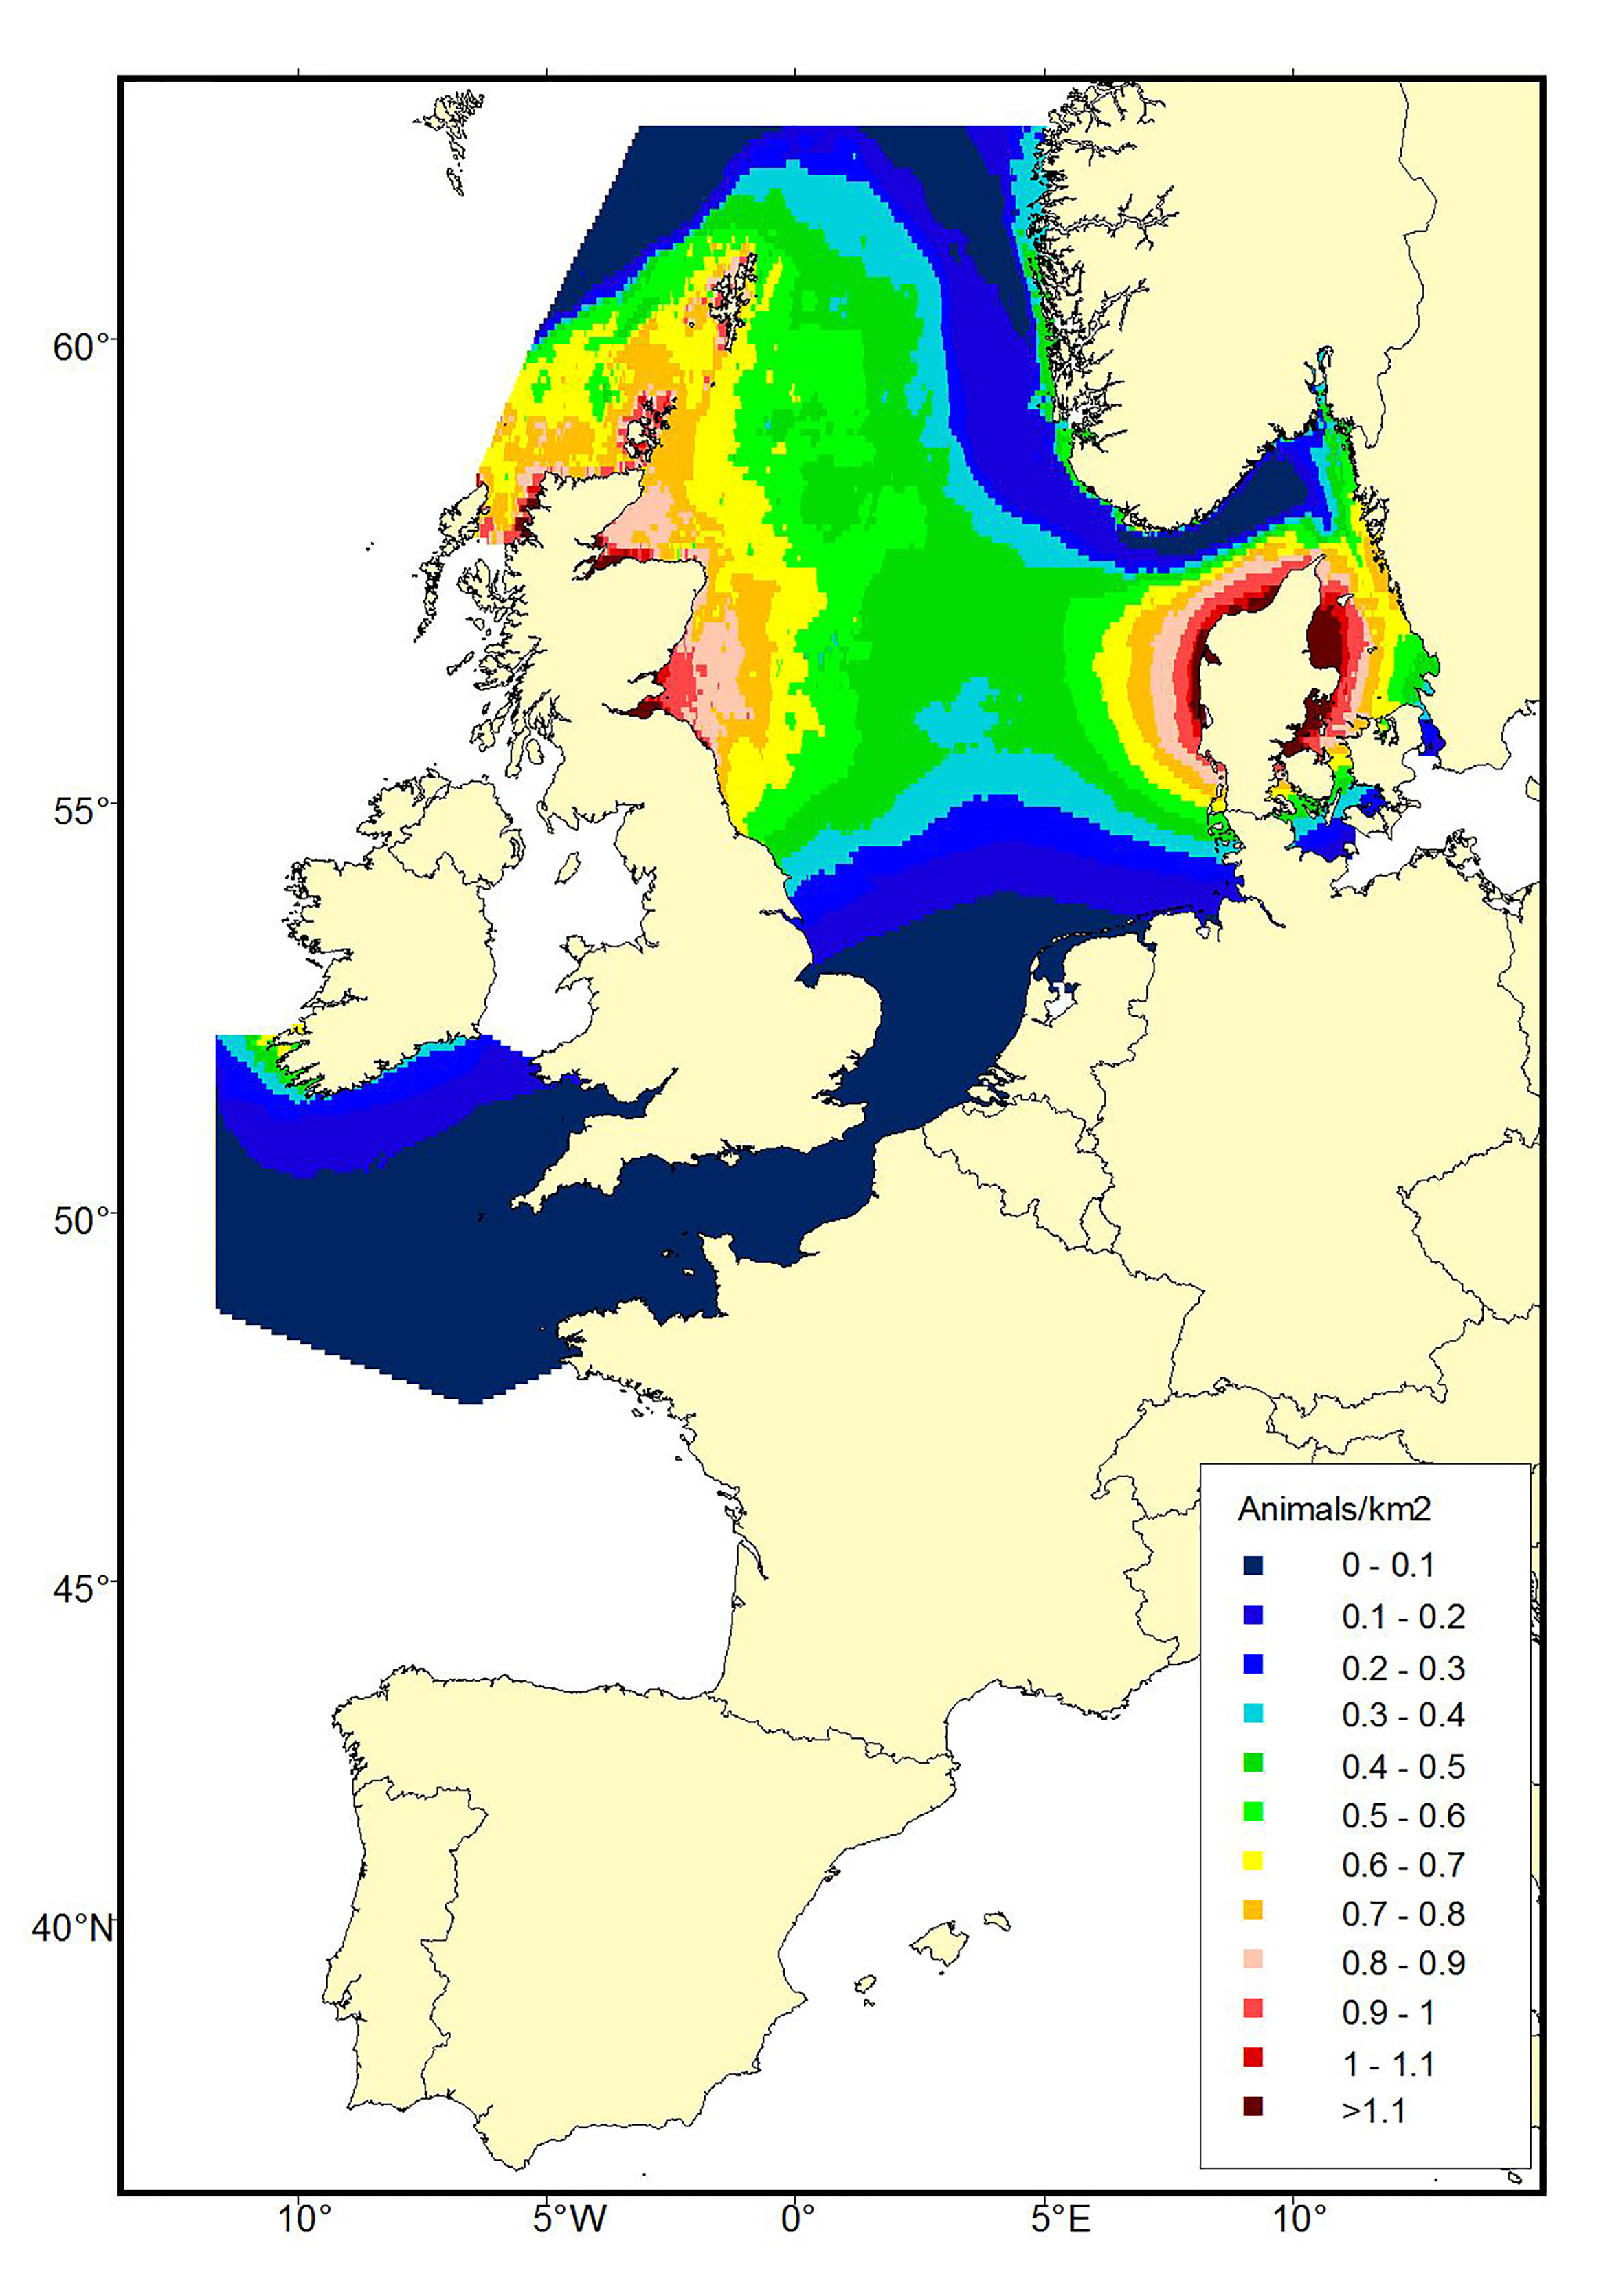
Figure b1a: Predicted density surfaces for harbour porpoise produced using the SCANS data in 1994.
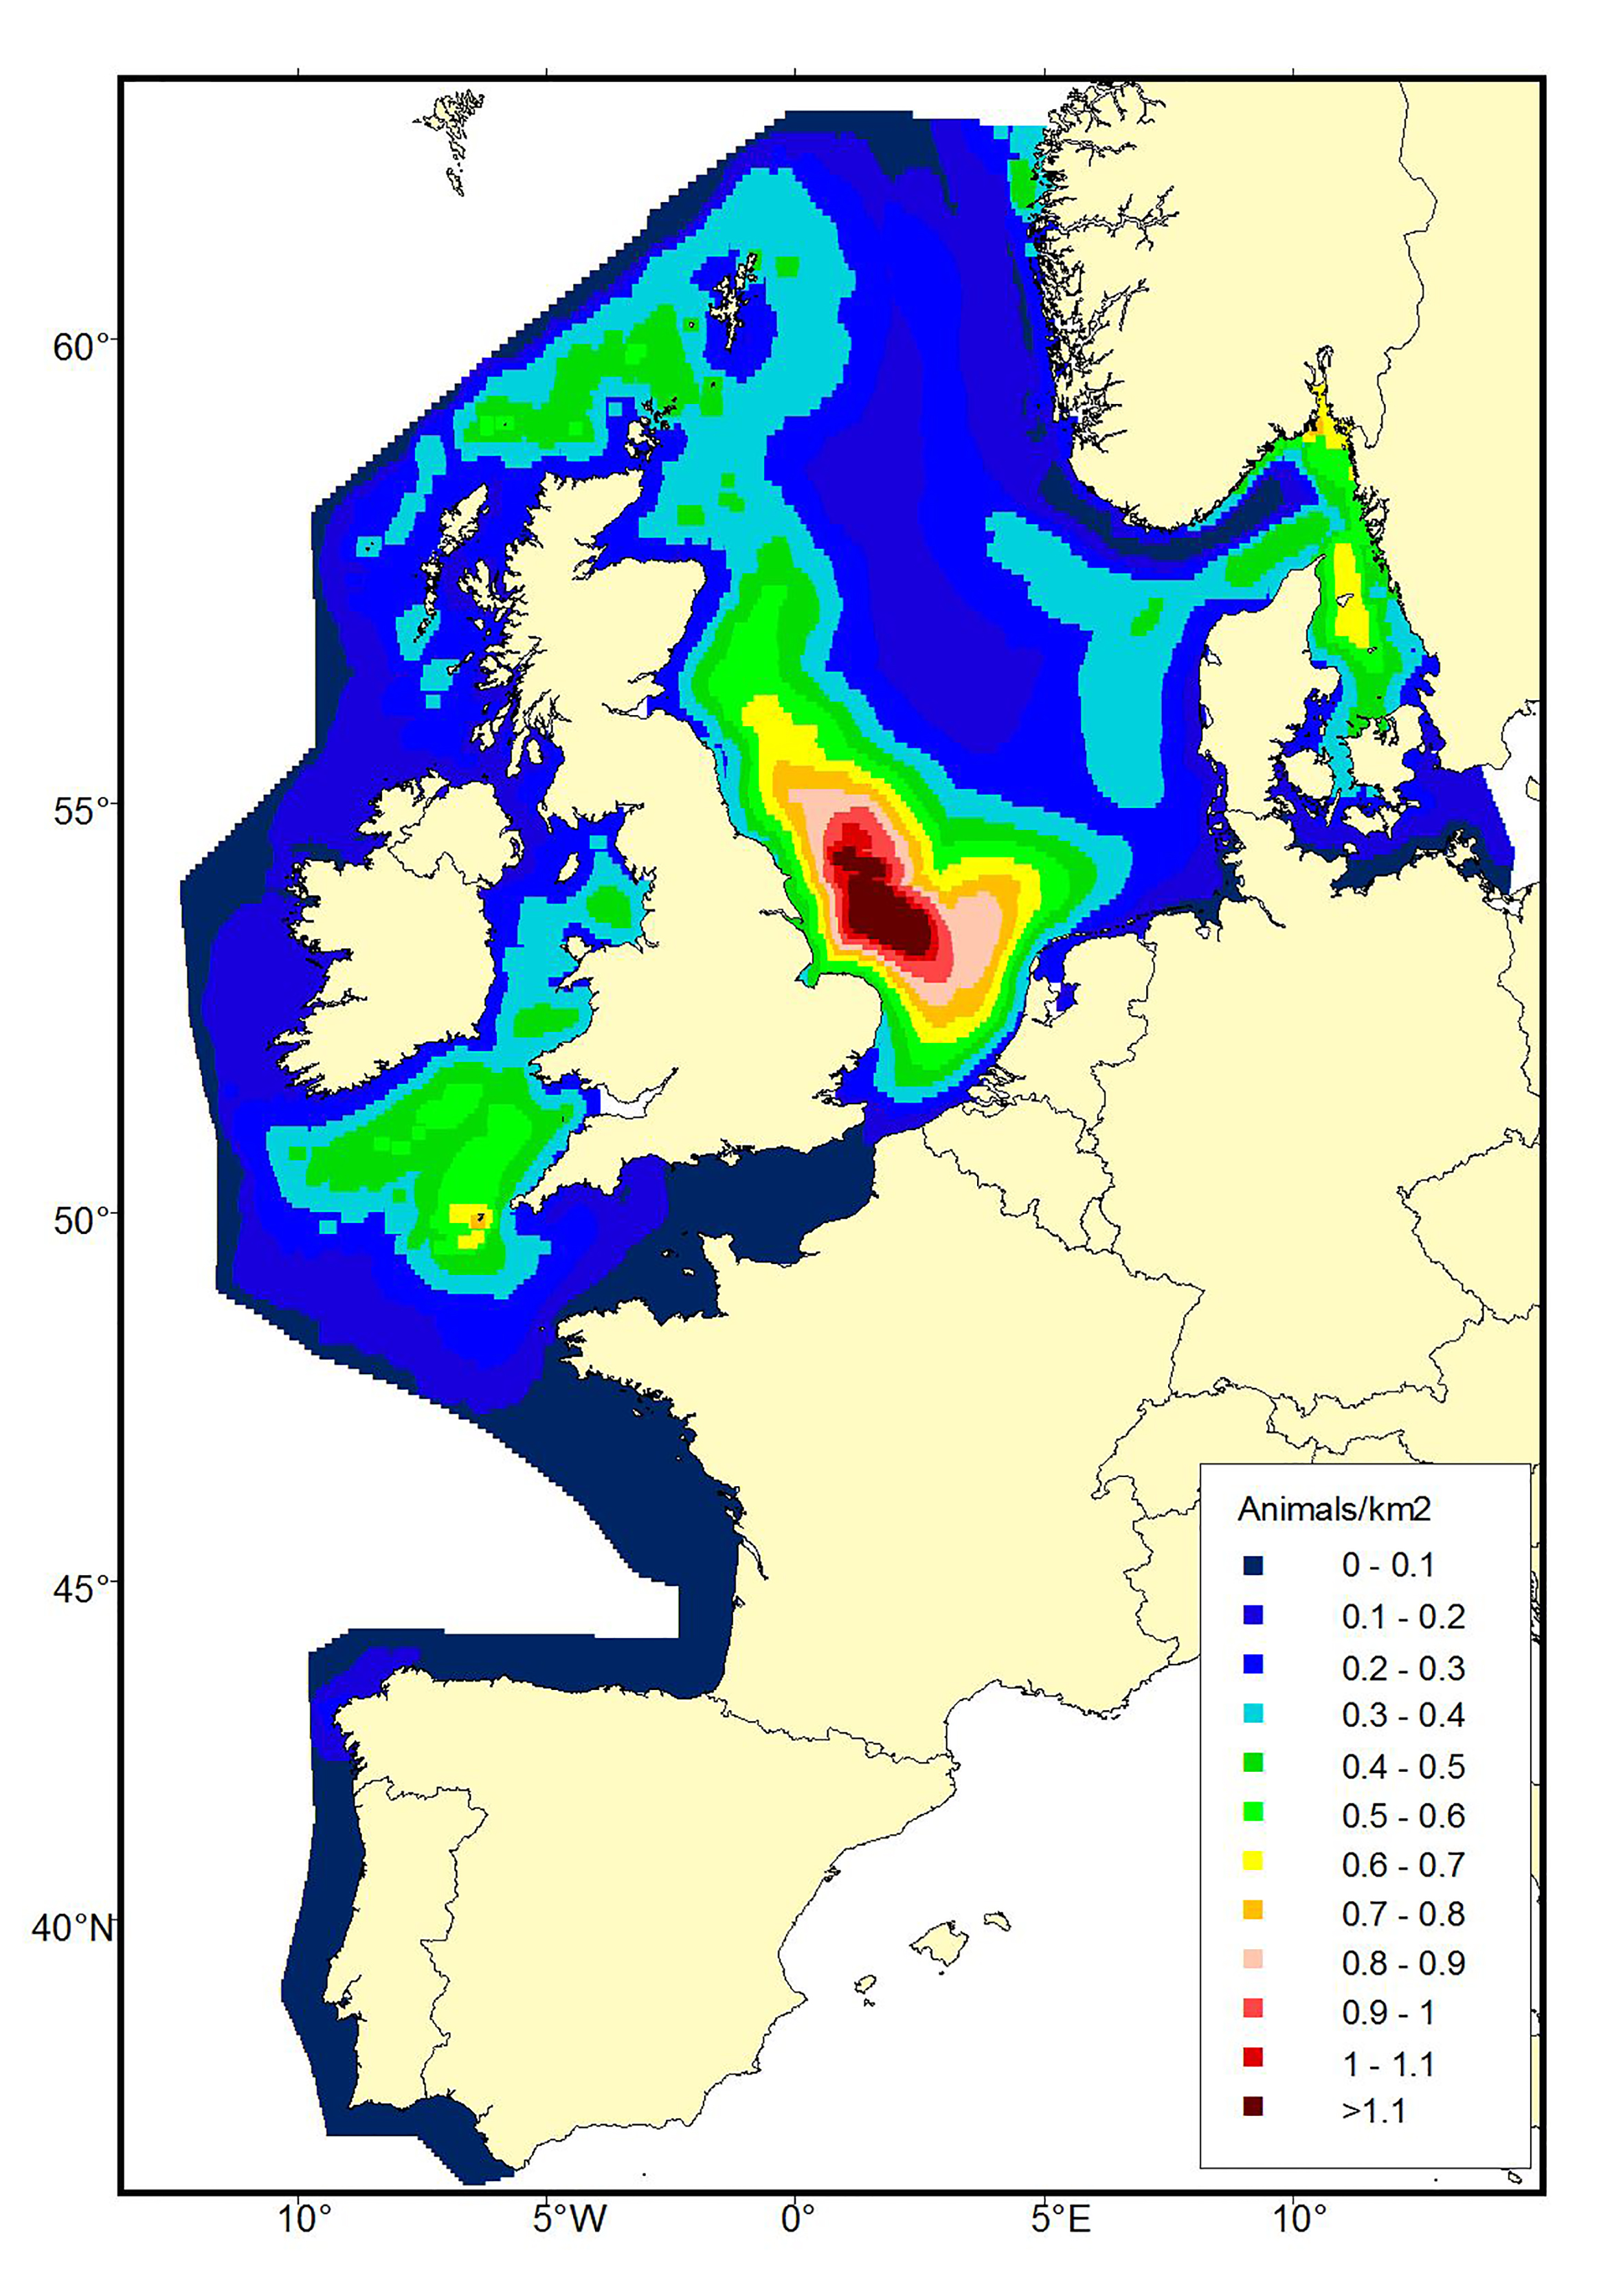
Figure b1b: Predicted density surfaces for harbour porpoise produced using the SCANS-II data in 2005.
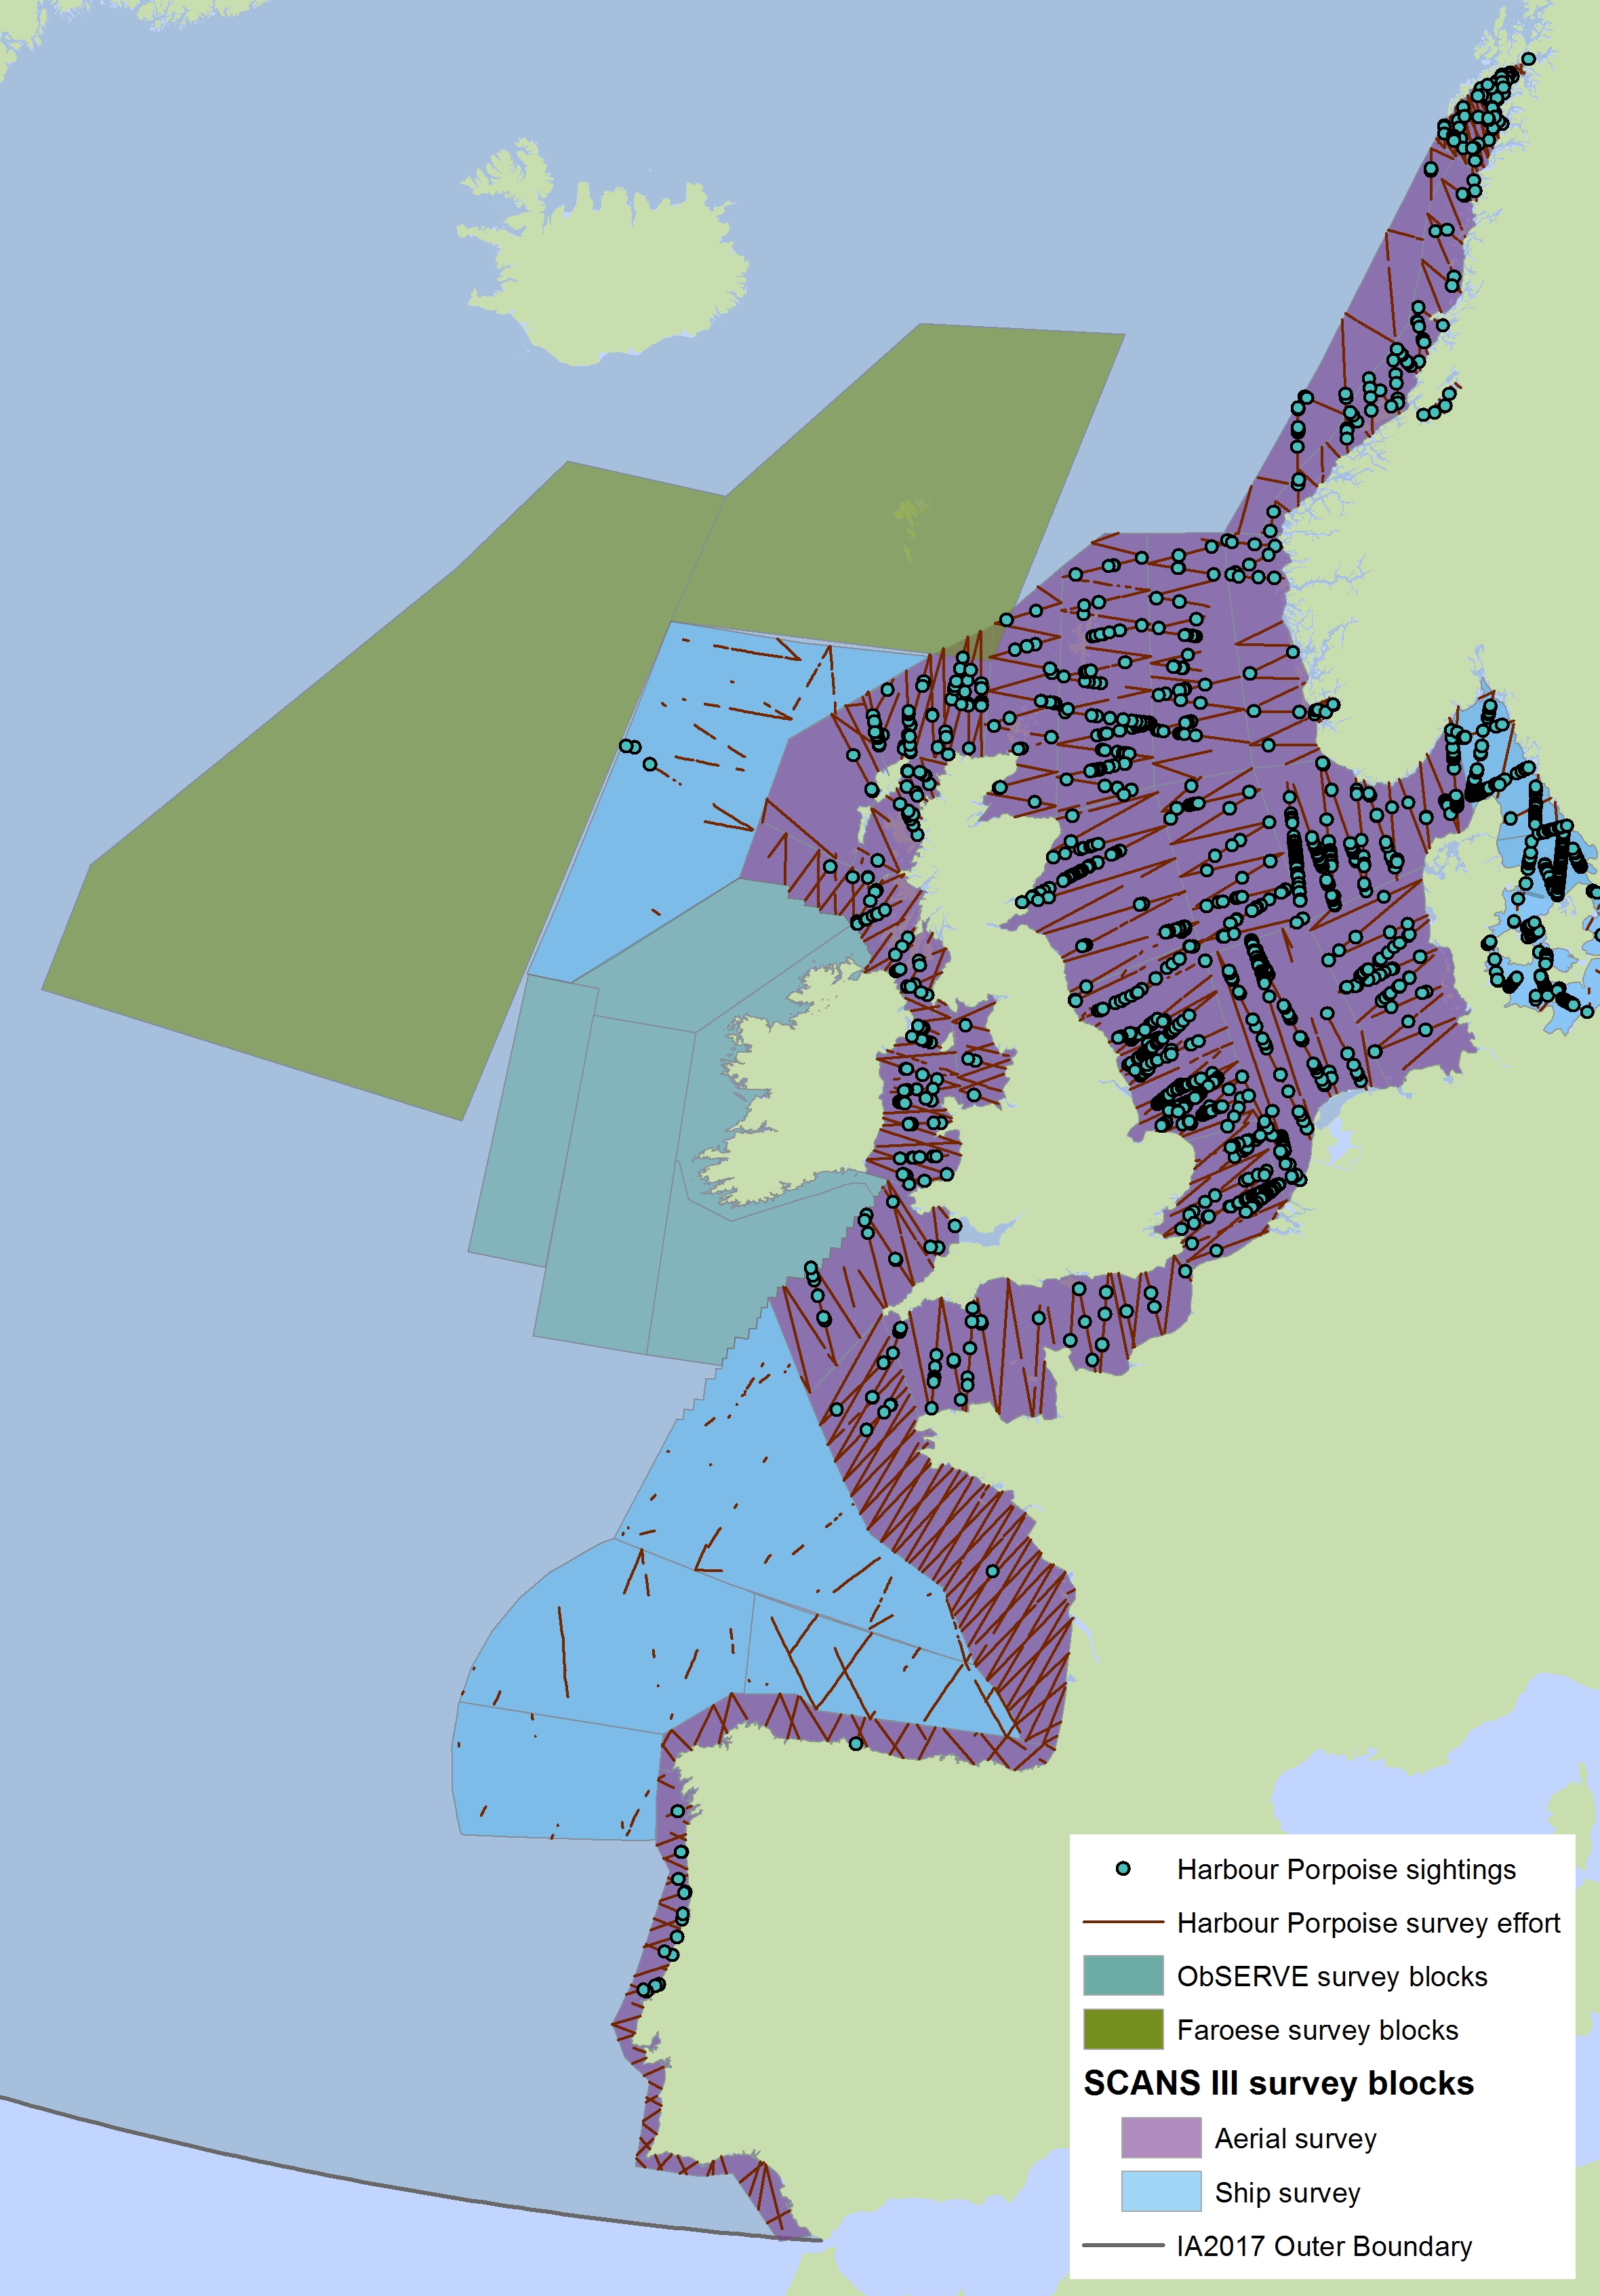
Figure b2. Sightings of harbour porpoise in 2016 from the SCANS-III survey (Hammond et al. 2017).
The area in green to the west of Ireland was surveyed in summer 2016 by the Irish ObSERVE project – no data are available from this area yet. The area in yellow was surveyed in summer 2015 by the NASS project.
Short-beaked common dolphin
Common dolphins (Delphinus delphis) in the North-East North Atlantic are distributed widely in Celtic Seas, the Bay of Biscay and Iberian Coast and the Wider Atlantic (Reid et al., 2003; Murphy et al., 2013). Sightings in the Greater North Sea are thought to be associated with the North Atlantic Oscillation and incursion of warmer water into the northern North Sea (Murphy et al., 2013). On the SCANS-II and SCANS-III surveys there were no sightings in Greater North Sea but there were many sightings throughout the southern part of the Celtic Seas and throughout the Bay of Biscay and Iberian Coast (Figure c1, c2(i), c2(ii)).
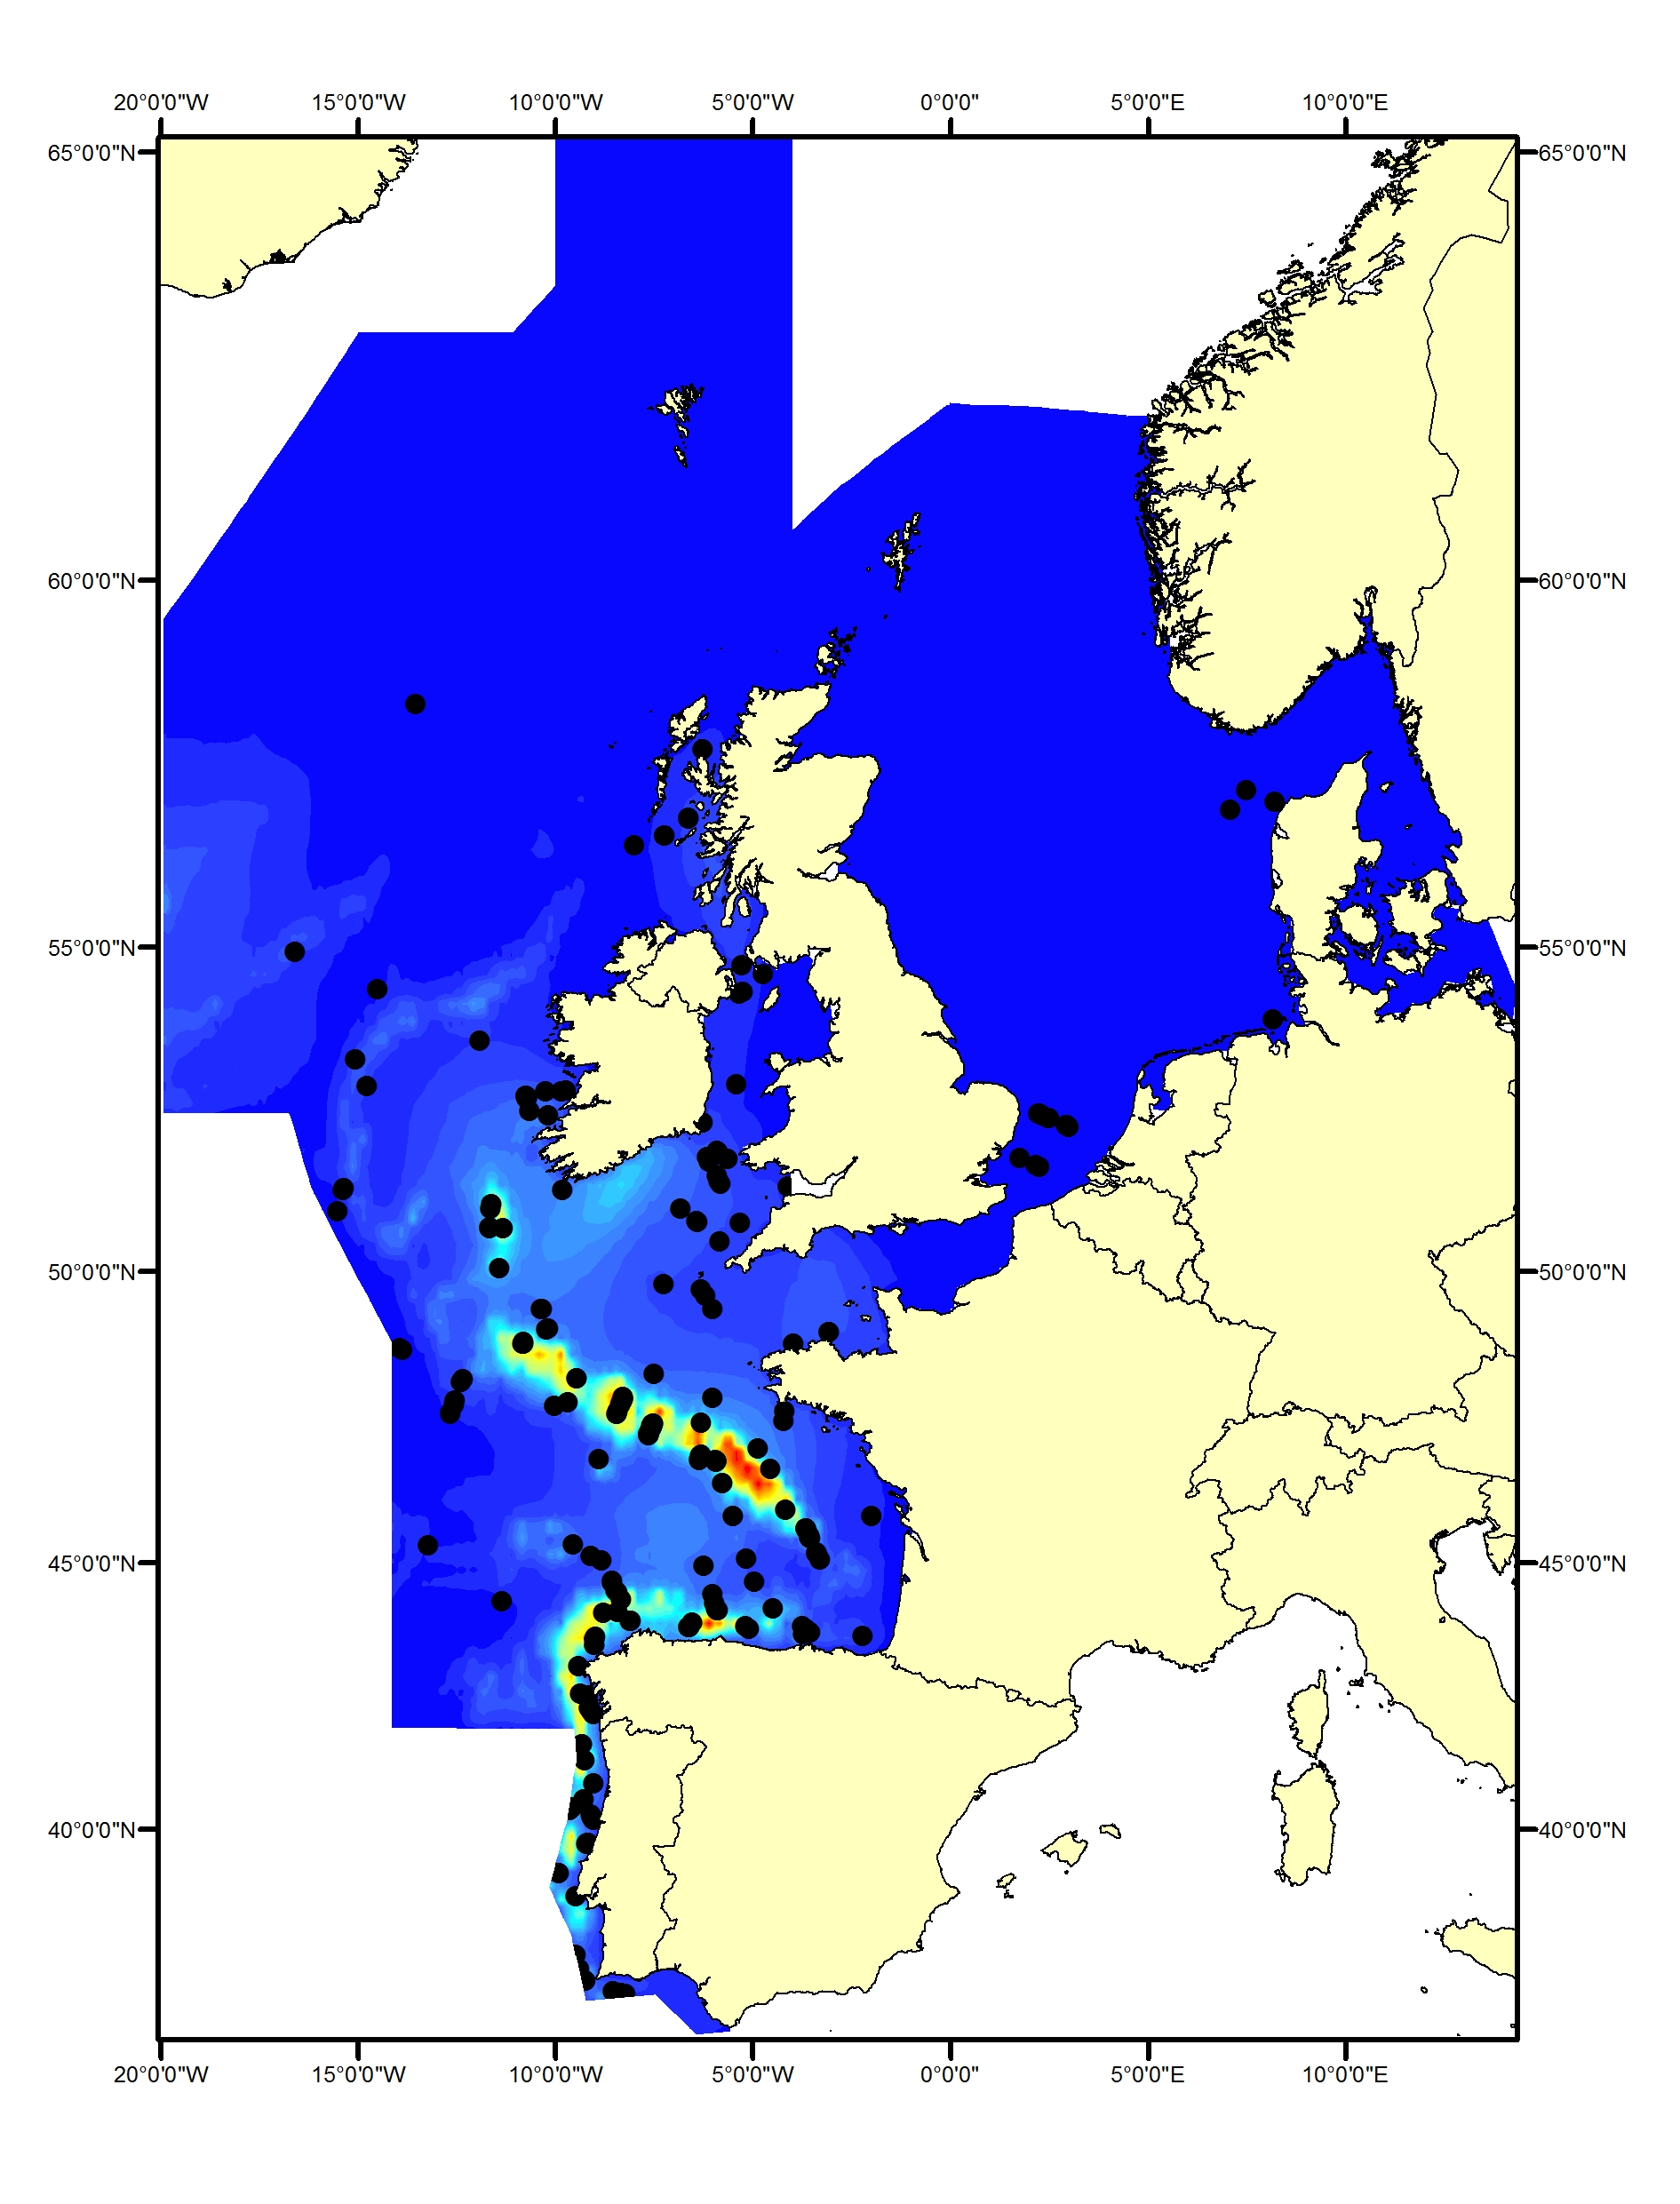
Figure c1: Predicted density surface for short-beaked common dolphin from CODA, SCANS-II and T-NASS data in summer 2005 and 2007.
Figure c2(ii): Sightings of short-beaked common dolphins in 2016 from the SCANS-III survey (Hammond et al., 2017)
Note for Figure c2(i) and c2(ii): The area in green to the west of Ireland was surveyed in summer 2016 by the Irish ObSERVE project, no data were available from this area when undertaking this assessment, however it could be included in any update of this assessment in future. The area in yellow was surveyed in summer 2015 by the NASS project.
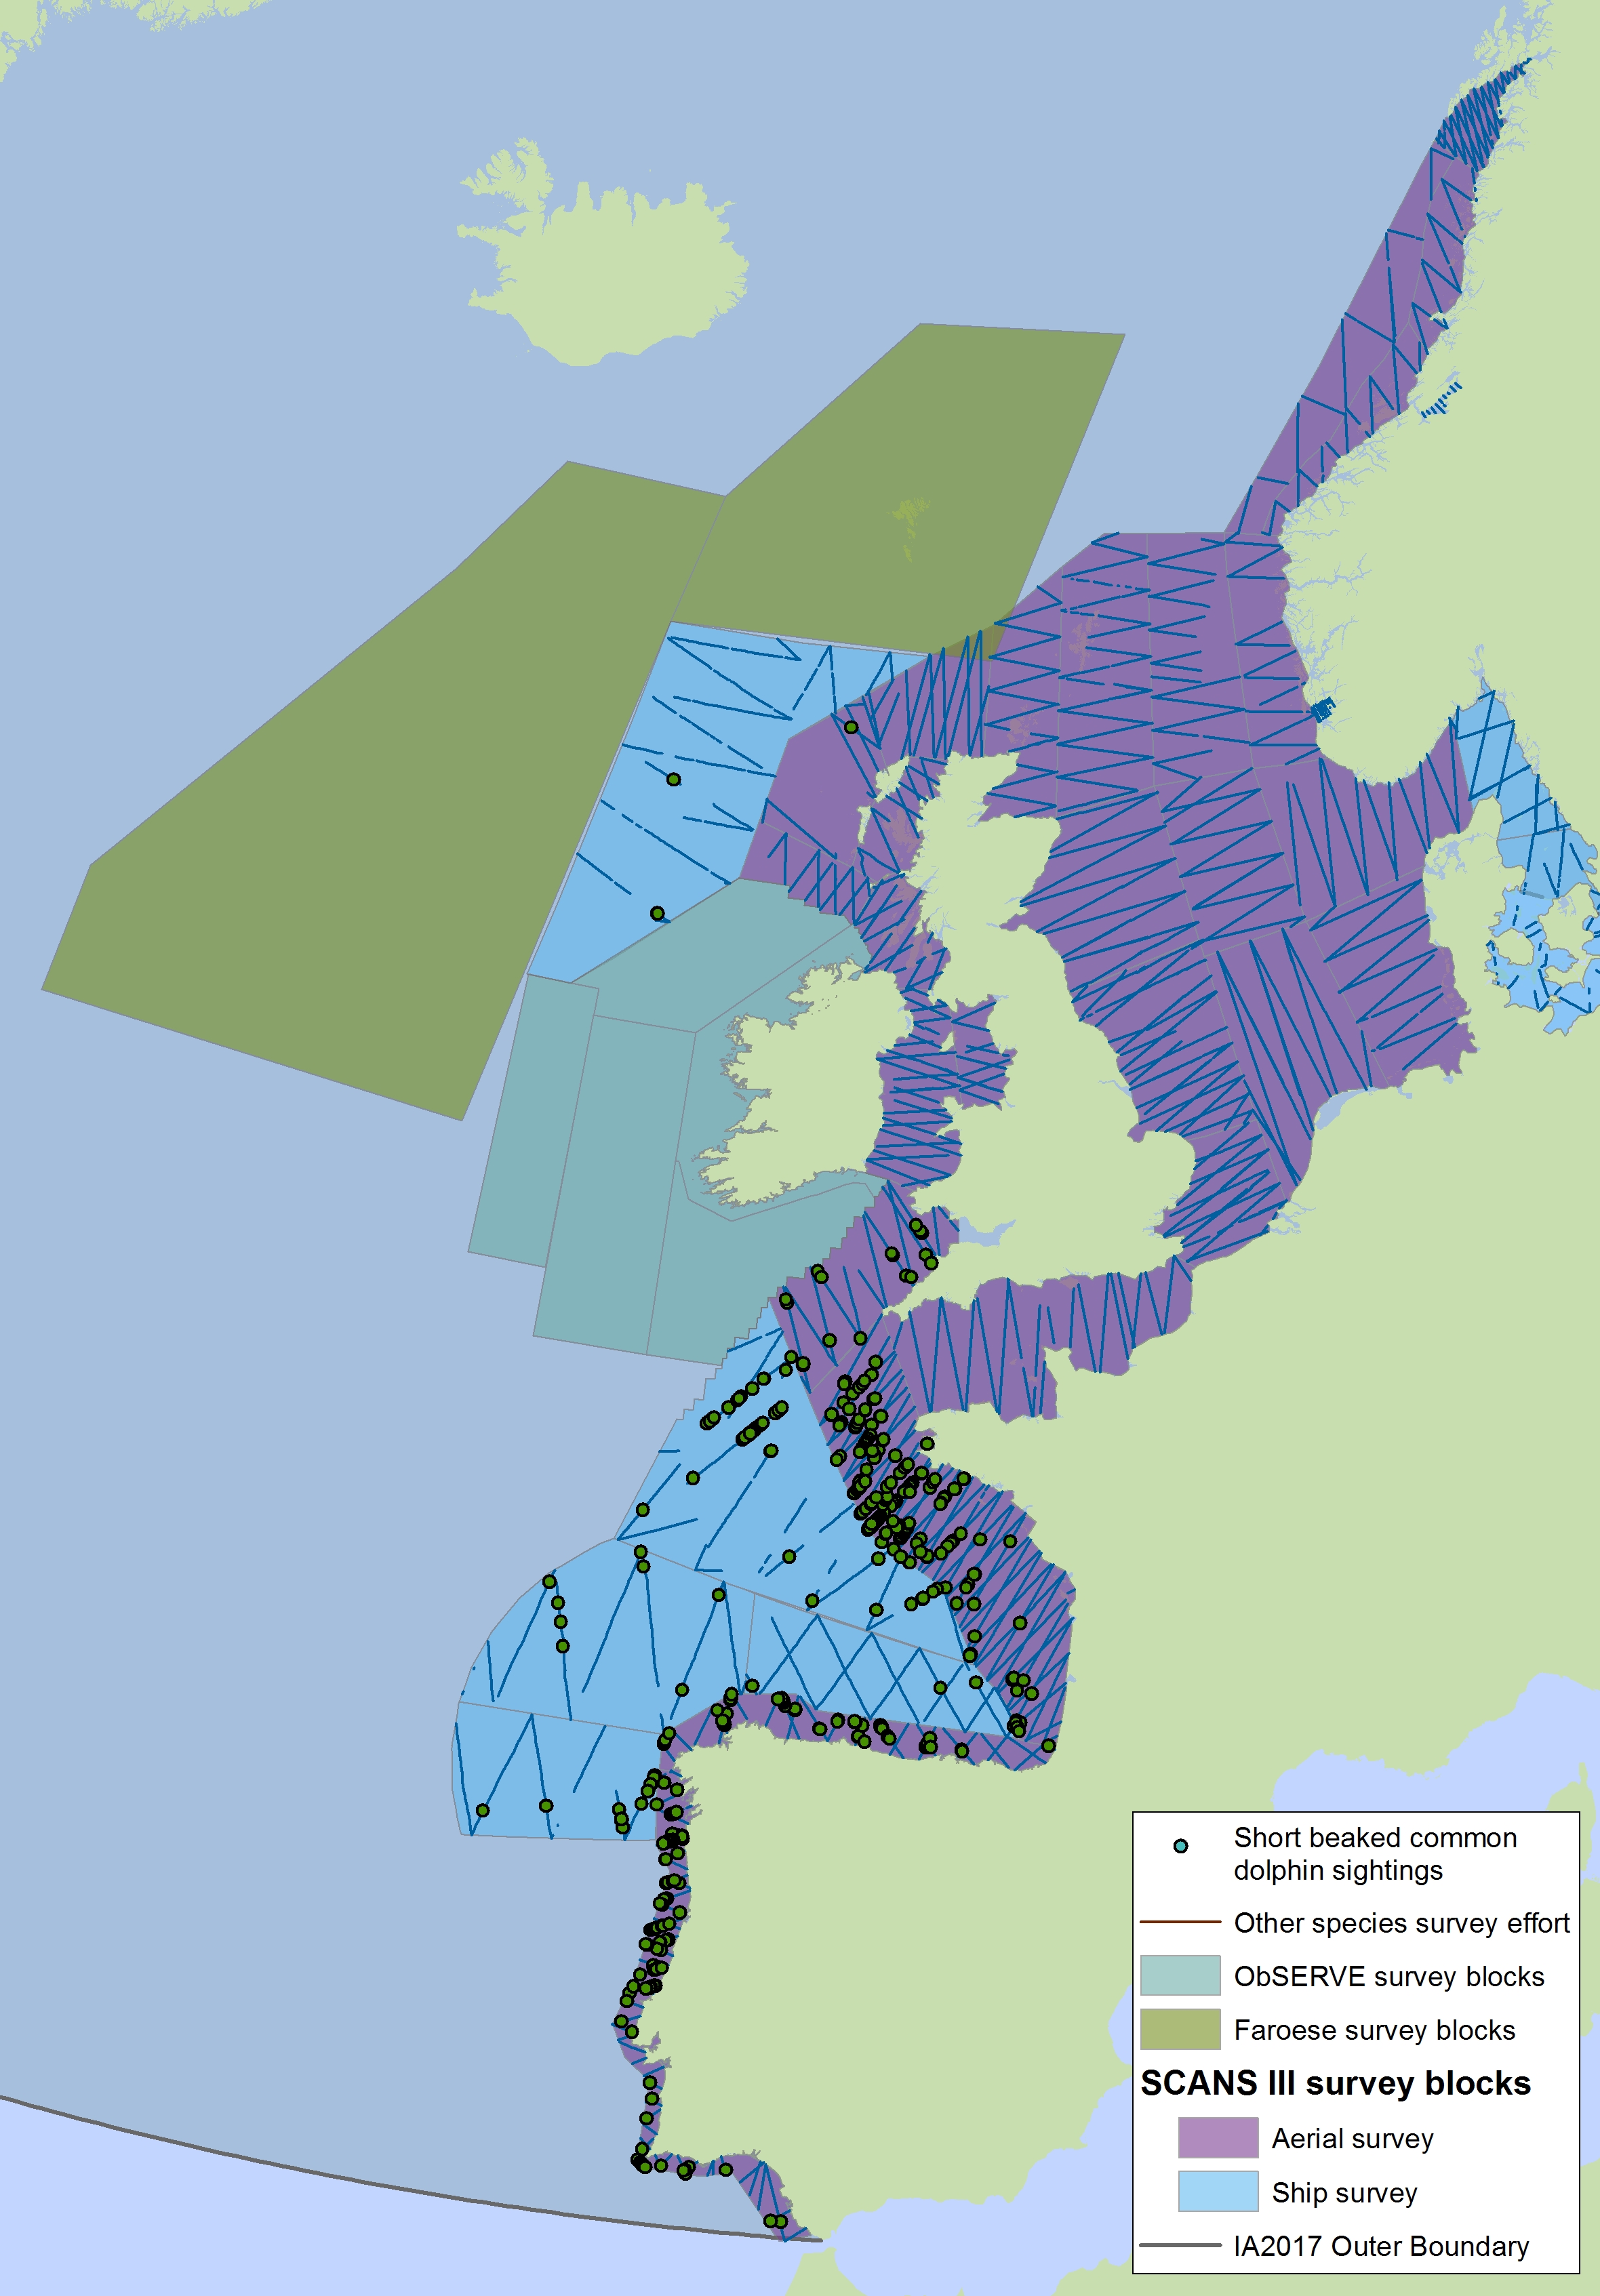
Figure c2(i): Sightings of short-beaked common dolphin in 2016 from the SCANS-III survey (Hammond et al. 2017).
White-beaked dolphin
White-beaked dolphins (Lagenorhynchus albirostris) have been shown to prefer water temperatures of 13◦C or less (Macleod et al.,2008) and depths of 50-100m (Reid et al., 2003). They are mainly found in the northern part of the Greater North Sea, and Celtic Seas and have only been recorded as vagrants in the Bay of Biscay and Iberian Coast (Figure d1, d2). From the pattern of sightings from the SCANS, SCANS-II and SCANS-III surveys, the distribution of white-beaked dolphins does not appear to have changed since 1994 (Hammond et al. 2002, 2013, 2017).
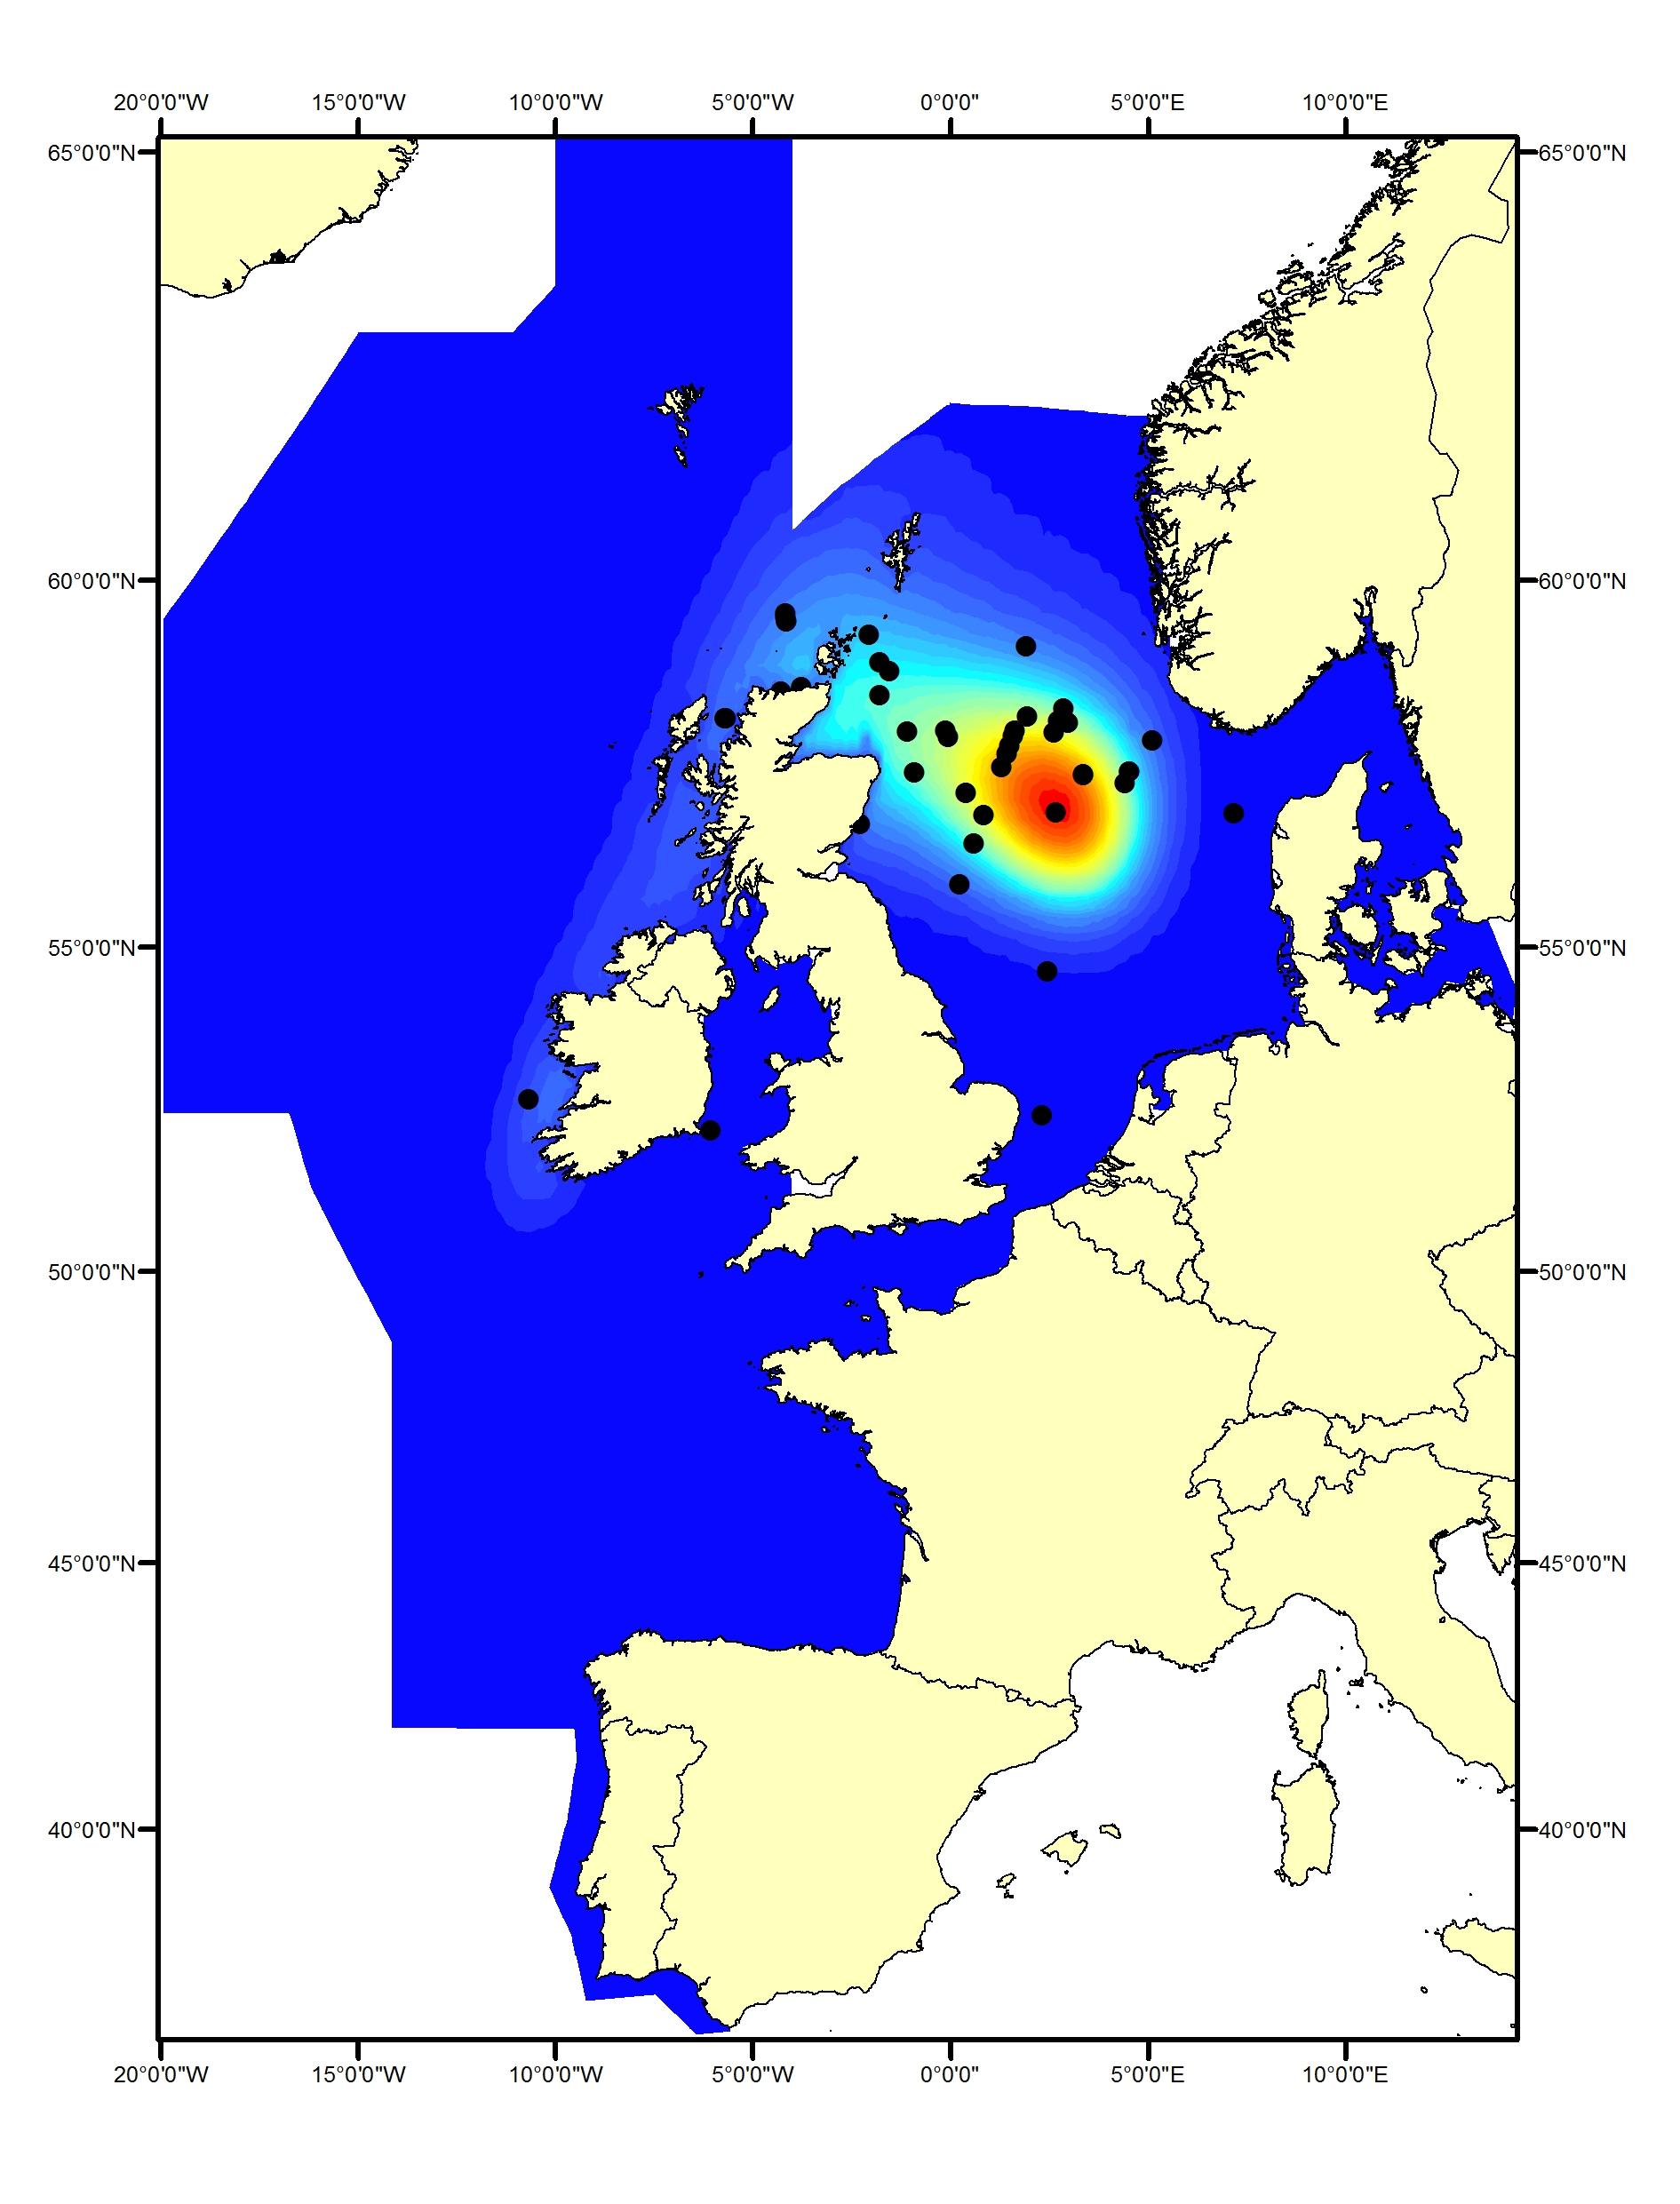
Figure d1: Predicted density surface for white-beaked dolphin from CODA, SCANS-II and T-NASS data in summer 2005 and 2007
Figure d2: Sightings of white-beaked dolphins in 2016 from the SCANS-III survey (Hammond et al. 2017).
The area in green to the west of Ireland was surveyed in summer 2016 by the Irish ObSERVE project, no data were available from this area when undertaking this assessment, however it could be included in any update of this assessment in future. The area in yellow was surveyed in summer 2015 by the NASS project.
Offshore Bottlenose dolphin
Bottlenose dolphins (Tursiops truncatus) are widely distributed in offshore waters of the North-East Atlantic (Reid et al., 2003; SCANS-II, CODA and SCANS-III surveys; Figure e1, e2). In comparison to the coastal populations, little is known about the animals in these offshore waters.
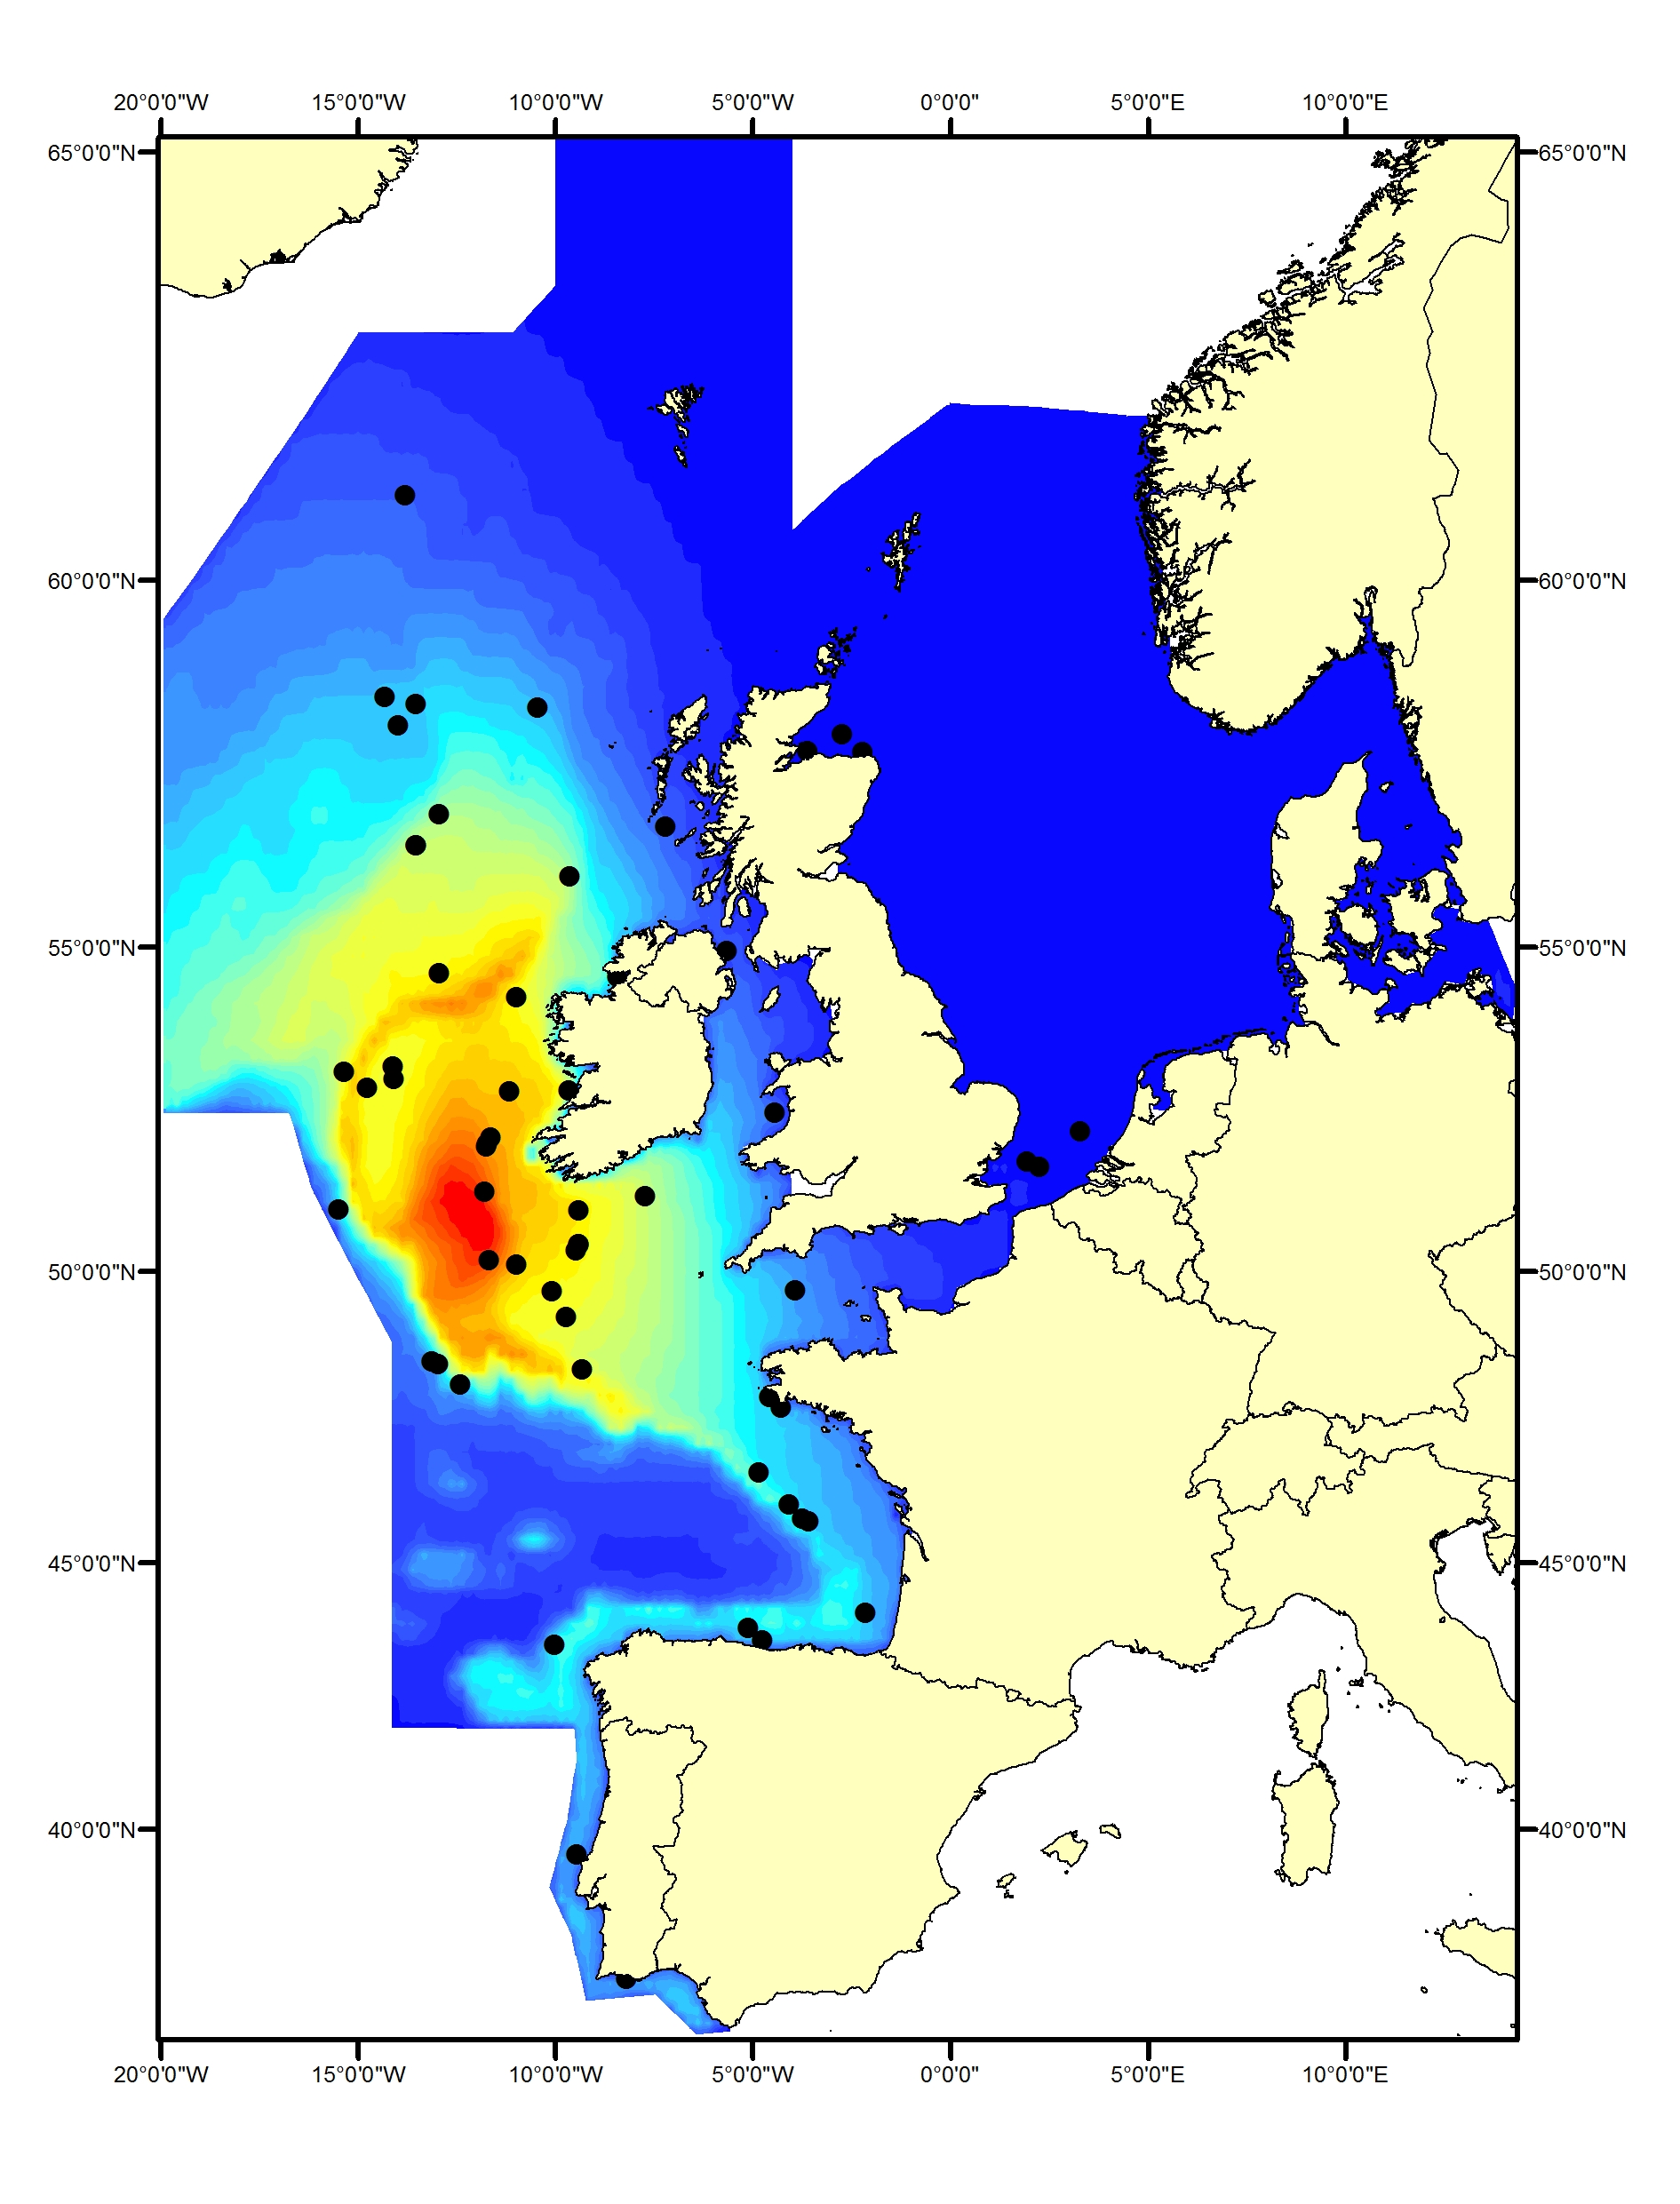
Figure e1: Predicted density surface for bottlenose dolphin from CODA, SCANS-II and T-NASS data.

Figure e2: Sightings of bottlenose dolphins in 2016 from the SCANS-III survey (Hammond et al. 2017)
The area in green to the west of Ireland was surveyed in summer 2016 by the Irish ObSERVE project, no data were available from this area when undertaking this assessment, however it could be included in any update of this assessment in future. The area in yellow was surveyed in summer 2015 by the NASS project.
Striped dolphin
Striped dolphins (Stenella coeruleoalba) have been found to prefer specific water temperatures (such as 21-24°C within the Mediterranean Sea; Panigada et al., 2008). Within the OSPAR Maritime Area, they are generally found only within the southern part of the Celtic Seas and in the Bay of Biscay and Iberian Coast, primarily in waters off the shelf (CODA, 2009; SCANS-III) (Figure f1, f2).
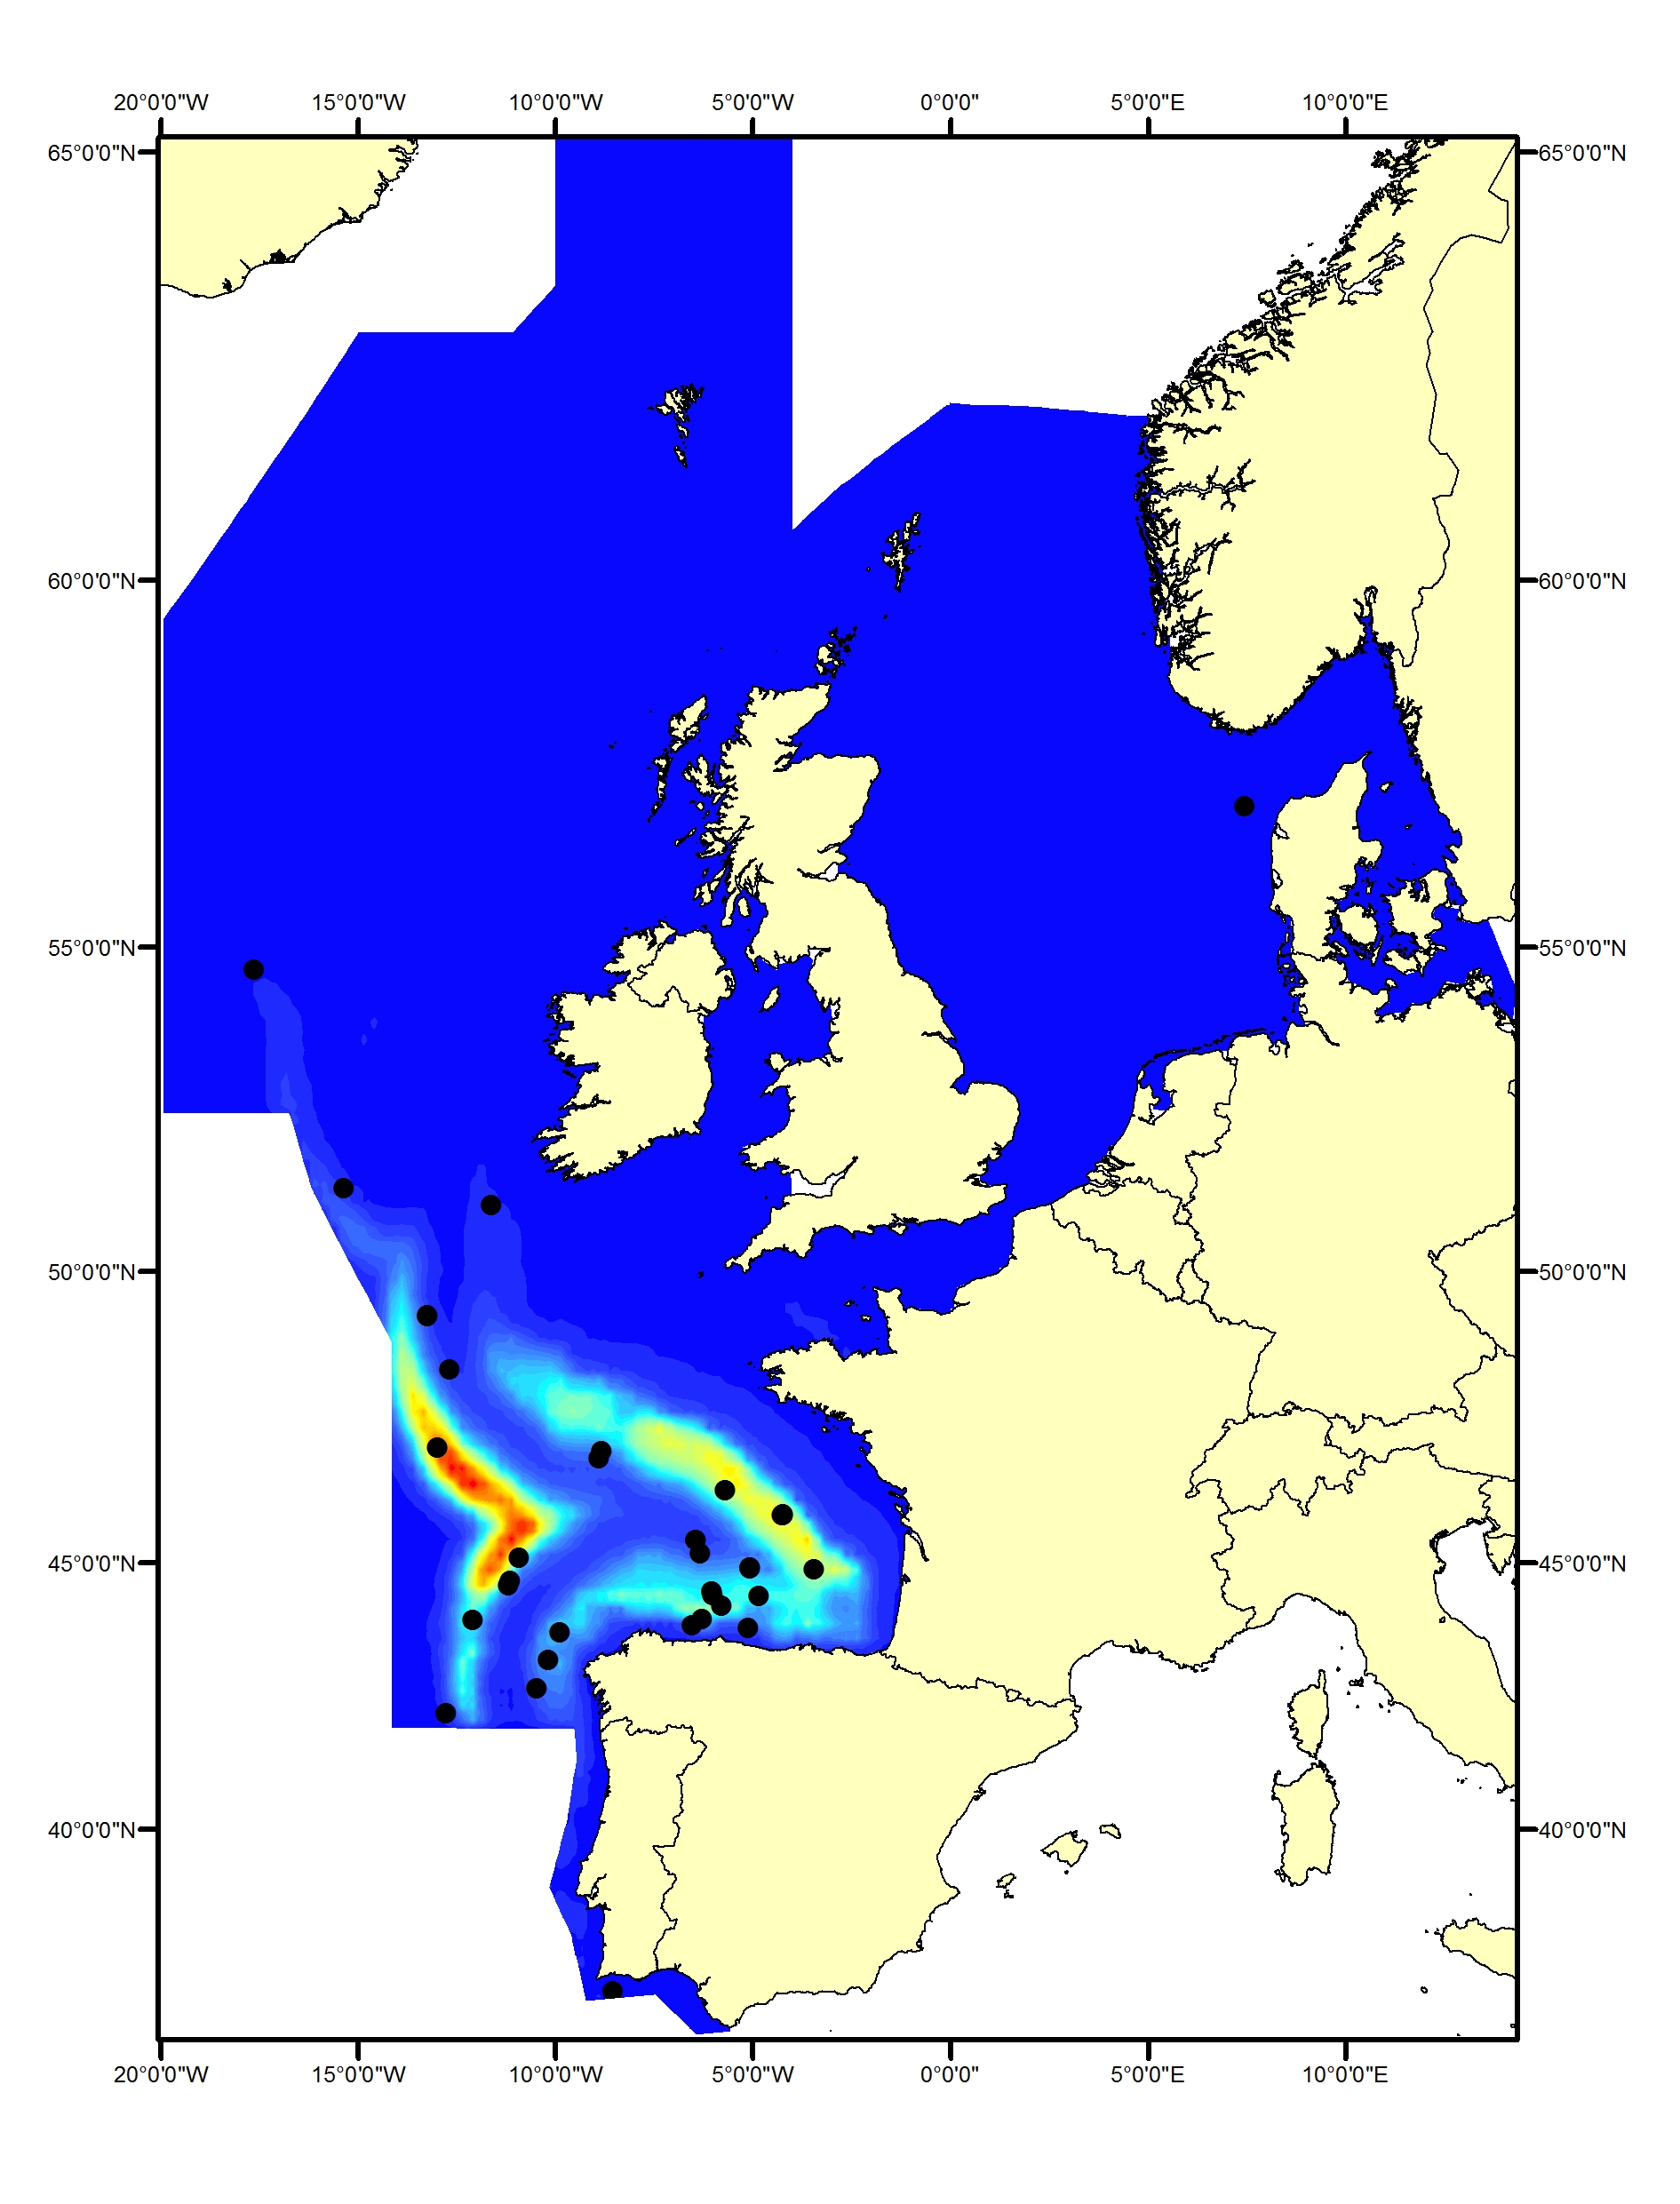
Figure f1: Predicted density surface for striped dolphin from CODA, SCANS-II and T-NASS data in summer 2005 and 2007.
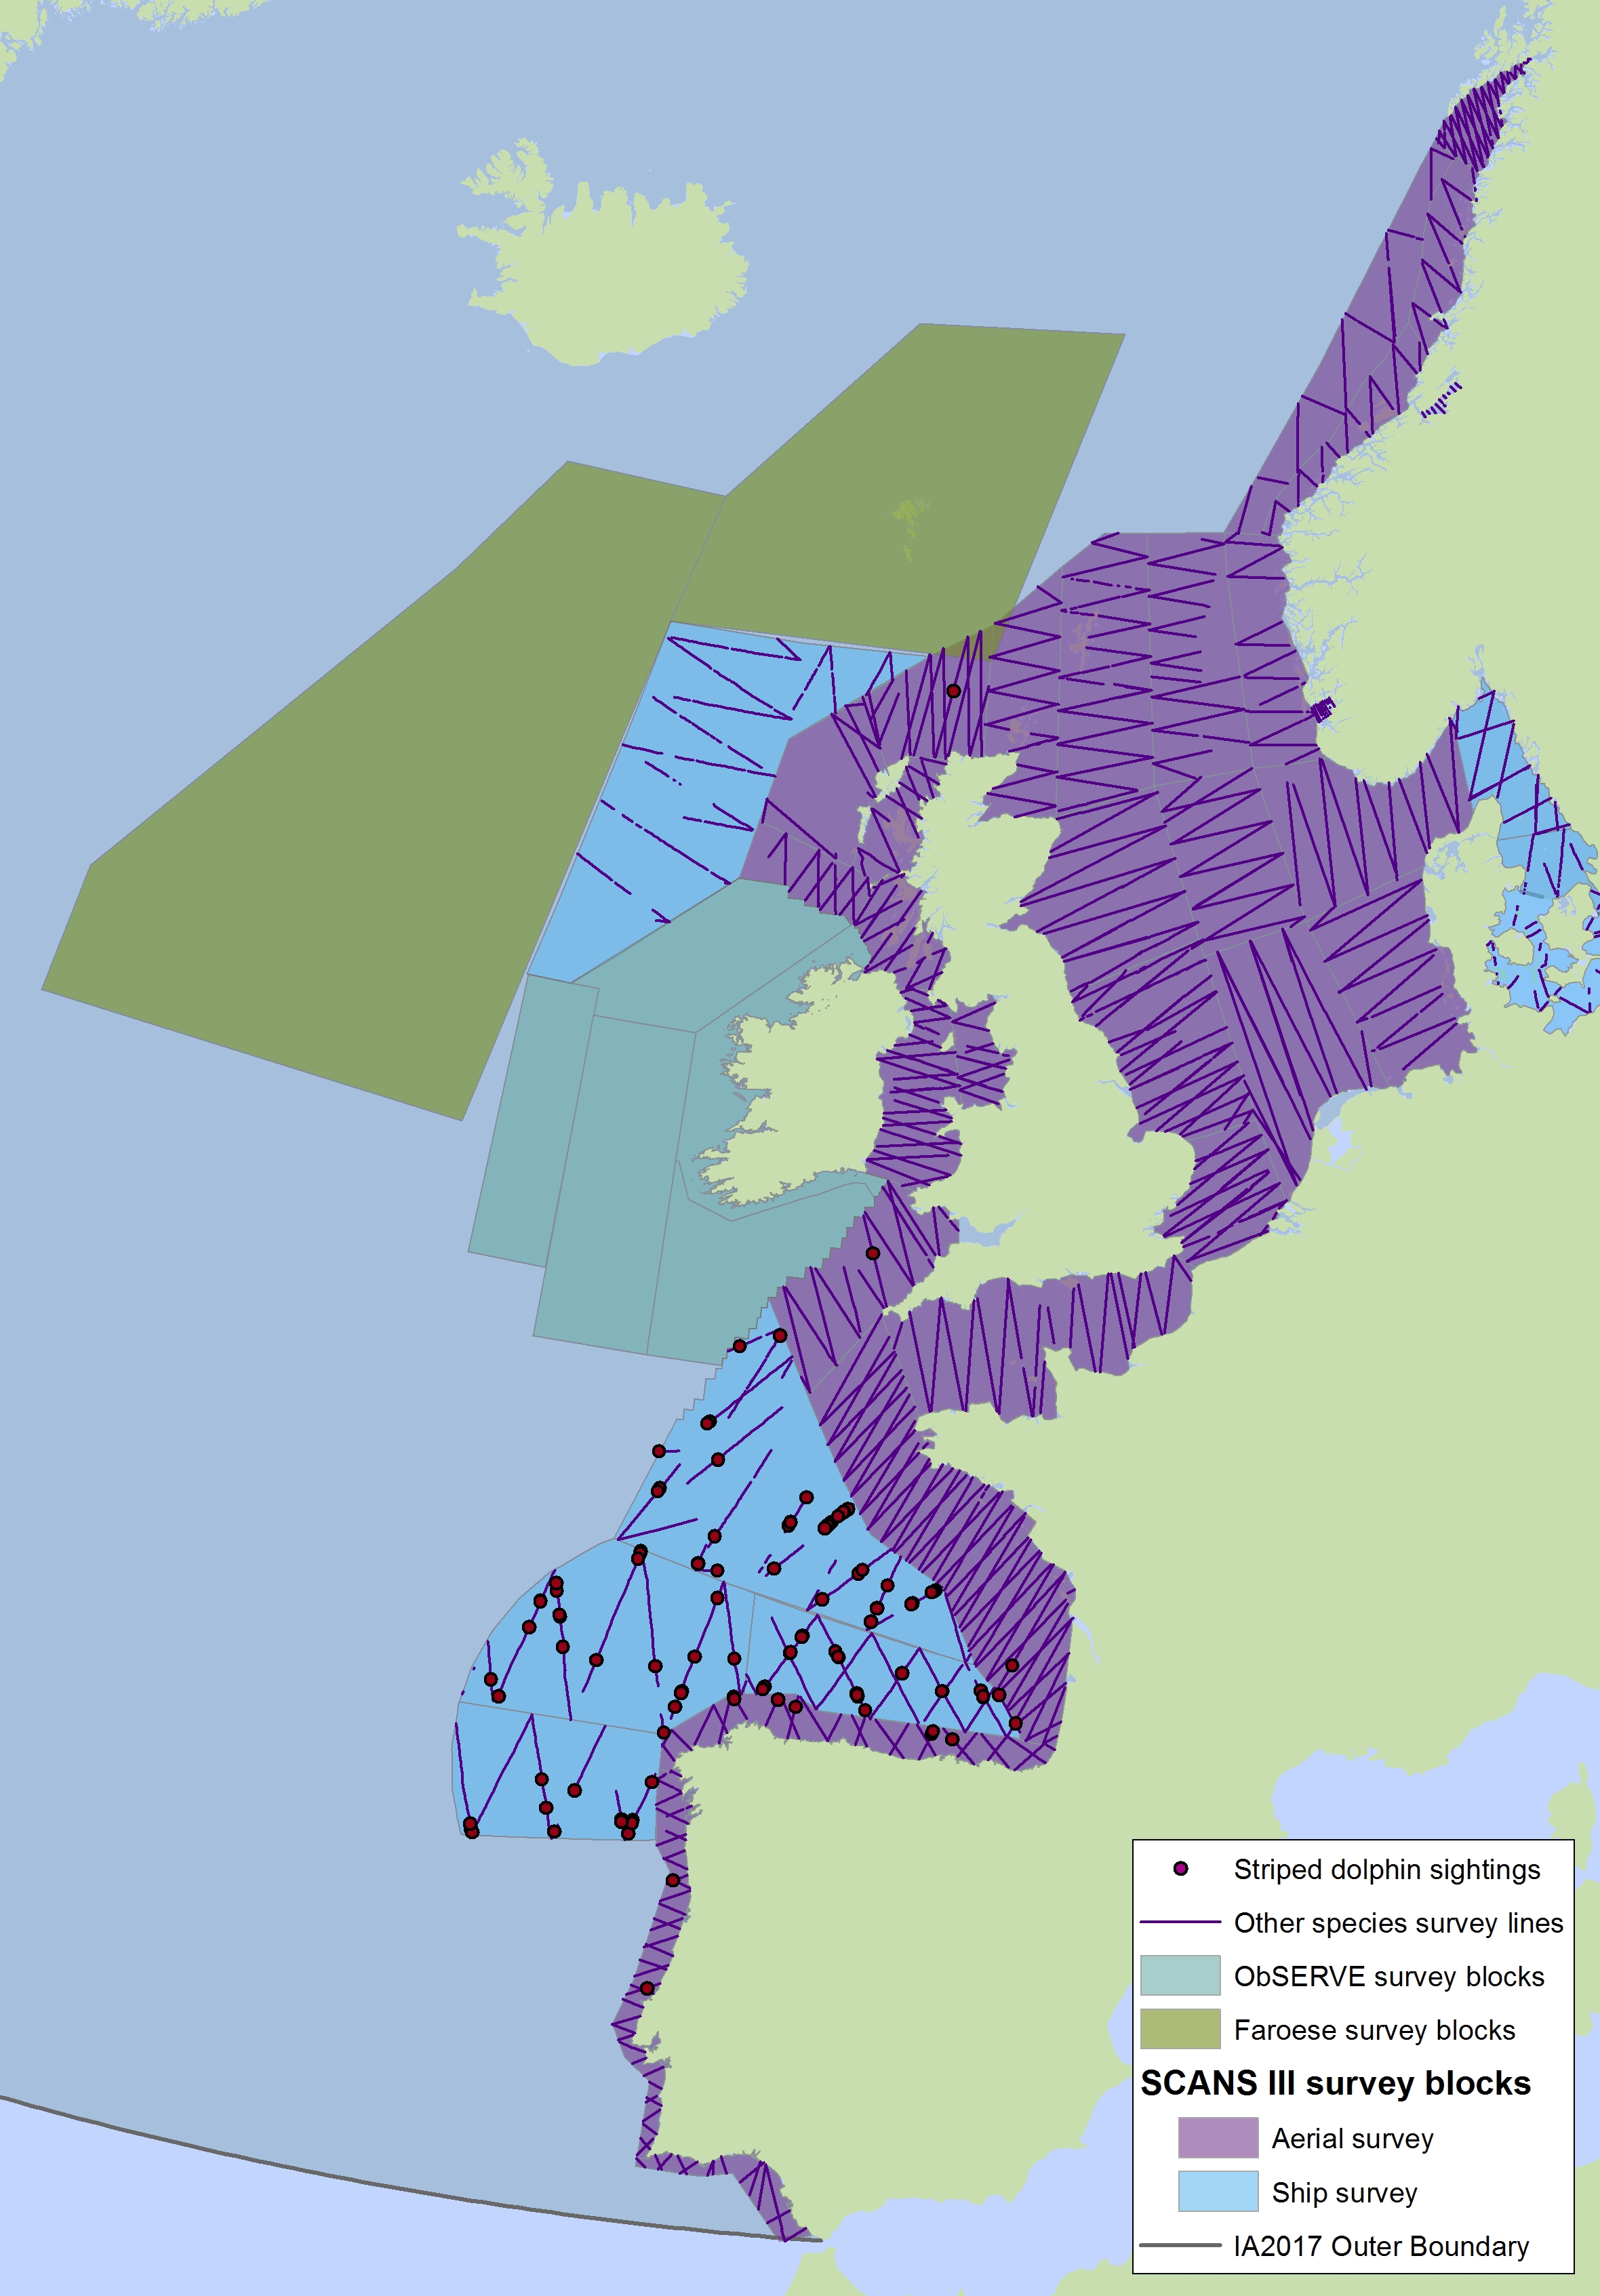
Figure f2: Sightings of striped dolphins in 2016 from the SCANS-III survey (Hammond et al. 2017).
Note also the sightings of unidentified common or striped dolphins in Figure c2(i). The area in green to the west of Ireland was surveyed in summer 2016 by the Irish ObSERVE project, no data were available from this area when undertaking this assessment, however it could be included in any update of this assessment in future. The area in yellow was surveyed in summer 2015 by the NASS project.
Minke whale
Minke whales (Balaenoptera acutorostrata) occur both on and off the shelf of the North-East Atlantic. The southern / central North Sea and Celtic Seas represent the southernmost limit of their summer range for this region (Reid et al., 2003; Evans et al., 2003). There is some evidence that minke whale distribution shifted south between 1994 and 2005 (Hammond et al., 2013); the pattern of sightings from SCANS-III shows that this has been maintained (Hammond et al., 2017). Minke whales have rarely been recorded in the Bay of Biscay and Iberian Coast (Figure g1, g2).
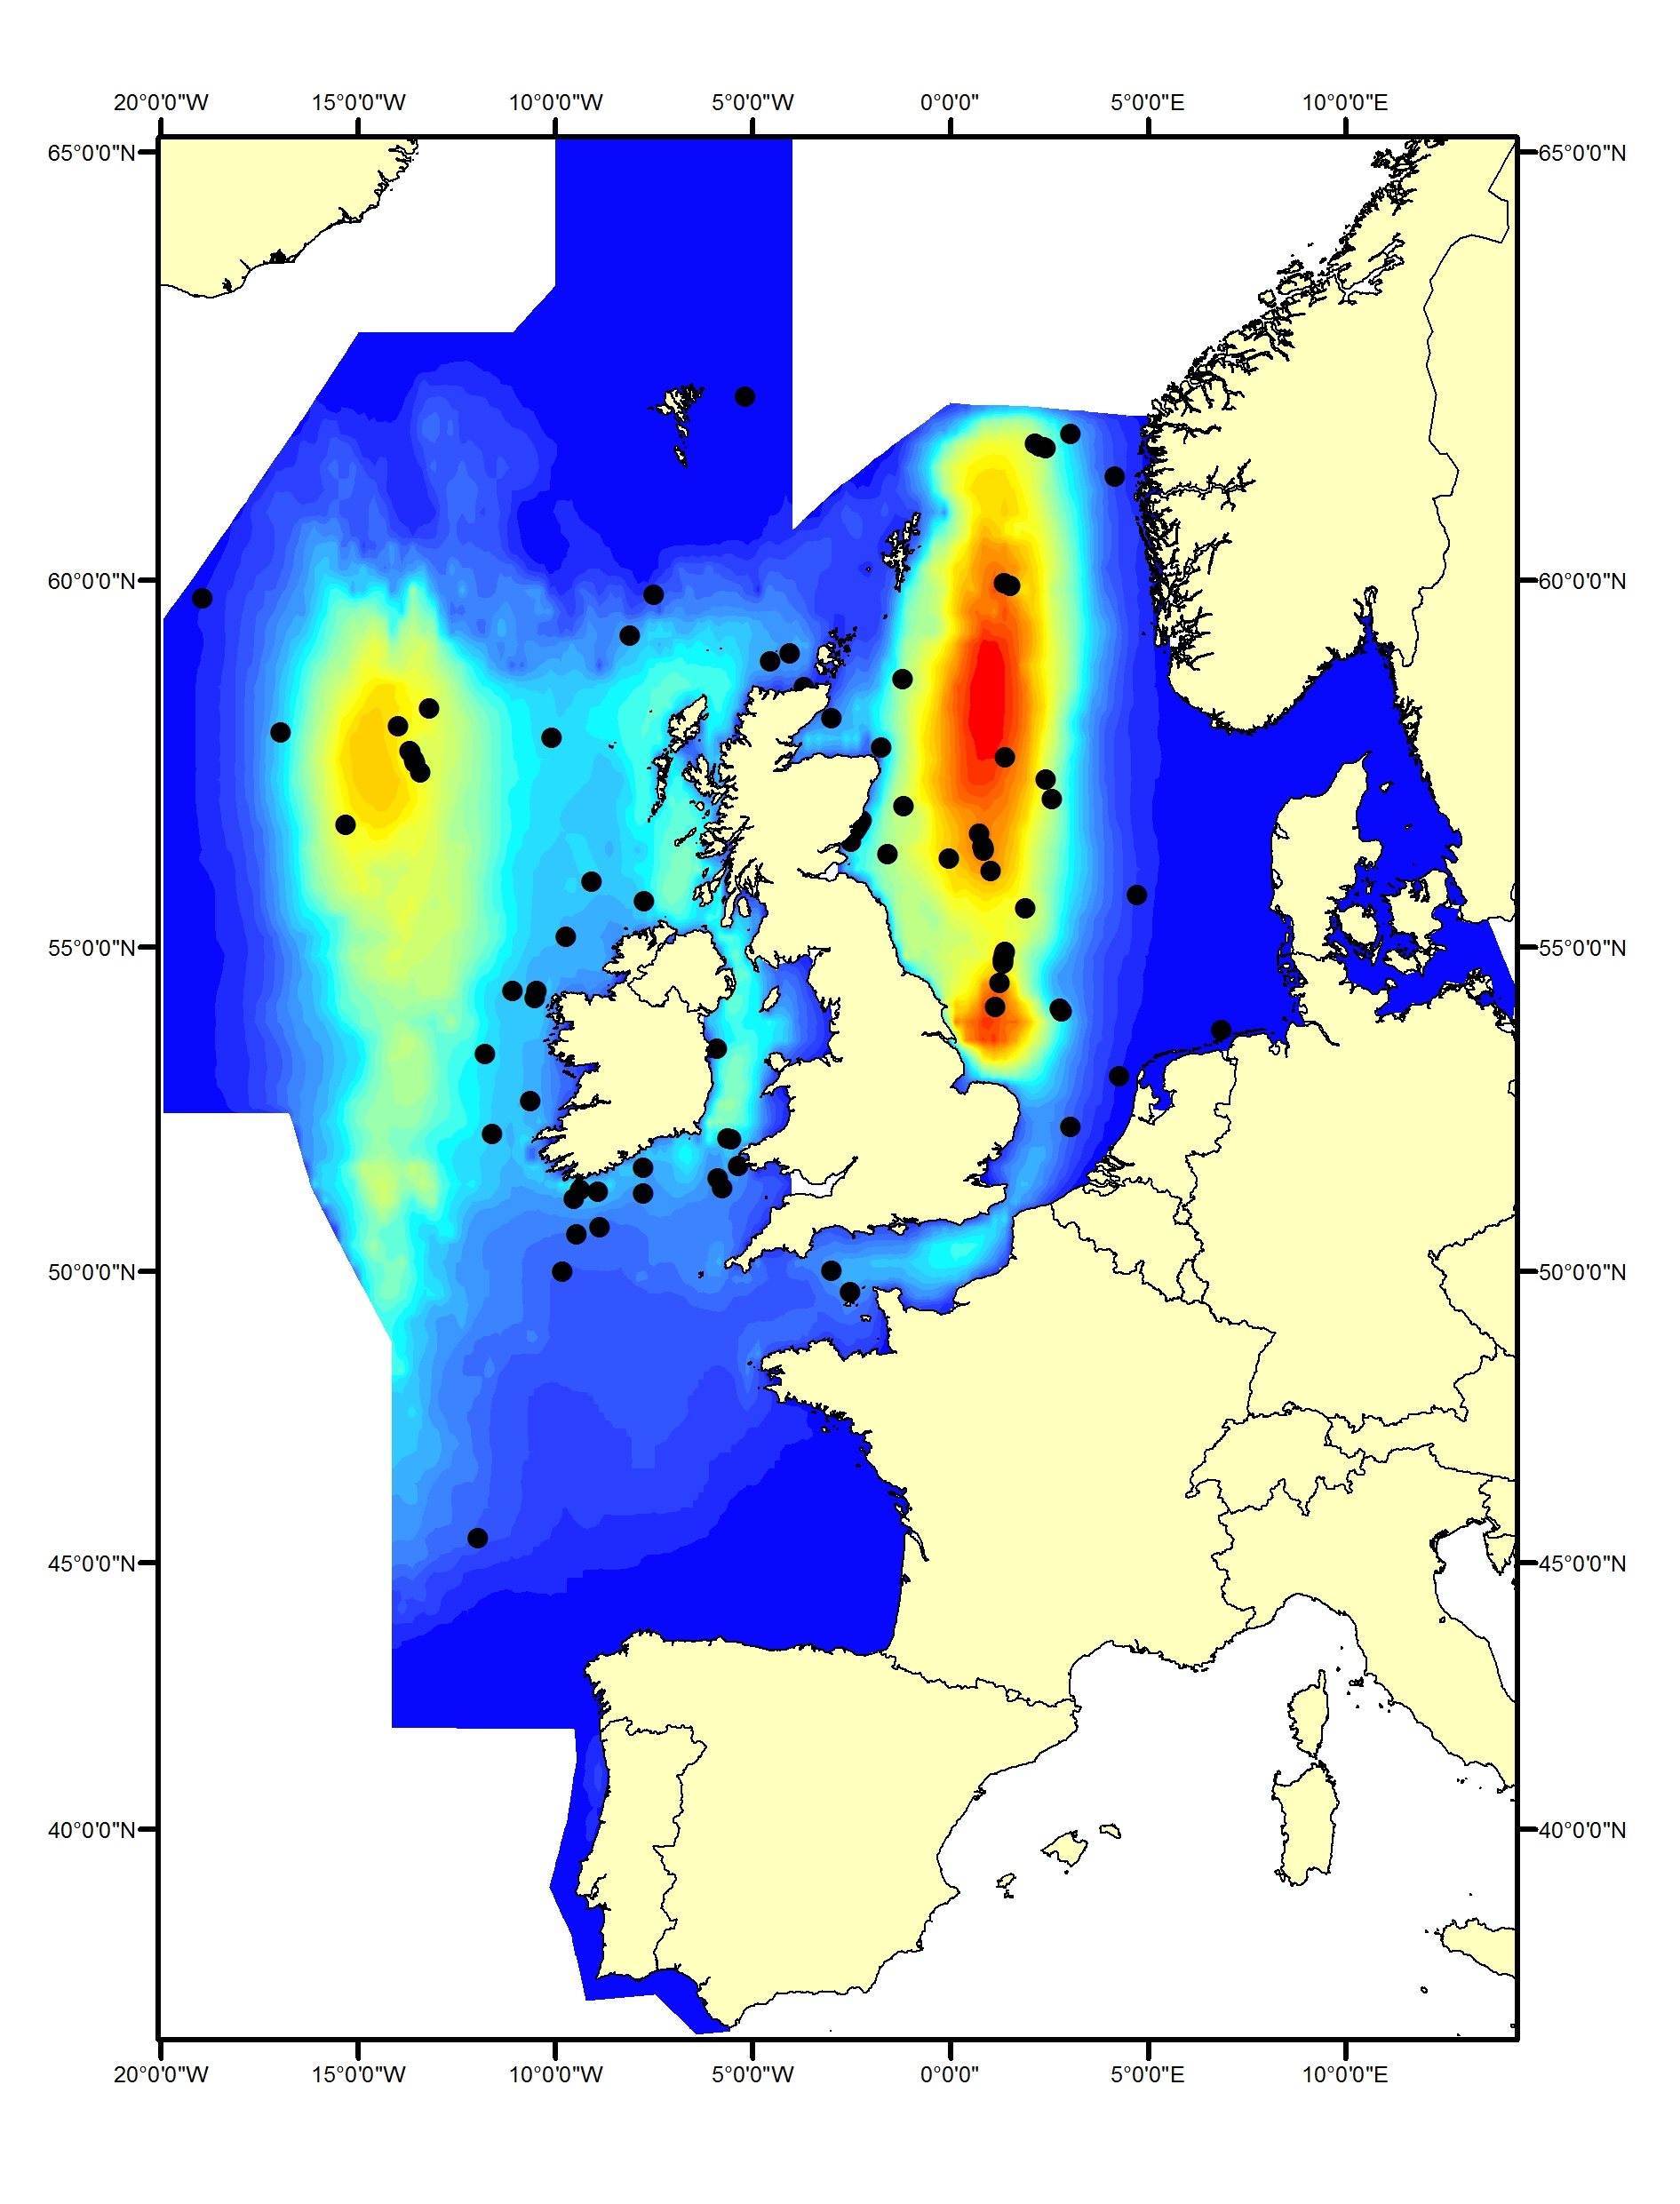
Figure g1: Predicted density surface for minke whale from CODA, SCANS-II and T-NASS data in summer 2005 and 2007

Figure g2: Sightings of minke whales in 2016 from the SCANS-III survey (Hammond et al. 2017).
The area in green to the west of Ireland was surveyed in summer 2016 by the Irish ObSERVE project. No data were available from this area when undertaking this assessment, however it could be included in any update of this assessment in future. The area in yellow was surveyed in summer 2015 by the NASS project.
Fin whale
Fin whales (Balaenoptera physalus) primarily inhabit deeper waters (200–400 m) beyond the continental shelf edge (Reid et al., 2003). They are rarely seen in the Greater North Sea but are commonly found in the Celtic Seas and Bay of Biscay and Iberian Coast (Figure h1, h2). Data spanning the past 30 years do not indicate any changes in distribution (Hammond et al., 2011, 2017).
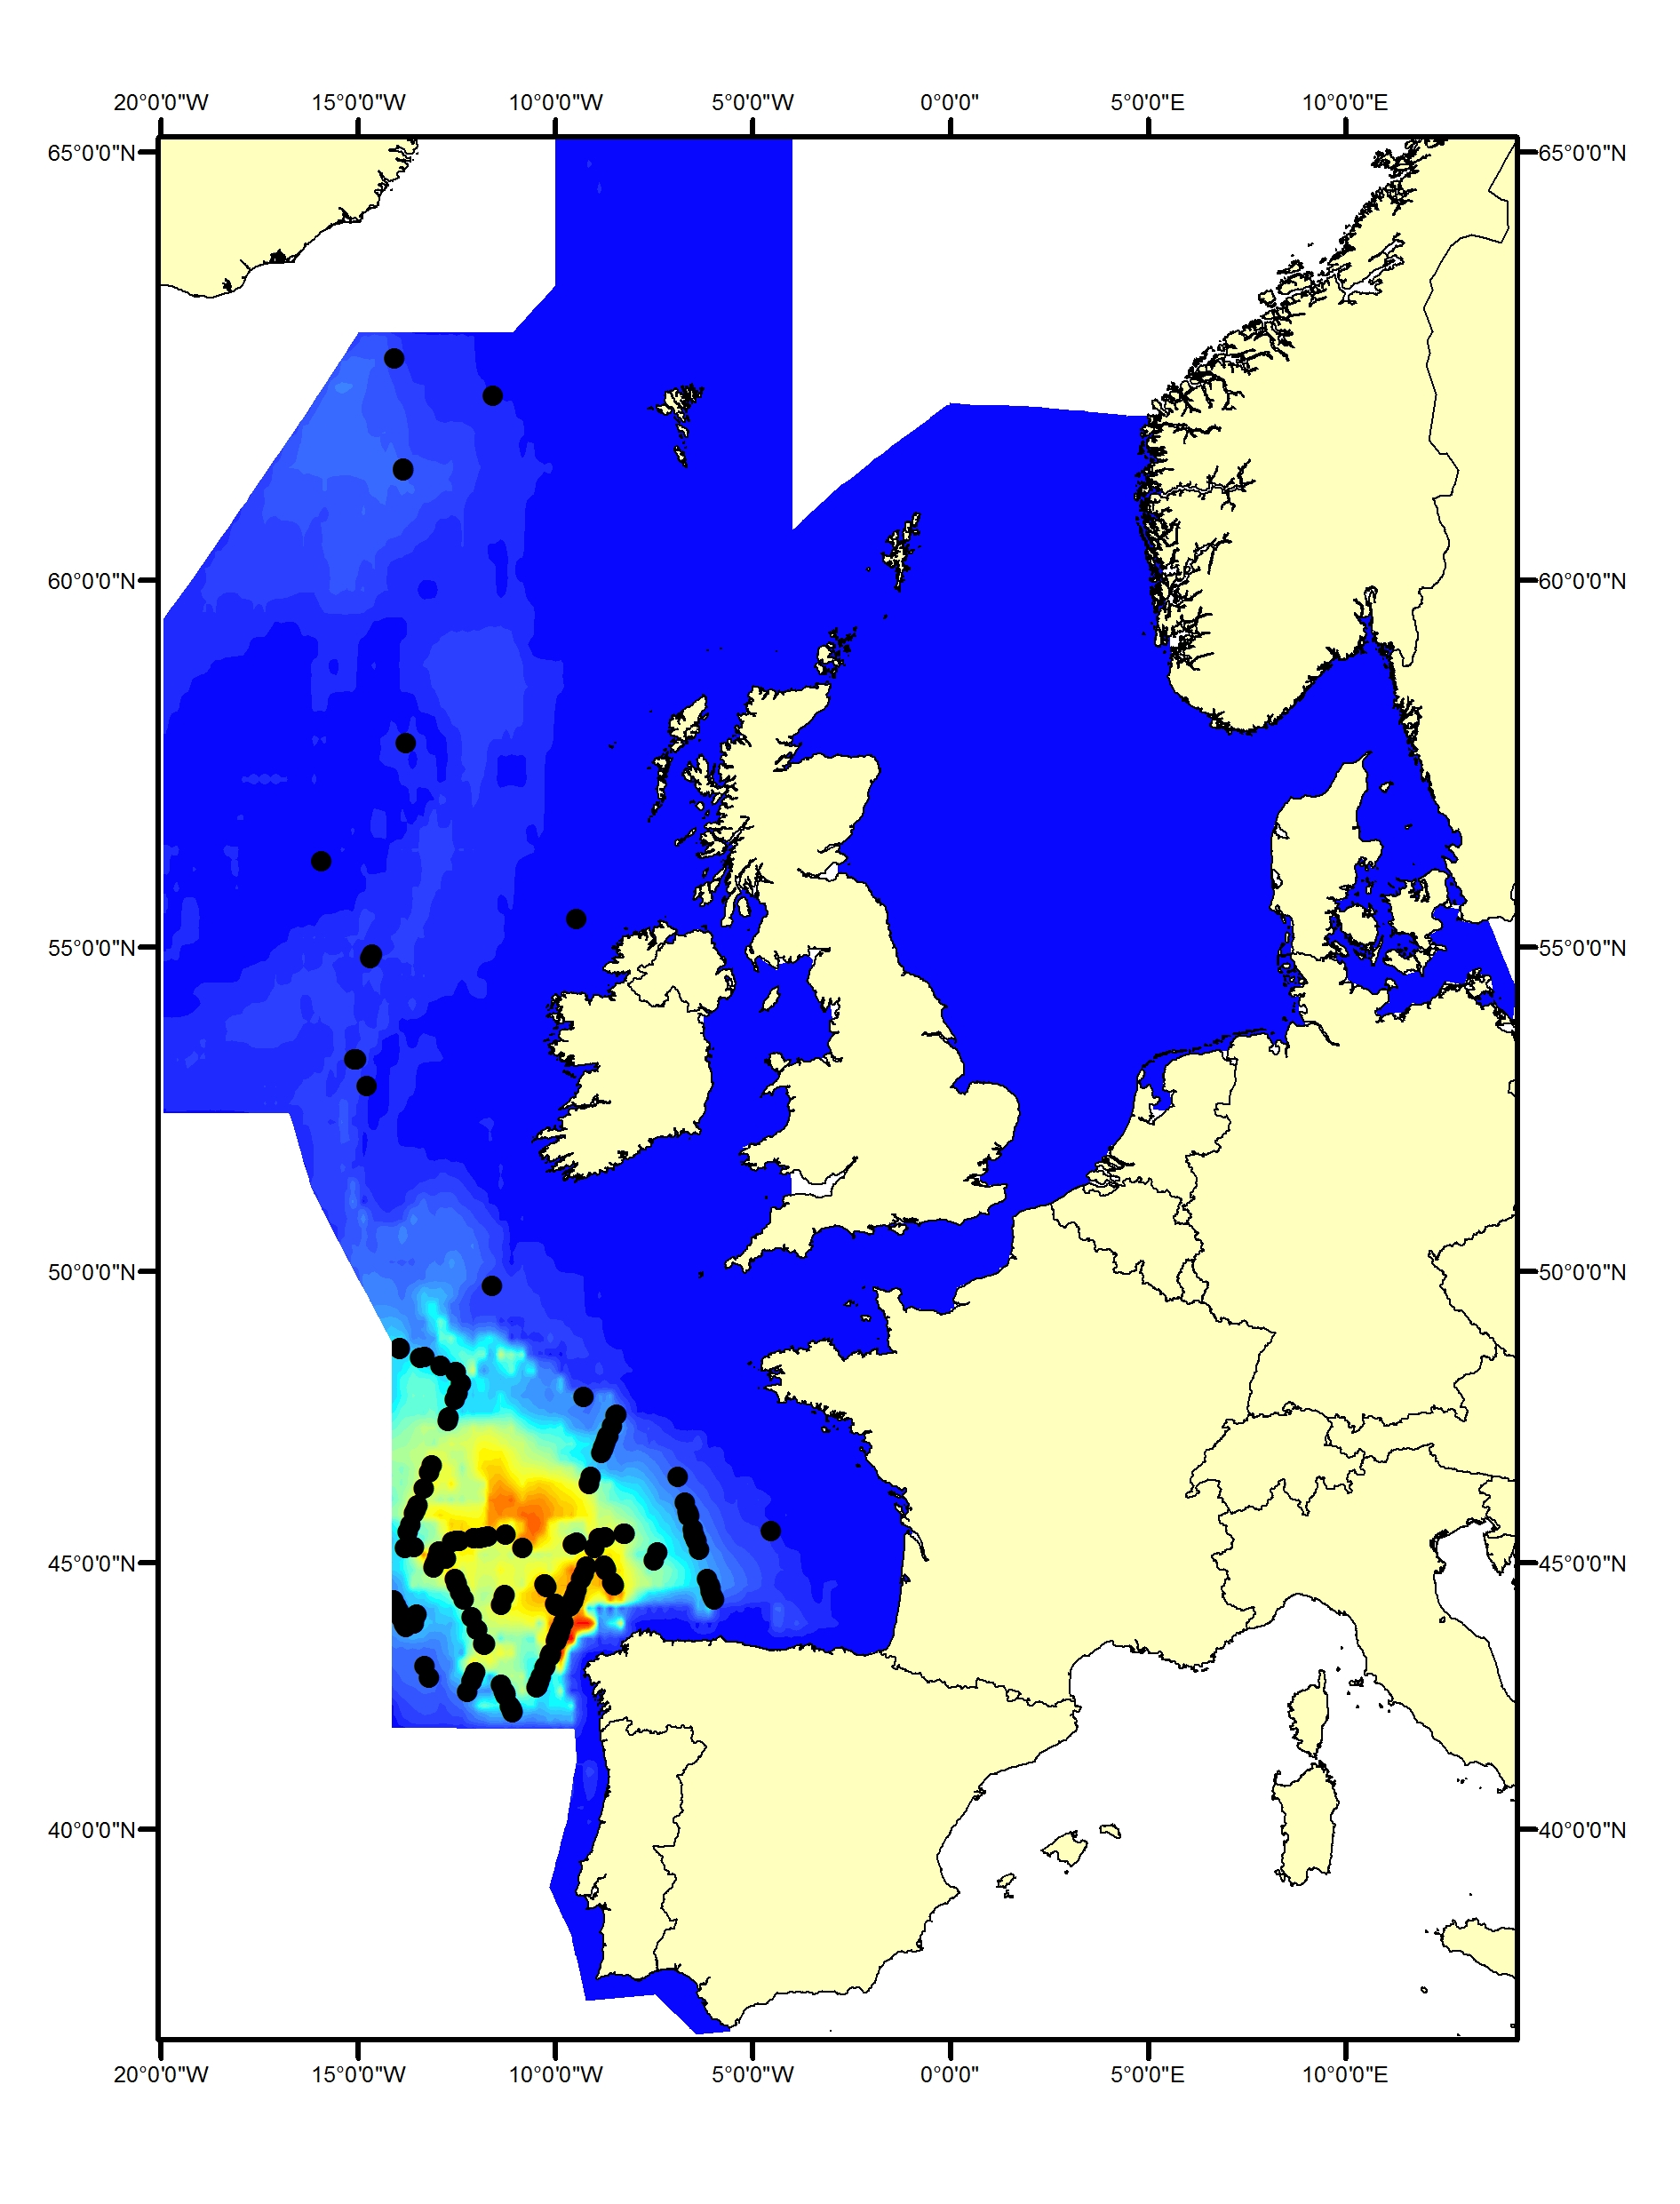
Figure h1: Predicted density surface for fin whale from CODA, SCANS-II and T-NASS data in summer 2005 and 2007
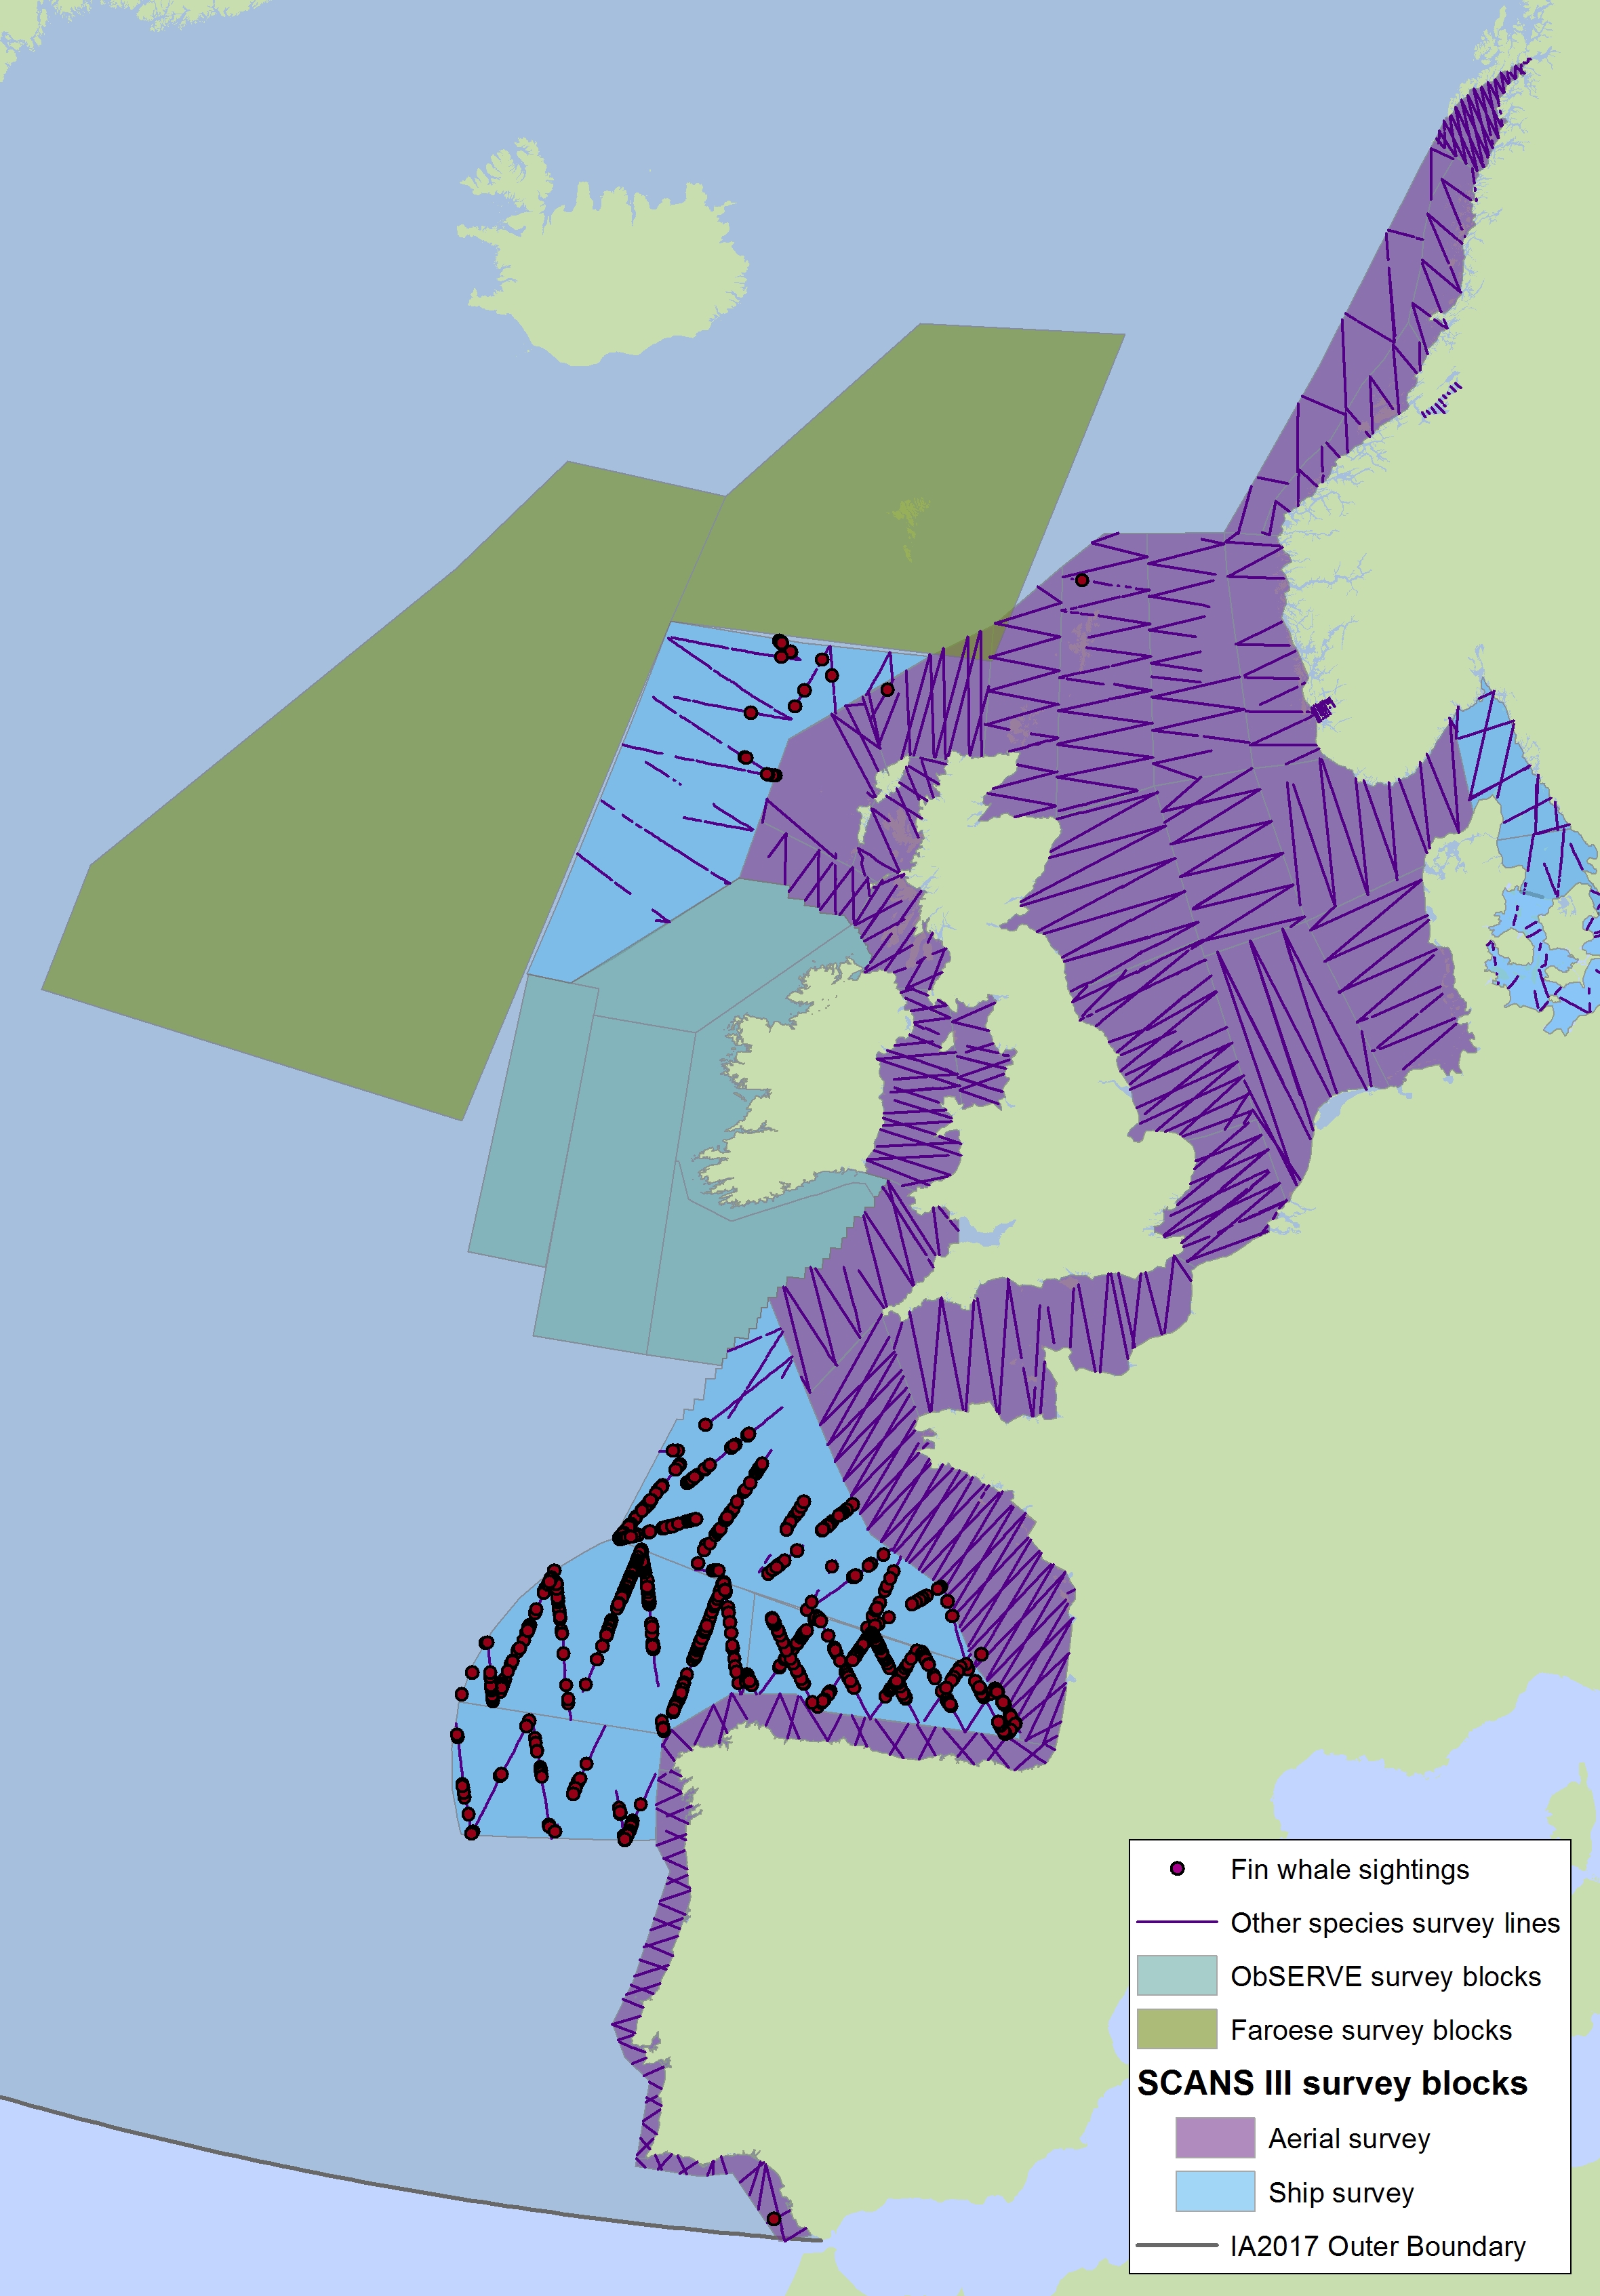
Figure h2: Sightings of fin whales in 2016 from the SCANS-III survey (Hammond et al. 2017).
The area in green to the west of Ireland was surveyed in summer 2016 by the Irish ObSERVE project. No data were available from this area when undertaking this assessment, however it could be included in any update of this assessment in future. The area in yellow was surveyed in summer 2015 by the NASS project.
Long-finned pilot whale
Long-finned pilot whales (Globicephala melas) are deep divers and typically found only in waters around the continental slope and beyond the shelf. They occur throughout the Celtic Seas and the Bay of Biscay and Iberian Coast (Figure i1, i2). No pilot whales were seen in the SCANS, SCANS-II or SCANS-III surveys in the Greater North Sea (Figure i2). Slope and distance to shelf edge are important predictors for the presence of this species (Rogan et al., 2017).
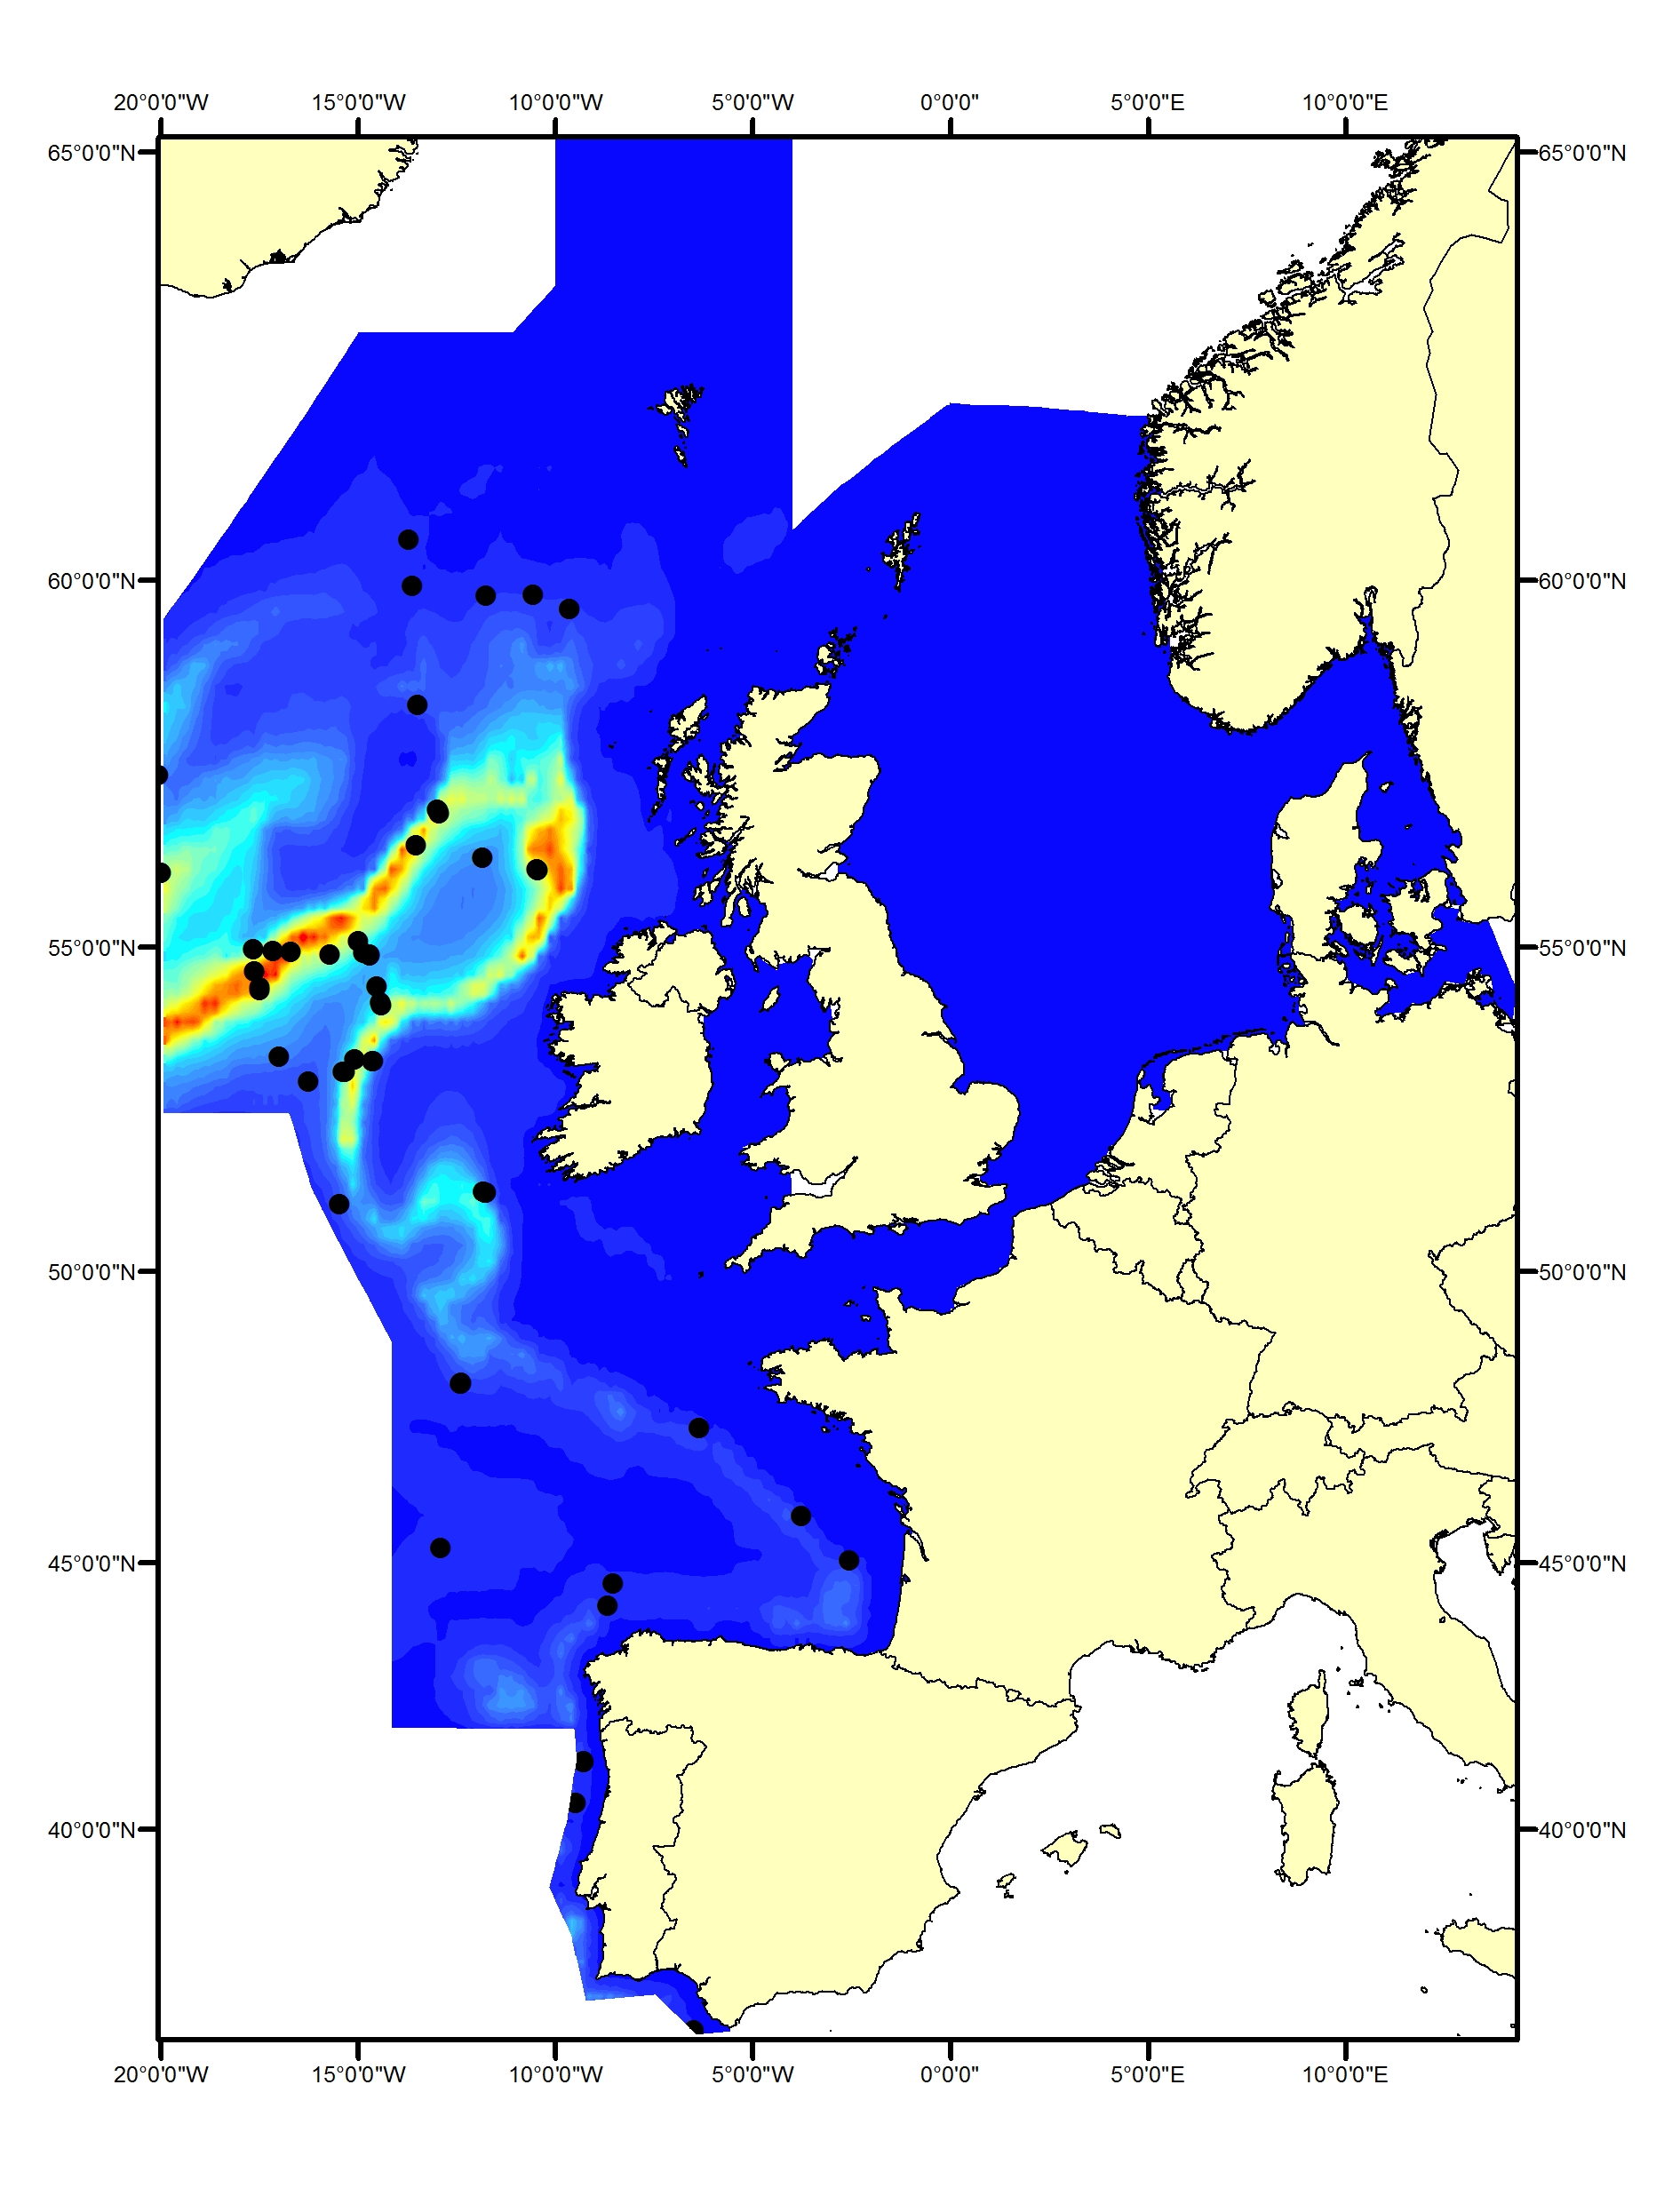
Figure i1: Predicted density surface for long-finned pilot whale from CODA, SCANS-II and NASS data in summer 2005 and 2007

FIgure i2: Sightings of long-finned pilot whales in 2016 from the SCANS-III survey (Hammond et al. 2017).
The area in green to the west of Ireland was surveyed in summer 2016 by the Irish ObSERVE project. No data were available from this area when undertaking this assessment, however it could be included in any update of this assessment in future. The area in yellow was surveyed in summer 2015 by the NASS project.
Beaked whales (all species)
Beaked whales are deep-diving species found almost exclusively in deep waters. Sighting of beaked whales are relatively uncommon in most areas throughout the Celtic Seas and the Bay of Biscay and Iberian Coast and rare in the Greater North Sea. Sightings of northern bottlenose whale (Hyperoodon ampullatus) and Sowerby’s beaked whale (Mesoplodon bidens) have been made primarily in the northern part of the Celtic Seas, whilst Cuvier’s beaked whale (Ziphius cavirostris) has mostly been seen in the southern part of the Celtic Seas and the western part of the Bay of Biscay and Iberian Coast (Figure j1, j2, j3).
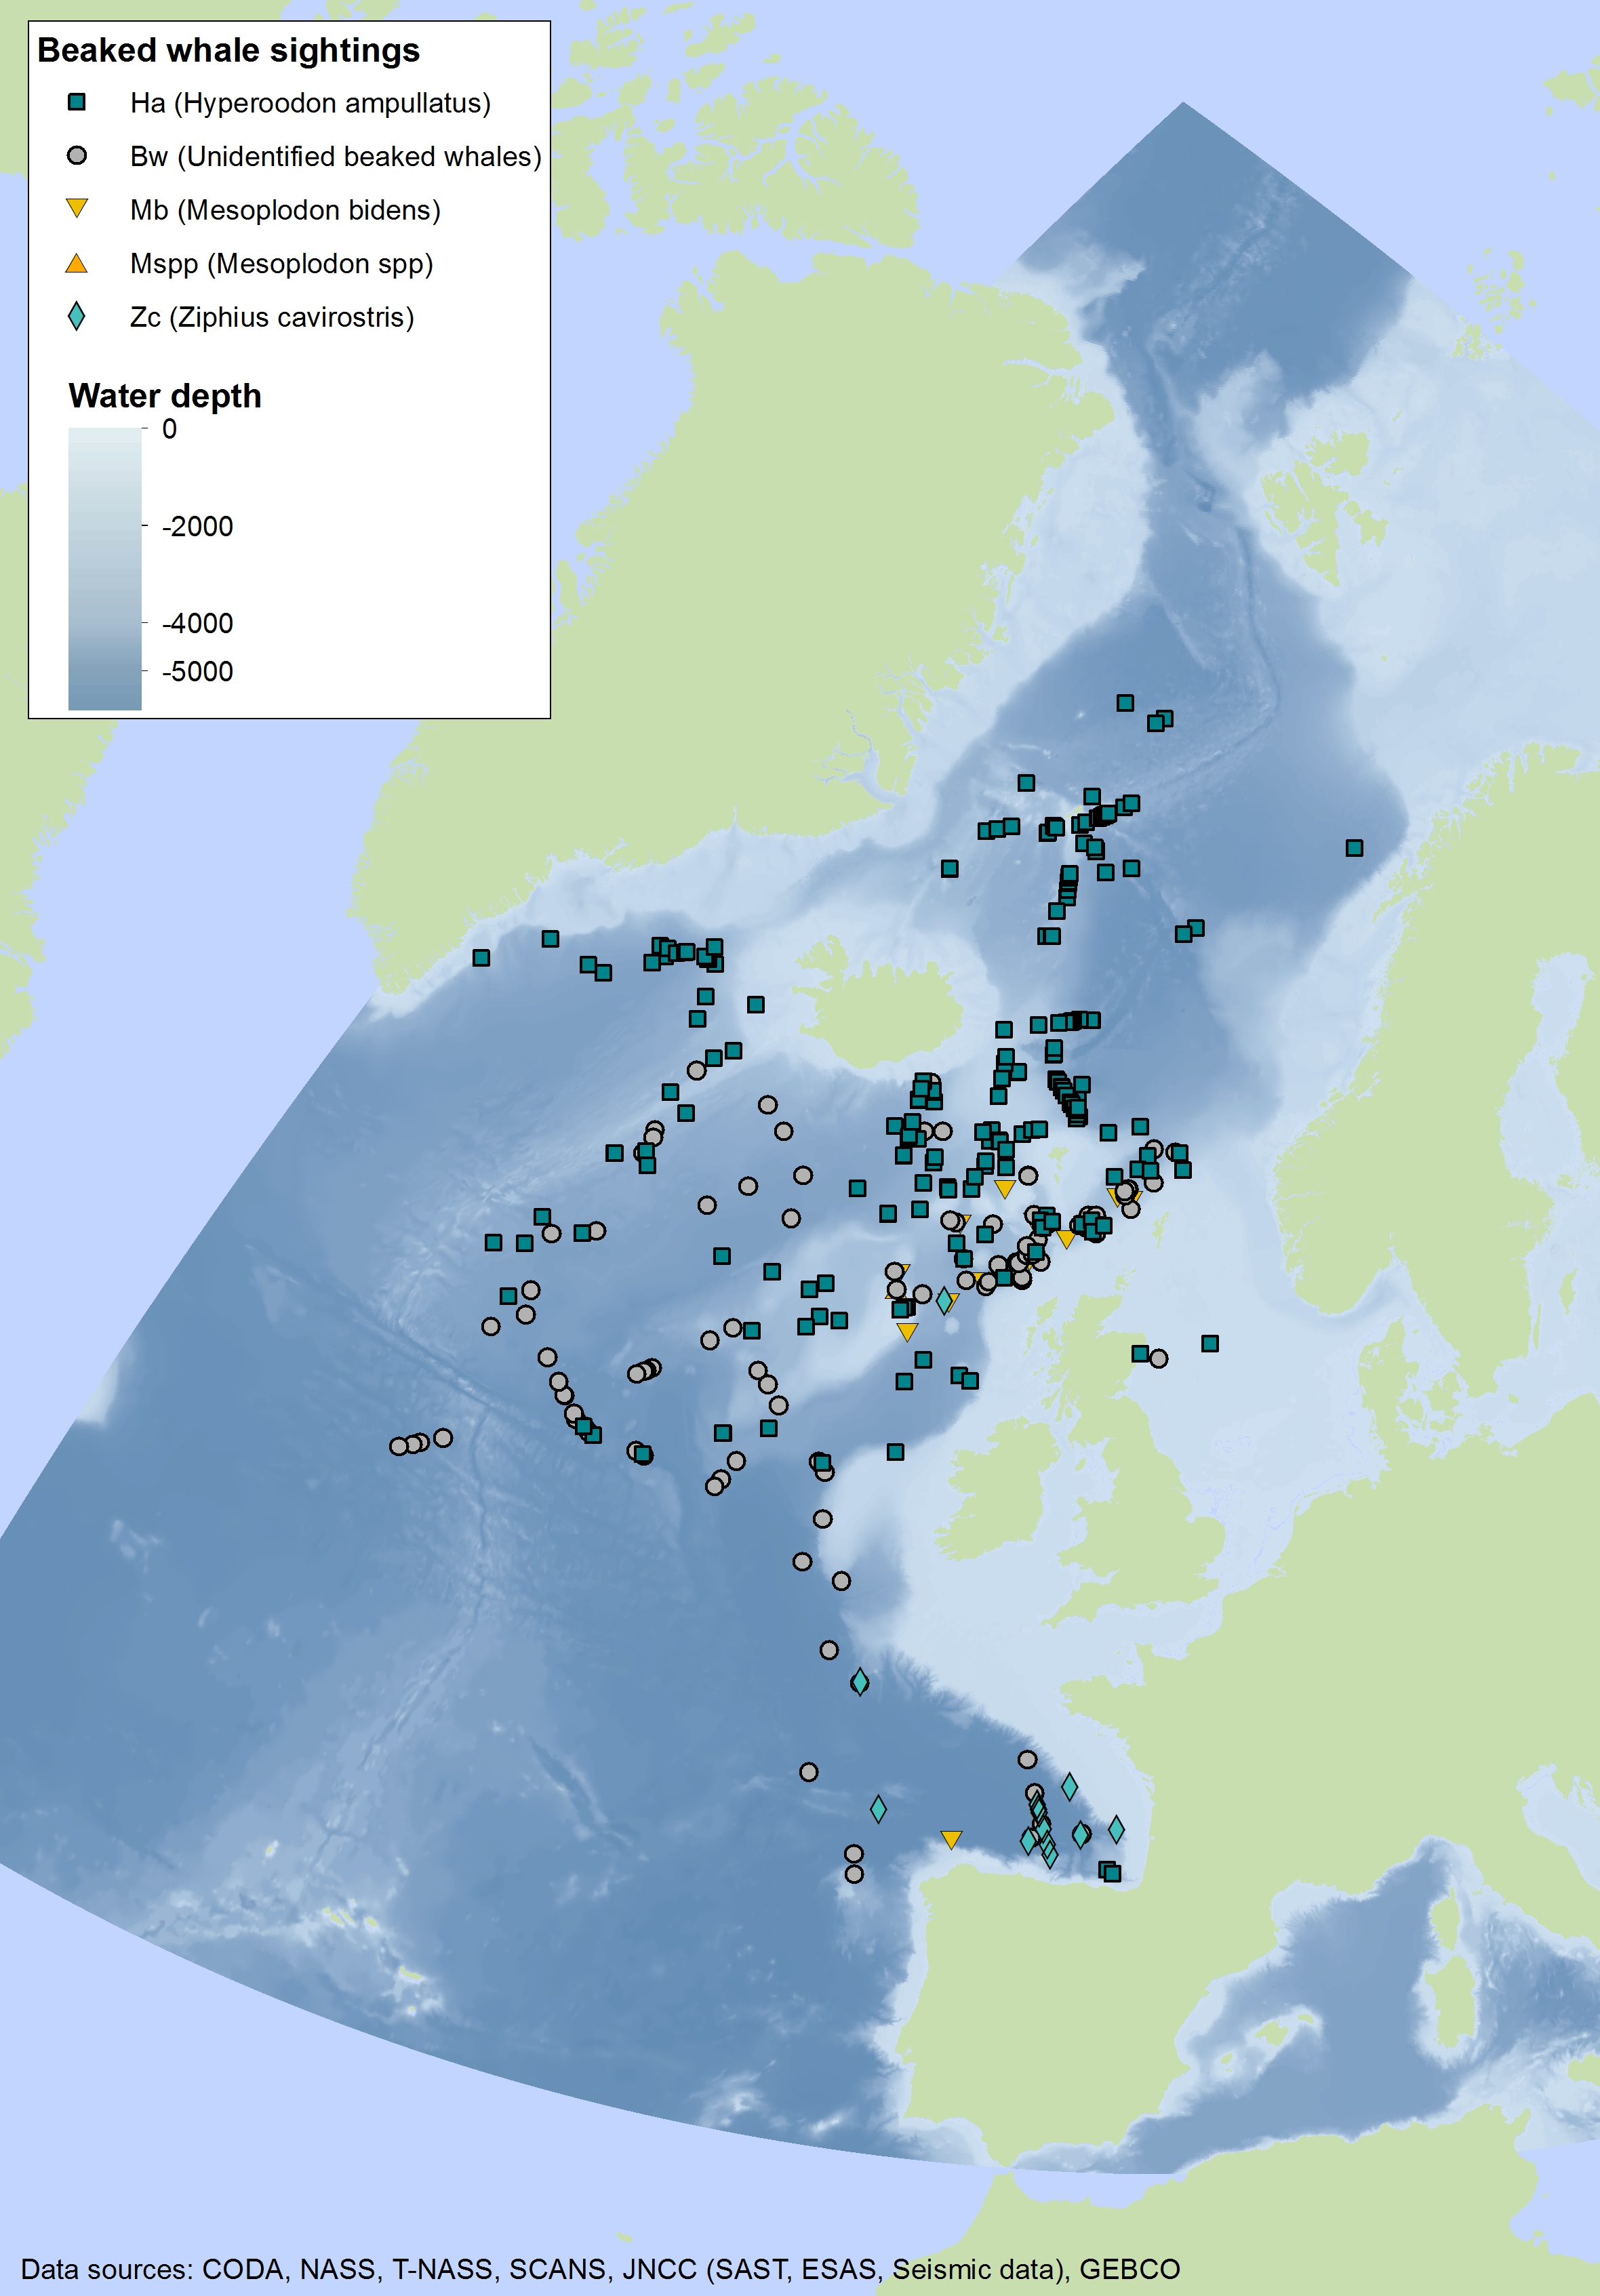
Figure j1: Combined sightings of beaked whales across the OSPAR Maritime Area over multiple years (data goes back to 1979 when the Seabirds at Sea Team (SAST) was established)
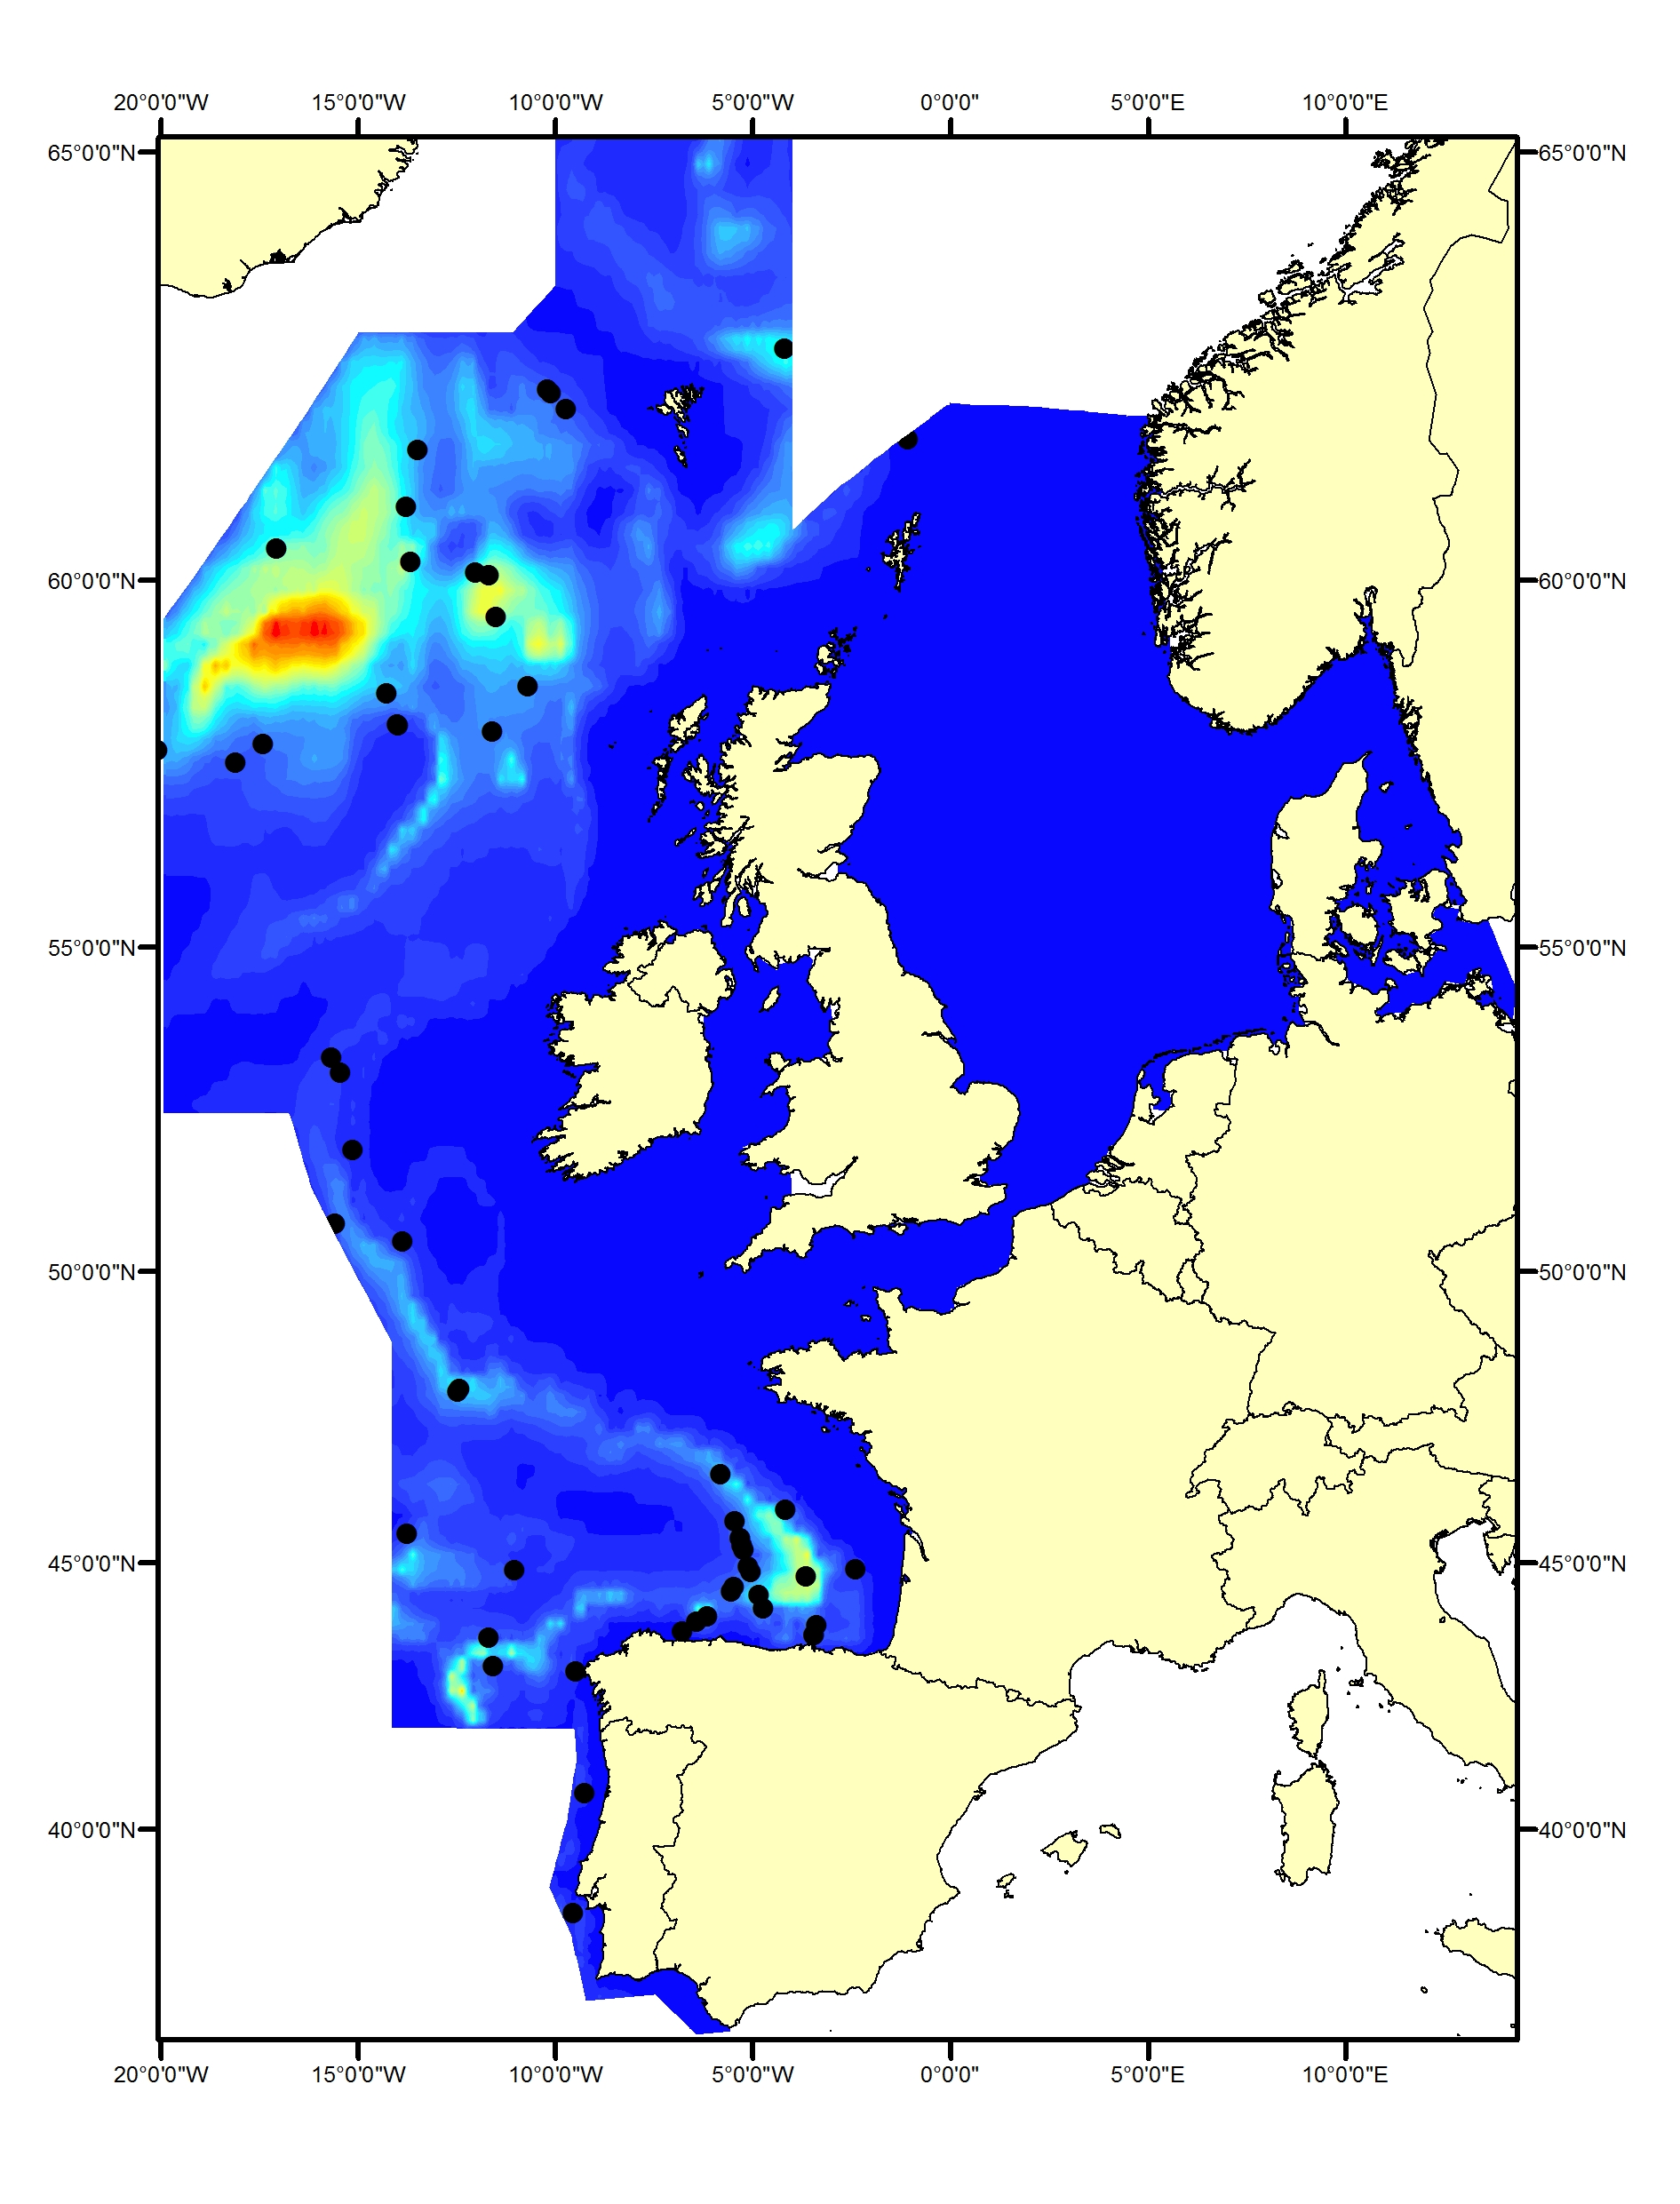
Figure j2(i): Predicted density surface for beaked whales from CODA, SCANS-II and T-NASS data in summer 2005 and 2007

Figure j3: Sightings of beaked whales in 2016 from the SCANS-III survey (right) (Hammond et al., 2017)
Cuvier’s beaked whale (red dot); Gervais beaked whale (blue dot); unidentified beaked whale (pink square); unidentified mesoplodon (black triangle); Sowerby’s beaked whale (green dot); bottlenose whale (turquoise dot). The area in green to the west of Ireland was surveyed in summer 2016 by the Irish ObSERVE project. No data were available from this area when undertaking this assessment, however it could be included in any update of this assessment in future. The area in yellow was surveyed in summer 2015 by the NASS project.
Sperm whale
The sperm whale (Physeter macrocephalus) is a deep-diving species found throughout deep waters of the Celtic Seas and the Bay of Biscay and Iberian Coast, and rarely in the Greater North Sea, except in the Faroes-Shetland channel between the Greater North Sea and Celtic Seas (Figure k1, k2).
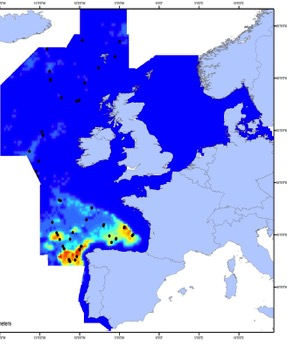
Figure k1: Predicted density surface for sperm whale from CODA, SCANS-II and T-NASS data.
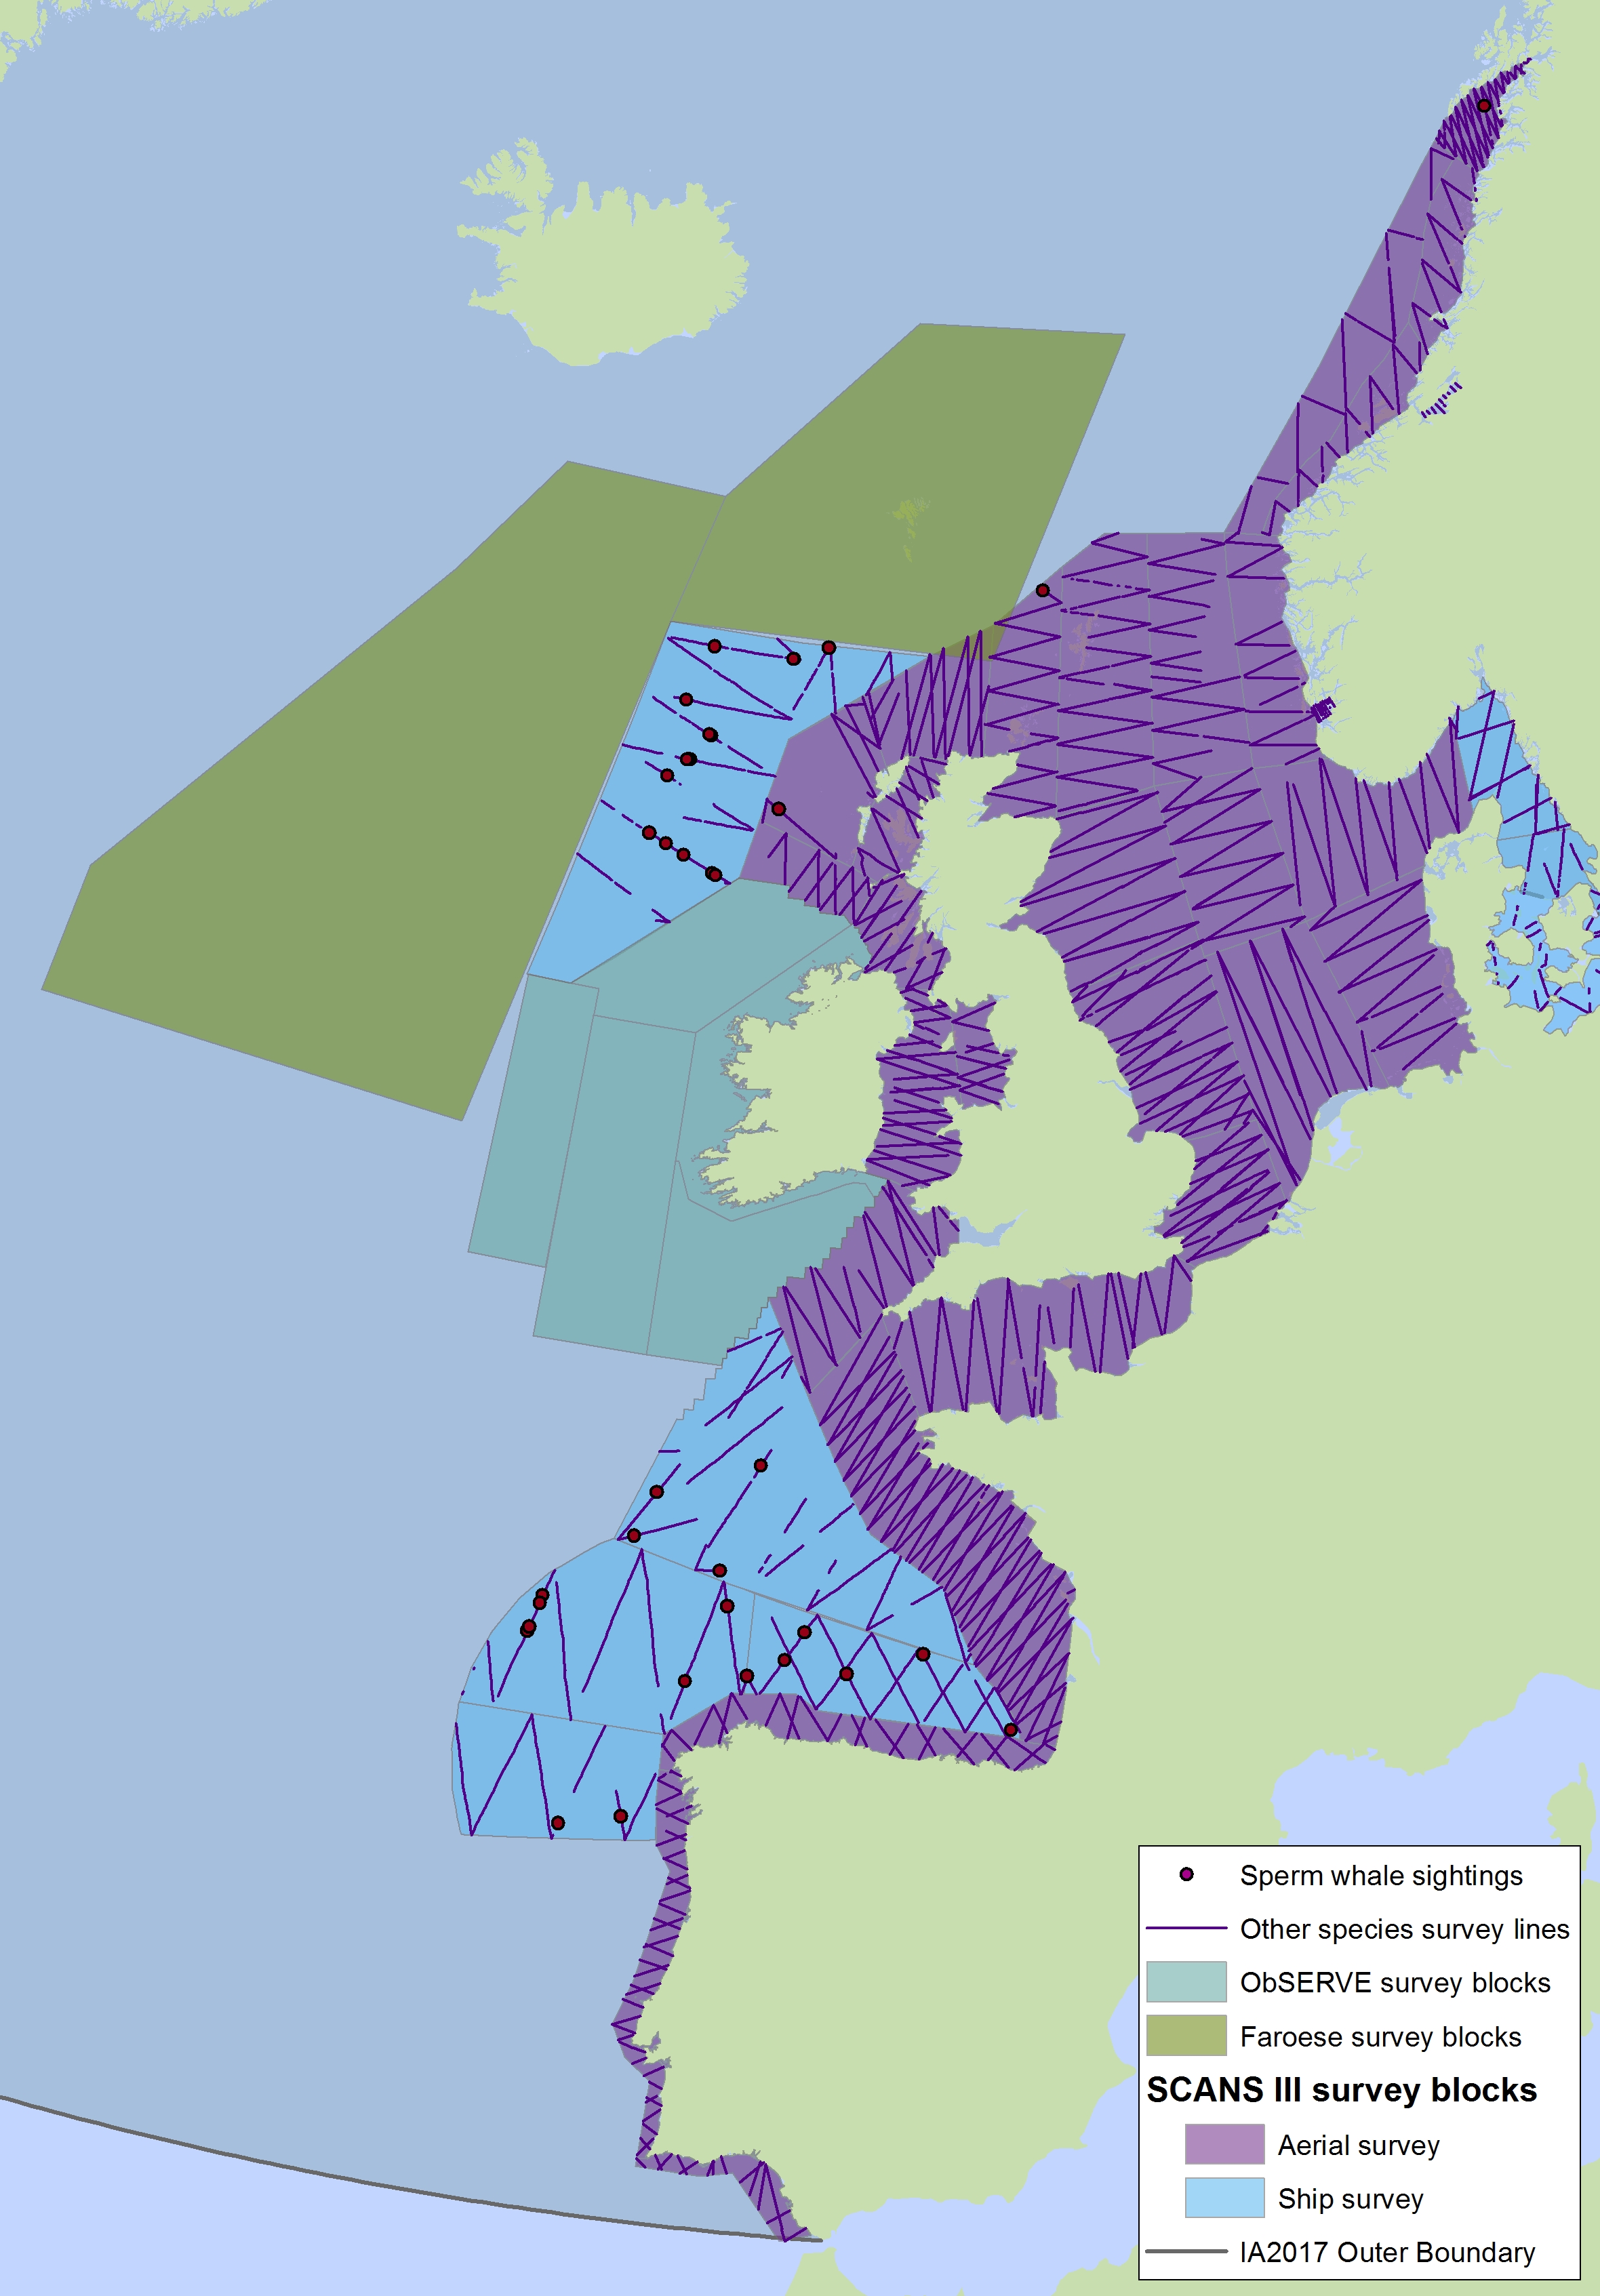
Figure k2: Sightings of sperm whales in 2016 from the SCANS-III survey (Hammond et al. 2017).
The area in green to the west of Ireland was surveyed in summer 2016 by the Irish ObSERVE project. No data were available from this area when undertaking this assessment, however it could be included in any update of this assessment in future. The area in yellow was surveyed in summer 2015 by the NASS project.
D1.2 - Population Size
Harbour porpoise
Abundance estimates for harbour porpoise are available for all five Assessment Units (AUs) in the OSPAR Maritime Area but only for the Greater North Sea and the Kattegat / Belt Seas are there more than two estimates. It should be noted that the area around the northern parts of the Kattegat / Belt assessment area contains a mix of two different populations; the North Sea population (including Skagerrak and northern Kattegat) and the Belt Seas population (encompassing the southern Kattegat, the Belt Sea, the Sound and the western Baltic; Sveegaard et al., 2015). Surveys to estimate abundance in this region have not aligned survey boundaries with these population units and as a result abundance estimates may represent a mix of both (Figure l). The definition of the North Sea and Kattegat and the Belt Seas AUs should be re-evaluated for future assessments.
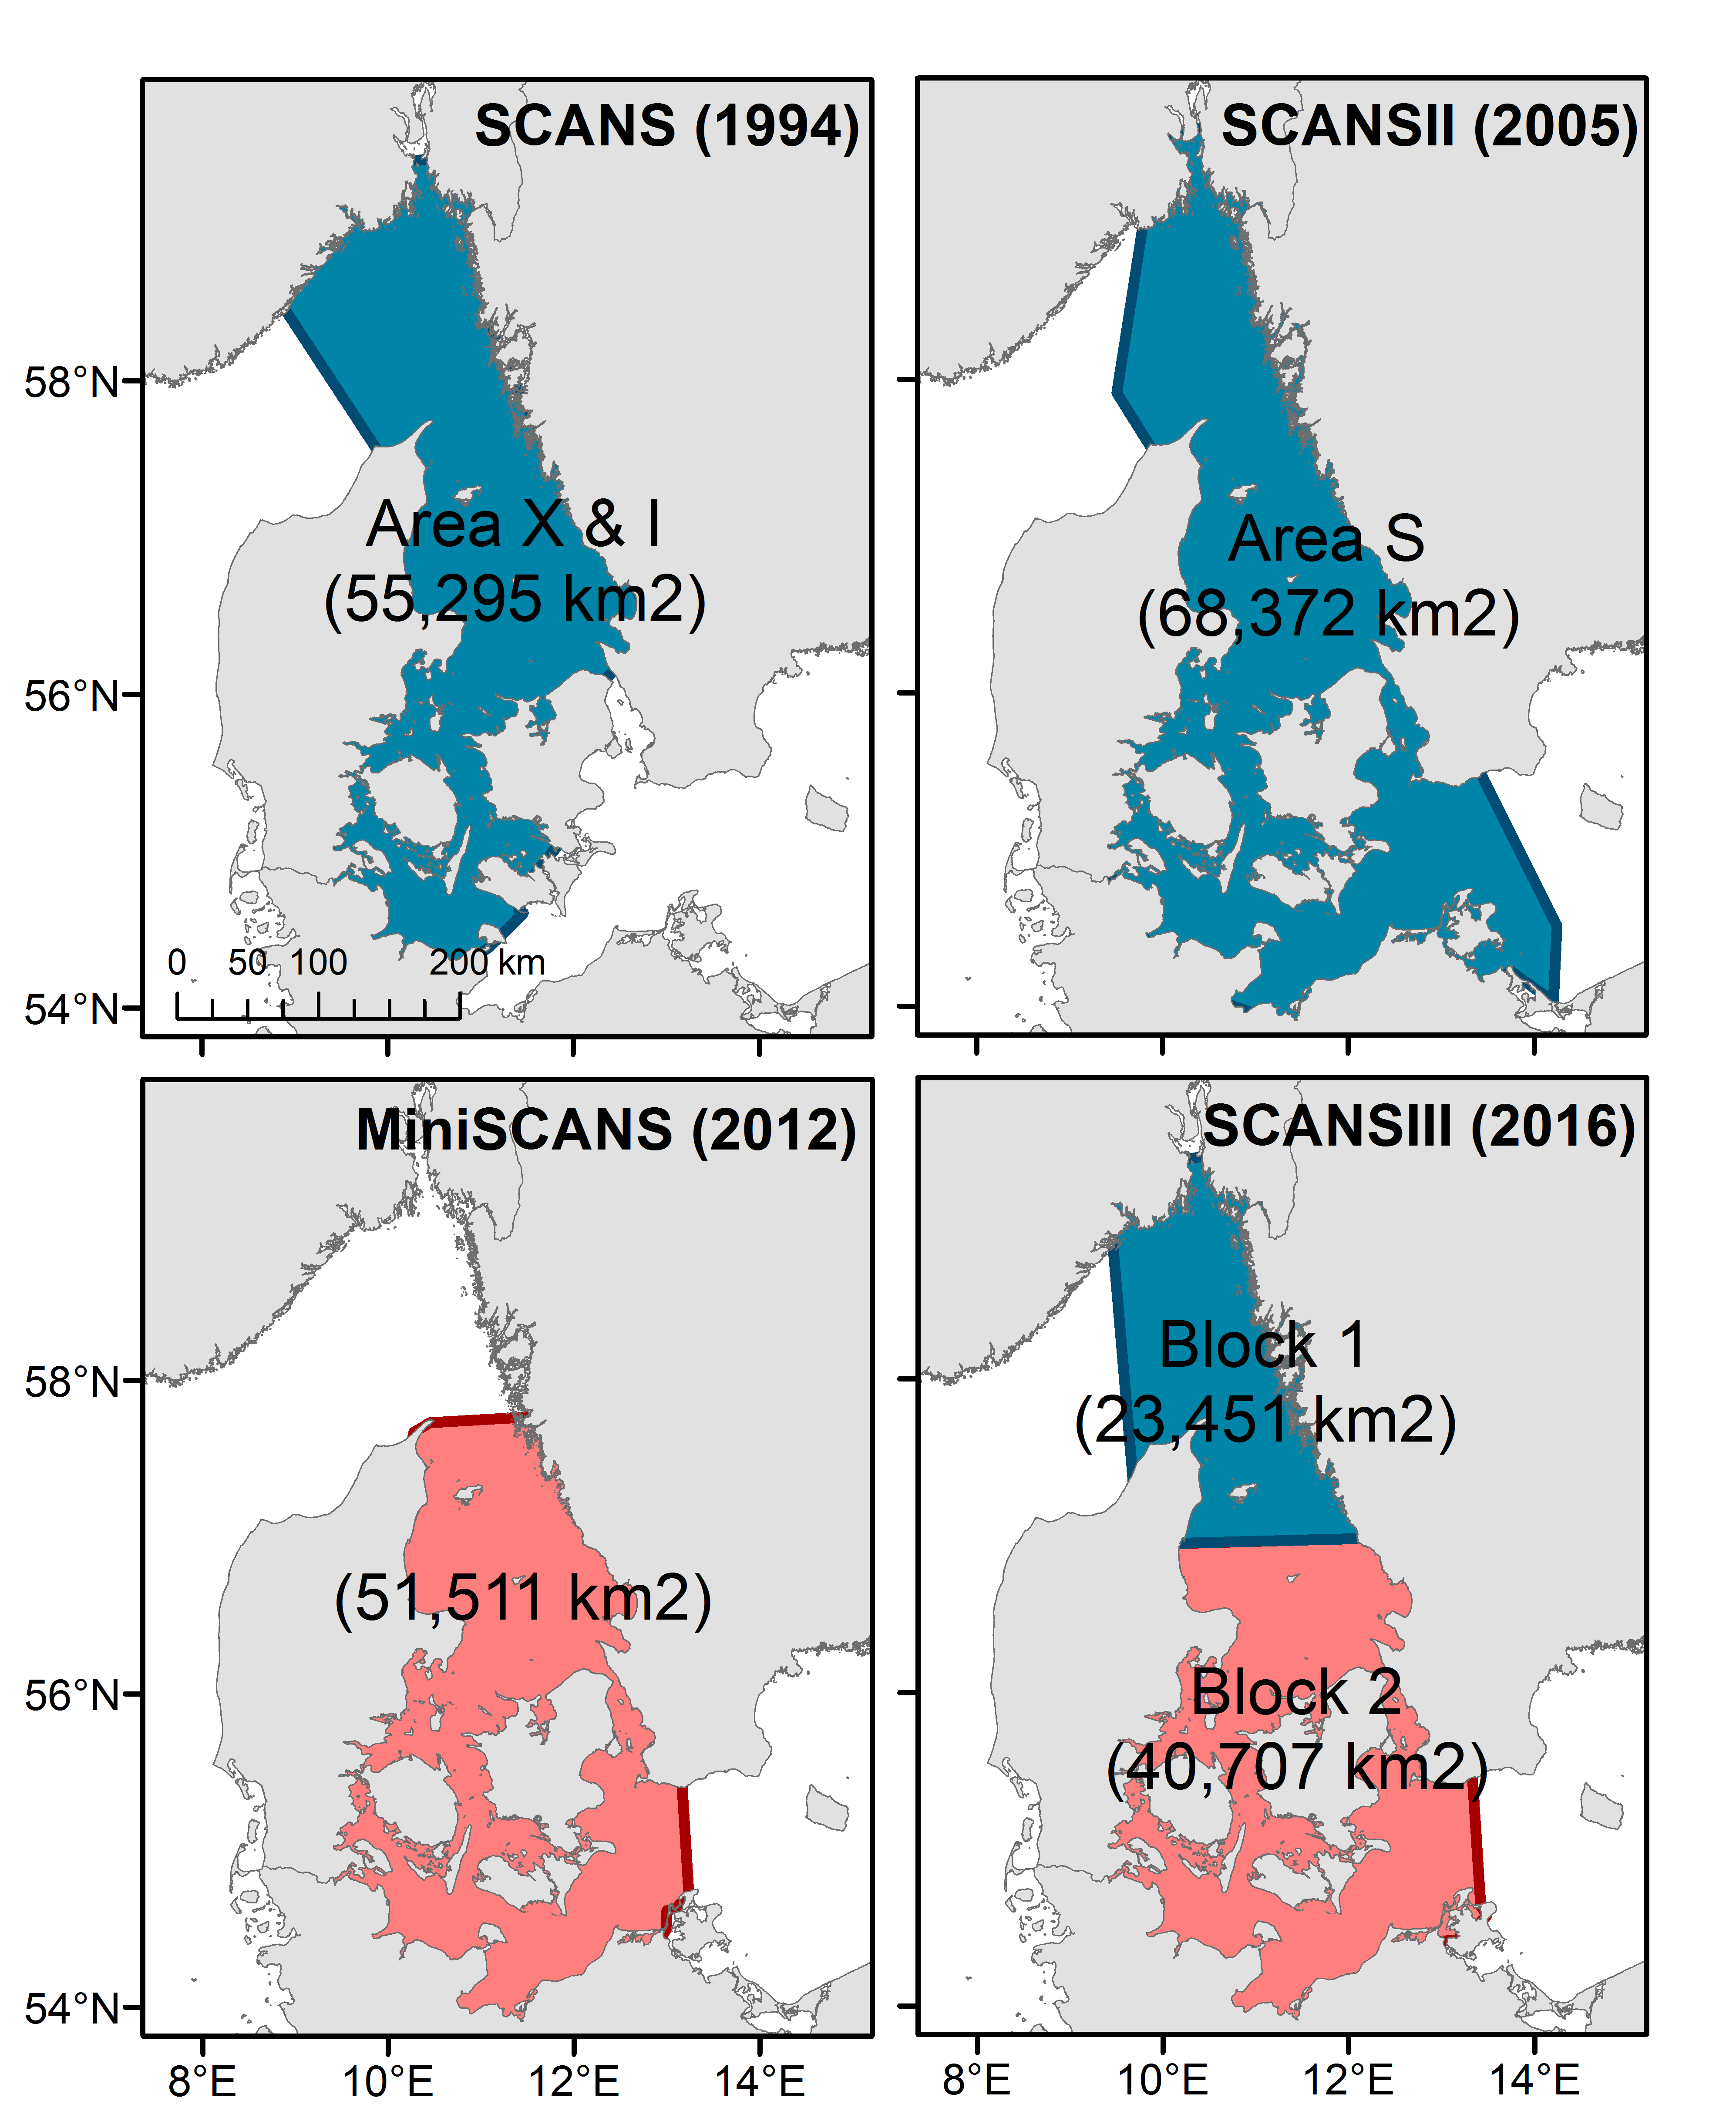
Figure l: map of survey strata in the Kattegat/Belt Sea area
The red and blue colours relate to the trend assessment outlined in Figure m.
The abundance of harbour porpoise from the 2005 SCANS-II survey for the whole region was estimated to be 519,864 (CV=0.21) animals(revised from Hammond et al., 2013). Animals were least common in the more offshore survey blocks to the west of Scotland and Ireland. A few sightings of harbour porpoises were made in offshore waters over the Rockall Bank in CODA in 2007 and SCANS-III in 2016 (Hammond et al. 2017). Estimated abundance in 1994 for the North Sea, the Skagerrak, Kattegat and Belt Seas and the Celtic Seas was 407,178 (CV=0.18) animals (revised from Hammond et al., 2002). In 2016, abundance in the same area surveyed in 2005, except waters to the west of Ireland, was 442,043 (CV=0.15) animals. Estimates of abundance by Assessment Unit for SCANS, SCANS-II and SCANS-III are given in Table C ; note that there is only a partial estimate of abundance for the Celtic and Irish Seas Assessment Unit from SCANS-III.
The estimate from SCANS-III for 2016 of 42,300 (CV: 0.30) for the Kattegat and Belt Seas AU (Block 2; Hammond et al., 2017), is very similar to the comparable estimate from 2012 of 40,500 (CV: 0.24) (Viquerat et al., 2014). The estimate from SCANS-III in 2016 of 67,700 (CV: 0.22) (Blocks P1 and 2; Hammond et al., 2017) for a larger area that included the Skagerrak to the north is comparable to the SCANS and SCANS-II surveys in 1994 and 2005 of 51,700 (CV: 0.30) (revised from Hammond et al., 2002) and 27,900 (CV: 0.36) (revised from Hammond et al., 2013), respectively. A trend line fitted to the three estimates for the Skagerrak / Kattegat / Belt Seas area AUs gives an estimated increase of 1.24% (95% CI: -39% to 67%) per year, p=0.81 (Figure m). Given that the trend is not significantly different from zero, there is thus no evidence of a change in abundance in this area over the period 1994–2016. However, it should be noted that this area contains animals from the North Sea as well as from the Kattegat / Belt Seas population. There are only two comparable estimates for the Kattegat / Belt Seas AU.
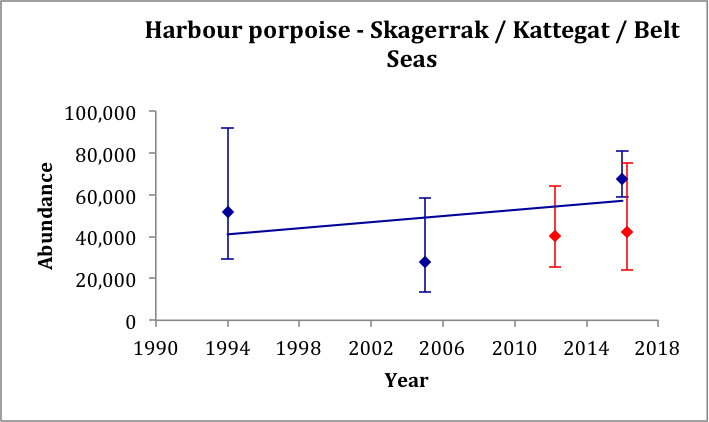
Figure m: Harbour porpoise abundance estimates in the Skagerrak / Kattegat / Belt Seas area AUs (blue dots) and in the Kattegat / Belt Seas AU (red dots), as outlined in Figure l.
A trend line is fitted to the estimates from the Skagerrak / Kattegat / Belt Seas area (blue dots only). Bars show 95% confidence intervals.
In the North Sea AU, the estimate in 2016 (345,000, CV: 0.18) is very similar to the estimate in 2005 (355,000, CV: 0.22; revised from Hammond et al., 2013), and slightly larger than the estimate for 1994 (289,000, CV: 0.12; revised from Hammond et al., 2002). It is also similar to the model-based estimate using data from 2005–2013 of 361,000 (CV: 0.20) (Gilles et al., 2016). A trend line fitted to the 1994, 2005 and 2016 estimates gives an estimated increase of 0.8% (95% CI: -6.8% to 9.3%) per year, p=0.42 (Figure n). Given that the trend is not significantly different from zero, there is thus no evidence of a change in abundance over the period 1994–2016. These data have 80% power to detect a trend of 1.5% per year.
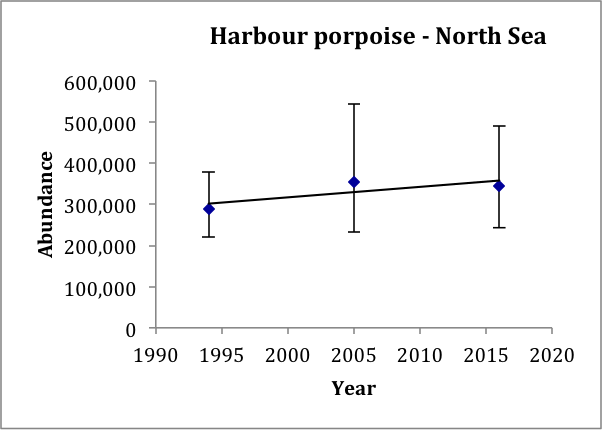
Figure n: Trend line fitted to harbour porpoise abundance estimates in the North Sea AU
Bars show 95% confidence intervals.
In the West Scotland AU the estimates of 24,400 (CV: 0.23) for 2016 and 26,300 (CV: 0.37) for 2005 (revised from Hammond et al., 2013) are very similar, but the southern part of the AU was covered in 2016 by the Irish ObSERVE project and information for this area is not yet available. The estimates for the Iberian Peninsula AU of 2,900 (CV: 0.32) for 2016 and 2,880 (CV: 0.72) for 2005 are also similar.
SCANS-III excluded a large part of the Celtic and Irish Seas AU, which was covered by the Irish ObSERVE project. No data were available from this area when undertaking this assessment, however it could be included in any update of this assessment in future. Consequently, an estimate for the whole Celtic and Irish Seas AU cannot currently be provided for 2016.
Model-based abundance estimates for the North Sea have been calculated from data collected primarily in the southern and central North Sea from 2005 to 2013. Seasonal estimates have been made for spring (372,167, CV: 0.18), summer (361,146, CV: 0.20) and autumn (228,913, CV: 0.19) animals (Gilles et al., 2016). These estimates are consistent with the summer estimate from the SCANS-III survey.
Short-beaked common dolphin and striped dolphin
The most comprehensive abundance estimates for short-beaked common dolphin and striped dolphin in the OSPAR Maritime Area are from SCANS-II in 2005 and CODA in 2007, and from SCANS-III in 2016. It is pertinent to consider both species together because they mostly occur in the same general areas and because the difficulty of distinguishing them in the field leads to a high proportion of sightings unidentified to species level.
For the single AU, covering the Greater North Sea, Celtic Seas, and Bay of Biscay and Iberian Coast, abundance of common dolphin was estimated at 174,000 (CV: 0.27) in 2005 / 2007 and 468,000 (CV: 0.26) in 2016 (Table c). The equivalent values for striped dolphin are 61,400 (CV: 0.93) in 2005 / 2007 and 372,000 (CV: 0.33) in 2016 (Table c). For both common and striped dolphins, including sightings unidentified to species level, the estimates are 306,000 (CV: 0.29) in 2005 / 2007 and 998,000 (CV: 0.18) in 2016 (Table c). The estimates from SCANS-III in 2016 are thus much greater than those from 2005 / 2007. One potential explanation could be large-scale inter-annual variation in distribution in these species, whose range extends beyond the areas surveyed.
The estimate of common and striped dolphins in summer 2012 from the SAMM (Suivi Aérien de la Mégafaune Marine / Aerial Monitoring of Marine Megafauna) surveys in the English Channel and French waters in the Bay of Biscay was 696,000 animals (Table c). The SAMM survey area did not include Spanish waters that were included in SCANS-III in 2016 and the estimate was not corrected for animals missed on the transect line. The estimates from SCANS-III in 2016 and SAMM in 2012 therefore appear to be compatible.
White-beaked dolphin
Estimates of abundance for the single AU for white-beaked dolphin are available for 1994, 2005 and 2016 (Table c). Estimated abundance in 1994 was 23,700 (CV: 0.30) animals (revised from Hammond et al., 2002) but this estimate did not include waters to the west of Scotland. Estimated abundance in 2005 was 37,700 (CV: 0.36) animals (revised from Hammond et al., 2013). Estimated abundance in 2016 was 36,300 (CV: 0.29) (Hammond et al., 2017). The highest estimated densities in 2005 and 2016 were found around western Scotland and in the Northern North Sea. Estimates of abundance in the North Sea for 1994, 2005 and 2016 show an increase from 22,600 (CV: 0.23) in 1994, to 29,000 (CV: 0.35) in 2005, to 20,500 (CV: 0.36) in 2016 (Table c). A trend line fitted to these three estimates gives an estimated decrease of 0.5% (95% CI: -18% to 22%) per year, p=0.82 (Figure o). Given that the trend is not significantly different from zero, there is thus no evidence of change in abundance over the period 1994–2016. These data have 80% power to detect a trend of 2.5% per year.
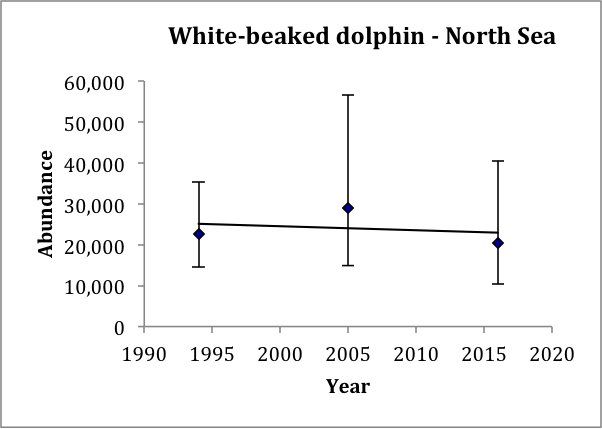
Figure o: Trend line fitted to white-beaked dolphin abundance estimates in the North Sea
Bars are 95% confidence intervals.
Offshore Bottlenose Dolphin
The SCANS-II and CODA surveys in 2005 / 2007 and the SCANS-III survey in 2016 covered almost all shelf waters and offshore waters of the region. The estimates from these surveys thus relate primarily to the Oceanic waters AU but also include AUs inhabited by coastal bottlenose dolphin populations, although little survey effort was conducted in any of these coastal AUs. Estimated abundance was 35,900 (CV: 0.21) in 2005 / 2007 and 27,700 (CV: 0.23) in 2016 (Table c).
Minke Whale
A single AU has been described for minke whale in the OSPAR Maritime Area. Abundance was estimated in parts of this region from the SCANS, SCANS-II, CODA and SCANS-III surveys, as well as from Norwegian Independent Line Transect Surveys (NILS) in the North Sea, and SAMM surveys in the English Channel and Bay of Biscay (Table c). Despite the more recent SCANS-III survey, the most comprehensive estimate for the whole area remains that from 2005 / 2007 from the SCANS-II / CODA surveys combined of 26,800 (CV: 0.35) animals (revised from Hammond et al., 2011) because a substantial area of high density west of Ireland surveyed in 2005 / 2007 is not included in the 2016 estimate of 13,100 (CV: 0.35).
In the North Sea, there is now a series of eight estimates of abundance from 1989 to 2016 (Table c). These all relate to the area south of 62°N, but the earlier Norwegian estimates only relate to waters between 56°N and 61°N. The most recent Norwegian estimate for 2009 does include waters south of 56°N but there was little effort in the southern / central North Sea, where around 20–30% of the abundance was estimated from the SCANS-II and SCANS-III surveys in 2005 and 2016. A trend line fitted to these eight estimates gives an estimated trend of -0.025% (95% CI: -4.8% to 4.6%) per year, p=0.90 (Figure p). There is thus no evidence of a change in abundance over the period 1994–2016. These data have 80% power to detect a trend of 0.5% per year.
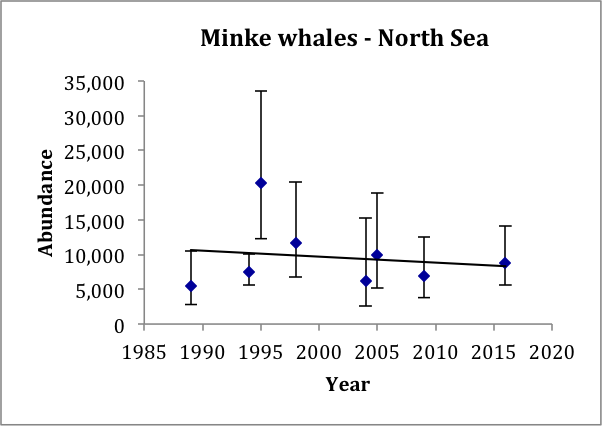
Figure p: Trend line fitted to minke whale abundance estimates in the North Sea
Bars show 95% confidence intervals.
SAMM estimates in 2011 / 2012 for the English Channel / Bay of Biscay area were 5,223 (CV: 0.33) animals in summer and 363 (CV: 1.02) in winter.
Fin Whale
An AU has not been described for fin whale. The estimate of fin whale abundance in 2016 of 18,100 (CV: 0.38) (Hammond et al., 2017) is very similar to the estimate from 2007 of 19,300 (CV: 0.24) for identified fin whales but smaller than the estimate that included a proportion of unidentified large whales of 29,500 (CV: 0.21) (Hammond et al., 2011). Analyses to account for unidentified large whales have not yet been undertaken for the SCANS-III data. However, SCANS-III did not include waters to the west of Ireland and a direct comparison between estimates for 2016 and 2005 / 2007 should not be made until estimates are available for equivalent areas.
Long-Finned Pilot Whale
An AU has not been described for the long-finned pilot whale. The estimate from 2005 / 2007 from the SCANS-II / CODA surveys combined of 124,000 (CV: 0.35) animals (Rogan et al., 2017) included a substantial area of high density west of Ireland that is not included in the 2016 estimate from SCANS-III of 20,700 (CV: 0.40). A direct comparison between estimates for 2016 and 2005 / 2007 should not be made until estimates are available for equivalent areas.
Beaked Whales (all Species)
AUs have not been described for beaked whales. The estimate of abundance of all beaked whale species combined for 2016 of 11,600 (CV: 0.61) (Hammond et al., 2017) is very similar to the equivalent estimate from SCANS-II and CODA in 2005 / 2007 of 12,900 (CV: 0.31) (Rogan et al., 2017) (Table c). However, SCANS-III did not include waters to the west of Ireland and a direct comparison between estimates for 2016 and 2005 / 2007 should not be made until estimates are available for equivalent areas.
Sperm Whale
An AU has not been described for sperm whale. The estimate of sperm whale abundance in 2016 of 9,600 (CV: 0.41) (Hammond et al., 2017) is larger than the estimate from CODA in 2007 of 2,600 (CV: 0.26) for identified sperm whales and the estimate of 5,600 (CV: 0.32) if a proportion of unidentified large whales is included (Rogan et al., 2017). However, SCANS-III did not include waters to the west of Ireland and a direct comparison between estimates for 2016 and 2005 / 2007 should not be made until estimates are available for equivalent areas.
Confidence Assessment
The assessment is based on large-scale collaborative international surveys and reflects a degree of consensus among relevant experts. Therefore there is moderate confidence in the methodology. It is also based on best-available data but there is relatively high uncertainty in abundance estimates and data are generally insufficient temporally to asses trends, as surveys do not take place very often, and only in the summer months. Therefore the confidence in the data availability is low.
Conclusion
Les cétacés sont très répandus dans toute une série d’habitats et sont en général abondants dans l’ensemble de la zone maritime OSPAR. On estime que plus de 1,5 million d’individus vivent dans la mer du Nord au sens large, les mers Celtiques et le golfe de Gascogne et la côte ibérique. Pour la plupart des espèces on ne possède que deux estimations comparables de l’abondance et il n’est pas possible de réaliser une évaluation solide des tendances. Les séries temporelles les plus longues d’estimation pour le marsouin, le dauphin à nez blanc et le petit rorqual en mer du Nord, et le marsouin dans le Kattegat / les mers Belt, ne révèlent aucun signe d’une quelconque modification de l’abondance depuis 1994. Dans le cas du marsouin en mer du Nord cependant, un déplacement important vers le Sud s’est produit entre 1994 et 2005 et s’est maintenu en 2016 fort probablement dû aux modifications de la disponibilité des proies.
Des études à grande échelle continuent à être nécessaires, entreprises de préférence plus fréquemment que celles réalisées à ce jour, afin de pouvoir mieux déceler des tendances.
In the Greater North Sea, only harbour porpoise (Phocoena phocoena), white-beaked dolphin (Lagenorhynchus albirostris) and minke whale (Balaenoptera acutorostrata) have more than two estimates of abundance, but there is no evidence that numbers have declined (or increased) since 1994. However, the time series do not provide information about historical levels, and are currently short relative to the life cycle of the species, with the possible exception of harbour porpoise. Given the limited number of estimates in the time series and the precision of the estimates, the power to detect trends from these data is currently low. Nevertheless, the most recent estimates of abundance are mostly either very similar or larger than earlier estimates.
Lacunes des connaissances
Les données historiques sur l’abondance et la répartition des cétacés sont rares ou absentes et donc insuffisantes pour pourvoir évaluer l’état de la plupart des espèces. Il n’est pas possible de déterminer s’il existe des rapports de cause à effet entre les activités humaines et la taille et la répartition des populations de cétacés, étant donné l’absence de données. On pourrait améliorer les possibilités de déceler des tendances en augmentant la fréquence des études à grande échelle. A ce jour, les études à grande échelle ont été entreprises durant l’été et on manque donc d’informations saisonnières à grande échelle.
Les données disponibles provenant d’autres études à grande échelle permettront à l’avenir d’aborder les lacunes des connaissances.
Time Series of Information to Assess Status
Many cetacean populations range over very large areas and, even though some species are very abundant, these large ranges mean that densities are typically very low. In addition, all cetaceans spend the large majority of their lives underwater and so are difficult to observe. Surveys to obtain robust information over the large scale are both logistically challenging and expensive to undertake and, as a result, there have been few in the region. The large-scale SCANS/CODA surveys covering a large proportion of North-East Atlantic waters have been organised only four times: SCANS in 1994, 2005 and 2016; CODA in 2007. Although there have been some additional valuable and more frequent systematic aerial surveys generating robust information for the southern and central North Sea (DEPONS project; Gilles et al., 2016), in general the time series of coordinated purpose-designed surveys for cetaceans is still too short to allow status to be assessed in relation to both indicators of abundance and distribution. The preferred option would be to establish a European Atlantic-wide framework to determine abundance and trends in cetacean populations to provide a mechanism for using appropriate available and newly commissioned data.
For species with an offshore distribution that occur outside the Greater North Sea, Celtic Seas, and Bay of Biscay and Iberian Coast, coordination with other survey programmes such as the six-yearly NASS surveys in central North Atlantic waters and the Norwegian ‘mosaic’ NILS surveys that cover the northeast North Atlantic is desirable.
Another option is to further pursue a coordinated approach to collate and standardise effort-related cetacean sightings data across the OSPAR Maritime Area, including information from other sources such as seabird surveys. This is currently being undertaken by the Joint Cetacean Protocol (JCP; Paxton et al., 2016), which was established to respond to the limited spatial and temporal nature of cetacean survey data. In the JCP, all available north-west European effort-related cetacean sightings data are standardised and collated with the aim of informing reporting by Member States under the Habitats Directive and the Marine Strategy Framework Directive, but also to feed data into Environmental Impact Assessments (EIA). The patchiness in time, space and scale of survey data make this a challenging task but the large amount of information available means that it could be a productive exercise.
Lack of Seasonal Information at an Appropriately Large Scale
For logistical reasons, large-scale surveys such as SCANS have been conducted during summer. Information is therefore lacking on large-scale seasonal changes in distribution. However, seasonal variation in distribution and abundance at a smaller spatial scale is available from some national survey programmes (e.g. Belgium, Denmark, France, the Netherlands, Germany). In some cases, these surveys are coordinated. To obtain better information about seasonal variation in distribution and abundance, consideration needs to be given to the extension to wider areas and to the better coordination of smaller-scale surveys in time and space. The Joint Cetacean Protocol initiative could also be valuable in this respect.
Human Influence on Cetacean Distribution and Abundance
For human activities that have a direct negative impact on cetaceans (e.g. removal by hunting, fisheries incidental bycatch, ship strikes) the impact on populations is, at least in theory, possible to assess. Hunting does not occur anymore in the Greater North Sea, Celtic Seas, or the Bay of Biscay and Iberian Coast. Fisheries incidental bycatch of harbour porpoises (Phocoena phocoena) is considered separately within the Intermediate Assessment 2017, but bycatch also occurs in other species, especially in common dolphins (Delphinus delphis) (e.g. Murphy et al., 2009). Ship-strikes of large cetaceans have been considered in a number of fora, including the particular problem of fast ferries. However, a lack of comprehensive data on population abundance and animals affected, among other things, makes even these direct impacts difficult to assess.
For indirect impacts, it is much more difficult to quantify the number of animals affected, and demonstrate cause and effect at a population level. Direct or indirect effects on cetaceans occur from a variety of human activities, including those generating underwater noise , prey depletion, habitat loss or degradation, chemical pollution and marine debris.
Arbelo, M., Los Monteros, A.E., Herráez, P., Andrada, M., Sierra, E., Rodríguez, F., Jepson, P.D. and Fernández, A. 2013. Pathology and causes of death of stranded cetaceans in the Canary Islands (1999–2005). Diseases of Aquatic Organisms 103:87–99.
ASCOBANS. 2013. Report of the Marine Debris Working Group. 20th ASCOBANS Advisory Committee Meeting Document AC20/Doc.3.4.2. Available at: http://www.ascobans.org/sites/default/files/document/AC20_3.4.2_Report_MarineDebris WG.pdf.
Bailey, H., Brookes, K.L. and Thompson, P.M. 2014. Assessing environmental impacts of off- shore wind farms: lessons learned and recommendations for the future. Aquatic Biosystems 10:1–13.
Baulch, S. and Perry, C. 2014. Evaluating impacts of marine debris ingestion and reporting interactions to the IWC. Working Document to the Scientific Committee of the IWC. SC/65b/E02, 19 pp.
Beineke, A., Siebert, U., McLachlan, M., Bruhn, R., Thron, K., Failing, K., Müller, G. and Baumgärtner, W. 2005. Investigations of the potential influence of environmental contaminants on the thymus and spleen of harbor porpoises (Phocoena phocoena). Environmental Science and Technology 39:3933–3938.
Bennett, P. M., Jepson, P. D., Law, R. J. Jones, B. R., Kuiken, T., Baker, J. R., Rogan, E. and Kirkwood, J. K. 2001. Exposure to heavy metals and infectious disease mortality in harbour porpoises from England and Wales. Environmental Pollution 112:33–40.
Berggren, P., Ishaq, R., Zebuhr, Y., Naf, C., Bandh, C. and Broman, D. 1999. Patterns and levels of organochlorines (DDTs, PCBs, non-ortho PCBs and PCDD/Fs) in male harbour porpoises (Phocoena phocoena) from the Baltic Sea, the Kattegat-Skagerrak Seas and the west coast of Norway. Marine Pollution Bulletin 38:1070–1084
Booth, CG, Embling, C, Gordon, J, Calderan, SV and Hammond, PS (2013). Habitat preferences and distribution of harbour porpoise Phocoena phocoena west of Scotland. Marine Ecology Progress Series 478: 273–285.
Buckland, S.T., Anderson, D.R., Burnham, K.P., Laake, J.L., Borchers, D.L., Thomas, L., 2001. Introduction to Distance Sampling: estimating abundance of biological populations. Oxford University Press.
CODA, 2009. Cetacean Offshore Distribution and Abundance in the European Atlantic (CODA), 43pp.
David, J.A. 2006. Likely sensitivity of bottlenose dolphins to pile-driving noise. Water and Environment Journal 20:48–54.
Davison, N. J., Perrett, L. L., Law, R. J., Dawson, C. E., Stubberfield, E. J., Monies, R. J., Deaville, R. and Jepson, P. D. 2011. Infection with Brucellaceti and high levels of polychlorinated biphenyls in bottlenose dolphins (Tursiops truncatus) stranded in south-west England. Veterinary Record, 1–6. doi: 10.1136/vr.d2714
EU (2013) Habitat Directive reporting Article 17 reporting progress portal http://ec.europa.eu/environment/nature/knowledge/rep_habitats/index_en.htm Accessed 21 September 2016
Evans, P. G. H. and Bjørge A. 2013. Impacts of climate change on marine mammals. Marine Climate Change Impacts Partnership (MCCIP) Annual Report Card 2011–2012 Scientific Review 1–34
Evans, P. G. H. and Nice, H. 1996. Review of the effects of underwater sound generated by seismic surveys on cetaceans. SeaWatch Foundation, Oxford. (Report commissioned by UKOOA)
Evans, P. G. H., Baines, M.E. and Anderwald, P. 2011. Risk Assessment of Potential Conflicts between Shipping and Cetaceans in the ASCOBANS Region. 18th ASCOBANS Advisory Committee Meeting Document AC18/Doc.6-04 (S) rev.1. Available at: http://www.ascobans.org/sites/default/files/basic_page_documents/AC18_6- 04_rev1_ProjectReport_ShipStrikes.pdf
Evans, P.G.H., Anderwald, P., and Baines, M.E. (2003), UK Cetacean Status Review. Report to English Nature and the Countryside Council for Wales. Sea Watch Foundation, Oxford. 160pp.
Fontaine, M.C., Tolley, K.A., Siebert, U., Gobert, S., Lepoint, G., Bouquegneau, J.-M., Das, K., 2007. Long-term feeding ecology and habitat use in harbour porpoises Phocoenaphocoena from Scandinavian waters inferred from trace elements and stable isotopes. BMC Ecol. 7, 1.
Gilles, A., Adler, S., Kashner, K., Scheidat, M., Siebert, U. 2011.Modelling harbour porpoise seasonal density as a function of the German Bight Environment: implications for management. Endangered Species Research. 14: 157-169
Gilles, A., Scheidat, M., Siebert, U., 2009. Seasonal distribution of harbour porpoise and possible interference of offshore wind fams in the German North Sea. Mar.Ecol.Prog. Ser. 383: 295-307.
Gilles, A., Viquerat, S., Becker, E.A., Forney, K.A., Geelhoed, S.C.V., Haelters, J., Nabe-Nielsen, J., Scheidat, M., Siebert, U., Sveegaard, S., van Beest, F.M., van Bemmelen, R. and Aarts, G., 2016. Seasonal habitat-based density models for a marine top predator, the harbor porpoise, in a dynamic environment. Ecosphere7 (6):e01367. 10.1002/ecs2.1367
Gordon, J. C. D., Gillespie, D., Potter, J., Frantzis, A., Simmonds, M. P., Swift, R. and Thompson, D. 2003. A Review of The effects of seismic surveys on marine mammals. Journal of the Marine Technology Society 37:41–53.
Haelters, J., Kerckhof, F., Jacques, T. G., Degraer, S., 2011. The harbour porpoise, Phocoenaphocoena in the Belgian part of the North Sea: trends in abundance and distribution. Belg. J. Zool. 141: 75-84
Hammond, P. S., Northridge, S. P., Thompson, D., Gordon, J. C. D., Hall, A. J., Murphy, S. N. and Embling, C. B. 2008. Background information on marine mammals for Strategic Environmental Assessment 8. Report to the Department for Business, Enterprise and Regulatory Reform. Sea Mammal Research Unit, St Andrews, Scotland, UK, 52 pp.
Hammond, P.S. et al., 2013. Cetacean abundance and distribution in European Atlantic shelf waters to inform conservation and management. Biological Conservation, 164: 107–122.
Hammond, P.S. et al., 2017. Estimates of cetacean abundance in European Atlantic waters in summer 2016 from the SCANS-III aerial and shipboard surveys. Report to ICES Working Group on Marine Mammal Ecology. 26pp.
Hammond, P.S., Berggren, P., Benke, H., Borchers, D.L., Collet, A., Heide-Jørgensen, M.P., Heimlich, S., Hiby,A.R., Leopold, M.F. & Øien, N. 2002. Abundance of harbour porpoises and other cetaceans in the North Sea andadjacent waters. Journal of Applied Ecology 39: 361-376.
Hammond, P.S., Macleod, K., Burt, L., Cañadas,A., Lens, S., Mikkelsen, B., Rogan, E., Santos, B., Uriarte, A., Van Canneyt, O., Vazquez, J.A. 2011. Abundance of baleen whales in the European Atlantic. Paper SC/63/RMP24 presented to the Scientific Committee of the International Whaling Commission. Unpublished.
Hammond, PS (1986). Estimating the size of naturally marked whale populations using capture-recapture techniques. Reports of the International Whaling Commission (Special Issue 8): 253-282.
Heinänen, S. and Skov, H. 2015. The identification of discrete and persistent areas of relatively high harbour porpoise density in the wider UK marine area, JNCC Report No.544 JNCC, Peterborough.
Hiby, A.R.and Lovell, P., 1998. Using aircraft in tandem formation to estimate abundance of harbour porpoise. Biometrics 54: 1280-1289.
Hiby, AR and Hammond, PS (1989). Survey techniques for estimating abundance of cetaceans. Reports of the International Whaling Commission Special Issue 11: 47-80.
Hiby, L., 1999. The objective identification of duplicate sightings in aerial survey for porpoise, in: Garner, G.W., Amstrup, S.C., Laake, J.L., Manly, B.F.J., McDonald, L.L.and Robertson, D.G. (Eds.), Marine Mammal Survey and Assessment Methods. Balkema, Rotterdam, pp. 179-189.
ICES, 2014a. Bycatch of small cetaceans and other marine animals - Review of national reports under Council Regulation (EC) No. 812/2004 and other published documents. Advice April 2014.AC21/Inf.3.1.b
ICES, 2014b. Report of the ICES / NAFO Joint working group on deep water ecology. 24-28 February 2014. 234 pp.
ICES, 2015. Report of the Working Group on Marine Mammal Ecology (WGMME),9-12 February 2015, London, UK. 108pp.
Isojunno, S., Matthiopoulos, J., and Evans, P.G.H. (2012) Harbour porpoise habitat preferences: Robust spatio-temporal inferences from opportunistic data. Marine Ecology Progress Series 448: 155-170.
Jepson, P. D., Deaville, R., Acevedo-Whitehouse, K., Barnett, J., Brownlow, A., Brownell Jr., R. L., Clare, F. C., Davison, N., Law, R. J., Loveridge, J., Macgregor, S. K., Morris, S., Murphy, S., Penrose, R., Perkins, M. W., Pinn, E., Seibel, H., Siebert, U., Sierra, U., Simpson, V., Tasker, M. L., Tregenza, N., Cunningham, A. A. and Fernández, A. 2013. What Caused the UK's Largest Common Dolphin (Delphinus delphis) Mass Stranding Event? PLoS One 8(4):e60953. doi:10.1371/journal.pone.0060953.
Jepson, P.D., Deaville, R. and Law, R.J. 2016. PCB pollution continues to impact populations of orcas and other dolphins in European waters. Scientific Reports 6: 18573.
JNCC (Joint Nature Conservation Committee). 2013. Third Report by the UK under Article 17 on the implementation of the Habitats Directive from January 2007 to December 2012. Peterborough: JNCC. Available from: www.jncc.gov.uk/article17.
Laist, D. W. 1997. Impacts of marine debris: entanglement of marine life in marine debris including a comprehensive list of species with entanglement and ingestion records. In: Coe, J.M., Rogers, D.B. (Eds.), Marine Debris: Sources, Impacts and Solutions. Springer Verlag, New York, NY, pp. 99–140.
Laist, D. W., Knowlton, A. R., Mead, J. G., Collet, A. S. and Podesta, M. 2001. Collisions be- tween ships and great whales. Marine Mammal Science 17:35–75.
Laist, D.W. 1987. Overview of the biological effects of lost and discarded plastic debris in the marine environment. Marine Pollution Bulletin 18:319–326.
Laran, S., Authier, M., Blanck, A., Doremus, G., Falchetto, H., Monestiez, P., Pettex, E., Stephan, E., Van Canneyt. O. and Ridoux, V. (in press). Seasonal distribution and abundance 1 of cetaceans within French waters: Part II: The Bay of Biscay and the English Channel. Deep Sea Research II.
Law, R. J., Barry, J., Barber, J. L., Bersuder, P., Deaville, R., Reid, R. J., Brownlow, A., Penrose, R., Barnett, J., Loveridge, J., Smith, B. and Jepson, P. D. 2012. Contaminants in cetaceans from UK waters: Status as assessed within the Cetacean Strandings Investigation Programme from 1990 to 2008. Marine Pollution Bulletin 64:1485–1494.
Lusher, A. L., Hernandez-Milian, G., O'Brien, J., Berrow, S., O'Connor, I. and Officer, R. 2015. Microplastic and macroplastic ingestion by a deep diving, oceanic cetacean: The True's beaked whale Mesoplodon mirus. Environmental Pollution 199:185–191.
MacLeod, C.D. et al., 2008. Temperature-based summer habitat partitioning between white-beaked and common dolphins around the United Kingdom and Republic of Ireland. Journal of the Marine Biological Association of the United Kingdom, 88(06): 1193–1198.
MAGRAMA. 2012. Estrategias Marinas: Evaluación Inicial, Buen Estado Ambiental y Objetivos Ambientales. Ministerio de Agricultura, Alimentación y Medio Ambiente, 287 pp. http://www.magrama.gob.es/es/costas/temas/estrategias- marinas/0_documento_marco_estrategias_marinas_tcm7-204388.pdf.
Marubini, F., Gimona, A., Evans, P.G.H., Wright, P.J. and Pierce, G.J. (2009) Habitat preferences and interannual variability in occurrence of the harbour porpoise Phocoena phocoena in the north-west of Scotland. Marine Ecology Progress Series 381: 297-310.
Méndez-Fernandez, P., Websterd, L., Chouvelon, T., Bustamante, P., Ferreira, M., González, A. F., López, A., Moffat, C. F., Pierce, G. J., Read, F. L., Russell, M., Santos, M. B., Spitz, J., Vingada, J. V. and Caurant, G. 2014a. An assessment of contaminant concentrations in toothed whale species on the NW Iberian Peninsula: Part I. Persistent organic pollutants. Science of the Total Environment 484:196–205.
Méndez-Fernandez, P., Websterd, L., Chouvelon, T., Bustamante, P., Ferreira, M., González, A. F., López, A., Moffat, C. F., Pierce, G. J., Read, F. L., Russell, M., Santos, M. B., Spitz, J., Vingada, J. V. and Caurant, G. 2014b. An assessment of contaminant concentrations in toothed whale species on the NW Iberian Peninsula: Part II. Trace element concentrations. Science of the Total Environment 484:206–217.
Murphy S, Barber JL, Learmonth JA, Read FL, Deaville R, Perkins MW, et al. 2015. Reproductive Failure in UK Harbour Porpoises Phocoena phocoena: Legacy of Pollutant Exposure? PLoS ONE 10(7): e0131085.
Murphy, S., Pinn, E.H. and Jepson, P.D. (2013). The short-beakedcommon dolph in(Delphinus delphis) in the North-Eastern Atlantic: distribution, ecology,management and conservation status. Oceanography and Marine Biology: An Annual Review, 51: 193-280.
Murphy, S., Winship, A., Dabin, W., Jepson, P.D., Deaville, R., Reid, R.J., Spurrier, C., Rogan, E., Lopez, A., Gonzalez, A.F., Read, F.L., Addink, M., Silva, M., Ridoux, V., Learmonth, J.A., Pierce, G.J., Northridge, S.P., 2009. Importance ofbiological parameters in assessing the status of Delphinus delphis. Mar. Ecol. Prog. Ser. 388: 273–291.
Øien, N. 1999. Report of the Norwegian 1998 sighting survey for minke whales. Paper SC/51/RMP12 submitted to the Scientific Committee of the International Whaling Commission.
Øien, N. 2005. Report of the Norwegian 2004 sighting survey for minke whales. Paper SC/57/O10 submitted to the Scientific Committee of the International Whaling Commission.
Øien, N. 2010. Report of the Norwegian 2009 sighting survey for minke whales. Paper SC/62/RMP7 submitted to the Scientific Committee of the International Whaling Commission.
OSPAR, 2012. MSFD Advice Manual and Background Document on Biodiversity A living document - Version 3.2 of 5 March 2012. http://www.ospar.org/documents/dbase/publications/p00581/p00581_advice%20document %20d1_d2_d4_d6_biodiversity.pdf
Panigada, S. et al., 2008. Modelling habitat preferences for fin whales and striped dolphins in the Pelagos Sanctuary (Western Mediterranean Sea) with physiographic and remote sensing variables. Remote Sensing of Environment, 112(8), pp.3400–3412.
Panigada, S., Pesante G., Zanardelli, M., Capoulade, F., Gannier, A., and Weinrich, M. T. 2006. Mediterranean fin whales at risk from fatal ship strikes. Marine Pollution Bulletin 52:1287– 1289.
Paxton, C.G.M., Scott-Hayward, L., Mackenzie, M., Rexstad, E. and Thomas, L. 2016. Revised Phase III Data Analysis of Joint Cetacean Protocol Data Resources with Advisory Note, JNCC Report 517, ISSN 0963-8091
Peschko, V.; Ronnenberg, K.; Siebert, U.; Gilles, A. (2016). Trends of Harbour Porpoise (Phocoena phocoena) Density in the Southern North Sea. Ecological Indicators 60: pp. 174-183.
Pierpoint, C. (2008) Harbour porpoise (Phocoena phocoena) foraging strategy at a high energy near-shore site in south-west Wales, UK. Journal of the Marine Biological Association of the United Kingdom 88:1167–1173.
Reid, J.B., Evans, P.G.H. and Northridge, S.P., 2003. Atlas of Cetacean distribution in north-west European waters, Joint Nature Conservation Committee.
Rogan, E., Canadas, A., Macleod, K., Santos, B., Mikkelsen, B., Uriarte, A., Van Canneyt, O., Vazquez, J.A., Hammond, P.S. (2017). Distribution, abundance and habitat use of deep diving cetaceans in the North East Atlantic. Deep Sea Research II.
Scheidat, M., Gilles, A., Kock, K-H., Siebert, U., 2008. Harbour porpoise Phocoena phocoena abundance in the southwestern Baltic Sea. Endangered Species Research 5: 215-223.
Scheidat, M., Verdaat, H. and Aarts, G., 2012, Using aerial surveys to estimate density and distribution of harbour porpoises in Dutch waters. Journal of Sea Research 69: 1-7.
Silva, M.A., Machete, M., Reis, D., Santos, M., Prieto, R., Dâmaso, C., Pereira, J.G. and Santos, R.S., 2011. A review of interactions between cetaceans and fisheries in the Azores. Aquatic Conservation: Marine and Freshwater Ecosystems, 21(1): 17-27.
Solvang, H.K., Skaug, H.J. and Øien, N.I. 2015. Abundance estimates of common minke whales in theNortheast Atlantic based on survey data collected over theperiod 2008-2013. Paper SC/66a/RMP8 presented to the IWC Scientific Committee.
Sveegaard, S., Galatius, A., Dietz, R., Kyhn, L., Koblitz, J.C., Amundin, M., Nabe-Nielsen, J., Sinding, M.-H.S., Andersen, L.W., Teilmann, J., 2015. Defining management units for cetaceans by combining genetics, morphology, acoustics and satellite tracking. Glob. Ecol. Conserv. 3, 839–850. doi:10.1016/j.gecco.2015.04.002
Viquerat, S., Herr, H., Gilles, A., Peschko, V., Siebert, U., Sveegaard, S., Teilmann, J. (2014) Abundance of harbourporpoises (Phocoena phocoena) in the western Baltic, Belt Seas and Kattegat. Mar Biol 161: pp. 745 – 754 doi:10.1007/s00227-013-2374-6
Waring, G.T., Palka, D.L. and Evans, P.G.H. 2009. North Atlantic Marine Mammals. Pp. 763-771. In: Encyclopedia of Marine Mammals (Editors W.F. Perrin, B. Würsig and J.G.M. Thewissen). 2nd edition. Academic Press, San Diego.
WDCS. 2011. Marine Debris and Cetaceans. Report of the Whale and Dolphin Conservation Society.
Wilson, B., Batty, R. S., Daunt, F. and Carter, C. 2007. Collision risks between marine renewable energy devices and mammals, fish and diving birds. Report to the Scottish Executive. Scottish Association for Marine Science, Oban, Scotland, PA37 1QA.