

Répartition des sons impulsifs notifiés
D11 - Introduction d’énergie, y compris de sources sonores sous-marines
D11.1 - Répartition temporelle et spatiale des sons impulsifs à haute fréquence, moyenne fréquence et basse fréquence
Message clé:
Les données de 2015 sur les bruits impulsifs sont disponibles pour un nombre limité de pays et de sources de bruit. Les sources prédominantes sont: les études sismiques dans la mer du Nord septentrionale et l’Atlantique oriental; les explosions et le battage de pieux dans la mer du Nord méridionale et les sonars navals dans les mers Celtiques et la Manche occidentale. Le nombre de ces activités varie grandement au sein de ces régions.
Zone Évaluée
Récapitulatif Imprimable
Contexte
OSPAR s’efforce de maintenir l’introduction d’énergie, y compris les bruits sous-marins, à des niveaux n’ayant pas d’impact négatif sur le milieu marin. Le son est soit un sous-produit des activités humaines dans le milieu marin (par exemple navigation ou construction), soit intentionnel aux fins des enquêtes sur le sol marin et la colonne d’eau. Le terme « bruit » dans le présent document remplace le terme « son » lorsqu’il peut potentiellement y avoir des impacts négatifs sur le milieu vivant marin.
L’introduction de sons anthropiques s’est répandue avec le développement de la navigation motorisée et ils proviennent désormais d’un grand éventail de sources. Les sources de sons anthropiques peuvent être impulsives ou constantes. Cette évaluation se penche sur les sources impulsives de bruit qui comprennent notamment le battage percussif de pieux pour les constructions côtières et offshore (Figure 1), les études sismiques (utilisant des armes à air comprimé) afin d’inspecter les gisements d’hydrocarbures et de gaz dans le sous-sol marin, les explosions et certains sources sonars.
On a constaté que les sources impulsives de bruit peuvent causer le déplacement temporaire de petits cétacés (par exemple le marsouin commun), augmenter le stress physiologique de certaines espèces halieutiques (par exemple le bar commun) et causer des malformations des larves d’invertébrés. On a constaté les effets sur des animaux individuels pour un certain nombre d’espèces mais le fait que les effets des sons sur les individus se répercutent éventuellement sur les populations ou à l’échelle des écosystèmes et la manière dont ils se manifestent causent des incertitudes. Cette évaluation a pour but d’évaluer la quantité et la répartition des sources de sons impulsifs dans l’ensemble de la zone maritime OSPAR. Il s’agit de la première évaluation des pressions anthropiques exercées par les sons impulsifs dans la zone maritime OSPAR et ces données permettront de réaliser des évaluations futures du risque d’impact sur la vie marine.
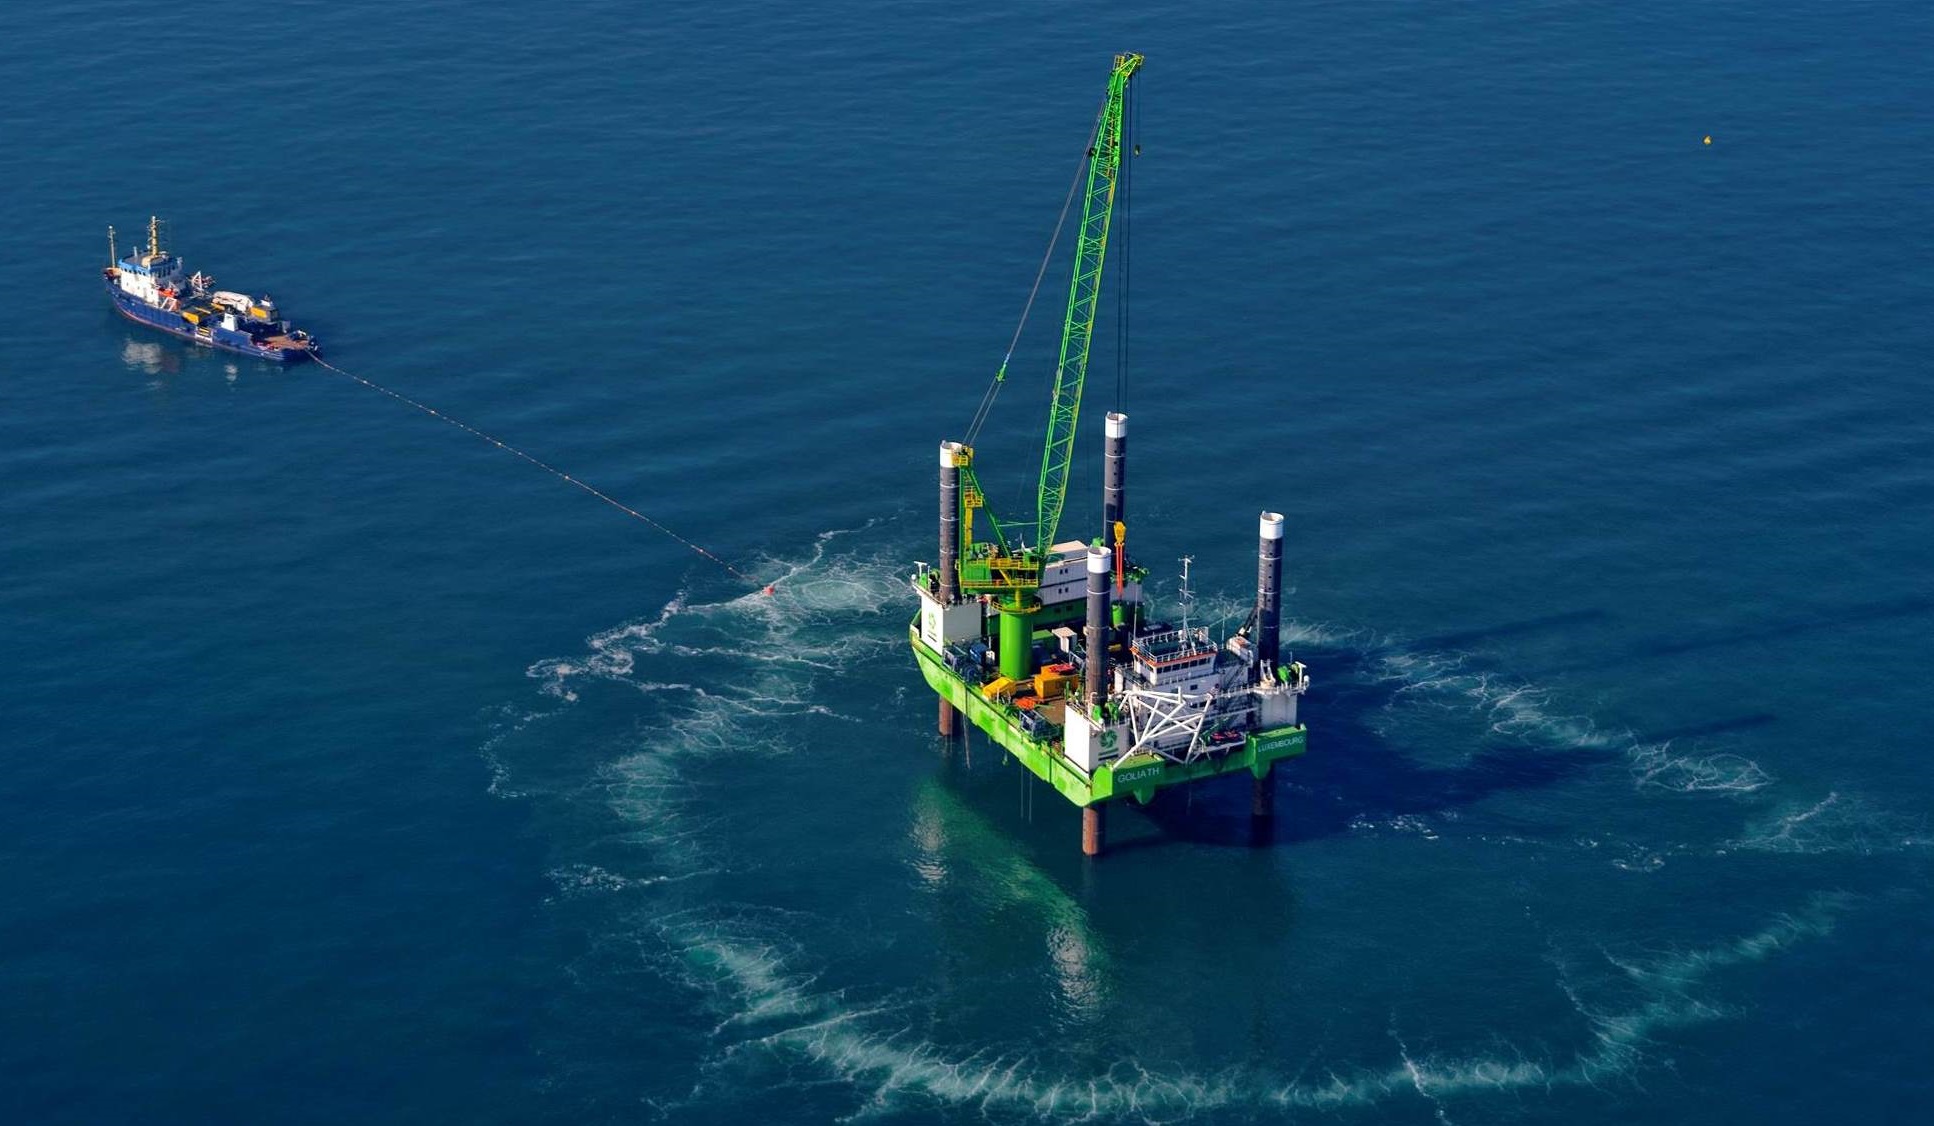
Figure 1: Battage de pieux avec rideau de bulles. Copyright: Trianel/Lang
Human activities introduce many types of energy into the marine environment including sound, light and other electromagnetic fields, heat and radioactive energy. Of these, the most widespread and pervasive is underwater sound. It is likely that the amount of underwater sound has been increasing since the advent of steam driven ships although there have been very few studies to quantify any such increase in the OSPAR Maritime Area.
Anthropogenic sound is commonly known as noise, but for the purposes of this assessment the term ‘noise’ is used only in relation to sound that has the potential to cause negative impacts on marine life. The term ‘sound’ is used to refer to the acoustic energy radiated from a vibrating object, with no particular reference to its function or potential effect. ‘Sounds’ include both meaningful signals and ‘noise’ which may have either no particular impact or may have a range of adverse effects. The term ‘noise’ is only used where adverse effects are specifically described, or when referring to specific technical distinctions such as ‘masking noise’ and ‘ambient noise’. (Van der Graaf et al., 2012).
Sound sources can be categorised as continuous or impulsive. Impulsive sounds are of short duration and with a rapid onset (e.g. explosions, pile driving, seismic airguns, sonar), while continuous sounds are long lasting and do not have pulse characteristics (e.g. shipping, dredging). Impulsive sounds may be repeated at intervals (e.g. pile driving), and at distance will become diffused and may have a more continuous nature. High frequency sounds propagate less well in the marine environment than low frequency sounds, which can travel far in waters that are sufficiently deep.
Marine organisms that are exposed to anthropogenic sound (e.g. harbour porpoise Phocoena phocoena, see figure a; and European seabass, Dicentrarchus labrax; see figure b) can be adversely affected over short timescales (acute effect) and over longer periods. Adverse effects may be subtle (e.g. temporary reduction in hearing sensitivity, physiological stress) or obvious (e.g. overt behavioural responses, death). While there is a growing body of literature on the potential effects of anthropogenic sound on individual animals (Williams et al., 2015), obtaining direct observations of the effects of anthropogenic sound on particular ecosystems or populations is challenging. As such, there is uncertainty over whether and how effects on individuals are translated to the population or ecosystem scale.
Descriptor 11 of the EU Marine Strategy Framework Directive (2008/56/EC) contains two Indicators of Good Environmental Status (GES) in European waters: Indicator 11.1.1 on “low- and mid-frequency impulsive sounds” and Indicator 11.2.1 on “continuous low frequency sound”. At present, there are no quantitative targets for GES, and the two indicators serve as surveillance indicators of anthropogenic pressure. OSPAR has adopted indicator 11.1.1 as an OSPAR indicator, which is the subject of this assessment. This is a pressure indicator based on the spatio-temporal distribution of low-frequency and mid-frequency impulsive sound sources within the OSPAR Maritime Area.
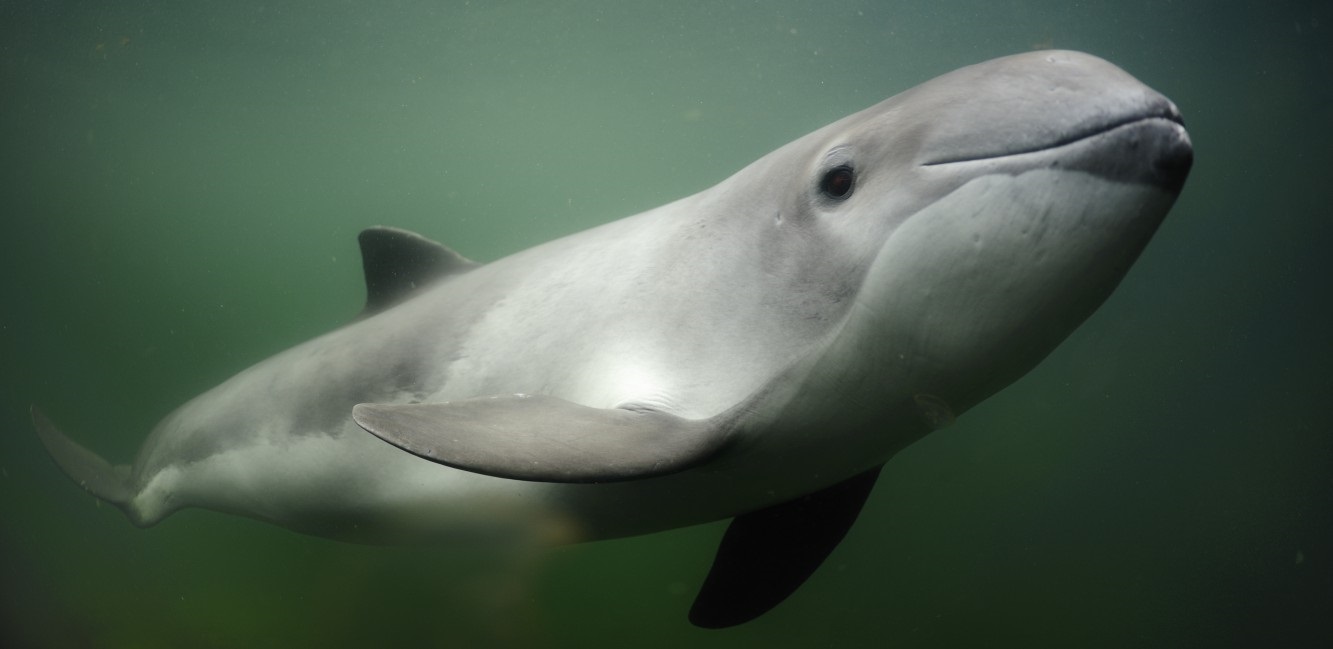
Figure a: Harbour porpoise (Phocoena phocoena). Copyright: Solvin Zankl

Figure b: European seabass (Dicentrarchus labrax). Copyright: Citron
Data were obtained from the Impulsive Noise Registry (INR), which was developed for OSPAR by ICES, in 2016, to hold data on impulsive sound activities. The registry accords with the guidelines from the EU Technical Group on Underwater Noise (adopted by OSPAR in 2014; OSPAR Agreement 2014-08), and is maintained by ICES. Initially, this registry was supported by OSPAR alone, but is now also used by HELCOM and may be used by other Regional Seas Conventions in the future. Data have been uploaded for several countries and this process is expected to continue. The database collates the data in a standard format and in accordance with the data requirements for the OSPAR Impulsive Noise Indicator (OSPAR, 2014).
This assessment uses data from 2015 (see Table a for the countries reporting for this period are a summary of the data types). Data submitted after the reporting deadline (e.g. data on explosions from Sweden) were too late to be included in the present assessment.
| Contracting Party | Seismic Surveys | Pile Driving | Explosions | Sonar and Acoustic deterrents | No impulsive noise in 2015 | Generic Explicitly Impulsive Sources |
|---|---|---|---|---|---|---|
| Belgium | X | |||||
| Denmark | X | |||||
| Germany | X | |||||
| Netherlands | X | X | ||||
| Sweden | X | |||||
| UK | X | X | X |
The OSPAR Impulsive Noise Indicator is defined as follows:
Distribution in time and place of loud, low and mid frequency impulsive sounds – proportion of days and their distribution within a calendar year over areas of a determined surface, as well as their spatial distribution, in which anthropogenic sound sources exceed levels that are likely to entail significant impact on marine animals measured as Sound Exposure Level [SEL] (in dB re 1µPa2.s) or as peak Sound Pressure Level [SPLpeak] (in dB re 1 µPa peak) at one metre, measured over the frequency band 10 Hz to 10kHz. (OSPAR, 2014)
In other words, the Indicator records the number of days within a specified spatial unit in which anthropogenic impulsive sound occurred in a given calendar year. Only sound sources above a specified intensity level are included. These levels are detailed in the technical specification of the Impulsive Noise Indicator (OSPAR, 2014). The spatio-temporal unit used in the assessment is termed Pulse Block Day. The spatial component of the Pulse Block Day is the ICES statistical sub-rectangle (hereafter ICES sub-block), which is defined in a standard way throughout the OSPAR Maritime Area, and provides detailed resolution at the regional scale.
In addition to Pulse Block Days of activity as defined in the OSPAR Impulsive Noise Indicator, this assessment provides visualisations of the intensity of the activities recorded in the Impulsive Noise Registry. The intensity of impulsive sound sources was categorised according to intensity levels defined in the OSPAR Impulsive Noise Indicator specification (OSPAR, 2014) for explosions, seismic airgun arrays, pile driving, sonar, and acoustic deterrent devices. Contracting Parties have the option of reporting in terms of these categories (Very Low / Low / Medium / High / Very High) can be optionally reported by Contracting Parties, although these data may not be available in all cases (i.e. naval sonar). The use of source mitigation measures (e.g. bubble curtains) can also be reported to the Impulsive Noise Registry.
Issues associated with spatial units
Several different spatial units are used by Contracting Parties to record impulsive sound activity. In some cases, point source data are provided, giving an unambiguous location for the activity, which can then be readily attributed to an ICES sub-block for the purposes of the assessment. In other cases, activities are licensed within a specified area (e.g. seismic survey licensing blocks), and data are provided as polygons within which activity occurred. Polygon data presented a logistical challenge for this assessment because they do not align with ICES sub-blocks and differently sized polygons are used by Contracting Parties for different activities within the OSPAR Maritime Area. For the purposes of this assessment, all ICES sub-blocks which overlap with a given polygon of activity were considered to contain the pulse block days allotted to the polygon. This yields an over-estimation of spatial coverage, because even slight overlap with an adjacent ICES sub-block results in the activity being recorded throughout that block. This is illustrated in Figure c, which uses the example of UK sonar activity recorded in the Celtic Seas. An alternative approach would be to define a minimum threshold of overlap for an ICES sub-block to be included
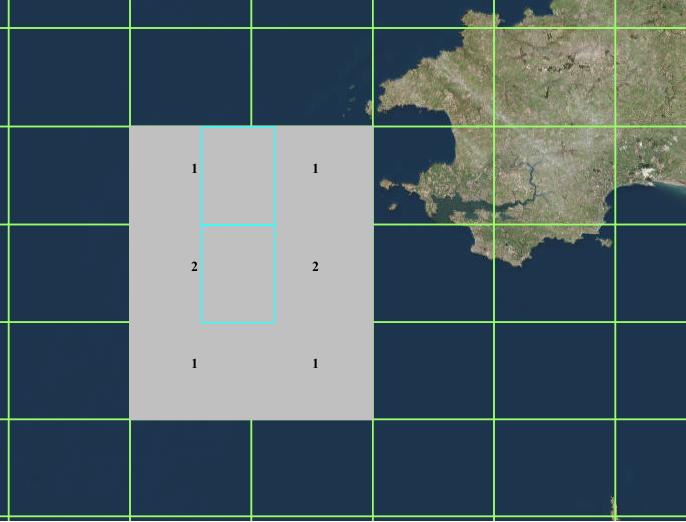
Figure c: Pulse block days (grey boxes with number of pulse block days within) attributed to one day of sonar activity recorded in two UK licensing blocks (blue rectangles).
The green grid represents ICES statistical sub-rectangles; the spatial unit for pulse block days in this assessment. Slight overlap between the UK licensing blocks and the ICES statistical sub-rectangles amplifies the apparent spatial scale of activity, resulting in a conservative assessment.
Issues associated with source intensity
Although the intensity of sources was identified as important additional information for the OSPAR Impulsive Noise Indicator, this information is only available for some sound-generating activities. There may be reasons why actual source levels cannot be made available, for example reasons of national security (such as concerning operational naval sonars), in which case the source level is either not specified or only an indication of category is available. The decision as to whether source level (or an indication thereof) is made available is at the discretion of individual countries.
Résultats
L’Allemagne, la Belgique, le Danemark, les Pays-Bas, le Royaume-Uni et la Suède ont communiqué des données pour 2015 sur quatre sources de sons (études sismiques, battage de pieux, explosions, sonars et systèmes acoustiques dissuasifs). La répartition de ces sources de son impulsif est évaluée par journées de son impulsif par bloc, c’est-à-dire le nombre de jours dans une année calendaire durant lesquels des activités produisant des sons impulsifs ont lieu dans une zone particulière (sous-rectangle statistique du CIEM). La figure 2 montre la répartition du nombre total de journées de sons impulsifs en 2015, basée sur les données actuellement disponibles dans le registre OSPAR des bruits impulsifs. Il s’agit d’une évaluation partielle car des données ne sont pas disponibles pour toutes les activités et Parties contractantes pour cette année préliminaire d’évaluation. Des sources de sons impulsifs ont été notifiées dans l’ensemble de la mer du Nord septentrionale, jusqu’au Skagerrak, dans les eaux profondes à l’ouest de l’Ecosse et au sud-ouest de l’Angleterre. Les activités notifiées étaient plus rares dans la mer du Nord méridionale et les mers Celtiques. En 2015, dans certaines zones de la mer du Nord septentrionale des études sismiques ont eu lieu sur 146 jours au maximum. Des explosions et des battages, dans le cadre de parcs éoliens, ont été plus prédominants dans la mer du Nord méridionale. Les sonars sont le type de source prédominante notifiée pour la Manche. occidentale.

Figure 2: Nombre total de journées de bruits impulsifs par bloc notifiés pour 2015.
Des informations sur l’intensité des sources impulsives sont également enregistrées, selon leur disponibilité, en plus de la présence de types spécifiques d’activités produisant des sons. On classe l’intensité relative des sources de bruit selon cinq catégories (allant de très faible à très élevée). Cette catégorisation se réfère à l’intensité des sources et pas nécessairement aux impacts. L’intensité de toutes les sources notifiées est cependant supérieure à un niveau spécifié susceptible d’avoir un impact potentiel sur les organismes marins (y-compris la catégorie « très faible »). La Figure 3 montre la proportion des activités correspondant à chaque catégorie d’intensité dans la mer du Nord au sens large. On ne relève qu’une seule source de bruit appartenant à la catégorie « très élevée » dans la zone maritime OSPAR, il s’agit d’une explosion dans la mer du Nord méridionale. Aucune information sur l’intensité n’a cependant été notifiée sur 293 (29%) manifestations. L’utilisation de blocs normalisés (sous-rectangles statistiques du CIEM) et d’informations sur l’intensité des sources permet d’avoir un aperçu des zones où se produisent la plupart des sons impulsifs notifiés. Elle permet également d’inclure l’application de mesures d’atténuation des sources. On s’attend à des fluctuations, d’une année à l’autre, des activités produisant des sons. Cette évaluation préliminaire présente des données partielles pour 2015 et on prévoit qu’une série de données plus exhaustive sera disponible pour les évaluations futures.
La méthodologie inspire une confiance modérée et la disponibilité des données une confiance faible.
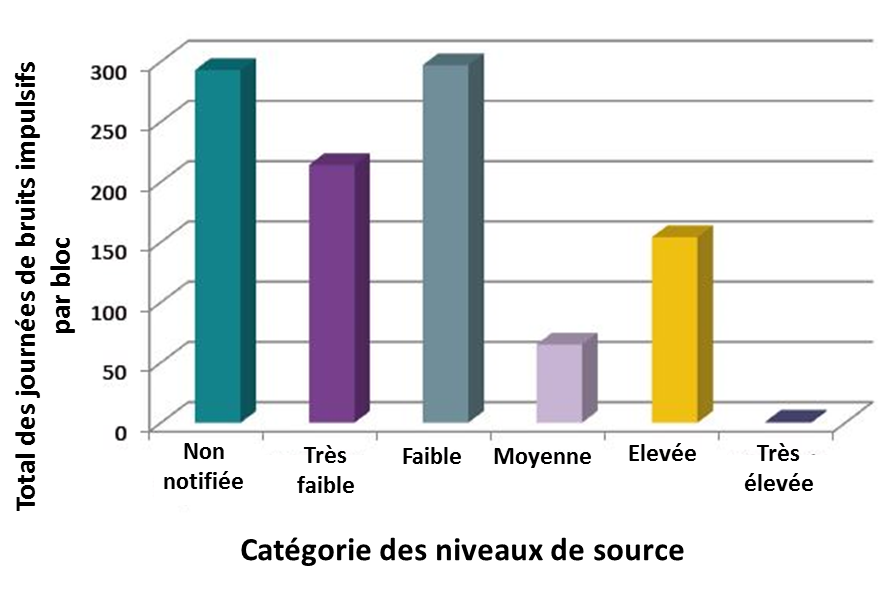
Figure 3: Journées de sons impulsifs par bloc par catégorie de source pour la mer du Nord au sens large.
Les catégories de sources décrivent l’intensité relative des sources de bruits. Toutes les sources figurant dans le registre sont d’un niveau supérieur à un niveau d’intensité spécifié que l’on considère avoir un impact potentiel sur les organismes marins (y-compris la catégorie « très faible).
Figures d-i indicate the distribution and number of pulse block days for each source intensity category by ICES sub-block. Activities with Low and Very Low source categories (Figure d and Figure e) covered larger and more contiguous areas than those categorised as Medium to Very High, which were sparser and more concentrated (Figures f-h). Some data were not reported with an associated intensity category (Figure i): the activity shown in the Celtic Seas was naval sonar activity, for which source intensity categories were not available, while the remainder of the UK data were licensed geophysical survey activity, with intensity data reported on a voluntary basis by applicants. Figure j outlines the different activity type of pulse block days reported for 2015 (i.e. air gun arrays, explosions, impact pile drivers and sonar or acoustic deterrents). Reported activity was sparser in the Southern North Sea and Celtic Seas. In the Northern North Sea seismic surveys (using airguns) were prevalent, while in the southern North Sea explosions and piling for wind farms were the main activities. In the Western English Channel sonar was the predominant source type reported.
There is a moderate confidence in the methodology used. The methodology is based on the pulse block days as outlined in EU guidance for impulsive noise monitoring (OSPAR, 2014). Further work is needed to refine this methodology to translate the activity data, outlined in polygons, into the common pulse blocks days format.
There is low confidence in the data availability for this impulsive noise assessment As this is a new indicator, 2015 was the first year of data submission. As a result, data were only reported by some countries, for one year and for a selection of the possible sources. Data availability for future years will improve with continued annual reporting.
Figure d: Pulse block days reported in 2015 with source category Very Low.
Figure e: Pulse block days reported in 2015 with source category Low.
Figure f: Pulse block days reported in 2015 with source category Medium.
Figure g: Pulse block days reported in 2015 with source category High.
Figure h: Pulse block days reported in 2015 with source category Very High.
Figure i: Pulse block days reported in 2015 with source category not reported
Figure j: Activity type of pulse block days reported for 2015
Conclusion
Cette première évaluation de l’indicateur des bruits impulsifs OSPAR révèle la répartition et l’intensité des activités notifiées dans la zone maritime OSPAR en 2015. L’évaluation fournit les premières informations détaillées sur la répartition des sources de sons impulsifs notifiées au niveau régional. Les activités notifiées sont plus prédominantes dans la mer du Nord septentrionale et orientale, à l’ouest de l’Ecosse et dans le Skagerrak et consistent principalement en études sismiques. Les sources de son dont l’intensité est considérée « faible » ou « très faible » sont plus courantes que celles dont l’intensité est « élevée ». Il est fort probable que cette répartition varie d’une année à l’autre, selon les activités entreprises. A l’avenir, une notification plus exhaustive devrait aboutir à de meilleures évaluations des pressions exercées par la production de sons impulsifs dans la zone maritime OSPAR. Cette évaluation met en évidence les zones où les animaux marins, s’ils sont présents, pourraient avoir été affectés (en 2015) bien que la présence des effets dépende également de la répartition et de la sensibilité des organismes marins aux sons. La possibilité et les conséquences des effets des sons impulsifs ne sont pas évaluées. On prévoit cependant des travaux visant à développer plus avant des indicateurs pour évaluer le risque d’impact provenant de ces sources.
This assessment uses the Impulsive Noise Registry to assess the OSPAR Impulsive Noise Indicator, using data available from the first year of reporting (2015). Only partial data were provided by each of the contributing Contracting Parties (Belgium, Denmark, Germany, the Netherlands, Sweden and the UK), so the assessment cannot be considered comprehensive. The pressure from seismic surveys covers large contiguous areas of pulse blocks in the Northern and Eastern North Sea and the North-eastern Atlantic, while pressure from explosions and pile driving activity was scattered throughout the Southern North Sea. The only naval sonar activity reported was in the Western English Channel and Southern Celtic Seas. More complete reporting in future years should enable a more comprehensive assessment of activity, which will inform Contracting Parties of activity levels at a regional scale. This will include spatio-temporal trends in the distribution and intensity of activity.
This assessment is pressure-based and describes the distribution of impulsive sound sources in the OSPAR Maritime Area. The use of pulse block days provides a link between the activity reported in the Impulsive Noise Registry and the maps produced for this assessment, and the inclusion of intensity categories provides further detail of the relative pressure exerted by each activity. The assessment highlights the locations of sources around which marine animals could potentially have been affected (in 2015), although the occurrence of effects will also depend on the distribution of marine organisms and their susceptibility to sound exposure. The likelihood and consequences of effects on marine organisms arising from exposure to impulsive sounds are not assessed in this assessment. Work to develop further Indicators to assess the risk of impact from these sound sources on marine species is planned.
Lacunes des connaissances
Pour s’assurer de la cohérence à travers les types de sources, on devrait se pencher de nouveau sur les définitions des catégories d’intensité des sources. Il s’agit notamment d’inclure une réduction de l’intensité des sources provenant de technologies d’atténuation. Une meilleure notification à l’avenir permettra également d’évaluer les effets cumulatifs.
Les effets des sons anthropiques sur des espèces particulières sont mieux compris depuis quelques années. Il est cependant difficile d’obtenir des relevés directs des effets des sons anthropiques sur des écosystèmes ou des populations particulières. Moyennant quoi, il existe des incertitudes sur la question de savoir si, et comment, les effets du son sur les individus se manifestent au niveau des populations ou à l’échelle des écosystèmes.
Knowledge gaps in relation to the Impulsive Noise Indicator
Issues have been identified with the conversion of polygon data provided by Contracting Parties into ICES sub-blocks, which are the standardised spatial unit used for this assessment (see also Assessment Method). For example, in the UK, seismic surveys are licensed in licensing blocks which do not correspond to ICES statistical sub-rectangles, resulting in a substantial over-estimation of the pulse block area (see Figure c). Similarly, naval (i.e. sonar) data are provided as polygon areas, rather than discrete points. The current data conversion protocol is to consider any overlap in polygons to apply to the whole pulse block, which results in considerable over-estimation in some cases. Applying a threshold for overlap in the conversion of polygons to pulse blocks could make this conversion more accurate.
A further issue is the definition of the source intensity categories used to classify the relative pressure exerted by different sources. The source level categories currently used are based on the advice of the EU Technical Group on Underwater Noise (Dekeling et al., 2014), and should be further developed to improve the categorisation across source type. A further limitation is that the effect of source mitigation measures (such as bubble curtains deployed to reduce sound output from pile driving activities) cannot readily be applied to the categories as they are currently defined. This limits the accuracy of the data reported in the OSPAR Impulsive Noise Registry, but could be addressed by redefining all source type categories according to sound source level.
The scope of this assessment is to assess human pressure on the marine environment from impulsive sound sources. However, it is recognised that future OSPAR work will seek to address the risk of impact from impulsive sound sources on marine organisms. Some of the broader challenges facing this work are outlined below.
Broader scientific knowledge gaps in assessing impulsive sound impacts
The objective of the North East Atlantic Environment Strategy (OSPAR Agreement 2010‑03) is to aim to keep the introduction of energy, including underwater noise, at levels that do not adversely affect the marine environment. However, there is a lack of direct evidence on the effects of anthropogenic sound at the population and ecosystem scale, which confounds target setting (Cefas, 2015). Nevertheless, due to the growing number of studies documenting the effects of anthropogenic sound on individual marine species the potential for large-scale effects should be considered (NRC, 2005), in line with the precautionary principle.
The direct observation of population and ecosystem-scale effects will require detailed long-term studies which are able to distinguish the effects of anthropogenic sound from the effects of other anthropogenic stressors or natural factors. In the meantime, studies which examine the effects of anthropogenic sound on, for example, aspects of ecosystem functioning (nutrient cycling; Solan et al., 2016) or food web dynamics (predator-prey interactions; Simpson et al., 2016) can investigate the mechanisms by which anthropogenic sound may affect marine ecosystems.
A further knowledge gap is that many of the individual-based studies of the effects of anthropogenic sound have been carried out under laboratory conditions. Further studies of in situ responses to impulsive sound are needed (e.g. DeRuiter et al., 2013; Debusschere et al., 2015), particularly for fish and marine invertebrates, as well as studies on the applicability of laboratory studies to wild populations.
Some studies (e.g. DeRuiter et al., 2013; Pirotta et al., 2015b) have shown that sound level can be a poor predictor of behavioural responses, and that other parameters (such as distance to source) may be more relevant. This issue is important for the prediction of impact, since an understanding of the mechanisms leading to disturbance is needed to make valid forecasts (i.e. when deriving dose-response relationships). Studies to further investigate the mechanisms behind behavioural responses are needed to clarify the roles of such parameters (Ellison et al., 2012).
Next steps for OSPAR
In addition to the pressure-based OSPAR Impulsive Noise Indicator, OSPAR aims to investigate the development of further indicators that assess the potential impact of impulsive noise. There are currently no ecosystem-based assessment techniques for anthropogenic sound, which would allow full assessment of the Indicator criterion (“Introduction of energy, including underwater noise, is at levels that do not adversely affect the marine environment”; OSPAR, 2014). Nevertheless, frameworks have been developed (e.g. NRC, 2005; Thompson et al., 2013; BMUB, 2014; Heinis and de Jong, 2015; Maglio et al., 2015; see also the case study in Ecosystem Assessment Outlook – Developing an Approach) to assess the potential impact of anthropogenic sound on particular species, such as spatial risk-assessment approaches and population modelling. OSPAR will review whether and how such frameworks can help the assessment of impulsive sound impacts on populations and the ecosystem.
Spatial risk assessment approaches include combining sound source distributions (e.g. pulse block days, or activity; Maglio et al., 2015) or modelled sound maps (based on propagation modelling) with distributions of particular species. The study of sound propagation is well established and understood at the small scale, and need not present a significant level of uncertainty if carried out according to best practice and with sufficient data (Farcas et al., 2016). Work is currently being undertaken to validate modelling of sound propagation over large distances. Taking considerations on validation into account, acoustic modelling can be used to map sound levels to better understand the exposure of marine organisms. This would require specific acoustic receptors, such as acoustically sensitive animals, and could provide greater understanding of impact (Ainslie et al., 2014; Sertlek, 2016).
These approaches can also be used to map ‘hotspots’ corresponding to high levels of anthropogenic sound and high density of animals (e.g. Erbe et al., 2014). Such an approach was applied by NOAA in the CetSound project (NOAA, 2012), which mapped sound levels and cetacean distributions in US waters, and by ACCOBAMS (the Agreement on the Conservation of Cetaceans of the Black Sea, Mediterranean Sea and contiguous Atlantic area) to map risk of noise to cetaceans in the Mediterranean Sea (Maglio et al., 2015). Mapping techniques of this type can enable the inclusion of anthropogenic sound in marine spatial planning.
Population modelling techniques consider how the disturbance of individual animals may ultimately affect the growth rate of a particular population, through changes in fitness and fecundity. There is currently a lack of observational data to parameterise these models, and expert opinion is instead used to inform the predictions. Several frameworks have been developed (Thompson et al., 2013; King et al., 2015), and applied to harbour seal Pusa vitulina (Thompson et al., 2013), bottlenose dolphin Tursiops truncatus (Pirotta et al., 2015a), and harbour porpoise (Ecosystem Assessment Outlook – Developing an Approach and Heinis and de Jong, 2015) populations. However, observational data are needed to corroborate the predictions of these models. This would require a detailed long-term study of a large population to detect any significant effects (Pirotta et al., 2015a).
As these examples make clear, there are now several techniques available that could be adapted for use in OSPAR assessments. Future work is planned to develop further common indicators for impulsive noise that address impacts on particular species or taxonomic groups. The present indicator provides important pressure information that could be used in combination with distribution maps of acoustically sensitive species. Such assessments would enable the identification of priority areas for improved spatial planning to assess and manage the effects of noise in the marine environment.
BMUB Germany (2014). Concept for the Protection of Harbour Porpoises from Sound Exposures during the Construction of Offshore Wind Farms in the German North Sea; ASCOBANS AC21/Inf.3.2.2.a
Ainslie, MA., Heaney, KL., Binnerts, B., Sertlek, Hö, Theobald, PD. and Pangerc, T. (2014). Use of Sound Maps for monitoring GES: Examples and way ahead, TNO 2014 R11167 (annex F of Cefas 2015)
Cefas (2015). Impacts of noise and use of propagation models to predict the recipient side of noise. Report prepared under contract ENV.D.2/FRA/2012/0025 for the European Commission. Centre for Environment, Fisheries & Aquaculture Science, UK. 27 pp. http://mcc.jrc.ec.europa.eu/documents/201601081529.pdf
Debusschere, E., Hostens, K., Adriaens, D., Ampe, B., Botteldooren, D., De Boeck, G., De Muynck, A., Sinha, A.K., Vandendriessche, S., Van Hoorebeke, L. and Vincx, M. (2016). Acoustic stress responses in juvenile sea bass Dicentrarchus labrax induced by offshore pile driving. Environmental Pollution 208, 747-757.
Dekeling, R.P.A., Tasker, M.L., Van der Graaf, A.J., Ainslie, M.A, Andersson, M.H., André, M., Borsani, J.F., Brensing, K., Castellote, M., Cronin, D., Dalen, J., Folegot, T., Leaper, R., Pajala, J., Redman, P., Robinson, S.P., Sigray, P., Sutton, G., Thomsen, F., Werner, S., Wittekind, D., Young, J.V., Monitoring Guidance for Underwater Noise in European Seas, JRC Scientific and Policy Report EUR 26555 EN, Publications Office of the European Union, Luxembourg, 2014, doi: 10.2788/27158
DeRuiter, S.L., Southall, B.L., Calambokidis, J., Zimmer, W.M., Sadykova, D., Falcone, E.A., Friedlaender, A.S., Joseph, J.E., Moretti, D., Schorr, G.S. and Thomas, L. (2013). First direct measurements of behavioural responses by Cuvier's beaked whales to mid-frequency active sonar. Biology letters 9, p.20130223.
Ellison, W. T., Southall, B. L., Clark, C. W., and Frankel, A. S. 2012. A new context-based approach to assess marine mammal behavioural responses to anthropogenic sounds. Conservation Biology 26, 21–8.
Erbe, C, Williams, R, Sandilands, D, & Ashe, E (2014). Identifying modeled ship noise hotspots for marine mammals of Canada's Pacific Region. PloS One 9, e89820.
Farcas, A., Thompson, P. M., & Merchant, N. D. (2016). Underwater noise modelling for environmental impact assessment. Environmental Impact Assessment Review, 57, 114-122.
Heinis, F. & de Jong, CAF (2015). Cumulative effects of impulsive underwater sound on marine mammals. TNO Report R10335-A. 86 pp.
King, SL, Schick, RS, Donovan, C, Booth, CG, Burgman, M, Thomas, L, & Harwood, J (2015). An interim framework for assessing the population consequences of disturbance. Methods in Ecology and Evolution 6, 1150-1158.
Maglio, A, Pavan, G, Castellote, M, & Frey, S (2015). Overview of the noise hotspots in the ACCOBAMS area. Final report. 45 pp.
NOAA (2012) CetSound project. http://cetsound.noaa.gov/index.html
NRC (2005). Marine Mammal Populations and Ocean Noise: Determining When Noise Causes Biologically Significant Effects. National Research Council (NRC), National Academies Press, Washington, DC, USA.
OSPAR (2014) Summary record of the meeting of the Environmental Impacts of Human Activities Committee (EIHA). EIHA 14/10/1-E
Pirotta, E, Harwood, J, Thompson, PM, New, L, Cheney, B, Arso, M, Hammond, PS, Donovan, C & Lusseau, D (2015a). Predicting the effects of human developments on individual dolphins to understand potential long-term population consequences. Proceedings of the Royal Society B 282, 20152109.
Pirotta, E., Merchant, N.D., Thompson, P.M., Barton, T.R. and Lusseau, D. (2015b). Quantifying the effect of boat disturbance on bottlenose dolphin foraging activity. Biological Conservation 181, 82-89.
Sertlek, HO, (2016) Aria of the Dutch North Sea, PhD thesis, University of Leiden
Simpson, S.D., Radford, A.N., Nedelec, S.L., Ferrari, M.C., Chivers, D.P., McCormick, M.I. and Meekan, M.G. (2016). Anthropogenic noise increases fish mortality by predation. Nature communications 7.
Solan, M., Hauton, C., Godbold, J.A., Wood, C.L., Leighton, T.G. and White, P. (2016). Anthropogenic sources of underwater sound can modify how sediment-dwelling invertebrates mediate ecosystem properties. Scientific reports 6.
Thompson, PM, Hastie, GD, Nedwell, J, Barham, R, Brookes, KL, Cordes, LS, Bailey, H & McLean, N (2013). Framework for assessing impacts of pile-driving noise from offshore wind farm construction on a harbour seal population. Environmental Impact Assessment Review 43, 73-85.
Van der Graaf AJ, Ainslie MA, André M, Brensing K, Dalen J, Dekeling RPA, Robinson S, Tasker ML, Thomsen F, Werner S (2012). European Marine Strategy Framework Directive - Good Environmental Status (MSFD GES): Report of the Technical Subgroup on Underwater noise and other forms of energy
Williams, R, et al. (2015) Impacts of anthropogenic noise on marine life: Publication patterns, new discoveries, and future directions in research and management. Ocean & Coastal Management 115, 17-24.