

Evaluation pilote: longueur maximale moyenne du poisson
D1 - Diversité Biologique
D1.7 - Structure des Écosystèmes
Message clé:
Cette évaluation pilote mesure la modification de la composition des espèces selon la longueur maximale moyenne de chaque espèce, que l’on considère représentative de leur vulnérabilité à une mortalité supplémentaire (souvent liée à la pêche). Il n’existe pas de tendance cohérente parmi les régions évaluées mais des modifications distinctes se présentent souvent au fil du temps au sein des régions.
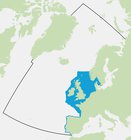
Zone Évaluée
Récapitulatif Imprimable
Contexte
La mortalité par la pêche limite la structure par âge des communautés halieutiques, réduisant la proportion d’individus plus gros/âgés. La pêche est également sélective en fonction de la taille, prélevant de préférence le poisson plus gros/âgé et affectant ainsi la composition par taille des communautés halieutiques. Trois évaluations de la taille du poisson ont été développées, pour l’évaluation intermédiaire de 2017, afin d’évaluer les impacts de la pêche sur les communautés halieutiques et le réseau trophique, en considérant des paramètres révélant diverses réactions dans les écosystèmes.
La longueur maximale (Figure 1) est l’une des caractéristiques de l’histoire de vie qui détermine la vulnérabilité des espèces à une mortalité supplémentaire. On choisit cette caractéristique de l’histoire de vie car l’on présume que les espèces d’une grande longueur maximale ont également une reproduction tardive et sont donc exposées à des pressions affectant les communautés halieutiques plus longtemps que d’autres espèces halieutiques. On s’attend à ce que ces espèces soient les premières à présenter un déclin, si les pressions sont élevées, car elles y sont exposées plus longtemps. Ce paramètre a été sélectionné pour représenter la vulnérabilité car il se fonde sur des données largement disponibles.
Un déclin de la longueur maximale moyenne indique que l’abondance des espèces halieutiques et d’élasmobranches les plus vulnérables diminue, entraînant donc une perte de la diversité des espèces.
L’indicateur est calculé à partir des données sur les captures provenant d’études scientifiques. Il s’agit de programmes de surveillance normalisés ayant lieu chaque année à la même époque et prélevant des échantillons représentatifs selon des lignes directrices spécifiques. On établit une distinction entre les divers composants des communautés halieutiques en se fondant sur leur comportement alimentaire selon des groupes trophiques basés sur leur habitat: à savoir, les communautés démersales (espèces vivant sur le sol marin ou à proximité) et les communautés pélagiques (espèces vivant uniquement dans la colonne d’eau).
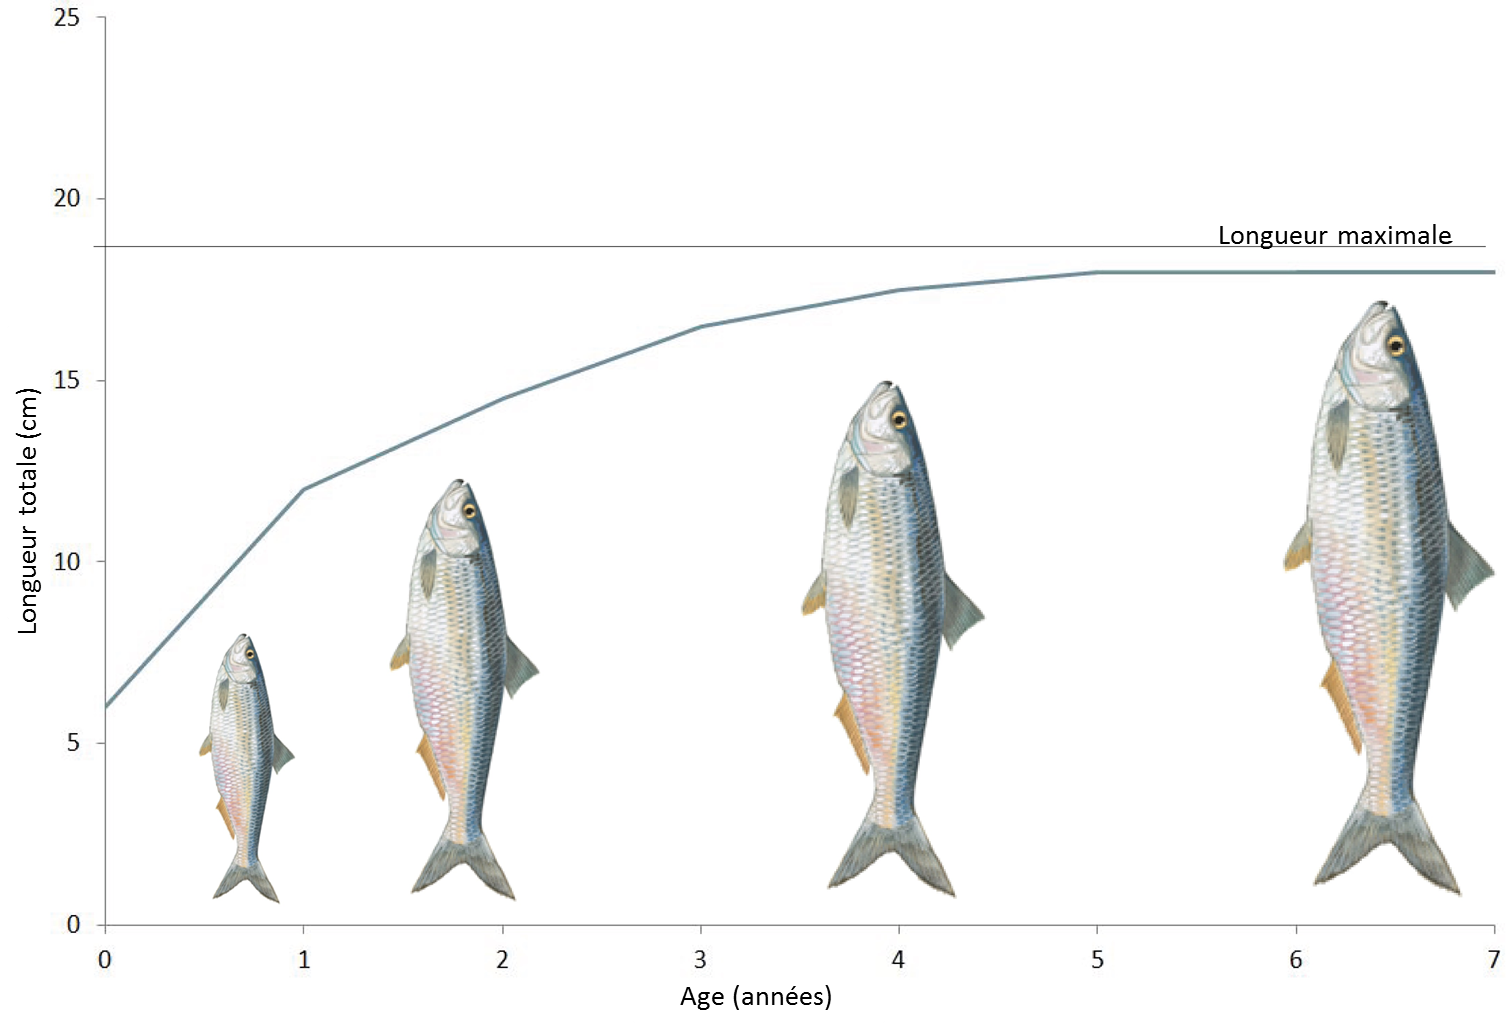
Figure 1: Longueur maximale basée sur la courbe de croissance von Bertalanffy
The intensive exploitation of marine fish has led to substantial reductions in the abundance of some target species (Myers et al., 1996) and changes in the structure and species composition of fish communities (Greenstreet and Hall, 1996). Specifically, large or slow-growing species with late maturity (Adams, 1980; Roff, 1984; Kirkwood et al., 1994) often decline in abundance more rapidly than their smaller and faster-growing counterparts. Indeed, many large or slow-growing species have become scarce following intensive exploitation, even when they are not primary targets of the fishery (Brander, 1981; Vince, 1991; Walker and Heessen, 1996; Jennings and Kaiser, 1998; Sutherland and Reynolds, 1998). It was only after Jennings et al. (1998) performed an analysis based on phylogenetic comparisons that it became evident that the differential effects of fishing on individual species were driven by their contrasting life histories because these eliminate many spurious differences among unrelated taxa (Harvey, 1996).
Jennings et al. (1999) showed that examination of a relatively simple component of life history, such as maximum length, can indicate the response to fishing. Thus, an a priori prediction of the susceptibility of fish species (exploited and unexploited) can be made using data that are widely available and without recourse to complex studies of population dynamics.
Maximum length as used for this indicator is represented by the maximum size as observed in the assessed surveys, which seems to be closely correlated with the asymptotic length (L∞ or Linf) as emerges from the von Bertalanffy growth curve (von Bertalanffy, 1957) (Figure 1). The indicator is calculated for sub-divisions appropriate to communities and pressures that can be localised and aggregated at the regional scale (in this case aligning with the sub-regions defined for the European Union Marine Strategy Framework Directive (MSFD)).
Pertaining to the issue of redundancy with the other fish indicators, the mean maximum length indicator should complement the large fish indicator because the mean maximum length indicator reflects change in species composition while the large fish indicator reflects change in size structure. This was confirmed by Greenstreet et al. (2012) showing that the mean maximum length indicator correlates with another species composition indicator (i.e. biodiversity evenness metrics). Some overlap can be expected with the indicator on Recovery in the Population Abundance of Sensitive Fish Species as this suite is selected based on their sensitivity to fishing determined by life-history parameters that are strongly correlated with maximum length (ICES, 2016). However, because the mean maximum length indicator reflects change in relative biomass within the fish community, it is complementary to measures of absolute species abundance arising from sensitive species or functional guilds.
Mean maximum length (shown as MML in the equation below) can be calculated for the entire assemblage caught by a particular gear or a subset based on morphology, behaviour or habitat preferences (e.g. bottom-dwelling species only). Mean maximum length is calculated (ICES, 2012) as:
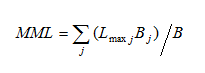
where Lmax j is the maximum length obtained by species j, Bj is the biomass of all individuals of species j and B is the total biomass of all individuals.
Data for this indicator come from scientific fisheries surveys, which ideally sample the entire fish community but in practice do not. Every survey can be expected to sample a survey-specific subset of the community often referred to as an assemblage. The indicator requires that each survey is conducted at regular intervals (e.g. annually) in the same area with a standard gear. Sufficiency of sample sizes can be judged using re-sampling techniques (Shephard et al., 2012). The number of individuals per species is not always recorded directly by surveys, but may be based on samples with certain detection error (including false negatives specifically for rare species). The detection error is further complicated by differing catchabilities over length classes and species, such that the observed relative abundance between species (and size-classes) is survey-specific. Where available, catchability estimates can be used to correct for this component of the systematic measurement error (e.g. Fraser et al., 2007; Walker et al., 2017). However, such estimates are sparse in the scientific literature and are prone to great uncertainty. Alternatively, model-based estimates of absolute species abundance can be used to rescale observed abundances, but here model uncertainty is also great (ICES, 2014). For simplicity the mean maximum length indicator is therefore calculated as a survey-specific indicator without any correction for detection error (i.e. catchability). This implies that every survey-specific indicator may provide a slightly different perspective to the reality they are supposed to represent. This indicator is calculated by survey and, where possible, also for sub-divisional strata that are assumed to represent different habitats and communities.
The data are collected under national programmes and the data collection framework. Currently, the most important data source for mean maximum length are those groundfish surveys that are coordinated by the International Council for the Exploration of the Sea (ICES). The International Bottom Trawl Survey (IBTS) programme in the Greater North Sea, the Celtic Seas, Bay of Biscay and Iberian Coast is particularly important since the trawl is a general-purpose design aimed at catching demersal and pelagic species. However, beam trawl surveys are more efficient at catching benthivorous species (such as sole, Soleidae) and acoustic surveys, supplemented with pelagic trawling, are more suitable for pelagic species (such as mackerel Scombridae) and time series of mean maximum length from such surveys may be preferable.
Data Used and Quality Assurance
This assessment draws on raw data from the ICES database of trawl surveys (DATRAS, www.ices.dk/marine-data/data-portals/Pages/DATRAS.aspx). These data have been quality controlled within OSPAR to generate a data product for assessment purposes. Time series of mean maximum length for fish and elasmobranchs are derived from each available groundfish and beam trawl survey, where the community is separated into demersal and pelagic habitat-based feeding guilds.
Time-series of mean maximum length by guild were determined for 20 groundfish surveys carried out across four separate regions: the Greater North Sea, Celtic Seas, Bay of Biscay and Iberian Coast, and the Wider Atlantic (Table a). Ecological sub-divisions were determined for the Greater North Sea using a simplification of those strata proposed by the European Union financed project Towards a Joint Monitoring Programme for the North Sea and Celtic Sea (JMP NS/CS) that took place in 2013, and building upon work in the European Union VECTORS project (Vectors of Change in European Marine Ecosystems and their Environmental and Socio-Economic Impacts) that examined the significant changes taking place in European seas, their causes, and the impacts they will have on society. In other OSPAR regions, the strata from the survey design were considered appropriate to represent the ecological sub-divisions.
Standard data collected on these surveys comprise numbers of each species of fish sampled in each trawl sample, measured to defined length categories (i.e. 1 cm below, so a fish with a recorded length of 14 cm would be between 14.00 and 14.99 cm in length). By dividing these species catch numbers-at-length by the area swept by the trawl on each sampling occasion, the catch data are converted to standardised estimates of fish density-at-length (referred to below as catch-per-unit-area, CPUA), by species, at each sampling location.
Summing these trawl-sample species density-at-length estimates across all trawl samples collected within each sampling stratum in each year (i.e. survey-specific strata following the survey design, which is the ICES ‘statistical rectangles’ in the Greater North Sea and generally depth-based strata elsewhere).
| Subregion | Survey Acronym¹ | Survey Period |
|---|---|---|
| Bay of Biscay and Iberian Coast | BBIC(n)SpaOT4 | 1990 – 2014 |
| BBIC(s)SpaOT1 | 1993 – 2014 | |
| BBIC(s)SpaOT4 | 1997 – 2014 | |
| BBICPorOT4 | 2002 – 2014 | |
| CSBBFraOT4² | 1997 – 2015 | |
| Celtic Seas | CSFraOT4² | 1997 – 2015 |
| CSEngBT3 | 1993 – 2015 | |
| CSIreOT4 | 2003 – 2015 | |
| CSNIrOT1 | 1992 – 2015 | |
| CSNIrOT4 | 1992 – 2015 | |
| CSScoOT1 | 1985 – 2016 | |
| CSScoOT4 | 1995 – 2015 | |
| Greater North Sea | GNSEngBT3 | 1990 – 2015 |
| GNSFraOT4 | 1988 – 2015 | |
| GNSGerBT3 | 2002 – 2015 | |
| GNSIntOT1 | 1983 – 2016 | |
| GNSIntOT3 | 1998 – 2016 | |
| GNSNetBT3 | 1999 – 2015 | |
| Wider Atlantic | WAScoOT3 | 1999 – 2015 |
| WASpaOT3 | 2001 – 2014 |
1. Survey acronym convention: First 2 to 4 capitalised letters indicate the OSPAR Region (BBIC: Bay of Biscay and Iberian Coast; CS: Celtic Seas; GNS: Greater North Sea; WA – Wider Atlantic). Next capitalised and lowercase letters signify the country involved (Spa: Spain; Por: Portugal; Fra: France; Eng: England; Ire: Republic of Ireland; NIr: Northern Ireland; Sco: Scotland; Ger: Germany; Int: International; Net: The Netherlands. International refers to the two international bottom trawl surveys carried out in the Greater North Sea under the International Council for the Exploration of the Sea (ICES). In the Bay of Biscay and Iberian Coast region, Spanish surveys are further delimited by (n) for surveys operating in the northern Iberian coast area and (s) for surveys operating in the southern Iberian coast area. Next two capitalised letters indicate the type of survey (OT: otter trawl; BT: beam trawl). Final number indicates the season in which the survey is primarily undertaken (1: January to March; 3: July to September; 4: October to December).
2. This is a single survey that operates across both the Celtic Seas and the Bay of Biscay and Iberian Coast regions, from the southern coast of the Republic of Ireland and down the western Atlantic coast of France. For indicator assessment purposes, this single survey was split into its two regional components.
Data Treatment
Surveys with Rectangular Sampling Grids (GNSIntOT1, GNSIntOT3, GNSNetBT3, GNSGerBT3, GNSFraOT4)
Catch-per-unit-area (CPUA) data (kg/km2) from multiple hauls are averaged by species for each rectangular grid cell. In the Greater North Sea these are ICES statistical rectangles, in the eastern Channel a mini-grid 0.25° × 0.25° is used by GNSFraOT4.
The resulting rectangle-based CPUA estimates are multiplied by area (km2) of their rectangles (using a Lambert equal area projection) to give biomass-at-length (now measured in kg per rectangle). Sub-divisional level (not GNSFraOT4) estimates of biomass-at-length are given by the sum of the rectangle-based biomass-at-length estimates and corrected by a scaling factor = 1/(proportion of the area of sub-division monitored in the survey year) (units are now tonnes per sub-division). The scaling factor correction ensures that the weighting of the strata relative to each other in each year is not altered by the sampling levels. Sub-divisional estimates of mean maximum length are calculated at this point for investigating the local responses of each community.
Regional estimates of biomass-at-length are estimated from the sum of sub-divisions (or in the case of GNSFraOT4 by the rectangle-based estimates). The regional assessment of mean maximum length is based on these summed estimates.
Surveys with Irregular Depth Banded Strata (i.e. All Surveys other than those with Rectangular Sampling Grids)
Catch-per-unit-area (CPUA) data (kg/km2) from multiple hauls are averaged by species for each survey strata. Sub-divisional estimates of biomass-at-length are subsequently given by CPUA multiplied by area of the survey strata (km2, using a Lambert equal area projection). Sub-divisional estimates of mean maximum length are calculated at this point for investigating the local responses of each community.
Regional estimates of biomass-at-length are estimated from the sum of sub-divisions (or in the case of GNSFraOT4 by the rectangle-based estimates). The regional assessment of mean maximum length is based on these summed estimates.
Overall assessment basis
Where multiple surveys were available for assessment, key surveys were prioritised (preferred) for assessment given the length of time series available and spatial coverage. If these measures were equal between surveys, then whichever surveyed the greatest biomass by guild was selected for indicator assessment. The following surveys were considered key:
Greater North Sea
GNSIntOT1 for both demersal and pelagic guilds was the preferred survey for the Greater North Sea, given it is the longest survey with the best spatial coverage. For the eastern Channel, GNSEngBT3 was preferred for demersal guild given more consistent sampling here than GNSIntOT1 and GNSFraOT4. GNSFraOT4 was preferred for the pelagic guild in the eastern Channel given the length of time series available.
Celtic Seas
CSScoOT1 for both demersal and pelagic guilds was preferred over CSScoOT4 and CSIreOT4 due to length of time series. CSIreOT4 for both demersal and pelagic guilds was preferred for sub-divisions to the west of Ireland and in the northern Celtic Sea, but not in the north where there was overlap with CSScoOT1. CSFraOT4 for both demersal and pelagic guilds was preferred in sub-division of the Celtic Sea, except where overlap with CSIreOT4.
CSEngBT3 for the demersal guild was preferred for the Irish Sea over CSNIrOT1 and CSNIrOT4 given greatest spatial coverage. CSNIrOT1 for the pelagic guild was preferred for the Irish Sea over CSNIrOT4 given relatively high biomass of the guild caught and identical coverage spatially and temporally.
Bay of Biscay and Iberian Coast
BBIC(s)SpaOT1 for both demersal and pelagic guilds was preferred over BBIC(s)SpaOT4 given length of survey. CSBBFraOT4, BBICPorOT4 and BBIC(n)SpaOT4 did not overlap with any other surveys.
Time series assessment
In each case the minimum value observed over the time series, prior to the last six years, was considered as a lower limit that should be avoided in future. The long-term trend in each time series (sub-division and survey level) was modelled through the application of a LOESS smoother (i.e. locally weighted scatterplot smoothing) with a simple ‘fixed span’ of one decade.
Breakpoint analyses use data to define stable underlying periods (Probst and Stelzenmuller, 2015). The method makes it possible to say whether there is a significant change in the indicator over time, that is, whether a specific period is not significantly different from the historically observed period. The method avoids the arbitrary choice of reference periods for assessment (i.e. how many years to choose to calculate an average), which can lead to subjective assessments. The shorter the period chosen the more likely it is to be comparing noise in the data or natural fluctuations in the system against each other. However, too long a period and the actual changes in the indicator might be averaged out. The minimum detectable period is defined in this analysis as three years. The analysis uses two statistical approaches: (1) applying the ‘supremum F test’ to identify if a non-stationary time series or if a constant period for the entire time series is more suitable; (2) if considered non-stationary, then breakpoint analysis finds periods of at least three years duration.
Résultats
Mer du Nord au sens large
Les sous-divisions de la région de la mer du Nord au sens large présentent des différences distinctes, la longueur maximale moyenne diminuant dans les sous-divisions du sud et du centre et augmentant dans les sous-divisions du nord. Ceci s’applique aux assemblages de poissons démersaux (Figure 2) et aux assemblages de poissons pélagiques (Figure 3). L’indicateur présente des signes mitigés dans le Kattegat et le Skagerrak, le niveau du poisson démersal étant encore bas mais montrant les premiers signes de redressement alors que celui du poisson pélagique ne change pas au fil du temps. Contrairement aux tendances à la baisse dans la mer du Nord au sens large méridionale, la longueur maximale moyenne des assemblages de poissons démersaux semble augmenter dans la Manche.
Mers Celtiques
Les sous-divisions de la région des mers Celtiques présentent des différences distinctes, la longueur maximale moyenne des assemblages de poissons démersaux et pélagiques présentant un tableau mitigé. La longueur maximale moyenne démersale diminue dans les eaux en bordure du plateau à l’ouest, à proximité de la côte irlandaise de la mer d’Irlande et de la zone de Clyde, mais augmente au sud de l’Irlande, dans l’île de Man, la mer des Hébrides et le Minch (Figure 2). Les communautés halieutiques pélagiques présentent des tendances plus distinctes au niveau sous-régional, des augmentations étant relevées au large de la mer d’Irlande, s’étendant dans la mer Celtique mais des diminutions étant relevées dans des zones septentrionales, notamment la mer des Hébrides et l’ouest de l’Irlande (Figure 3).
Golfe de Gascogne et côte ibérique
Les sous-divisions de la région du golfe de Gascogne et de la côte ibérique, présentent quelques différences mais aucune tendance nette. On relève des diminutions des assemblages de poissons démersaux dans plusieurs sous-divisions en bordure du plateau dans le golfe de Gascogne ainsi que dans le Golfe de Cadix (Figure 2). Dans le cas des assemblages de poissons démersaux, les principales augmentations sont relevées dans la partie septentrionale du golfe de Gascogne plus près du littoral et le long de la côte portugaise. On relève peu de modifications, dans le temps, du poisson pélagique dans les sous-divisions (Figure 3).
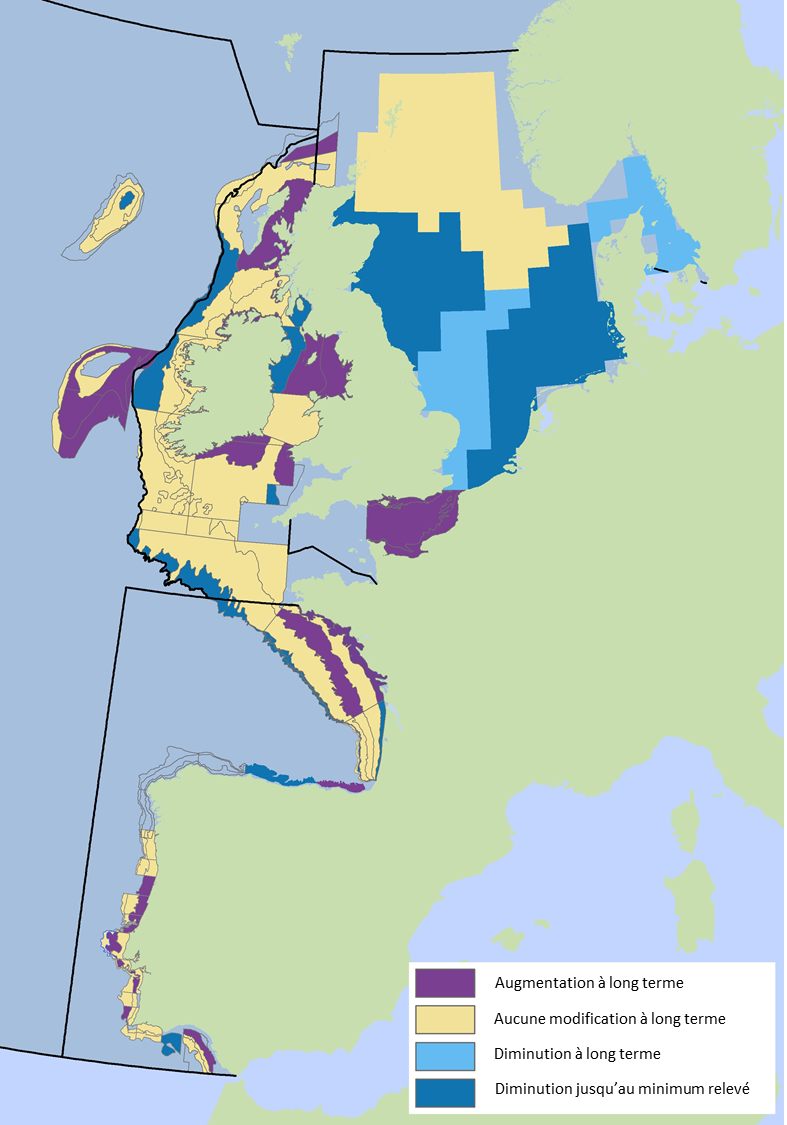
Figure 2: Profil spatial de la longueur maximale moyenne par sous-division pour des assemblages de poissons démersaux
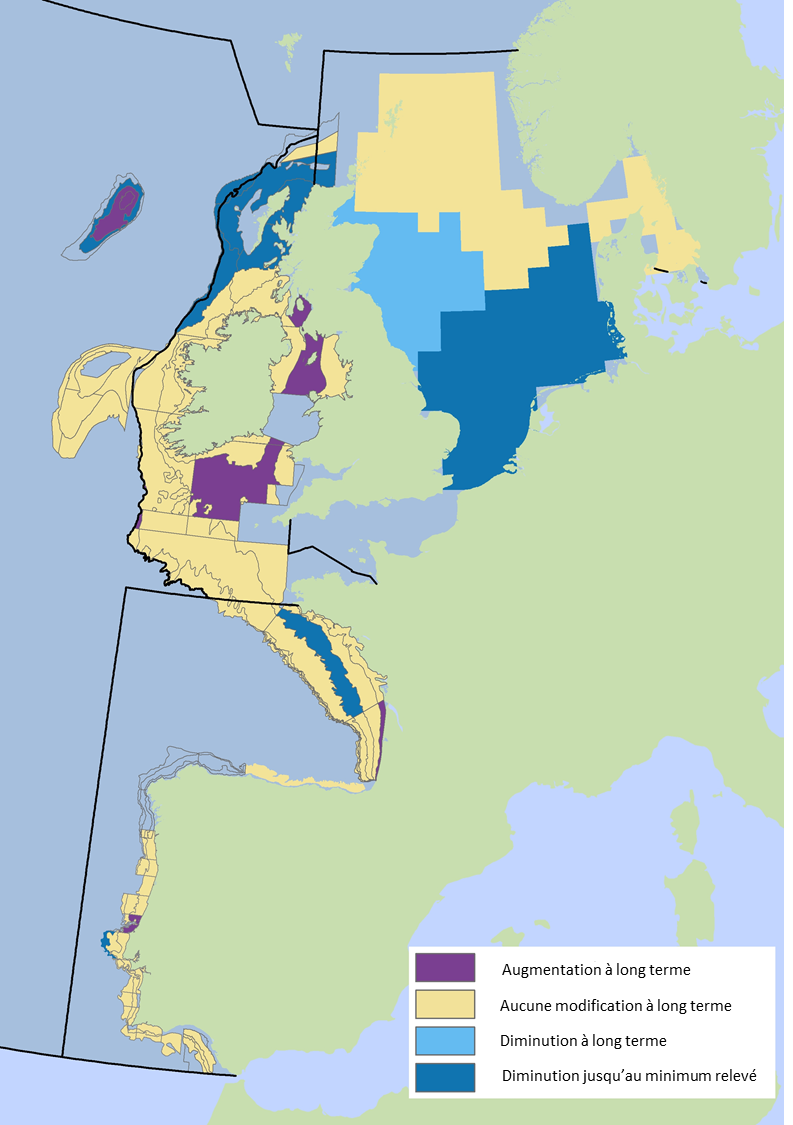
Figure 3: Profil spatial de la longueur maximale moyenne par sous-division pour des assemblages de poissons démersaux
Time series of mean maximum length per region for demersal and pelagic fish assemblages based on key surveys are outlined in Figure a. For the Greater North Sea overall, mean maximum length of the species communities, based on the most appropriate survey, has decreased over time and this applies to both demersal and pelagic fish. For the Celtic Seas there is no clear overall trend or even a pattern over time in mean maximum length for either demersal or pelagic fish. The different surveys often show contradicting signals. For the Bay of Biscay and Iberian Coast, the overall mean maximum length is increasing. This applies for demersal fish in all surveys and pelagic fish in all surveys except the one covering the northerly part in the fourth quarter.
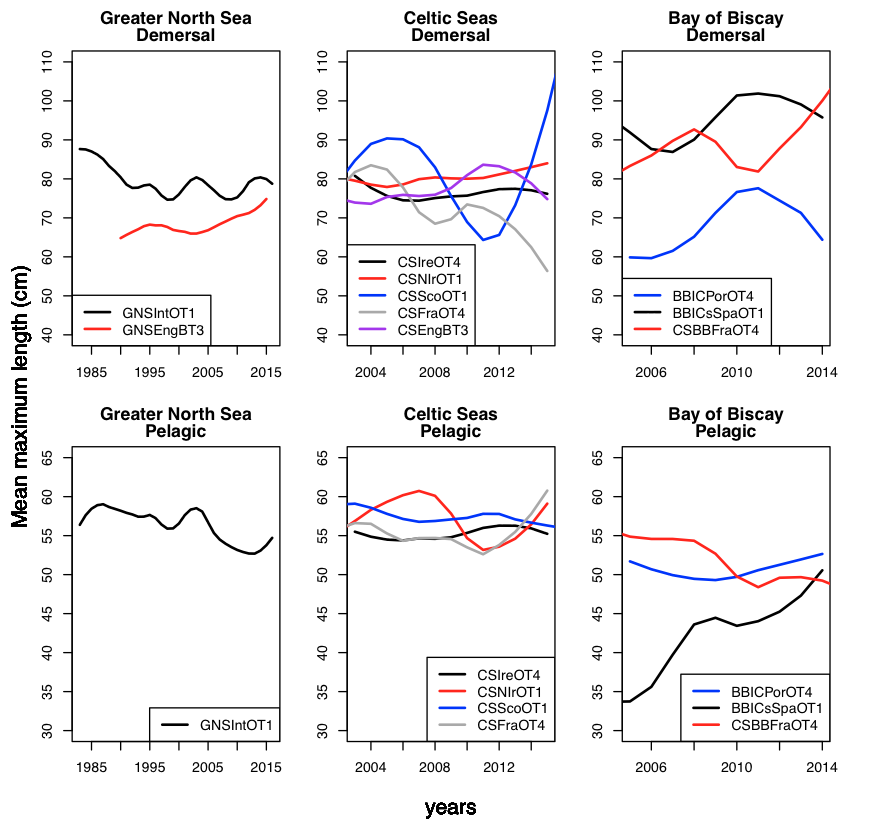
Figure a: Time series of mean maximum length per region for demersal (upper) and pelagic (lower) fish assemblages
Breakpoint analysis identified instances (surveys) where a change was observed over time.
For demersal fish this was: a decrease in the Greater North sea of 6% (GNSNetBT3) to 11% (GNSIntOT1), except for the English Channel which showed a 7% increase (GNSEngBT3); an increase in the Celtic Seas of 4–7%; and an increase in the Bay of Biscay and Iberian Peninsula of 27%.
For pelagic fish this was: a decrease in the Greater North Sea of 8%; and a decrease in in the Celtic Seas of 7–32%.
If the breakpoint analysis shows there was no stationary period over the entire time series the difference was calculated between the last and first stable periods.
Use of several surveys per region, has resulted in a large amount of useful information but with the risk that spurious patterns emerge. For example, is the decreasing trend in a given sub-division meaningful or is that period of high values indeed a sign of recovery? And which survey best represents a given component of the fish community in a given season (Q1, Q3, Q4?) in that region?
In some regions the application of sub-divisions was helpful. For example in the Greater North Sea there is a clear difference between the northern and southern parts and it could be informative to separate those signals. In other regions, clear signals are less obvious.
Conclusion
L’indicateur pilote ne révèle aucune tendance particulière de la longueur maximale moyenne parmi les régions mais des modifications distinctes se présentent souvent au fil du temps au sein de chaque région. Dans la mer du Nord au sens large, par exemple, on relève un déclin général de la longueur maximale moyenne des assemblages de poissons démersaux et des assemblages de poissons pélagiques, ceci signifie que la proportion des espèces vulnérables (c’est-à-dire les espèces de grande taille ou à développement lent et maturité tardive) est en déclin. Les assemblages de poissons démersaux de la Manche semblent cependant se rétablir. On ne relève aucune tendance générale dans les mers Celtiques mais nombre de variations, dans le temps, entre des études et entre des sous-divisions, en particulier pour le poisson démersal. On relève une augmentation nette de la longueur maximale moyenne du poisson démersal dans le golfe de Gascogne et la côte ibérique. Il en est de même pour le poisson pélagique, à l’exception de la partie septentrionale du golfe de Gascogne.
Les tendances relevées de la longueur maximale moyenne suggèrent que l’impact de la pêche sur les communautés halieutiques a entraîné un déclin des espèces vulnérables, bien qu’il semble également que la réduction récente de la mortalité par la pêche ait abouti à un rétablissement des communautés halieutiques, quoique souvent local.
Les résultats de cette évaluation pilote peuvent permettre d’améliorer les évaluations OSPAR futures des communautés halieutiques.
While fishing is the most likely candidate to explain these patterns in mean maximum length it is unclear whether the observed decline in mean maximum length is caused by exploitation only or whether there are possible alternatives. For example, global warming may have caused an influx of species with smaller maximum length.
The results from this pilot assessment provide further context to the other fish community indicator assessments of demersal communities. At a regional scale all indicators provide similar conclusions, but at a finer scale responses diverge. This pilot assessment also provides a separate assessment of the pelagic fish communities. The combined set can help strengthen OSPAR’s fish community assessments in the future.
Lacunes des Connaissances
On ne connaît pas encore les causes principales des tendances spatiales et temporelles relevées de l’indicateur de la longueur maximale moyenne.
Des niveaux de référence représentant un parfait état ou un état d’exploitation durable, et qui permettraient une évaluation formelle, ne sont pas encore disponibles.
It is currently unclear whether the observed decline in mean maximum length is caused by fisheries exploitation only or whether there are possible alternatives. For example, the warming of the Greater North Sea due to climate change may have caused an inflow of Lusitanian (warm-water southern) species, especially in the southern part of the Greater North Sea. These Lusitanian species tend to be smaller-bodied than Boreal (cold-water northern) species. Additional analyses are required to separate these two possible causes. Additional research is required to disentangle many of the factors that may have caused or at least contributed to the observed spatial and temporal patterns.
Further work is required to evaluate baselines and assessment values. However, the time series do not extend to a period where it can be assumed that species composition was not impacted, or possibly even representative of sustainable exploitation. During the early 1980s, key commercially fished pelagic species (herring (Clupea harengus), mackerel (Scomber scombrus), sprat (Sprattus sprattus)) were recovering from stock depletion such that the species composition of the community in this period was already likely to be heavily impacted. In fact, even before this time, other vulnerable pelagic and demersal species such as Atlantic bluefin tuna (Thunnus thynnus) and common skate Dipturus batis-complex were extirpated from the Greater North Sea. As a result, any historical baseline for the fish and elasmobranch community will represent an impacted state.
Adams, P.B. 1980 Life history patterns in marine fishes and their consequences for management. Fishery Bulletin, 68, 1 12.
Brander, K. 1981 Disappearance of common skate, Raia batis, from the Irish Sea. Nature, 68, 48 49.
Fraser, H. M., Greenstreet, S. P. R., and Piet, G. J. 2007. Taking account of catchability in groundfish survey trawls: implications for estimating demersal fish biomass. ICES Journal of Marine Science, 64: 1800–1819
Greenstreet, S. P. R., Fraser, H. M., Rogers, S. I., Trenkel, V. M., Simpson, S. D., and Pinnegar, J. K. 2012. Redundancy in metrics describing the composition, structure, and functioning of the North Sea demersal fish community. ICES Journal of Marine Science, 69: 8-22.
Greenstreet, S.P.R. and Hall, S.J. 1996 Fishing and ground-fish assemblage structure in the north-western North Sea: an analysis of long-term and spatial trends. Journal of Animal Ecology, 68, 577 598.
ICES. 2012. Report of the Working Group on The Ecosystem Effects of Fishing Activities (WGECO), 11–18 April 2012, Copenhagen, Denmark. ICES CM 2012/ACOM:26. 192 pp.
ICES. 2014. Interim Report of the Working Group on Multispecies Assessment Methods (WGSAM), 20–24 October 2014, London, UK. ICES CM 2014/SSGSUE:11
ICES. 2016. Report of the Working Group on the Ecosystem Effects of Fishing Activities (WGECO), 6–13 April 2016, Copenhagen, Denmark. ICES CM 2016/ACOM:25. 110pp.
Jennings, S., Greenstreet, S. P. R., and Reynolds, J. D. 1999. Structural change in an exploited fish community: a consequence of differential fishing effects on species with contrasting life histories. Journal of Animal Ecology, 68: 617-627.
Jennings, S. & Kaiser, M.J. 1998 The effects of fishing on marine ecosystems. Advances in Marine Biology, 68, 201 352.
Jennings, S., Reynolds, J. D., and Mills, S. C. 1998. Life history correlates of responses to fisheries exploitation. Proceedings of the Royal Society B-Biological Sciences, 265: 333-339.
Kirkwood, G.P., Beddington, J.R., Rossouw, J.A. 1994 Harvesting species of different lifespans. Large-Scale Ecology and Conservation Biology (eds P. J.Edwards, R. M.May & N. R.Webb), pp. 199 227. Blackwell Science Limited, Oxford.
Myers, R.A., Hutchings, J.A., Barrowman, N.J. 1996 Hypothesis for the decline of cod in the North Atlantic. Marine Ecology Progress Series, 68, 293 308.
Probst, W. N. and V. Stelzenmuller (2015). "A benchmarking and assessment framework to operationalise ecological indicators based on time series analysis." Ecological Indicators 55: 94-106.
Roff, D.A. 1984 The evolution of life history parameters in teleosts. Canadian Journal of Fisheries and Aquatic Science, 68, 989 1000.
Shephard, S., Fung, T., Houle, J.E., Farnsworth, K.D., Reid, D.G., Rossberg, A.G. (2012) Size-selective fishing drives species composition in the Celtic Sea. ICES Journal of Marine Science, 69, 223– 234.
Sutherland, W.J. and Reynolds, J.D. 1998 Sustainable and unsustainable exploitation. Conservation Science and Action (ed. W. J.Sutherland), pp. 90 115. Blackwell Science Limited, Oxford.
Vince, M.R. 1991 Stock identity in spurdog (Squalus acanthias L.) around the British Isles. Fisheries Research, 68, 341 354.
von Bertalanffy, L. 1957. Quantitative laws in metabolism and growth. Quarterly Review of Biology, 32: 217-221.
Walker, P.A. and Heessen, H.J.L. 1996 Long-term changes in ray populations in the North Sea. ICES Journal of Marine Science, 68, 1085 1093.
Walker, N. D., Maxwell, D. L., Le Quesne, W. J. F., and Jennings, S. (2017) Estimating efficiency of survey and commercial trawl gears from comparisons of catch-ratios. ICES Journal of Marine Science, doi:10.1093/icesjms/fsw250