

Modifications du niveau trophique moyen des prédateurs marins dans le golfe de Gascogne
D4 - Réseau trophique marin
D4.2 - Proportion des espèces sélectionnées au sommet du réseau trophique D4.3 - Abondance/répartition des groupes trophiques/espèces clés
Message clé:
L'évaluation des modifications du niveau trophique moyen dans le golfe de Gascogne ne révèle aucune modification évidente de la structure d’ensemble des réseaux trophiques au cours des dernières décennies. On a cependant relevé des signes d’une augmentation de la biomasse des prédateurs marins.
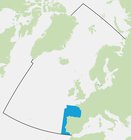
Zone Évaluée
Récapitulatif Imprimable
Contexte
Les réseaux trophiques sont des réseaux au sein desquels les rapports entre les organismes sont liés à leur alimentation (c’est-à-dire interactions prédateur-proie). Il s’agit ici de l’un des trois indicateurs des réseaux trophiques, qui décrit les modifications de la structure des réseaux trophiques en ce qui concerne le poisson et les invertébrés.
Le niveau trophique, déterminé par les études du régime alimentaire, situe la position d’un organisme dans un réseau trophique. Une valeur basse du niveau trophique (TL) (par exemple 1) est attribuée aux producteurs primaires à la base des réseaux trophiques alors qu’une valeur élevée du TL (par exemple 4 ou plus) est attribuée aux prédateurs du haut.
Le niveau trophique moyen (MTL) est calculé à partir des données sur la biomasse des espèces provenant de diverses sources (par exemples études scientifiques et débarquements de poisson), et des valeurs du TL attribuées. Le régime alimentaire des espèces peut varier d’une région à l’autre, il importe donc d’utiliser des études des régimes alimentaires propres à une région afin de déterminer les valeurs du TL pertinentes à l’échelle régionale. On utilise ces valeurs pour représenter les voies / relations alimentaires dans une région donnée, c’est-à-dire « qui mange quoi ».
Cet indicateur, se fondant actuellement sur les invertébrés et le poisson, est principalement sensible aux pressions exercées par la pêche. La pêche cible habituellement les espèces à haut TL et entraîne donc une diminution de la disponibilité des prédateurs au sein des écosystèmes. La pêche doit alors cibler des espèces à des niveaux trophiques de plus en plus bas entraînant donc un déclin du MTL des débarquements de poisson. Il s’agit de la « réorientation progressive vers des espèces situées toujours plus bas dans le réseau trophique » (Figure 1). Si le phénomène persiste, les modifications de la structure des réseaux trophiques pourraient rendre les écosystèmes marins de plus en plus vulnérables aux pressions naturelles et anthropiques
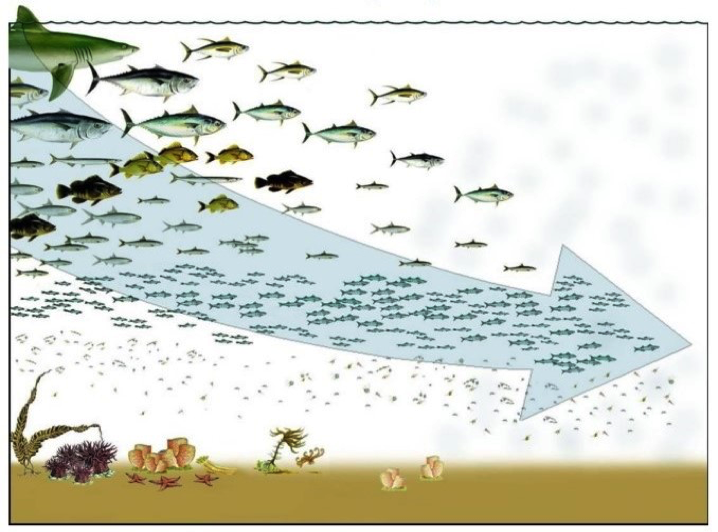
Figure 1: Représentation du concept « réorientation progressive vers des espèces situées toujours plus bas dans le réseau trophique »
Food webs represent the trophic interactions between predators and their prey. Each life stage of an organism is associated with a particular trophic level and, at its most simplistic, the energy is transferred from the lower trophic levels to the higher trophic levels following the interconnections between organisms within the food web. The tropic level (TL) value assigned to a particular organism is determined by the proportion of each category of species constituting the diet of a particular consumer (knowing that TL=1 for primary producers, and TL=2 for primary consumers, etc. (see Figure a)). TL can be estimated using dietary analysis (stomach content analysis), stable isotopes analysis, and modelling.
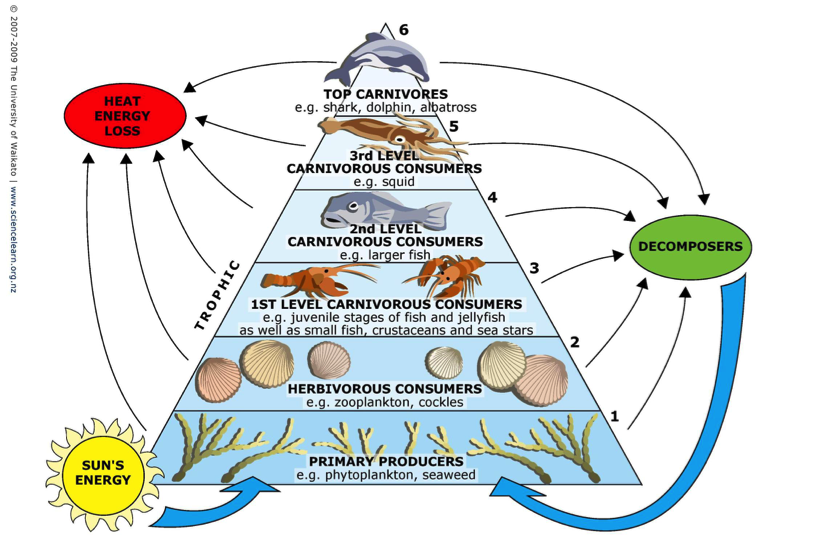
Figure a: Representation of the concept of Trophic Level in a food web. (adapted from 2007-2009 The University of Waikato)
Within the scientific community, it is considered to be important that food web status should be based on ecosystem indicators that do not just use fish data (i.e. high trophic level species such as hake, monkfish, sharks, rays) but also data concerning invertebrates and species from intermediate trophic levels. The Mean Trophic Level (MTL) indicator meets this requirement because it takes into account food web structure and uses a metric (the TL) that reflects energy transfer between predators and prey. MTL is calculated using biomass data from scientific surveys and fisheries landings and the associated TL of the species. In this assessment, the indicator has been calculated taking into consideration vertebrates and invertebrates where possible. Eventually, however it is expected that this indicator will be adapted to consider all vertebrate and invertebrate.
The original concept that uses the MTL indicator, developed by Pauly et al. (1998), is known as ‘fishing down marine food webs’. A decline in the MTL of the global fisheries catch reveals a shift from intense fishing pressure on the highest trophic levels to increasing fishing pressure on lower trophic levels, due to the decline in biomass of high trophic level species. Thus, this indicator aims at highlighting the unsustainable fisheries practices of past decades. The indicator could inform political decisions to enforce regulations upon fisheries catches / quotas. The indicator was adopted by the Conference of the Parties to the Convention on Biological Diversity as one of eight indicators to monitor achievement of a significant reduction in the rate of biodiversity loss by 2010.
Since then, the use of MTL of landings has been further explored and additional hypotheses suggested to explain the patterns in MTL observed. The ‘fishing down food webs’ concept as defined above was actually detected in the North Atlantic. Other scenarios were described in other parts of the world (Essington et al., 2006; Morato et al., 2006; Swartz et al., 2010; Stergiou and Tsikliras, 2011; Shannon et al., 2014), for example, the concept of fishing through the food webs (sequential addition of low trophic level species in fisheries); fisheries expansion (into deeper and further offshore waters with the inclusion of new high trophic level species); and fishing up the food webs (addition of new previously unfished high trophic level species).
To compute the MTL indicator, landings have traditionally been the only source of biomass data, raising many concerns around their suitability for describing the ecosystem as a whole, due to the shortcomings and / or uncertainties associated with this type of data. First, the landings data are incomplete (i.e. they do not take into account discards, illegal, unreported, and unregulated fishing, or bycatch), and second, landings data are subject to multiple biases induced by fisheries drivers (Branch et al., 2010; Pauly et al., 2013). However, landings data do have the advantage of a high frequency of data availability that includes all gear types and thus many species. On the other hand, data from scientific surveys reflect actual changes in community structure because they are not influenced by market forces (i.e. selectively fishing for particular commercial species only). However, data from scientific surveys are usually limited to a specific season and one type of fishing gear. Thus, scientific surveys should be the main data source when using the MTL indicator to assess the food web, with landings providing complementary information.
Mean trophic level (MTL) is calculated using two types of data: (1) biomass data per species for fish and invertebrates from surveys and landings and (2) data on the trophic level of each species.
Data Collection
Biomass Data
Past and present fish and invertebrate biomass data for the Bay of Biscay are compiled from research surveys and landings.
Surveys
Annual biomass per species, collected during the DEMERSALES surveys on ICES subdivisions VIIIc and IXa-north of the Bay of Biscay for the period 1992–2015 were used for the southern Bay of Biscay analyses. Data were directly extracted from the Instituto Español de Oceanografía (IEO) database and include both invertebrate and fish data because invertebrates constitute a large part of the survey catches.
Annual biomass per species collected during the EVHOE surveys on ICES subdivisions VIIIa and VIIIb of the Bay of Biscay for the period 1997-2015 were used for the northern Bay of Biscay analyses. Survey data were extracted from the 2017 OSPAR Groundfish survey monitoring and assessment data product (Moriarty and Greenstreet, in prep), which focuses on fish communities across the Northeast Atlantic region and does not include any invertebrate data.
Data were selected for the depth range of the continental shelf in the Bay of Biscay (<200 m depth).
The DEMERSALES and EVHOE surveys are bottom trawl surveys, which are part of the Data Collection Framework of the Common Fisheries Policy (EC regulation No. 665/2008).
Landings
Annual biomass per species, from the official landings dataset were used for the analyses in subdivisions VIIIa and VIIIb for the northern Bay of Biscay, and subdivisions VIIIc of the southern Bay of Biscay. These data can be downloaded from the ICES website (ICES Historical catch statistics 1950–2010 and Official catch statistics 2006–2014).
French landings data are the main data source for the northern Bay of Biscay. The data were however missing for 1999 and so could not be included in this analysis.
Trophic Level Data
Some preliminary work is needed to collate regional TL values per species. This improves the reliability of TL values for the Bay of Biscay because the diet of species (and hence the predator-prey relationships) may vary among regions. Three sources of TL information are prioritised to ensure the most appropriate TL value for each species (Figure b).
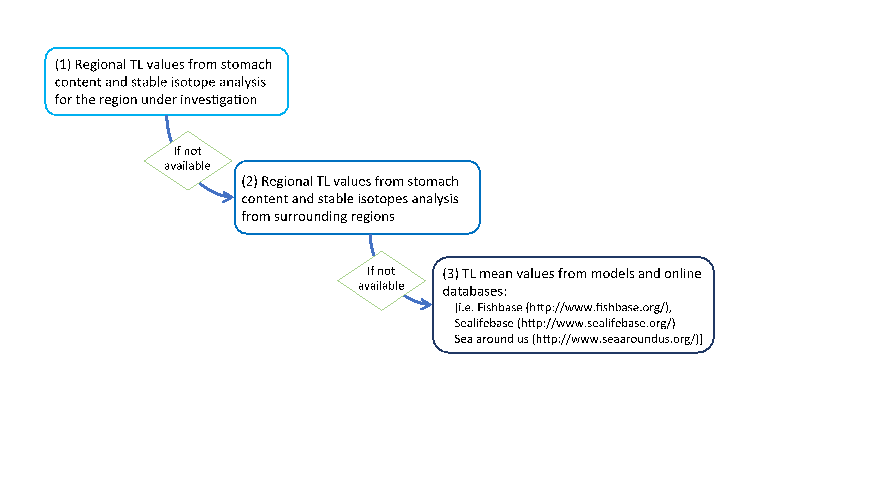
Figure b: Trophic Level value selection according to source type
However, because TL values are assigned at the species level, it did not seem appropriate to assign TL values to large groups that would include species from low to high trophic levels (e.g. Osteichthyes; the bony fishes). High taxonomic ranks (i.e. phylum, sub-phylum, class, superorder, order, suborder and infraorder) were thus removed from the MTL computation. Only the ranks of genus and family were considered. For these, their TL is derived by averaging the TL values of all relevant species present in the Bay of Biscay.
The regional TL values estimated from stomach content analyses were based on the IEO’s non-public database corresponding to DEMERSALES surveys in the Spanish part of the Bay of Biscay, for the period 1990–2013. The remaining TL values, estimated from stomach content analysis, stable isotope analysis or models, were collected from the published literature for regions and surrounding regions (Jennings et al., 2002; Pinnegar et al., 2002; Le Loc’h and Hily, 2005; Bodin et al., 2008; Le Loc’h et al., 2008; Navarro et al., 2011; Chouvelon et al., 2012; Lassalle et al. 2011; Lassalle et al., 2014).
Calculation of the MTL indicator
The MTL indicator for each year is calculated using the biomass and TL of species according to the following formula:
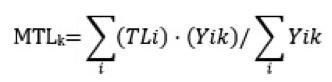
Formula a: The Mean Trophic Level indicator formula.
where MTLk refers to the MTL indicator for each year k, TLi refers to the trophic level value of species (group) I, and Yik refers to the biomass (Y) of species (group) i in year k, as included in landings data or in surveys data.
The MTL is then calculated each year in order to identify trends.
While assessing this indicator, the group of species considered can be changed by applying a TL cut-off (e.g. 3.25). The purpose of these cut-offs is to eliminate low trophic level species in order to focus on predators (i.e. high trophic level species) and detect changes in the upper food web structure.
Pauly and Watson (2005) stated that using the mean TL for the Marine Trophic Index should always be done with an explicitly stated cut off and proposed a first TL cut-off value of 3.25, it excluded all landed species under a TL of 3.25. In this assessment three TL cut-offs were identified: a TL cut-off value of 2.0 (expressed as MTL_2.0, which includes all consumers into the analysis; the MTI cut-off value of 3.25 described by Pauly and Watson (200t) (expressed as MTL_3.25). The third cut-off fixed at 4.0 has also been applied to the data (i.e. MTL_4.0) to focus on higher predators.
The MTL indicator with different cut-offs was first calculated using the whole community (all species included), and then by eliminating pelagic species from the computation to give information on bentho-pelagic species. Excluding pelagic species, helped reduce bias in the biomass data, linked to interannual variability in the pelagic species data. Indeed, the EVHOE and DEMERSALES surveys are bottom trawl surveys, meaning they are designed to capture and evaluate bentho-demersal species. The pelagic species of the Bay of Biscay were defined according to Quéro et al. (1989) and Fishbase (www.fishbase.org).
Uncertainty exists around each TL value estimated by diet studies, which is related to spatio-temporal variability and species ontogeny (Pinnegar et al., 2002; Chassot et al., 2008; Vinagre et al., 2012). This uncertainty was reported as a standard error for each TL value of a species. In order to include uncertainty in the MTL model, a bootstrap methodology was developed using the R software (R version 3.1.0). Random sampling was applied on TL values and their standard error, performing 500 MTL computations per year studied. The model was then fitted as a mean value of the 500 MTLs generated with an uncertainty related to its standard error. The uncertainty around the MTL model is thus linked to the uncertainty of the TL estimations.
For statistical analysis, preliminary tests of normality (Shapiro test), homoscedasticity (Harrison-McCabe test) and autocorrelation (Durbin–Watson test) of the data were applied for the use of parametric methods. When these tests were verified, a linear model was fitted to the temporal series (mean values for each year generated by the model) in order to test the significance of the trend. When normality or homoscedasticity were not verified, evolution of MTL over time was assessed by means of Mann-Kendall analyses (Scherrer, 1984). Differences were considered significant when p<0.05. R software and packages were used for statistics and graphics (R core team, 2015).
Résultats
L’indicateur du niveau trophique moyen (MTL) a été évalué pour une période de 18 à 23 ans pour les parties septentrionales et méridionales du golfe de Gascogne (Figure 2), en utilisant les données des études de la biomasse, supplémentées par les données sur les débarquements de poisson et des valeurs du TL propres a une région pour les espèces concernées. On étudiait initialement les communautés dans leur ensemble, en se focalisant ensuite sur les communautés bentho-démersales (c’est-à-dire les espèces vivant sur le sol marin ou à proximité) et en excluant les espèces pélagiques (c’est-à-dire celles vivant dans la colonne d’eau). Les espèces situées au dessus d’une certaine valeur du TL ont été sélectionnées afin de se concentrer sur les communautés de prédateurs.
Les réseaux trophiques du golfe de Gascogne (parties septentrionales et méridionales) révèlent une amélioration générale par rapport aux pressions non durables exercées par la pêche les décennies précédentes, indiquée dans cette évaluation par une augmentation significative du MTL. La biomasse des prédateurs a augmenté, ce qui signifie que la structure des réseaux trophiques est plus stable et donc résiste mieux aux perturbations.
Trois valeurs seuils possibles de MTL ont été utilisés pour évaluer les tendances des modifications du MTL dans le golfe de Gascogne (voir le tableau 1) afin de mieux refléter les modifications dans les TL supérieurs des écosystèmes individuels: un TL > 2,0 (TL_2,0) comprend tous les consommateurs; un TL > 3,25 (TL_3,25) comprend le poisson d’une longueur trophique supérieure; et un TL > 4 (TL_4,0) comprend les prédateurs d’un niveau plus élevé.
Cette augmentation du MTL a été relevée dans la partie septentrionale du golfe de Gascogne lors de l’attribution des valeurs seuils MTL_3,25 et MTL_4,0 aux données provenant des études et des débarquements, sélectionnant ainsi les prédateurs pour l’évaluation (Tableau 1). On a également relevé une augmentation dans le golfe de Gascogne méridional, mais seulement pour les données des études, lorsque l’on exclut les espèces pélagiques et les espèces de niveaux trophiques inférieurs (MTL_3,25). Les tendances positives relevées pour cet indicateur reflètent une augmentation de la biomasse des prédateurs dans la partie septentrionale du golfe de Gascogne et, dans une moindre mesure, dans la partie méridionale. Ceci indique une réduction apparente des pressions exercées par la pêche sur les prédateurs bentho-démersaux de niveaux trophiques supérieurs, permettant probablement aux communautés de commencer à se rétablir d’anciennes perturbations.
La méthodologie utilisée inspire une confiance modérée/basse et la disponibilité des données inspire une confiance élevée/modérée
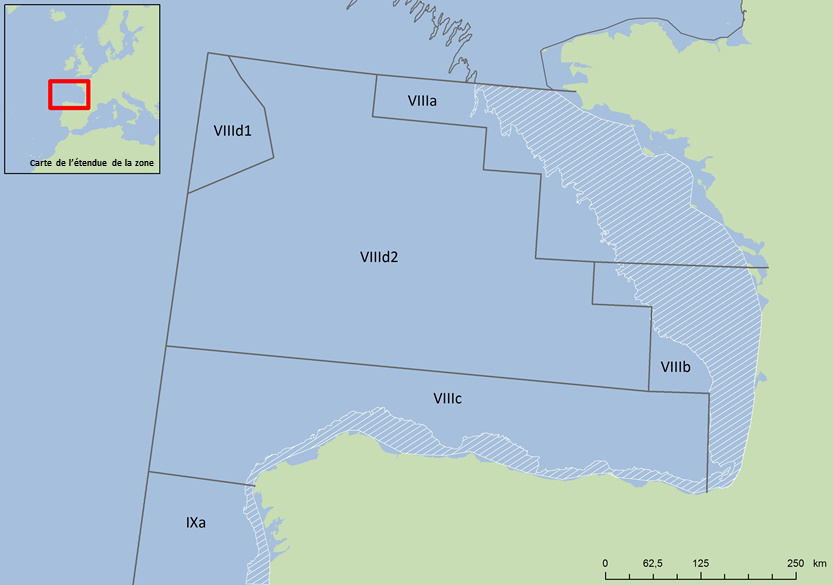
Figure 2: Golfe de Gascogne montrant les sous-divisions régionales et le plateau continental (zone hachurée) du golfe de Gascogne septentrional et méridional
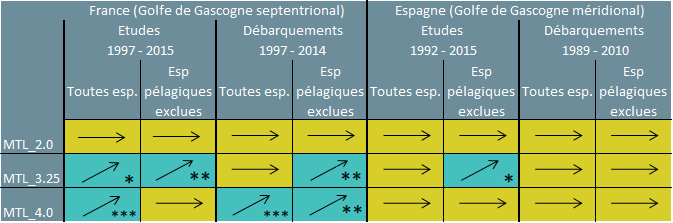
Tableau 1: Tendances des modifications du MTL dans le golfe de Gascogne
Des analyses ont été réalisées en utilisant les données provenant des études et des débarquements et des valeurs seuils différentes pour le niveau trophique moyen (MTL). Les augmentations démontrées statistiquement dans les MTL sont indiquées en vert avec des flèches ascendantes et l’importance statistique; lorsque aucune augmentation n’est calculée, c’est indiqué en vert avec une flèche horizontale. Valeur-p pour l’importance des tests statistiques (modèle linéaire), *: p<0,05, **: p<0,01 ***: p<0,001. esp. : espèces.
The collation of regional TL values for calculating MTL was possible for the main representative species of the landings and survey data, for both the northern and southern parts of the Bay of Biscay. Uncertainty around the MTL indicator is linked to uncertainty around the TL values. Arroyo et al. (2017) showed there was less uncertainty around the MTL indicator when using regional TL values as opposed to global average values (e.g. Fishbase). These results confirm the necessity of giving priority to the development of regional TL values in order to improve the confidence in the assessment of food webs.
Northern Bay of Biscay (subdivisions VIIIa and VIIIb)
Using the scientific survey data, the MTL_2.0 (considering all trophic levels) showed no significant trend in either scenario (i.e. with all species or excluding pelagic species) (Figure c). When applying a mid (MTL_3.25) or high (or MTL_4.0) cut-off, the MTL indicator displayed significant increasing trends (Figure c). The influence of the main species in terms of biomass on the indicator was investigated as part of the EcApRHA (Arroyo et al. 2017).
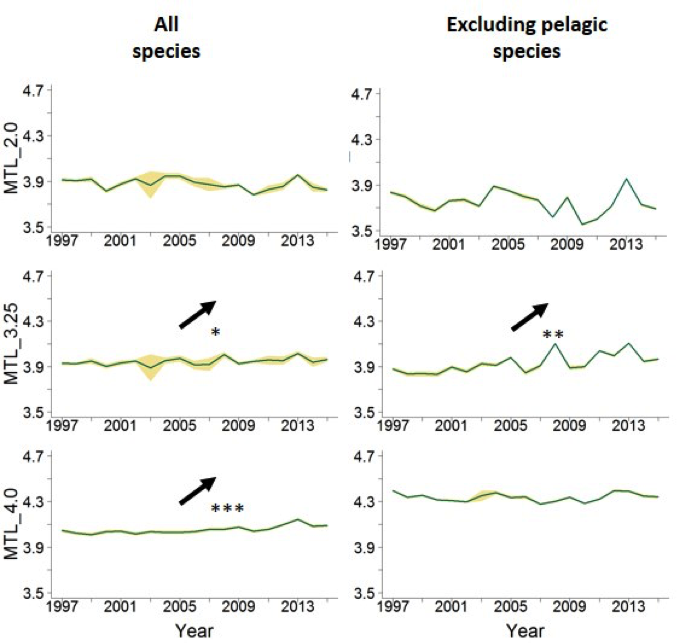
Figure c: Northern Bay of Biscay, EVHOE survey data analyses. Trends in the MTL indicator with different MTL cut-offs and trends in biomass, considering all species or excluding pelagic species
MTL: Mean Trophic Level, MTL_3.25 and MTL_4.0: MTL using the 3.25 and the 4.0 cut-offs respectively, p-value for the statistical tests significance (linear model), *: p<0.05, **: p<0.01 ***: p<0.001. Green line indicates the mean value and yellow shading shows the standard deviation related to the uncertainty of trophic level estimations.
The MTL calculated using landings data and considering all trophic levels (MTL_2.0 in Figure d) displayed no significant trend over the study period, whether all species were considered or pelagic species were excluded. However, significant increases in the MTL indicator were detected when MTL cut-offs were applied. A significant positive trend in MTL_3.25 was observed when pelagic species were excluded. It underlined the effect that the variability in pelagic species biomass has in masking the evolution of the bentho-demersal biomass. MTL_4.0 (top predators only) increased significantly in both cases (with or without pelagic species).
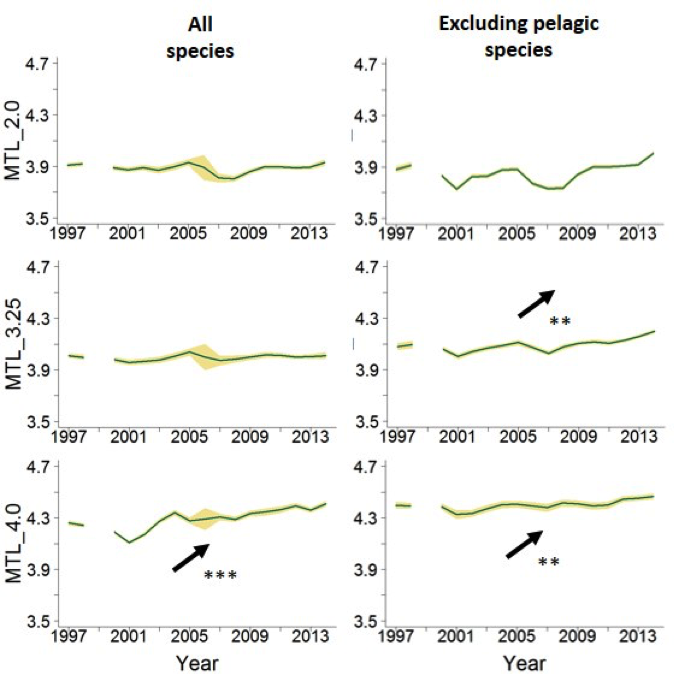
Figure d: Northern Bay of Biscay, landings data analyses
TrTrends in the MTL indicator with different cut-offs and trends in the total biomass caught, considering all species or excluding the pelagic ones. MTL: Mean Trophic Level, MTL_3.25 and MTL_4.0: MTL using the 3.25 and the 4.0 cut-offs respectively, p-value for the statistical tests significance (Mann-Kendal means), *: p<0.05, **: p<0.01, ***: p<0.001. Green line indicates the mean value and yellow shading shows the standard deviation related to the uncertainty of trophic level estimations.
Southern Bay of Biscay (subdivisions VIIIc and IXa-north)
The MTL_2.0 (including all trophic levels) based on the scientific survey data, showed no significant trend with all species included or with pelagic species excluded (Figure e). When applying a mid (MTL_3.25) or high (MTL_4.0) cut-off, analysis revealed a significant trend only for MTL_3.25 without pelagic species. The EcApRHA project (Arroyo et al., 2017) investigated the influence of the main species ontogeny on the MTL indicator to see if its variation could be due to differences in the age composition of the species caught during the survey (and thus in TL values). Results showed no apparent ontogenetic effect on overall MTL trends at any cut-off level, although further studies are needed to confirm these results with a larger number of species.
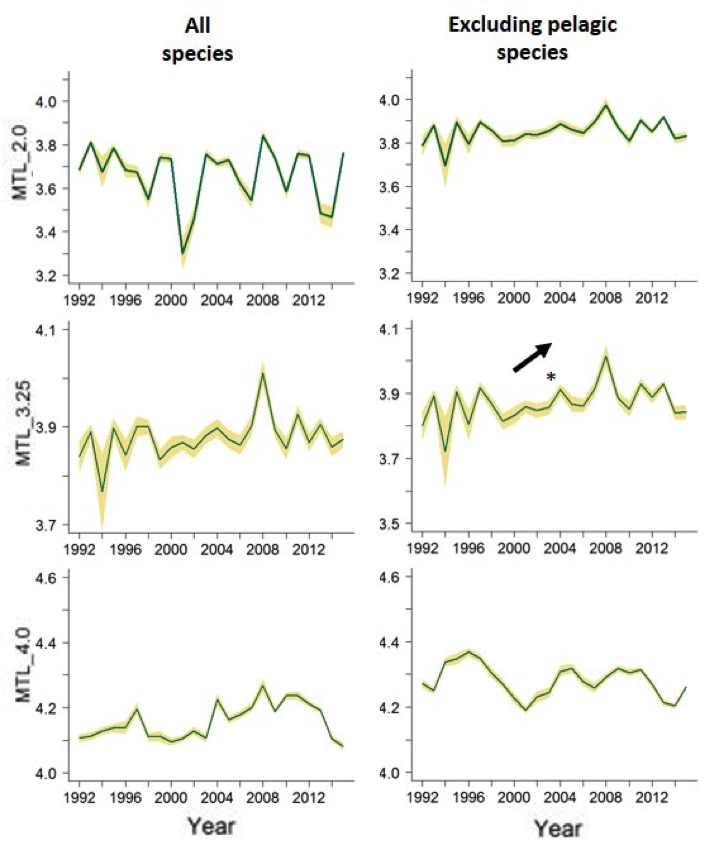
Figure e: Southern Bay of Biscay, DEMERSALES survey data analyses
Trends in the MTL indicator with different cut-offs, considering all species or excluding the pelagic ones. MTL: Mean Trophic Level, MTL_3.25 and MTL_4.0: MTL using the 3.25 and the 4.0 cut-offs respectively, p-value for the statistical tests significance (Mann-Kendal means), *: p<0.05, **: p<0.01, ***: p<0.001. Green line indicates the mean value and yellow shading shows the standard deviation related to the uncertainty of trophic level estimations.
No significant trends were detected in the MTL indicator on historical landings data whether considering all species, excluding pelagic species or applying different cut-offs (MTL_3.25 and MTL_4.0 in Figure f). However, the EcApRHA project highlighted that MTL trends for predator communities can vary depending on the length and the source of the landings time series chosen (Arroyo et al., 2017) and that short terms trends can be masked by long-term analysis. For example, an increasing trend of intermediate TL, driven by pelagic species and a decreasing trend in demersal top predators were observed in the last years of landings data.
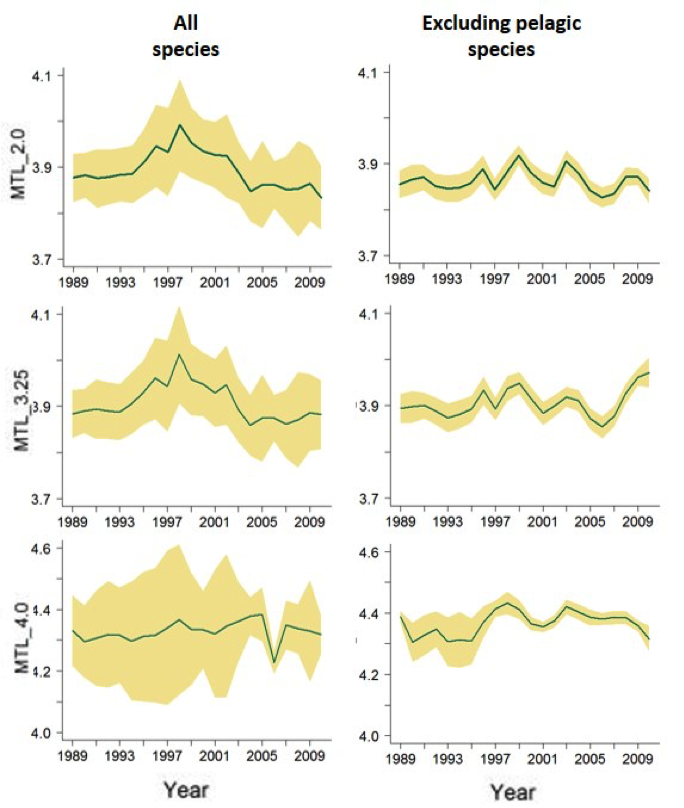
Figure f: Southern Bay of Biscay, landings data analyses
Trends in the MTL indicator with different cut-offs, considering all species or excluding the pelagic ones. MTL: Mean Trophic Level, MTL_3.25 and MTL_4.0: MTL using the 3.25 and the 4.0 cut-offs respectively, p-value for the statistical tests significance (Mann-Kendal means), *: p<0.05, **: p<0.01, ***: p<0.001. Green line indicates the mean value and yellow shading shows the standard deviation related to the uncertainty of trophic level estimations.
Analyses of scientific survey data and landings data show no major variation in the MTL indicator in the Bay of Biscay. This indicates no apparent signal of the state of the marine food web. The results also highlight that the bentho-demersal predator community seems to have been slowly recovering in this area since the beginning of the 21st century, almost certainly due to management regulations set in place, especially in the northern part of the Bay of Biscay. Nevertheless, these findings need to be treated with care as they are highly dependent on the length and source of the time series considered, especially for the landings data (Arroyo et al., 2017).
Confidence assessment
The methodology has been commonly used but consensus in the scientific community has not yet been achieved, resulting in a confidence of low / moderate.
For data availability the rating is moderate / high. There is sufficient spatial coverage for landings data and ground fish survey data. There appears to be sufficient spatial scale for the trophic level information.
Conclusion
Le niveau trophique moyen (MTL) dans le golfe de Gascogne méridional et septentrional ne révèle aucune modification évidente de la structure d’ensemble des réseaux trophiques due aux pressions exercées par la pêche (MTL 2,0 dans le tableau 1). On relève cependant des signes d’amélioration en se concentrant sur les communautés de prédateurs (MTL 3,25 et 4,0 dans le tableau 1).
The Marine Trophic Level (MTL) in the southern and northern parts of the Bay of Biscay showed no apparent sign of changes in food web structure owing to fishing pressure. An increasing trend in the MTL indicator is considered to reflect decreasing impacts of fisheries on food webs; while a stable or decreasing trend should be further investigated in order to determine possible causes. Knowledge of the fisheries history in the region also helps to interpret trends: the implementation of fisheries regulations may have decreased fishing pressure on top predators. Other information about the communities inhabiting the area and the environmental variability may be necessary to confirm the findings of this assessment. Linking the MTL indicator to other biodiversity and food webs indicators (e.g. Typical Length) would also allow a more detailed examination of the impact of fisheries on the ecosystem.
Further work can be undertaken to improve the assessment of the state of the food web. This assessment is based on invertebrates and vertebrates species in most cases, mainly bentho-demersal species. Incorporating additional datasets on other biological compartments (e.g. benthos, mammals, or birds) and / or from other sources (e.g. pelagic survey data or models) into the MTL indicator will enable a more holistic assessment of the area. For instance, using the OSPAR Groundfish survey monitoring and assessment data product in the northern Bay of Biscay, was a first step in the assessment of this indicator. However, data on invertebrates (including cephalopods), which represent an important component of the biomass in the Bay of Biscay food web, which are important prey items with a fundamental role in the food web, and which can influence the indicator trends, should also be included.
It would beneficial for the further development of this indicator if the work started in the EcApRHA project was continued. Specifically, the influence of some important demersal / pelagic species on the MTL indicator trends, and how they influence the overall assessment should be examined in more detail (Arroyo et al., 2017). Investigating the direct influence of particular anthropogenic pressures on MTL variations (e.g. fishing mortality of species or indicators linked to habitat loss due to fisheries) also needs to be further explored.
Applying the indicator to finer geographic scales and assessment units would help map regional variation in the MTL indicator, and so identify particularly impacted areas within those subject to high fishing pressure.
Lacunes des connaissances
Il faut absolument comprendre les relations alimentaires entre les espèces présentes dans une région spécifique pour pouvoir entreprendre une évaluation robuste des réseaux trophiques, soit en utilisant l’indicateur du MTL soit tout autre indicateur basé sur le niveau trophique. Il n’est pas possible actuellement d’appliquer l’indicateur du MTL en dehors du golfe de Gascogne, en l’absence d’informations détaillées sur les interactions alimentaires et le niveau trophique (TL) propres à une région. On pourrait combler ces lacunes en réitérant les études du régime alimentaire mises en œuvre à l’échelle (sous)-régionale et en calculant les valeurs du TL.
Des travaux supplémentaires sur l’indicateur du MTL, permettant d’améliorer l’évaluation de l’état des réseaux trophiques, pourraient notamment consister à: incorporer des séries de données supplémentaires sur les compartiments biologiques qui ne sont pas inclus actuellement (par exemple, benthos, mammifères ou oiseaux); étudier l’influence de diverses pressions anthropiques; envisager des échelles géographiques plus petites et mieux définir les valeurs d’évaluation.
In order to establish trophic relationships more accurately so that TL values can be determined, data are required on species feeding habits and their variations with ontogeny, where this is lacking. Comprehensive datasets on the feeding ecology of many of the key species in marine food webs are currently insufficient for the purposes of conducting this type of assessment, and this is especially the case for species at lower trophic levels.
The first step in filling these gaps in knowledge of food web structure and connectivity is to extend data collection on feeding ecology at a sub-regional scale (Carafa et al., 2007; Moloney et al., 2010; Rossberg et al., 2011). Large-scale surveys (such as the Data Collection Framework (DCF) bottom-trawl and pelagic surveys) could aim at systematically collecting; as many species as possible in the food web; and data for dietary analyses using stomach content and / or stable isotope analyses for the different size classes of a given species (in order to account for the ontogeny effect on species TL values). Analyses of stomach contents can provide accurate information on the species consumed as well as serving as a sampler of the smaller invertebrates and other benthic components not retained by the sampling gear and so not represented in the survey data. Stable isotope analyses indicate trophic level based on a longer feeding signature, and so provide a broader view of feeding strategy of a given species.
Arroyo, N.L., Le Loc’h, F., Preciado, I., Niquil, N., Vouriot, P., Safi, G. 2017. Implementation of the mean trophic level indicator (MTL FW4) and assessment of its use at a sub-regional level (OSPAR region IV), as a contribution to the EU Co-financed EcApRHA project (Applying an ecosystem approach to (sub) regional habitat assessments), deliverable No. 3.1.
Bodin, N., Le Loc’h, F., Caisey, X., Le Guellec, A.M., Abarnou, A., Loizeau, V., and Latrouite, D. 2008. Congener-specific accumulation and trophic transfer of polychlorinated biphenyls in spider crab food webs revealed by stable isotope analysis. Environmental Pollution 151: 252-261.
Branch, T., Watson, R., Fulton, E., Jennings, S., McGillard, C., Pablico, G., Ricard, D., and Tracey, S. 2010. Trophic fingerprint of marine fisheries. Nature 468: 431-435.
Carafa, R., Dueri, S., Zaldívar, and J.M. 2007. Linking terrestrial and aquatic ecosystems: Complexity, persistence and biodiversity in European food webs. In: EUR 22914 EN, Joint Research Centre.
Chassot, E., Rouyer, T., Trenkel, V.M., and Gascuel, D. 2008. Investigating trophic-level variability in Celtic Sea fish predators. Journal of Fish Biology 73: 763–781.
Chouvelon, T., Spitz, J., Caurant, F., Mèndez-Fernandez, P., Autier, J., Lassus-Débat, A., Chappuis, A., and Bustamante, P. 2012. Enhanced bioaccumulation of mercury in deep-sea fauna from the Bay of Biscay (north-east Atlantic) in relation to trophic positions identified by analysis of carbon and nitrogen stable isotopes. Deep Sea Research Part I: Oceanographic Research Papers 65: 113–124.
Essington, T.E., Beaudreau, A.H., and Wiedenmann, J. 2006. Fishing through marine food webs. Proceedings of the National Academy of Sciences USA 103: 3171−3175.
Jennings, S., Greenstreet, S., Hill, L., Piet, G., Pinnegar, J., and Warr, K.J. 2002. Long-term trends in the trophic structure of the North Sea community: evidence from stable-isotope analysis, size-spectra and community metrics. Marine Biology 141: 1085-1097.
Lassalle, G., Lobry, J., Le Loc’h, F., Bustamante, P., Certain, G., Delmas, D., Dupuy, C., Hily, C., Labry, C., Le Pape, O., Marquis, E., Petitgas, P., Pusineri, C., Ridoux, V., Spitz, J., and Niquil, N. 2011. Lower trophic levels and detrital biomass control the Bay of Biscay continental shelf food web: implications for ecosystem management. Progress in Oceanography 91: 61–75
Lassalle G., Gascuel D., Le Loc’h F., Lobry J., Pierce G.J., Ridoux V., Santos M.B., Spitz J. & Niquil N. (2012) An ecosystem approach for the assessment of fisheries impacts on marine top-predators: the Bay of Biscay case study. ICES Journal of Marine Science 69: 925-938.
Lassalle, G., Chouvelon, T., Bustamante, P., and Niquil, N. 2014. An assessment of the trophic structure of the Bay of Biscay continental shelf food web: Comparing estimates derived from an ecosystem model and isotopic data. Progress in Oceanography 120: 205-2015.
Le Loc’h, F. and Hily, C. 2005. Stable carbon and nitrogen isotope analysis of Nephrops norvegicus / Merluccius merluccius fishing grounds in the Bay of Biscay (Northeast Atlantic). Canadian Journal of Fisheries and Aquatic Sciences 62: 123–132.
Le Loc’h, F., Hily, C., and Grall, J. 2008. Benthic community and food web structure on the continental shelf of the Bay of Biscay (North Eastern Atlantic) revealed by stable isotopes analysis. Journal of Marine Systems 72: 17–34.
Moloney, C.L., St John, M.A., Denman, K.L., Karl, D.M., Koster, F.W., Sundby, S., and Wilson, R.P. 2010. Weaving marine food webs from end to end under global change. Journal Of Marine System 84: 106-116.
Morato, T., Watson, R., Pitcher, T.J., and Pauly, D. 2006. Fishing down the deep. Fish 7: 24−34.
Moriarty, M. and Greenstreet, S.P.R. (in prep). Derivation of Groundfish survey monitoring and assessment data products for the Northeast Atlantic area. Scottish Marine and Freshwater Science Report Vol xx Noxx.
Navarro, J., Coll, M., Louzao, M., Palomera, I., Delgado, A., and Forero, M.G. 2011. Comparison of ecosystem modelling and isotopic approach as ecological tools to investigate food webs in the NW Mediterranean Sea. Journal of Experimental Marine Biology and Ecology 401: 97-104.
Pauly, D., and Watson, R. 2005. Background and interpretation of the ‘Marine Trophic Index’ as a measure of biodiversity. Philosophical Transactions of the Royal Society: Biological Sciences 360: 415-423.
Pauly, D., Christensen, V., Dalsgaard, J., Froese, R., and Torres Jr., F. 1998. Fishing down marine food webs. Science 279: 860 – 863.
Pauly, D., Hilborn, R., and Branch, A. 2013. Does catch reflect abundance? Nature 494: 303-306.
Pinnegar, J.K., Jennings, S., Brien, C.M.O., and Polunin, N.V.C. 2002. Long-term changes in the trophic level of the Celtic Sea fish community and fish market price distribution. Journal of Applied Ecology 39: 377-390.
Quéro, J-C., Dardignac, J., and Vayne, J-J. 1989. Les poissons du Golfe de Gascogne. Institut Français de Recherche pour l’Exploitation de la Mer. 229pp.
R Core Team (2015). R: A language and environment for ## statistical computing. R Foundation for Statistical Computing, ## Vienna, Austria. URL https://www.R-project.org/.
Rossberg, A. G., Farnsworth, K. D., Satoh, K., and Pinnegar, J. K. 2011. Universal power-law diet partitioning by marine fish and squid with surprising stability-diversity implications. Proceedings of the Royal Society B 278 (1712): 1617–1625.
Scherrer, B. 1984. Biostatistique. Gaëtan Morin éditeur. 850pp.
Shannon, L., Coll, M., Bundy, A., Gascuel, D., Heymans, J. J., Kleisner, K., Lynam, C. P., Piroddi, C., Tam, J., Travers-Trolet, M., and Shin, Y. 2014. Trophic level-based indicators to track fishing impacts across marine ecosystems. Marine Ecology Progress Series 512: 115-140.
Stergiou, K.I., and Tsikliras, A.C. 2011. Fishing down, fishing through and fishing up: fundamental process versus technical details. Marine Ecology Progress Series 441: 295−301.
Swartz, W., Sala, E., Tracey, S., Watson, R., and Pauly, D. 2010. The spatial expansion and ecological footprint of fisheries (1950 to present). PLoS ONE 5: e15143.
The University of Waikato, 2017. Marine food webs. Science learning hub, sciencelearn.org.nz https://www.sciencelearn.org.nz/resources/143-marine-food-webs
Vinagre, C., Salgado, J., Mendonca, V., Cabral, H., and Costa, M. 2012. Isotopes reveal fluctuation in trophic levels of estuarine organisms, in space and time. Journal of Sea Research 72:49-54.