

Déchets sur les plages - Abondance, composition et tendances
D10 - Déchets sur les plages
D10.1 - Caractéristiques des déchets présents dans l’environnement marin et côtier
Message clé:
Les déchets sont abondants sur les plages dans la zone maritime OSPAR. Les types les plus courants de déchets se trouvant sur les plages sont des fragments plastiques, les déchets liés à la pêche et des emballages. Dans certaines zones plus de 90% des déchets sont des objets en plastique. Il n’existe pas de tendance générale du nombre d’objets notifiés au cours de la période de 2009 à 2014.
Area assessed
Printable Summary
Contexte
L’objectif stratégique d’OSPAR est de « réduire considérablement les déchets marins dans la zone maritime OSPAR pour les ramener à des niveaux tels que leurs propriétés et leurs quantités ne sont pas préjudiciables pour le milieu marin et côtier »
Cette évaluation décrit l’abondance et la composition des déchets sur les plages dans la zone maritime OSPAR. Il s’agit de 76 plages en 2014/2015, et les tendances des objets qui ont été identifiés sur 19 plages durant la période de 2009 à 2014.
L’abondance des déchets marins dans la zone maritime OSPAR fournit des informations sur l’échelle et l’ampleur de la pollution par les déchets dans les eaux adjacentes et les zones côtières, indiquant les différences spatiales de la pollution par les déchets. Les déchets présents sur une plage donnée peuvent provenir d’une source locale, en mer ou à terre, ou de sources éloignées, transportés par des fleuves ou des courants océaniques.
La composition des déchets sur les plages donne une indication de l’échelle et de l’ampleur du problème ainsi que du niveau des menaces pour le milieu marin. Les différences spatiales dans la composition des déchets d’un site d’étude à l’autre indiquent les différences régionales des sources.
")
Photo: Beach litter in the UK (copyright, Clare Sambrook)
Les modifications de la composition et des tendances de l’abondance des déchets sur les plages mettent en évidence les zones pour lesquelles des mesures de réduction sont nécessaires et, lorsqu’elles sont mises en œuvre, l’étendue de leur succès.
The OSPAR indicator on beach litter is used to identify changes in the input of litter to the marine environment. The assessment is based on a time-series of abundance and type of litter items collected on 100-m stretches of coastline.
What is meant by marine litter?
Marine litter (marine debris) is any persistent, manufactured or processed solid material discarded, disposed of, abandoned or lost in the marine and coastal environment. It includes items entering the marine environment via rivers, sewage outlets, storm water outlets and windblown litter items.
What information do beach litter surveys supply?
Surveys that record all litter items found on a given stretch of beach can be used to assess marine litter pollution. The data collected provide information on amounts, trends in abundance, and sources of marine litter.
The abundance of marine litter at OSPAR survey sites provides information on the magnitude of litter pollution in adjacent waters and coastal areas and can indicate spatial differences in litter pollution. The litter on a given OSPAR beach may be generated locally at sea or on land, but may also arrive via ocean currents, rivers and wind drift from distant sources.
The composition of the litter recorded on the beaches provides information on the frequency of different litter items (e.g. plastic bags, metal tins) or litter categories (e.g. plastic, wood). This in turn provides information on the source of the litter and to some extent its level of threat (wood is not as harmful to the marine environment as plastic).
Spatial differences in litter composition can reflect regional differences in sources or human activities. However, it is important to note that a given survey site or region receives litter from a number of sources. These may be local, regional or distant. Changes in composition can provide information on changes in sources and litter type (i.e. certain litter items becoming more abundant – such as plastic bottles replacing glass bottles – or the introduction of new litter items).
Trends in the abundance of individual litter items or litter types (e.g. fisheries related items) and in total litter abundance provide information on changes in the level of pollution and on the effectiveness of measures introduced to reduce marine litter.
Proportion of marine litter assessed?
The litter encountered on beach litter survey sites can originate from the sea, i.e. flotsam (wreckage of a ship or its cargo) transported to and deposited on the coast by winds and water currents, or can be directly deposited on the coast by humans, for example, tourists, fishermen, or fly-tippers. Litter can also be deposited further inland on riverbanks or be discharged directly into rivers and then transported by rivers into the marine environment.
In the period between any two beach litter surveys, litter items that have been washed ashore by tides or deposited directly on to the beach may be buried, or removed by subsequent tides and winds. However, buried litter can also resurface during strong wave action (Williams and Tudor, 2001) and litter can be blown onto the beach from adjacent land or streets. Therefore, the amount of litter items recorded during any one survey, will constitute a minimum value for litter deposited at the site.
The litter washed ashore is biased towards litter items that float and that do not disintegrate, dissolve or quickly decay in the marine environment. The main category of litter found on beaches in the assessment period was ‘plastic and polystyrene’, which often floats and does not disintegrate rapidly in water. The main components of the other common litter categories all float and / or decay slowly (wood, bottles, jars, lightbulbs, paper cartons, tins and cans). The composition of litter recorded on beaches thus reflects its ability to reach the shore. Metal and glass are therefore under-represented because they are more likely to sink than items made of plastic, polystyrene, rubber and wood. Paper is under-represented because generally disintegrates more rapidly in water than the other items.
Although only a fraction of what is disposed of into the sea reaches the shore, the abundance of the items found can be used as an indication of the level of marine litter pollution in a given area, if it is assumed that the floating element of the litter represents a constant proportion of the total litter input. Surveys of litter items deposited on the seafloor (by recording litter caught in trawls during fish stock surveys) are used to identify trends in items that do not float (see assessment of Composition and Spatial Distribution of Litter on the Seafloor).
Development of the OSPAR beach litter monitoring (2001–2014)
The OSPAR beach litter monitoring began as a pilot project in 2001. The method for monitoring marine beach litter was initially developed by experts of the Beachwatch and Coastwatch projects and was agreed upon by the OSPAR Pilot Project Steering Group in 2000. Based on experience from the field surveys, the survey protocol was subsequently amended and updated by the Pilot Project Steering Group in 2001, 2002 and 2009. The OSPAR Guideline for Monitoring Marine Litter on the Beaches in the OSPAR Maritime Area was published in 2010 (OSPAR Agreement 2010-02).
Between 2009 and 2015, OSPAR beach litter surveys were undertaken in Belgium, Denmark, France, Germany, Ireland, the Netherlands, Norway, Portugal, Spain, Sweden and the United Kingdom.
The number of survey sites and the number of surveys have both increased since the start of the monitoring programme in 2001. The increase was particularly noticeable after 2011, in response to the implementation of the EU Marine Strategy Framework Directive (MSFD) (Figure a). The present network of survey sites is more comprehensive (Figure b). The number of survey sites and surveys peaked in 2013 (77 survey sites and 268 surveys) before falling due to reduced surveying in the Celtic Seas area.
Despite an overall increase in the number of survey sites, the specific sites used and the number of surveys undertaken per year at those sites have varied. As a result, the beach litter data have been assessed in two ways:
- Trends in the abundance of litter items have been calculated using data for the period 2009–2014, collected from the 19 most consistently monitored survey sites.
- Abundance and composition have been calculated using data for 2014 and 2015, collected from 76 survey sites (because these data provide greater spatial coverage).
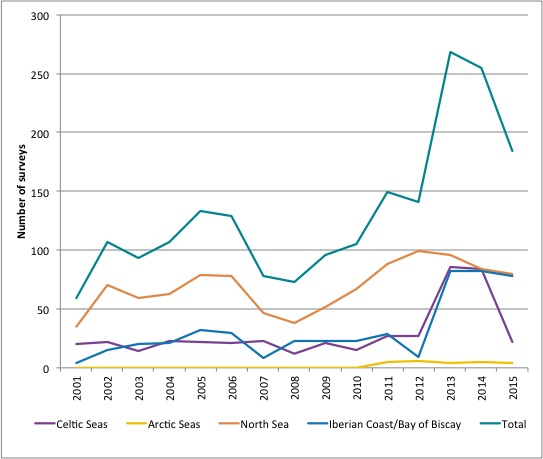
Figure a: Number of surveys carried out each year across the OSPAR survey sites
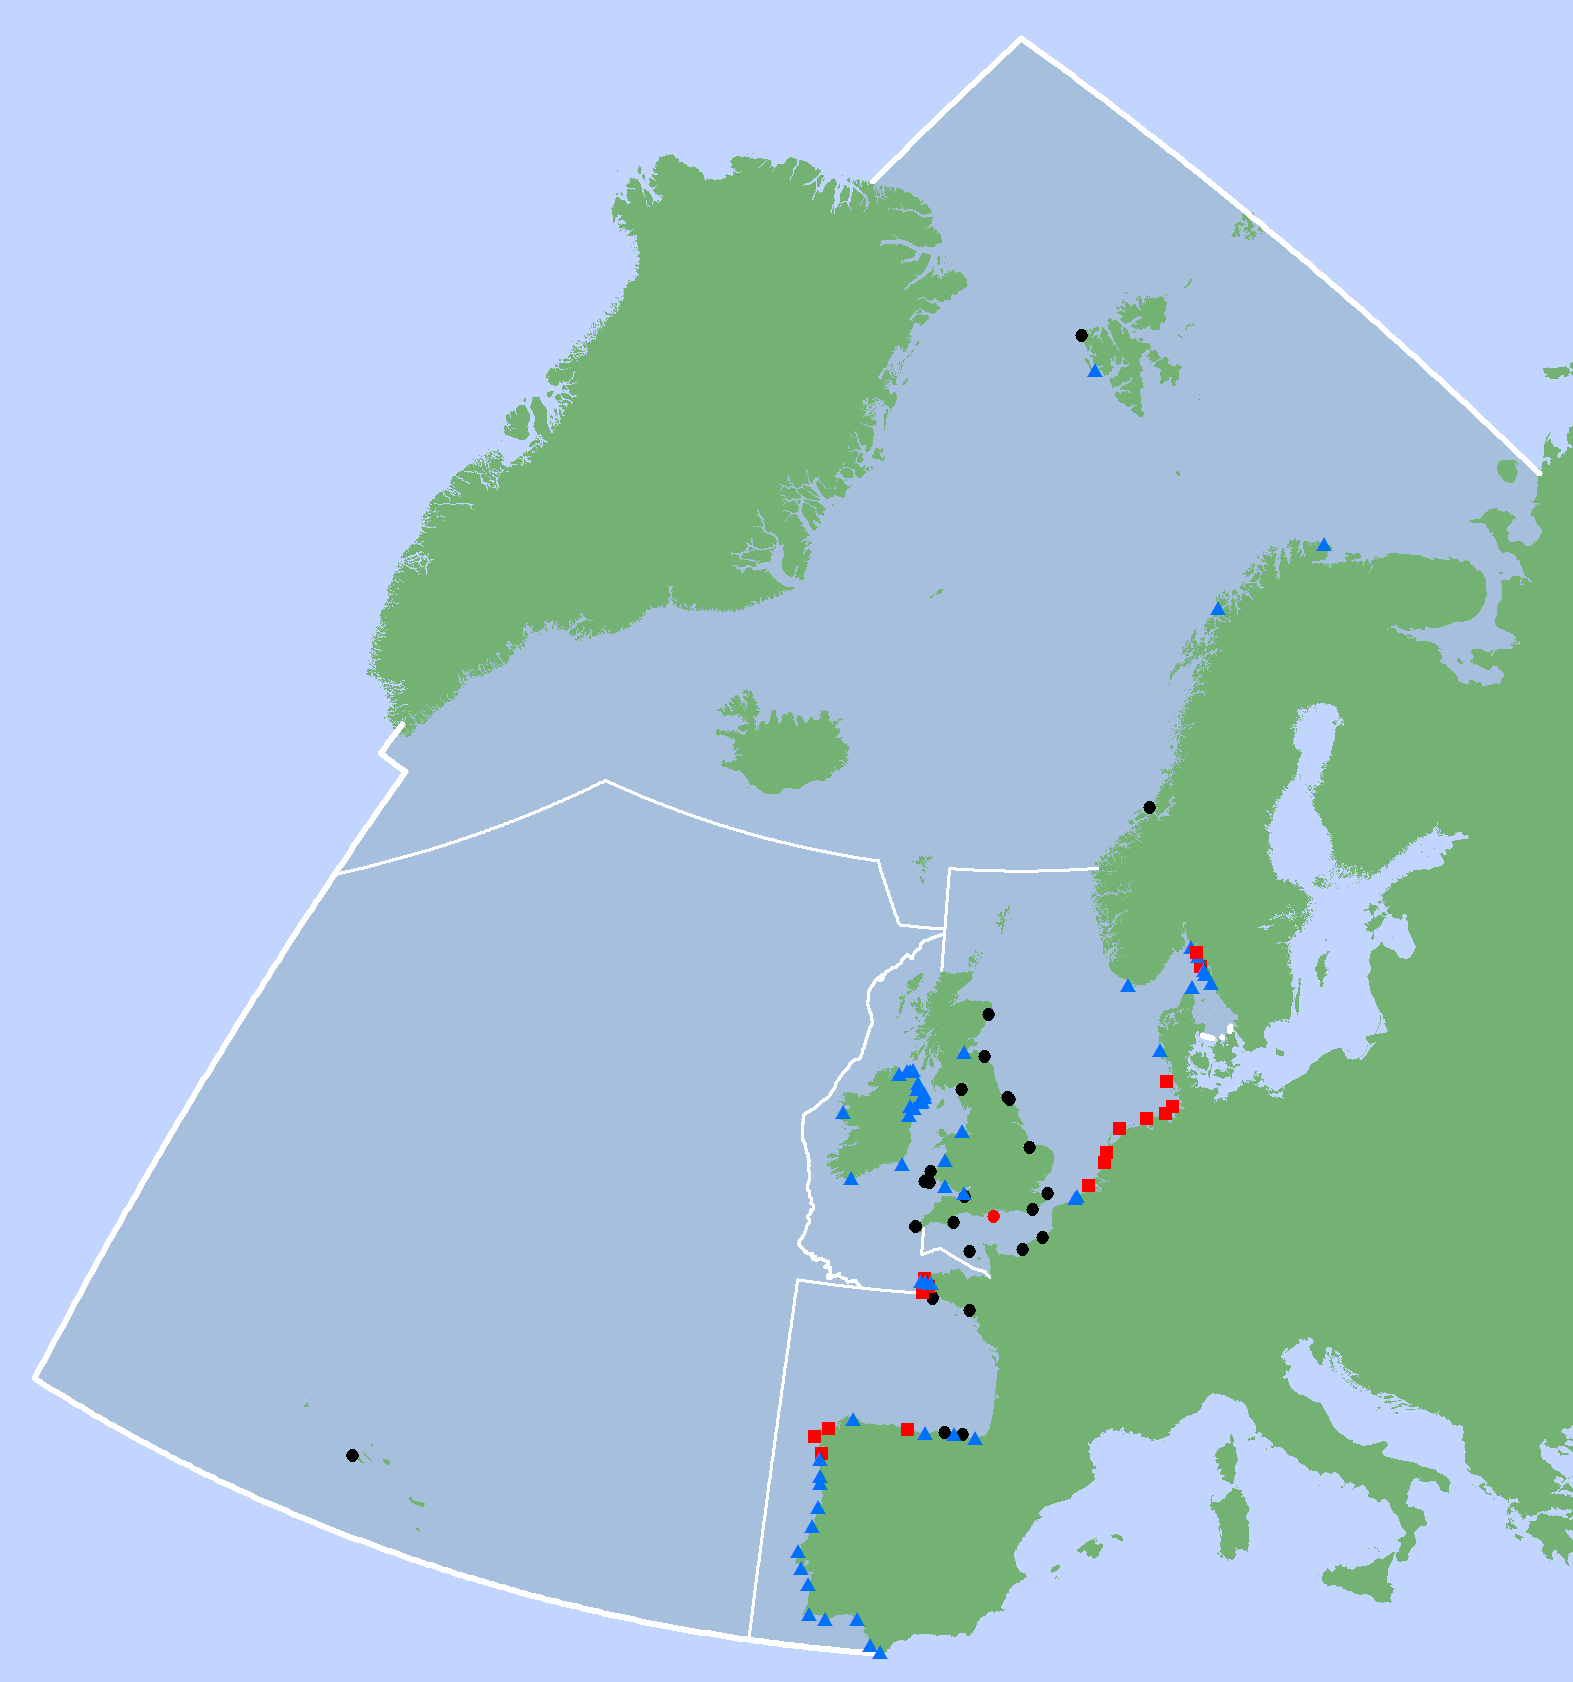
Figure b: OSPAR beach litter survey sites for data collected between 2001 and 2015.
red squares = data used for the assessment 2009-2014 and 2014/15; red circle = data used for the assessment 2009-2014 only due to lack of data for 2014 and 2015; blue triangles = data only used for the assessment 2014/15; black symbols = survey sites not suitable for the assessments 2009-2014 and 2014/15 because no or an insufficient number of surveys are available within the assessment period.
OSPAR Litter Monitoring Programme
In 2010, OSPAR published a Guideline for Monitoring Marine Litter on the Beaches in the OSPAR Maritime Area (OSPAR Agreement 2010-02), as a tool for standardising the collection of litter data in the marine environment.
Within the OSPAR Litter Monitoring Programme, litter is counted on standard stretches of coastline (survey sites) situated in eleven countries (Belgium, Denmark, France, Germany, Ireland, the Netherlands, Norway, Portugal, Spain, Sweden and the United Kingdom) on the North-East Atlantic coast. The data used for the assessment were collected during surveys on 100-m stretches of coastline. The distribution of the 100-m beach litter survey sites is presented in Figure b.
The reference beaches mainly comprise sand or gravel and are exposed to the open sea. They are in most cases accessible to surveyors all year round for surveying and litter removal. However some sites, such as in the north of the OSPAR Maritime Area, are not accessible or not possible to survey during the winter survey period. Beaches selected have a minimum length of 100 m, are generally free of buildings all year round, and are (in most cases) not subject to litter collection activities (beach cleaning). National coordinators of the surveys have used expert judgement and local knowledge of coastal areas when selecting reference beaches. For example, in some countries local conditions do not allow for selection of beaches mainly comprising sand, and in some locations it is not possible to select beaches of 100 m in length.
The start and end points of the survey sites are marked clearly, to ensure that exactly the same site is monitored for all surveys. Reference beaches are (normally) surveyed four times a year.
The survey periods are as follows: winter (between mid-December and mid-January), spring (April), summer (between mid-June and mid-July), and autumn (between mid-September and mid-October).
The surveys on all reference beaches within a given region should be carried out within the shortest timeframe possible within a given survey period. Coordinators within the regions arrange the survey dates bilaterally. Ideally, a given beach would be surveyed on the same days each year.
Survey sites are a 100-m long section of beach. The entire area from the waterline to the back of the beach is surveyed, with the back of the beach determined by the presence of a dune or a sea wall, for example.
Data on the amount of litter on a given stretch of coastline is recorded at item level. Items to be recorded are predefined by the Guideline for Monitoring Marine Litter on the Beaches in the OSPAR Maritime Area (OSPAR Agreement 2010-02). Items comprise identifiable pieces of litter, including items such as plastic bottles, tetra-pak containers, metal drinks cans, and rubber gloves. The items recorded are assigned to specific categories according to the material from which they are made (e.g. plastic, wood, metal) or their use (e.g. medical, sanitary). In total, there are 112 predefined litter item types: Plastic / polystyrene (54 items), Metal (15 items), Paper and cardboard (9 items), Wood (9 items), Sanitary waste (6 items), Cloth (5 items), Rubber (4 items), Glass (3 items), Pottery/ceramics (3 items), Medical waste (3 items) and Faeces (1 item).
It is important to note that some litter items categorised as sanitary and medical are made of materials listed individually. For example, the litter item cotton bud sticks, which are a major component of beach litter in some regions, is included in the sanitary category despite being mainly made of plastic. In this case, the litter item has been captured in a separate category to link the item type to its sources, with the ultimate aim of enabling the development of suitable litter reduction measures.
Each litter item has a unique OSPAR identification number. In each survey for a given beach the number of individual pieces of litter is recorded for each litter item. The survey forms allow for the registration of identifiable items, unknown items and litter fragments in different size categories. Litter items which do not fit into a definite category, are registered under the litter item ‘other’ for the given material or use category. A short description of these items is included on the survey form. Multilingual photo guides are available to assist surveyors with the identification and categorisation of litter items. All litter items are removed from the beach during the survey.
Although the beaches surveyed are generally sandy, several other beach types are included in the OSPAR Litter Monitoring Programme (OSPAR Agreement 2011-01). These include rocky, boulder and shingle beaches as well as beaches with different levels of pebble, rock, shingle and vegetation coverage. Physical characteristics of the survey site influence deposition and retention levels of litter, for example rocky coasts with sandy bays have the potential to accumulate and retain more litter than long open sandy beaches. Furthermore, water currents, weather conditions and prevailing wind conditions, have a significant influence on deposition and retention of litter and thus litter abundance. This is also the case for beach use and proximity to point and diffuse sources such as towns.
For these reasons the location and physical characteristics of each reference beach are recorded in detail. This information includes the proximity of possible sources of marine litter to the beach, as well as other factors that could help explain the amount, type, and composition of marine litter found. This information is stored in the OSPAR Beach Litter Database. Such parameters should also be considered in future assessments.
Assessment method
Data from a six-year period (2009–2014) were used to assess trends in abundance of litter items, trends in groups of litter items and trends in material categories. The present distribution of survey sites and the availability of survey data at these sites, allow trend assessments to be undertaken for the southern North Sea, the Swedish west coast and the Spanish north-west coast (Table a and Table b).
An assessment of the composition of litter, using all available data from surveys in the years 2014 and 2015 (Table c), is presented for the Celtic Seas (22 beaches), Bay of Biscay / Iberian Coast (approximately 21 beaches), Arctic Waters (5 beaches), Northern North Sea (11 beaches, six of these in Sweden) and Southern North Sea (17 beaches).
| Region | Number of Surveys |
|---|---|
| Arctic Waters | 20 |
| Northern North Sea | 141 |
| Celtic Seas | 260 |
| Southern North Sea | 345 |
| Bay of Biscay / Iberian Coast | 248 |
| Total | 1014 |
| Region | Number of Surveys |
|---|---|
| Swedish west coast (Northern North Sea) | 31 |
| Southern North Sea | 276 |
| Spanish north-west coast (Iberian Coast) | 83 |
| Region | Number of Surveys |
|---|---|
| Arctic Waters | 9 |
| Northern North Sea | 52 |
| Celtic Seas | 106 |
| Southern North Sea | 112 |
| Bay of Biscay / Iberian Coast | 160 |
Only sites with a minimum of 15 surveys in the six-year assessment period (2009–2014) are included in the trend analysis for litter items, total abundance (i.e. the sum of all litter items per beach, per survey), and the calculation of the arithmetic average and median abundance of litter items per survey and site.
The annual abundance of the litter items comprising the top 80% of the total number of items recorded, are used to assess trends, because the other items are not usually found in sufficient numbers to allow trend analysis. Trends in abundance were also calculated for litter items that are considered especially harmful to the marine environment, due to the threat of entanglement, ingestion or injury. In addition, trends in abundance were calculated for the different categories of litter items (i.e. the material from which the litter is made or their use).
The objective of OSPAR Contracting Parties is to have a significantly decreasing trend in the abundance of the most common litter items, which make up 80% of the total amount of litter recorded. A target for total abundance is not set, because total abundance does not relate to specific measures implemented or planned for given litter items or groups of items.
The software package Litter Analyst (version 3) was used to perform the assessment of marine litter in the OSPAR Maritime Area for the period 2009–2014, and 2014–2015. For detailed information on how the Litter Analyst tool assesses OSPAR beach litter data see the Litter Analyst 3.0 User Manual (van der Meulen and Baggelaar, 2016).
For the 2009–2014 period, aggregations of beaches were made for the southern North Sea, the north-west coast of Spain and the west coast of Sweden. For the 2014–2015 period, aggregations of beaches were made for the Arctic Waters, Northern North Sea, Southern North Sea, Celtic Seas and Bay of Biscay / Iberian Coast regions.
In presenting aggregated data for a number of survey sites in a given region, it must be made clear that, because the selection of survey sites was not made randomly, the results can only be regarded as representative for the group of beaches monitored and not for the region in which they are situated. Spatially, the results are biased due to the use of fixed monitoring locations; however, this sampling method improves trend analysis, because spatial variation (i.e. between randomly selected sites) is eliminated. The distribution of survey sites is shown in Figure b.
How the Litter Analyst tool selects the data for calculating abundance and trends is included in the Litter Analyst manual.
Owing to changes in the structure of the recording form in 2010 the following clusters were used for analysing data collected between 2009 and 2014:
- Plastic nets and ropes (OSPAR ID 300) - includes the items OSPAR ID 31 plastic rope (diameter >1 cm), OSPAR ID 32 plastic string and cord (diameter <1 cm), OSPAR ID 115 plastic nets and pieces of net (<50 cm), OSPAR ID 115 plastic nets and pieces of net (>50 cm), OSPAR ID 200 plastic rope / cord / nets (<50 cm), and OSPAR ID 201 plastic rope / cord / nets (>50 cm).
- Plastic and polystyrene pieces <50 cm (OSPAR ID 301) - includes the items OSPAR ID 46 plastic / polystyrene pieces (2.5–50 cm), OSPAR ID 117 plastic / polystyrene pieces (0–2.5 cm), and OSPAR ID 202 plastic / polystyrene pieces (<50 cm).
- All Gloves (OSPAR 304) - includes the items OSPAR ID 25 Gloves (typical washing up gloves), OSPAR ID 113 Gloves (industrial / professional gloves), and OSPAR ID 203 rubber gloves (used until 2009).
Résultats
Il n’existe pas de tendance générale de l’abondance d’objets sur les plages de la zone maritime OSPAR notifiés au cours de la période de 2009 à 2014. On peut cependant identifier des tendances à la baisse importante ainsi que des tendances à la hausse pour certains objets dans des sites d’étude individuels (tels que sur la côte nord-ouest de l’Espagne où l’abondance de coton tiges a diminué de 12%).
L’abondance totale moyenne des objets sur 100 m de côte varie énormément dans la Zone maritime OSPAR et au sein des sous-régions. Les valeurs sont présentées pour la période de 2014 à 2015 (Figure 1) car des séries de données plus longues n’étaient pas disponibles pour l’ensemble de la zone maritime OSPAR. Les moyennes sont similaires pour les sites d’étude de la mer du Nord méridionale (311), les mers Celtiques (434) et le golfe de Gascogne / la côte ibérique (365) mais d’un ordre de grandeur supérieur pour la mer du Nord septentrionale (principalement dans le Skagerrak, 6 090). Cependant, l’abondance en mer du Nord septentrionale varie grandement d’un site à l’autre et au sein d’un site.
La plupart de ces objets sont en plastique ou polystyrène (Figure 2). Dans l’ensemble des sites d’étude OSPAR, les fragments plastiques sont le type de déchet le plus courant, suivis par les emballages (pour aliments et boissons) et les objets liés à la pêche (Figure 3). Les emballages consistent essentiellement en objets en plastique (il s’agit notamment de bouchons et couvercles, d’emballages alimentaires, d’emballages pour snack, de bâtons de sucettes et de sacs plastiques). Les objets liés à la pêche sont les filets et cordages et les filets et cordages enchevêtrés. Les bouteilles et récipients pour boisson sont parmi les objets les plus enregistrés dans les sites d’étude de toutes les mers à l’exception de la mer du Nord septentrionale. On considère que tous ces objets sont dangereux pour le milieu marin à cause du risque potentiel d’enchevêtrement, d’ingestion ou de blessure.

Figure 1: Nombre moyen d’objets sur 100 m pour la période de 2014 à 2015
D’autres objets sont également enregistrés fréquemment, en particulier dans les sites d’étude des régions suivantes:
- coton tiges dans les mers Celtiques, le golfe de Gascogne / la côte ibérique et la mer du Nord septentrionale;
- mégots dans le golfe de Gascogne / la côte ibérique;
- ballons en caoutchouc dans la mer du Nord méridionale, la mer du Nord septentrionale, certains sites d’étude des mers Celtiques et un site d’étude du golfe de Gascogne / de la côte ibérique;
- cartouches de chasse dans la mer du Nord méridionale, la mer du Nord septentrionale et les mers Celtiques.
L’abondance de ces objets indique des problèmes propres à une région et concernant l’évacuation des eaux usées, les déchets liés aux fumeurs et aux chasseurs et ceux liés à des lâchers de ballons lors de manifestations publiques et privées.
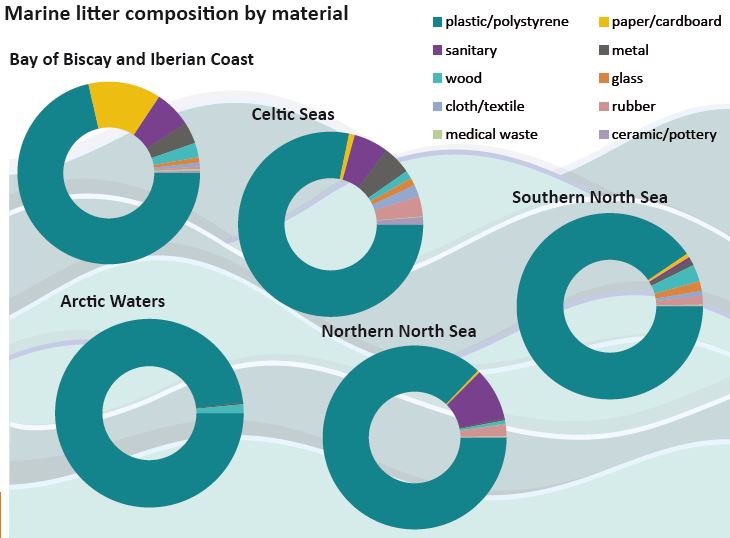
Figure 2: Composition des déchets marins selon les catégories de matière / d’utilisation pour la période de 2014 à 2015 dans la Zone maritime OSPAR
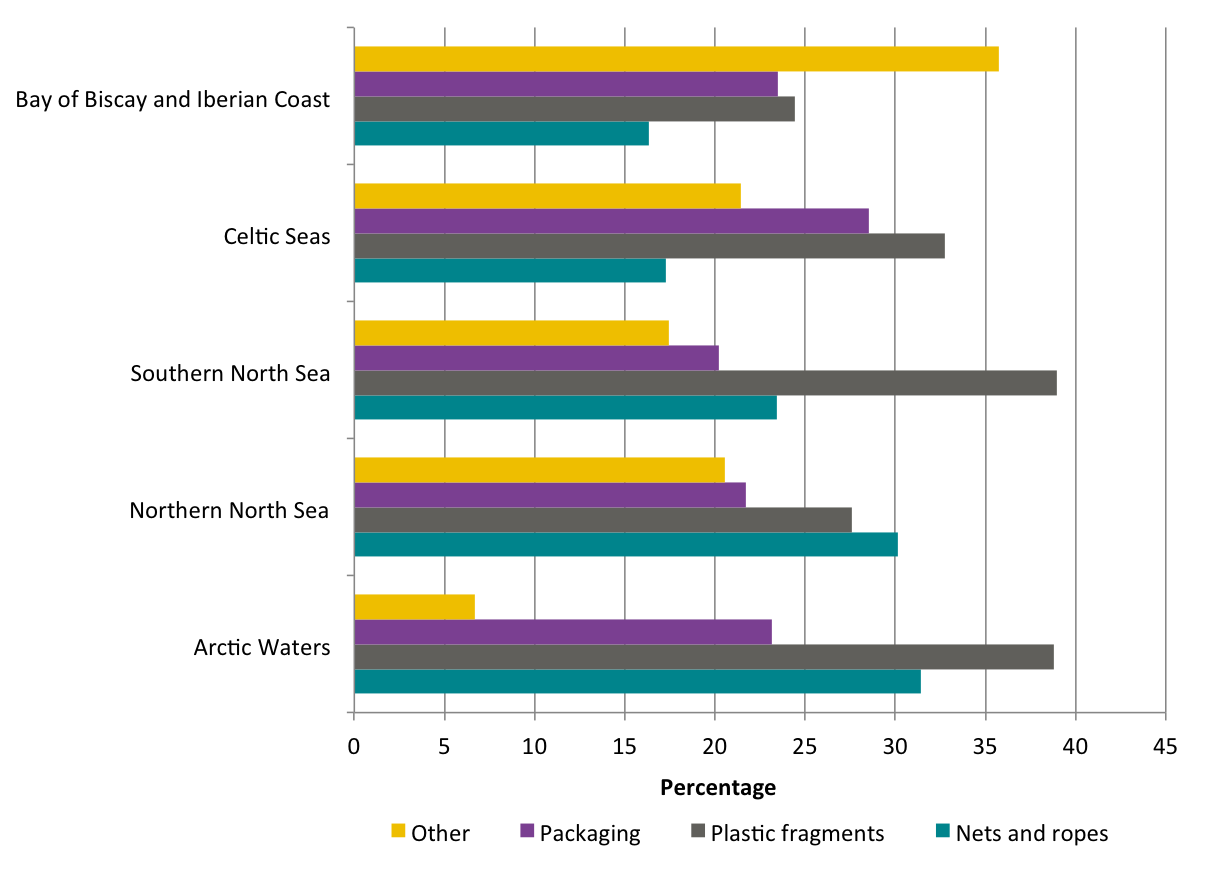
Figure 3: Composition des déchets marins selon les types principaux pour la période de 2014 à 2015 dans la Zone maritime OSPAR
La méthodologie et les données inspirent une confiance modérée.
This assessment uses two datasets. One covers the period between 2009 and 2014 and the aggregations of beaches in the Southern North Sea, the north-west coast of Spain and the west coast of Sweden. Based on this, the composition of recorded litter for the 100-m stretches of coastline according to material categories and the top 15 items, the abundance of litter items per 100-m of coast, and trends in the abundance of litter items, are presented in Table d (i, ii, iii) and Table e (i, ii, iii).
| Item name [OSPAR ID number] | Median number of items/100m of coast | Average number of items/100m of coast | St. dev. | CV | % of total number of litter items recorded | Trend [number/year] | p-value | Relative trend % increase or decrease per year |
|---|---|---|---|---|---|---|---|---|
| Plastic/polystyrene pieces < 50 cm [301] H | 103.5 | 135.9 | 144.6 | 106.50% | 30.10% | -6.1 | 0.762 | -4.5 |
| Nets and ropes [300] H | 125.7 | 135.8 | 68.8 | 50.70% | 30.10% | -6.4 | 0.596 | -4.7 |
| Plastic: Caps and lids [15] H | 26.5 | 31 | 18.4 | 59.20% | 6.90% | 0.6 | 0.88 | 1.9 |
| Plastic: Drinks bottles and containers[4] | 11.9 | 11.9 | 4.5 | 38.00% | 2.60% | -1.3 | 0.363 | -11.1 |
| Plastic: Foam sponge [45] H | 8.1 | 11 | 8.1 | 73.70% | 2.40% | -1.4 | 0.058 | -12.3 |
| Plastic: Other items [48] | 6.1 | 8.9 | 7.9 | 88.40% | 2.00% | -1.9 | 0.069 | -21.0 |
| Plastic: Crisp/sweet packets and lolly sticks [19] H | 7.7 | 8.1 | 2.9 | 35.90% | 1.80% | 0.3 | 0.595 | 3.9 |
| Plastic: Tangled nets/cord/rope and string [33] H | 7.3 | 7.2 | 4.1 | 57.20% | 1.60% | 0.2 | 0.762 | 2.4 |
| Rubber: Balloons [49] H | 5.5 | 6.1 | 2.4 | 39.70% | 1.40% | 0 | 1 | 0.5 |
| Plastic: Food containers incl. fast food containers [6] | 5.3 | 5.9 | 2.8 | 47.00% | 1.30% | -0.4 | 0.495 | -7.6 |
| Plastic: Industrial packaging, plastic sheetingl [40] H | 6 | 5.7 | 1.8 | 32.30% | 1.30% | -0.5 | 0.185 | -9.4 |
| Wood: Other items < 50 cm [74] | 3.8 | 5.7 | 6.4 | 113.10% | 1.30% | 0.2 | 0.544 | 3.5 |
| San: Cotton bud sticks [98] H | 3.2 | 4.9 | 3.9 | 79.70% | 1.10% | -0.1 | 0.762 | -2.8 |
| Glass: Other items [93] | 3.5 | 4.5 | 3.4 | 74.70% | 1.00% | 0 | 0.97 | -0.7 |
| Plastic: Plastic/polystyrene pieces > 50 cm [47] H | 2.6 | 4.5 | 5.5 | 124.50% | 1.00% | 0.1 | 0.879 | 1.1 |
| Item name [OSPAR ID number] | Median number of items/100m of coast | Average number of items/100m of coast | St. dev. | CV | % of total number of litter items recorded | Trend [number/year] | p-value | Relative trend % increase or decrease per year |
|---|---|---|---|---|---|---|---|---|
| San: Cotton bud sticks [98] H | 64.3 | 151.8 | 199.4 | 131.40% | 20.90% | -17.8 | 0.034 | -11.7 |
| Nets and ropes [300] H | 86 | 141.5 | 127 | 89.80% | 19.50% | -11.3 | 0.112 | -8.0 |
| Plastic: Caps and lids [15] H | 38.6 | 134.1 | 178.9 | 133.40% | 18.50% | -8.6 | 0.081 | -6.4 |
| Plastic/polystyrene pieces < 50 cm [301] H | 16 | 81.6 | 162.6 | 199.30% | 11.20% | 5 | 0.011 | 6.1 |
| Paper: Cigarette butts [64] | 25.4 | 43.2 | 51 | 118.20% | 5.90% | -2.2 | 0.289 | -5.1 |
| Wood: Other items < 50 cm [74] | 2.3 | 22.8 | 83.3 | 365.30% | 3.10% | -0.5 | 0.129 | -2.2 |
| Plastic: Other items [48] | 11.5 | 21.5 | 27.7 | 128.60% | 3.00% | -0.6 | 0.82 | -2.8 |
| Plastic: Crisp/sweet packets and lolly sticks [19] H | 10.1 | 15.1 | 14.6 | 96.60% | 2.10% | -1.8 | 0.049 | -11.9 |
| Plastic: Oyster nets or mussel bags incl. plastic stoppers [28] H | 6 | 11.3 | 12.9 | 114.40% | 1.60% | 0.2 | 0.94 | 1.8 |
| Plastic: Drinks bottles and containers[4] | 5.9 | 8.4 | 6.5 | 76.70% | 1.20% | -1.6 | 0.045 | -18.8 |
| Plastic: Tangled nets/cord/rope and string [33] H | 2.5 | 7.6 | 10.2 | 133.40% | 1.10% | -0.4 | 0.12 | -5.3 |
| Plastic: Strapping bands [39] | 4.3 | 6.9 | 6.5 | 94.90% | 0.90% | -0.9 | 0.102 | -13.3 |
| Plastic: Lobsterpots [26] H | 2.5 | 5.7 | 8 | 141.10% | 0.80% | -1 | 0.017 | -17.6 |
| Plastic: Cutlery/trays/straws [22] | 4.4 | 5.5 | 6.2 | 113.10% | 0.80% | 0 | 0.97 | 0.6 |
| Metal: Industrial scrap [83] | 0 | 5 | 21 | 422.20% | 0.70% | 0 | 0.011 | 0.0 |
| Item name [OSPAR ID number] | Median number of items/100m of coast | Average number of items/100m of coast | St. dev. | CV | % of total number of litter items recorded | Trend [number/year] | p-value | Relative trend % increase or decrease per year |
|---|---|---|---|---|---|---|---|---|
| Plastic: Industrial packaging, plastic sheetingl [40] H | 0.5 | 186.8 | 470.7 | 251.90% | 14.70% | data inadequate | ||
| Nets and ropes [300] H | 139.3 | 172.3 | 172.2 | 99.90% | 13.50% | data inadequate | ||
| Plastic: Caps and lids [15] H | 117.3 | 155.1 | 109.8 | 70.80% | 12.20% | data inadequate | ||
| Plastic/polystyrene pieces < 50 cm [301] H | 106 | 108.3 | 82 | 75.70% | 8.50% | data inadequate | ||
| San: Cotton bud sticks [98] H | 71.5 | 102.6 | 67.8 | 66.10% | 8.10% | data inadequate | ||
| Plastic: Tangled nets/cord/rope and string [33] H | 1 | 96.8 | 275.1 | 284.10% | 7.60% | data inadequate | ||
| Rubber: Balloons [49] H | 35 | 51.6 | 54.5 | 105.60% | 4.10% | data inadequate | ||
| Plastic: Strapping bands [39] | 24.5 | 48 | 73.7 | 153.50% | 3.80% | data inadequate | ||
| Plastic: Other items [48] | 1.3 | 46.7 | 128.6 | 275.50% | 3.70% | data inadequate | ||
| Plastic: Small plastic bags, e.g., freezer bags [3] | 12 | 42.5 | 86 | 202.10% | 3.30% | data inadequate | ||
| Plastic: Crisp/sweet packets and lolly sticks [19] H | 8.5 | 26.4 | 43.2 | 163.50% | 2.10% | data inadequate | ||
| Plastic: Shotgun cartridges [43] | 17.5 | 25.6 | 31.2 | 121.90% | 2.00% | data inadequate | ||
| Plastic: Food containers incl. fast food containers [6] | 3.5 | 22.6 | 38.9 | 171.80% | 1.80% | data inadequate | ||
| Plastic: Drinks bottles and containers[4] | 10.5 | 19.5 | 20 | 102.40% | 1.50% | data inadequate | ||
| Plastic: Cutlery/trays/straws [22] | 14 | 17.8 | 17.3 | 97.10% | 1.40% | data inadequate |
| Item name [OSPAR ID number] | Median number of items/100m of coast | Average number of items/100m of coast | St. dev. | CV | % of total number of litter items recorded | Trend [number/year] | Trend p-value | Relative trend % increase or decrease per year |
|---|---|---|---|---|---|---|---|---|
| plastic/polystyrene [406] | 339.6 | 400.2 | 216 | 54.00% | 88.60% | -30.3 | 0.363 | -7.6 |
| wood [410] | 9.8 | 12.2 | 8.3 | 68.20% | 2.70% | -0.6 | 0.495 | -5.1 |
| rubber [407] | 7.7 | 8.2 | 2.6 | 32.00% | 1.80% | 0.4 | 0.495 | 5.3 |
| metal [411] | 4.6 | 7.5 | 8.2 | 109.80% | 1.70% | -0.9 | 0.13 | -12.0 |
| glass [412] | 5.8 | 7.2 | 5.1 | 70.80% | 1.60% | 0 | 0.97 | 0.2 |
| paper/cardboard [409] | 3.2 | 6.4 | 8.8 | 138.40% | 1.40% | -1.1 | 0.005 | -17.5 |
| sanitary [414] | 4.4 | 6 | 4.1 | 68.00% | 1.30% | -0.3 | 0.325 | -5.7 |
| cloth/textile [408] | 2.9 | 3 | 1.3 | 45.20% | 0.70% | -0.4 | 0.256 | -12.2 |
| ceramic/pottery [413] | 0.4 | 0.6 | 0.4 | 77.30% | 0.10% | 0 | 0.909 | -2.3 |
| medical [415] | 0.3 | 0.3 | 0.3 | 88.70% | 0.10% | 0 | 0.94 | 1.5 |
| Item name [OSPAR ID number] | Median number of items/100m of coast | Average number of items/100m of coast | St. dev. | CV | % of total number of litter items recorded | Trend [number/year] | Trend p-value | Relative trend % increase or decrease per year |
|---|---|---|---|---|---|---|---|---|
| plastic/polystyrene [406] | 268.3 | 482.1 | 475.2 | 98.60% | 66.50% | -20.4 | 0.405 | -4.2 |
| sanitary [414] | 68.1 | 157.1 | 202.7 | 129.00% | 21.70% | -18.5 | 0.023 | -11.8 |
| paper/cardboard [409] | 28 | 45.9 | 52 | 113.10% | 6.30% | -2.8 | 0.225 | -6.0 |
| wood [410] | 4.6 | 26.2 | 86 | 328.20% | 3.60% | -0.7 | 0.172 | -2.7 |
| metal [411] | 4.2 | 9.3 | 20.5 | 220.30% | 1.30% | 0 | 0.879 | -0.4 |
| glass [412] | 1.3 | 1.9 | 1.5 | 78.80% | 0.30% | -0.3 | 0.08 | -13.6 |
| rubber [407] | 1 | 1.3 | 1.1 | 85.20% | 0.20% | -0.3 | 0.022 | -20.0 |
| cloth/textile [408] | 1 | 0.9 | 0.7 | 71.50% | 0.10% | 0 | 0.731 | -2.7 |
| medical [415] | 0.3 | 0.5 | 0.5 | 99.00% | 0.10% | 0 | 0.697 | 0.0 |
| ceramic/pottery [413] | 0 | 0.1 | 0.2 | 259.00% | 0.00% | 0 | 0.031 | 0.0 |
| Item name [OSPAR ID number] | Median number of items/100m of coast | Average number of items/100m of coast | St. dev. | CV | % of total number of litter items recorded | Trend [number/year] | Trend p-value | Relative trend % increase or decrease per year |
|---|---|---|---|---|---|---|---|---|
| plastic/polystyrene [406] | 693.8 | 1050 | 1105.3 | 105.30% | 82.50% | data inadequate | ||
| sanitary [414] | 72 | 103 | 67.9 | 65.90% | 8.10% | data inadequate | ||
| rubber [407] | 37.5 | 55.2 | 56 | 101.40% | 4.30% | data inadequate | ||
| metal [411] | 3.5 | 20.7 | 41.1 | 198.00% | 1.60% | data inadequate | ||
| wood [410] | 7.5 | 17.1 | 21.1 | 122.90% | 1.30% | data inadequate | ||
| paper/cardboard [409] | 7.5 | 13.7 | 13.9 | 101.60% | 1.10% | data inadequate | ||
| glass [412] | 1.5 | 5.9 | 10.4 | 177.60% | 0.50% | data inadequate | ||
| cloth/textile [408] | 2 | 4 | 6.5 | 165.20% | 0.30% | data inadequate | ||
| medical [415] | 0.5 | 3.6 | 9.1 | 255.30% | 0.30% | data inadequate | ||
| ceramic/pottery [413] | 0 | 0 | 0.1 | 360.60% | 0.00% | data inadequate |
The other dataset covers the period 2014–2015 and the aggregations of beaches in the Arctic Waters, Northern North Sea, Southern North Sea, Celtic Seas and Bay of Biscay / Iberian Coast regions. Based on this, the abundance and composition of the litter recorded on 100-m stretches of coastline according to material categories and groups of litter items (e.g. packaging), as well as the top 15 items are presented in Table f (i-v) and Figure 2 and Figure 3.
The recent increase in monitoring coverage (improved distribution and number of survey sites) will, if sustained, improve the capability to detect statistically significant trends in the next OSPAR assessment.
| Item | median | average | SD | % of total number of items |
|---|---|---|---|---|
| Plastic polystyrene pieces < 50 cm [301] | 80.6 | 176.7 | 220.3 | 41.10% |
| Nets and ropes [300] | 99.1 | 98.2 | 38 | 22.80% |
| Plastic: Caps and lids [15] | 28.6 | 32.5 | 19.7 | 7.60% |
| Plastic: Drinks bottles and containers [4] | 10.1 | 10.4 | 7.3 | 2.40% |
| Plastic: Foam sponge [45] | 5.2 | 9.3 | 6.6 | 2.20% |
| Plastic: Crisp/sweet packets and lolly sticks [19] H | 9.3 | 8.0 | 3.9 | 1.90% |
| Wood: Other items < 50 cm [74] | 3 | 7.8 | 10 | 1.80% |
| Plastic: Food containers incl. fast food containers [6] | 7.2 | 6.4 | 2.8 | 1.50% |
| Plastic: Tangled nets/cord/rope and string [33] H | 6.4 | 5.3 | 2 | 1.20% |
| Plastic: Plastic/polystyrene pieces > 50 cm [47] H | 2.2 | 5.1 | 6.6 | 1.20% |
| Rubber: Balloons [49] | 5.3 | 4.9 | 1.8 | 1.10% |
| Plastic: Industrial packaging, plastic sheetingl [40] H | 3.9 | 4.6 | 1.3 | 1.10% |
| Plastic: Shotgun cartridges [43] | 3.6 | 4.0 | 2.2 | 0.90% |
| Plastic: Small plastic bags, e.g., freezer bags [3] | 3.3 | 4.0 | 2 | 0.90% |
| Glass: Other items [93] | 2.5 | 3.7 | 3.6 | 0.80% |
| Item | median | average | SD | % of total number of items |
|---|---|---|---|---|
| Nets and ropes [300] | 2024.3 | 2024.3 | 0 | 33.20% |
| Plastic polystyrene pieces < 50 cm [301] | 1497.7 | 1497.7 | 0 | 24.60% |
| Plastic: Caps and lids [15] | 763.6 | 763.6 | 0 | 12.50% |
| San: Cotton bud sticks [98] H | 414.6 | 414.6 | 0 | 6.80% |
| Plastic: Shotgun cartridges [43] | 117 | 117.0 | 0 | 1.90% |
| Plastic: Crisp/sweet packets and lolly sticks [19] H | 109.3 | 109.3 | 0 | 1.80% |
| Plastic: Small plastic bags, e.g., freezer bags [3] | 104.9 | 104.9 | 0 | 1.70% |
| Plastic: Food containers incl. fast food containers [6] | 96.4 | 96.4 | 0 | 1.60% |
| Rubber: Balloons [49] | 94 | 94.0 | 0 | 1.50% |
| San: Other items [102] | 81.4 | 81.4 | 0 | 1.30% |
| Plastic: Strapping bands [39] | 60.5 | 60.5 | 0 | 1.00% |
| Plastic: Cutlery/trays/straws [22] | 55.6 | 55.6 | 0 | 0.90% |
| Plastic: Tangled nets/cord/rope and string [33] H | 52.8 | 52.8 | 0 | 0.90% |
| Plastic: Plastic/polystyrene pieces > 50 cm [47] H | 49.6 | 49.6 | 0 | 0.80% |
| San: Sanitary towels/panty liners/backing strips [99] | 46 | 46.0 | 0 | 0.80% |
| Item | median | average | SD | % of total number of items |
|---|---|---|---|---|
| Plastic polystyrene pieces < 50 cm [301] | 88.3 | 81.4 | 28.7 | 21.30% |
| Nets and ropes [300] | 50.5 | 52.5 | 11.1 | 13.80% |
| Paper: Cigarette butts [64] | 29.5 | 39.1 | 23.9 | 10.20% |
| Plastic: Caps and lids [15] | 26.3 | 27.8 | 12.6 | 7.30% |
| San: Cotton bud sticks [98] H | 22.1 | 22.0 | 8.8 | 5.80% |
| Plastic: Other items [48] | 23.1 | 21.0 | 12 | 5.50% |
| Plastic: Drinks bottles and containers [4] | 12.1 | 15.0 | 8 | 3.90% |
| Plastic: Crisp/sweet packets and lolly sticks [19] H | 12.2 | 11.6 | 5.4 | 3.00% |
| Plastic: Foam sponge [45] | 7.3 | 8.7 | 4.5 | 2.30% |
| Plastic: Small plastic bags, e.g., freezer bags [3] | 6.3 | 6.9 | 3.7 | 1.80% |
| Plastic: Food containers incl. fast food containers [6] | 4.8 | 5.4 | 2.4 | 1.40% |
| Plastic: Cutlery/trays/straws [22] | 4.9 | 5.3 | 1.2 | 1.40% |
| Plastic: Tangled nets/cord/rope and string [33] H | 5.2 | 4.9 | 2.8 | 1.30% |
| Wood: Other items < 50 cm [74] | 4.1 | 4.9 | 2.3 | 1.30% |
| Metal: Industrial scrap [83] | 0.3 | 4.7 | 8.8 | 1.20% |
| Item | median | average | SD | % of total number of items |
|---|---|---|---|---|
| Plastic polystyrene pieces < 50 cm [301] | 105.7 | 161.1 | 109.5 | 31.50% |
| Nets and ropes [300] | 72.2 | 68.6 | 8.8 | 13.40% |
| Plastic: Drinks bottles and containers [4] | 26.3 | 33.2 | 12 | 6.50% |
| Plastic: Caps and lids [15] | 19.6 | 32.5 | 27.1 | 6.40% |
| San: Cotton bud sticks [98] H | 13.9 | 27.5 | 26.7 | 5.40% |
| Plastic: Crisp/sweet packets and lolly sticks [19] H | 25.9 | 24.3 | 5.1 | 4.70% |
| Metal: Drink cans [78] | 12.3 | 12.1 | 1 | 2.40% |
| Plastic: Food containers incl. fast food containers [6] | 11.2 | 11.6 | 1.7 | 2.30% |
| All gloves [304] | 8.2 | 8.8 | 2.5 | 1.70% |
| Plastic: Bags (e.g. shopping) [2] | 9 | 8.1 | 2.5 | 1.60% |
| Plastic: Fishing_line [35] | 9 | 7.1 | 4.6 | 1.40% |
| Plastic: Shotgun cartridges [43] | 4.2 | 7.0 | 5.7 | 1.40% |
| Plastic: Tangled nets/cord/rope and string [33] H | 5.1 | 6.4 | 2.8 | 1.30% |
| Plastic: Cutlery/trays/straws [22] | 7.5 | 6.2 | 3.1 | 1.20% |
| Rubber: Other items [53] | 7.2 | 6.2 | 2.2 | 1.20% |
Presentation of the results
Non-symmetrical distributions are predominant for counts of beach litter items, therefore the results presented use the median instead of the arithmetic average for evaluations. Nevertheless the arithmetic average with standard deviation is also presented to provide information on the variation in the data.
The contribution of each item to the total amount of beach litter recorded over a given period is presented as a percentage. The coefficient of variation (CV), also known as the relative standard deviation, is presented as a standardised measure of variation. It is defined as the ratio of the standard deviation to the mean (higher values imply higher variability in the data). The results of the trend analysis are presented as magnitudes of change (expressed in changes in the number of litter items per year) and statistical significance (p-values) of the trends. If no statistical analysis was undertaken the corresponding cells are left empty.
In addition, the trend is expressed as the percentage change in the arithmetic average amount of litter recorded each year. For example, an arithmetic average of 151.8 cotton bud sticks were recorded on survey sites on the north-west coast of Spain in the period 2009–2014 (representing 20.9% of all litter items recorded on the survey sites). Analysis showed their occurrence reduced significantly – by 17.8 pieces/year over this period, corresponding to an 11.7% decrease in the arithmetic average/year.
Assessment for the period between 2009 and 2014 (abundance, composition and trends)
Abundance
The total number of litter items recorded per 100-m survey varies by an order of magnitude between survey sites. The average abundance of recorded items are highest on the sites on the Swedish west coast (873 items per 100 m). The abundance of litter items is similar for sites on the Southern North Sea (380 items per 100 m) and the north-western coast of Spain (432 items per 100 m), however, the composition of the litter in the two areas differs considerably.
Most common items
Plastic / polystyrene fragments (<50 cm) (OSPAR ID 301) and plastic nets and ropes (OSPAR ID 300) are the most common items on the survey sites in the Southern North Sea, with each item contributing a third of all litter recorded there. Plastic caps and lids (OSPAR ID 15) made up a further 7% of all items recorded (Table d).
Cotton bud sticks (OSPAR ID 98), plastic nets and ropes, and plastic caps and lids are the most common items on the survey sites in the north-western coast of Spain, each item contributing about a fifth of all litter recorded. Plastic / polystyrene fragments (<50 cm) made up a further 11.2% and cigarette butts (OSPAR ID 64) a further 5.9% of all items recorded.
Plastic industrial packaging (OSPAR ID 40), nets and ropes, and plastic caps and lids are the most common items on the two survey sites on the Swedish west coast, with each item contributing 12–15% of all litter recorded. Plastic / polystyrene fragments (<50 cm), cotton bud sticks, and plastic tangled nets and string (OSPAR ID 33) each made up approximately a further 8% of all items recorded.
All of the most common items are considered especially harmful to the marine environment, mainly owing to their potential for entanglement, ingestion or injury for marine animals. However, all litter items can also cause socio-economic impacts, through decreases in revenue and by incurring additional costs, such as beach cleaning.
Trends
On survey sites on the north-west coast of Spain, the abundance of cotton bud sticks (OSPAR ID 98) decreased significantly (by 17.8 pieces per year), whereas the abundance of plastic polystyrene pieces (<50 cm) (OSPAR ID 301) increased significantly (by five pieces per year). Three other items decreased significantly in the assessment period: plastic crisp / sweet packets and lolly sticks (OSPAR ID 19), plastic drinks bottles and containers (OSPAR ID 4), and plastic lobster pots (OSPAR ID 26). A small but significant decrease was recorded in the abundance of industrial scrap metal (OSPAR ID 83) (Table d).
The category sanitary items (mainly cotton bud sticks) also showed a significant decrease over the assessment period (2009–2014). Furthermore, recordings of litter items included in the category rubber showed a significant downward trend but the decrease was small. However, rubber items are not among the 15 most recorded items at any of the survey sites.
For the Southern North Sea only the category paper / cardboard (including cigarette butts) showed a significant decrease but was only in the top 15 most recorded items at one survey site in the region.
No significant trends in the abundance of litter items were measured on the west coast of Sweden.
Assessment for the period 2014–2015 (abundance and composition)
Abundance
The average total number of litter items recorded per 100-m survey in the period 2014–2015 was about the same for the Southern North Sea, Celtic Seas and Bay of Biscay / Iberian Coast (Table g). Whereas, it is generally higher at the Northern North Sea survey sites, which are mainly located in the Skagerrak area (Table h). However, the average total number of litter items recorded per 100-m survey on the 11 Northern North Sea sites is extremely variable. The difference between sites ranges between 14 and over 23 000 items per 100 m and the difference between surveys at the same site ranges between 220 and over 23 000 items at its most extreme.
| Region | Median | Average | St. dev. | CV | ||
|---|---|---|---|---|---|---|
| [number pieces of litter/survey] | [%] | number of sites | number of surveys used for the calculation | |||
| Northern North Sea | See table h | See table h | ||||
| Southern North Sea | 311.3 | 430.4 | 335.1 | 77.9% | 17 | 85 |
| Celtic Seas | 433.7 | 510.8 | 180.8 | 35.4% | 22 | 66 |
| Bay of Biscay/Iberian Coast | 364.9 | 381.7 | 58.6 | 15.4% | 21 | 84 |
| Country/Region | Beach name (s) | Statistics of total counts | |||
|---|---|---|---|---|---|
| Median | Average | St. dev. | CV | ||
| [counts/survey] | [%] | ||||
| Denmark | Nymindegab Strand | 250.0 | 276.0 | 98.3 | 35.6% |
| Denmark | Skagen | 3138.0 | 4778.7 | 3621.4 | 75.8% |
| Norway | Kviljo | 84.0 | 82.3 | 17.6 | 21.3% |
| Norway | Ytre Hvaler | 16712.5 | 16712.5 | 7624.7 | 45.6% |
| Sweden | Edshultshall | 60.0 | 273.3 | 395.6 | 144.7% |
| Sweden | Edsvik | 722.0 | 5364.0 | 10314.4 | 192.3% |
| Sweden | Gröderhamn | 1511.5 | 1960.0 | 940.9 | 48.0% |
| Sweden | Grönevik | 163.5 | 157.5 | 74.6 | 47.4% |
| Sweden | Haby | 241.5 | 293.8 | 149.4 | 50.9% |
| Sweden | Saltö | 1133.0 | 1687.0 | 1841.7 | 109.2% |
| United Kingdom | Cramond Beach | 1969.0 | 2099.0 | 529.4 | 25.2% |
Most common material / use categories and main types of litter
Results for the most common material / use categories and main types of litter are presented in Figure 2, Figure 3 and Table f).
At survey sites in the Southern North Sea and Northern North Sea, plastic represents approximately 90% of all litter recorded.
At Northern North Sea survey sites, the sanitary category (mainly cotton bud sticks but also sanitary towels and tampons) was the second most common litter type, at 9.2%.
At the Celtic Seas and Bay of Biscay / Iberian Coast sites the non-plastic fractions of litter are higher than the North Sea sites and the plastic fraction is, therefore, lower at 78% and 71% respectively (see Figure 2).
At the five, widely distributed, survey sites in the Arctic Waters, plastic makes up approximately 98.2% of all litter recorded, however this assessment is based on only nine surveys.
At the Celtic Seas sites, the material use categories of sanitary (predominantly cotton bud sticks), metal (predominantly drinks cans), and rubber items (e.g. tyres, balloons) are more common (6.1%, 5.0% and 3.5% of litter items respectively) than in other areas.
At the Bay of Biscay / Iberian Coast sites, the material use categories paper / cardboard (mainly cigarette butts but also other items), sanitary (mainly cotton bud sticks) and metal (metal caps, metal drinks, metal foil and other items) items are more common than in other areas (12.9%, 6.6% and 3.5% of litter items respectively). Cigarette butts, which make up 10.2% of all items recorded on the survey sites, are the main component of the paper / cardboard fraction.
Of the total litter items recorded, sanitary items constitute between 6% and 9% of items at survey sites in the Northern North Sea, Celtic Seas and Bay of Biscay / Iberian Coast. However, this percentage is a magnitude lower on survey sites in the Southern North Sea (0.6%), indicating a lower input from wastewater outlets in the Southern North Sea.
Packaging, and nets and ropes, are the two largest fractions of identifiable litter at all survey sites in all regions. In 2014 and 2015, packaging made up a fifth and a third of all litter items recorded in the Southern North Sea and Celtic Seas respectively. Nets and ropes made up between 16% (Bay of Biscay / Iberian Coast) and 30% (Northern North Sea) of all items recorded.
Most common items
The most common litter items recorded in the period 2014–2015 are shown in Table f. Plastic fragments, and nets and ropes, are the top two items recorded at sites in all regions.
At survey sites in the Southern North Sea and the Northern North Sea, plastic and polystyrene fragments, nets and ropes, and caps and lids, comprise the majority of litter items recorded. In addition, at the Northern North Sea sites (mainly situated in the Skagerrak region), cotton bud sticks are also often recorded.
At the Bay of Biscay / Iberian Coast sites, plastic / polystyrene fragments (21.3%), nets and ropes (13.8%), and cigarette butts (10.2%), are the most common items recorded. Other important fractions are caps and lids (7.3%), cotton bud sticks (5.8%), and other (unidentified) plastic items (5.5%) (OSPAR ID 48).
On the limited number of survey sites in the Arctic Waters region, nets and ropes, and polystyrene fragments (<50 cm), are by far the most common items recorded.
At the Celtic Seas sites, plastic and polystyrene fragments (31.5%), and nets and ropes (13.4%), are the most common items. Other important fractions are plastic drinks bottles and containers (6.5%) (OSPAR ID 4), caps and lids (6.4%), and cotton bud sticks (5.4%).
Confidence in the Beach Litter Monitoring methodology is moderate. The methodology conforms with beach litter monitoring (accumulation) methods from other monitoring programmes, such as the US Marine Debris Monitoring Programme. The frequency of surveys is considered adequate, because a steady state between deposition and erosion is likely to be reached between surveys, and the number of items recorded on 100 m of coastline is adequate for statistical analysis. However, a power analysis is required to determine the number of survey sites considered necessary to accurately monitor litter pollution in all the OSPAR sub-regions.
There is moderate confidence in the data for the Beach Litter Assessment. Spatial and temporal coverage for the period assessed (2009-2015) could be improved. There is poor coverage for some parts of the North-East Atlantic coastline, for example, the Bay of Biscay and Arctic Waters lack sufficient numbers of survey sites and coverage on the west and northeast coasts of the North Sea should be improved. The number of beach litter surveys carried out during the first two years of the assessment period (i.e. 2009 and 2010) was low in comparison to the last four years (2011 to 2014). The frequency of the surveys, which are carried out at three-monthly intervals (during spring, summer, autumn and winter), are considered to be sufficient to assess litter abundance on the coast.
Conclusion
Les quantités de déchets enregistrés dans les sites d’étude de la zone maritime OSPAR révèlent que la pollution par les déchets est courante sur les côtes de l’Atlantique du Nord-Est. Les types principaux de déchets enregistrés sont les fragments plastiques, les emballages et les filets et cordages. On a enregistré, au cours de la période de 2009 à 2014, des modifications importantes des quantités de déchets dans les sites d’étude, mais aucune tendance générale pour l’ensemble des sites d’étude. On n’a donc pas encore réalisé l’engagement de la Stratégie pour le milieu marin de l’Atlantique du Nord-Est, à savoir « réduire considérablement les déchets marins dans la zone maritime OSPAR pour les ramener à des niveaux tels que leurs propriétés et leurs quantités ne sont pas préjudiciables pour le milieu marin et côtier ».
Les grandes quantités d’objets considérés dangereux, à cause du risque potentiel d’enchevêtrement, d’ingestion ou de blessure, indiquent que la pollution par les déchets est un problème dans la zone maritime OSPAR. Ceci s’ajoute au danger socioéconomique que présentent tous les déchets, causant la perte de revenu et des frais de nettoyage des déchets sur les plages.
Le Plan d’action régional OSPAR détermine les mesures de réduction des déchets marins et devrait donc permettre de réduire les déchets sur les plages. Grace au nombre croissant de sites d’étude et d’études entreprises ces dernières années, les connaissances sur les déchets marins sur les côtes de l’Atlantique du Nord-Est, concernant l’abondance, la composition et en particulier les tendances futures, s’amélioreront, si les travaux de surveillance se maintiennent.
The amount of litter recorded on survey sites in the OSPAR Maritime Area shows litter is still common on the North-East Atlantic Coast. The large proportion of litter items considered to be harmful to the marine environment shows litter pollution is a problem for the marine environment in the OSPAR area. This is in addition to the socio-economic implications of litter, such as lost revenue and the costs of beach litter cleaning (Mouat et al, 2010).
The main litter item types recorded are fragmented litter, packaging, and nets and ropes. The high numbers of cotton bud sticks recorded at survey sites in the Celtic Seas, Bay of Biscay / Iberian Coast, and the Northern North Sea regions show domestic wastewater outlets are a significant source of litter in these locations. At survey sites in the Bay of Biscay / Iberian Coast region, cigarette butts make up a significant proportion of all items recorded.
Rubber balloons are among the 15 most recorded items at survey sites in the Southern North Sea and the Northern North Sea. Rubber balloons are also among the 15 most recorded items at some survey sites in the Celtic Seas and at one survey site in the Iberian coast / Bay of Biscay. Helium filled rubber balloons released during public and private events appear to be transported by prevailing westerly winds into the North Sea and Celtic Seas.
Shotgun cartridges are among the 15 most recorded items at survey sites in the Southern North Sea, Northern North Sea and Celtic Seas, indicating that coastal hunting activities are causing significant litter pollution in those regions.
The median and arithmetic averages for the total number of litter items per 100 m of coastline vary widely in the OSPAR Maritime Area and within sub-regions (see Table g and Table h). Levels were similar for the Southern North Sea, Celtic Seas and Bay of Biscay / Iberian Coast but are an order of magnitude higher on the Northern North Sea coast, especially in the Skagerrak area.
Without a defined baseline or target limits for litter, or defined ecological or socio-economic assessment criteria, it is not possible to conclude on whether the recorded litter levels of litter pollution are too high.
Although there were significant changes in the amount of litter recorded on survey sites between 2009 and 2014, there are no general trends across all survey sites and the results are inconclusive. As the selection of survey sites was not made randomly, the survey sites selected can only be considered representative for the beaches monitored and not for the region in which they are situated. Spatially, the results are biased due to the use of fixed monitoring sites; however, this sampling methodology improves trend analysis because the spatial variation (i.e. between randomly selected sites) is eliminated. This means the data presented are only an indication of the magnitude, trends in magnitude and types of litter pollution within the regions in which the survey sites are situated.
An increase in the number of survey sites and surveys, leading to better coverage of the OSPAR Maritime Area in recent years, will improve knowledge of marine litter on the North-East Atlantic coast with regard to abundance, composition and especially future trends.
Measures in the OSPAR Regional Action Plan on Marine Litter are aimed at reducing litter and so should lead to a reduction of beach litter. If successful, measures targeting litter from fishing activities and measures targeting packaging should have the greatest impact on the amount of marine litter. In some regions, measures targeting wastewater outlets and smoking-related litter could have significant effects on the amount of litter recorded on coasts. Packaging originates from many land- and sea-based sources. The most effective measures will depend on the source and input pathway for the packaging recorded in the marine environment.
Lacunes des connaissances
D’après les données, les sources principales de déchets (par exemple la pêche) sont évidentes; une identification détaillée des sources exigera cependant que l’on attribue, dans le cadre d’OSPAR, les objets aux sources à un niveau régional.
On sait très bien que certains types de déchet peuvent être dangereux pour le milieu marin à cause du risque d’enchevêtrement, d’ingestion ou de blessure. Toutefois les connaissances, du danger que présentent d’autres types de déchet faisant l’objet d’études et de recherches en cours, sont encore limitées.
Les niveaux de référence et les lignes de base n’ont pas été définis pour les déchets sur les plages.
Distribution and number of survey sites
There is a lack of information on beach litter for large parts of the North-East Atlantic coastline and the distribution, as well as the number of survey sites, needs to be optimised for future assessments. The OSPAR Litter Monitoring Programme (OSPAR Agreement 2011-01) surveyed 7.7 km of coastline in the year with most surveys and survey sites (2013). For some sub-regions, more survey sites are needed in data-poor coastal areas in order to improve the reliability of the results. The Bay of Biscay is lacking survey sites and the number of survey sites in Arctic Waters is also low. Coverage on the west and north-east coasts of the North Sea should be improved; large gaps in the distribution of sites are widespread on the coasts of England and Scotland.
Improved identification of sources
lthough some major sources of litter are apparent form the analysis of the data for the periods 2009–2014 and 2014–2015, a detailed identification of sources using the OSPAR beach litter survey data will require the allocation of particular OSPAR litter items to given sources at sub-regional level. The present allocation of sources in Litter Analyst is not precise enough to be used to identify sources for the OSPAR assessment units. Use of a ‘Matrix Scoring Technique’ to determine litter sources (e.g. Tudor and Williams 2004) should be considered on the basis of the report produced by the EU MSFD Task Group on Marine Litter (Veiga et al., 2016).
Improved knowledge of harm caused
The simple characterisation of harmful litter items used in this assessment (some items are considered especially harmful due to the danger of entanglement, ingestion or injury) will need to be reassessed on the basis of a report by the MSFD Task Group on Marine Litter (Werner et al., in prep).
Reference levels and baselines
Reference levels and baselines have not been defined for beach litter.
Williams, A.T., Tudor, D.T., 2001. Litter Burial and Exhumation: Spatial and Temporal Distribution on a Cobble Pocket Beach. Marine Pollution Bulletin 42, 1031 - 1039.
Tudor, D. and Williams, A. (2004). Development of a ‘Matrix Scoring Technique’ to determine litter sources at a Bristol Channel beach. Journal of Coastal Conservation 9: 119-127.
Veiga et. al. (2016). Identification of Sources of Marine Litter, MSFD TG Marine Litter.
Werner et. al. (in prep). Harm caused by marine litter, MSFD TG Marine Litter.
Litter Analyst, User manual and Basic report. Available from:
http://www.amo-nl.com/wordpress/software/litter-analyst/
Van der Meulen and Baggelaar, 2016. User manual Litter Analyst. AMO-Icastat.
Mouat et al. (2010). Economic Impacts of Marine Litter, KIMO International.