

Assessment Process and Methods (Common Indicators, JAMP, CEMP)
Development of New Indicators and Refining Existing Indicators
The IA 2017 is a summary assessment of the current position in respect of our evolving understanding and assessment of the implementation of the OSPAR Thematic Strategies (Box 1). It outlines progress in the use of assessment tools that have been developed and honed by OSPAR over many years through the implementation of both the OSPAR JAMP and CEMP. However, the IA 2017 makes use of new indicators to assess progress with regard to the effective implementation of The OSPAR Strategy. Many of the indicators used for the IA 2017 are not common across the entire OSPAR Maritime Area; there is an ongoing need for further development of the IA 2017 indicators.
Establishing a comprehensive set of common indicators (indicators that are used by a number of countries bordering a specific sea area thereby permitting an assessment of a greater proportion of that sea area) for the assessment of the marine environment has been a priority for EU Member States since 2008. The coordinating role of OSPAR and the launch of The OSPAR Strategy in 2010, has resulted in a commonality of direction (Table 2). The process has enabled common indicators to be developed with the aim to address the needs of both The OSPAR Strategy and the MSFD when appropriate. A key part of this process has been implemented by OSPAR through the Intersessional Correspondence Group on Coordination of Biodiversity Assessment and Monitoring (ICG-COBAM). COBAM has overseen the development of a set of biodiversity related indicators, which are the main component of the IA 2017 section entitled Biodiversity Status of the OSPAR Region.
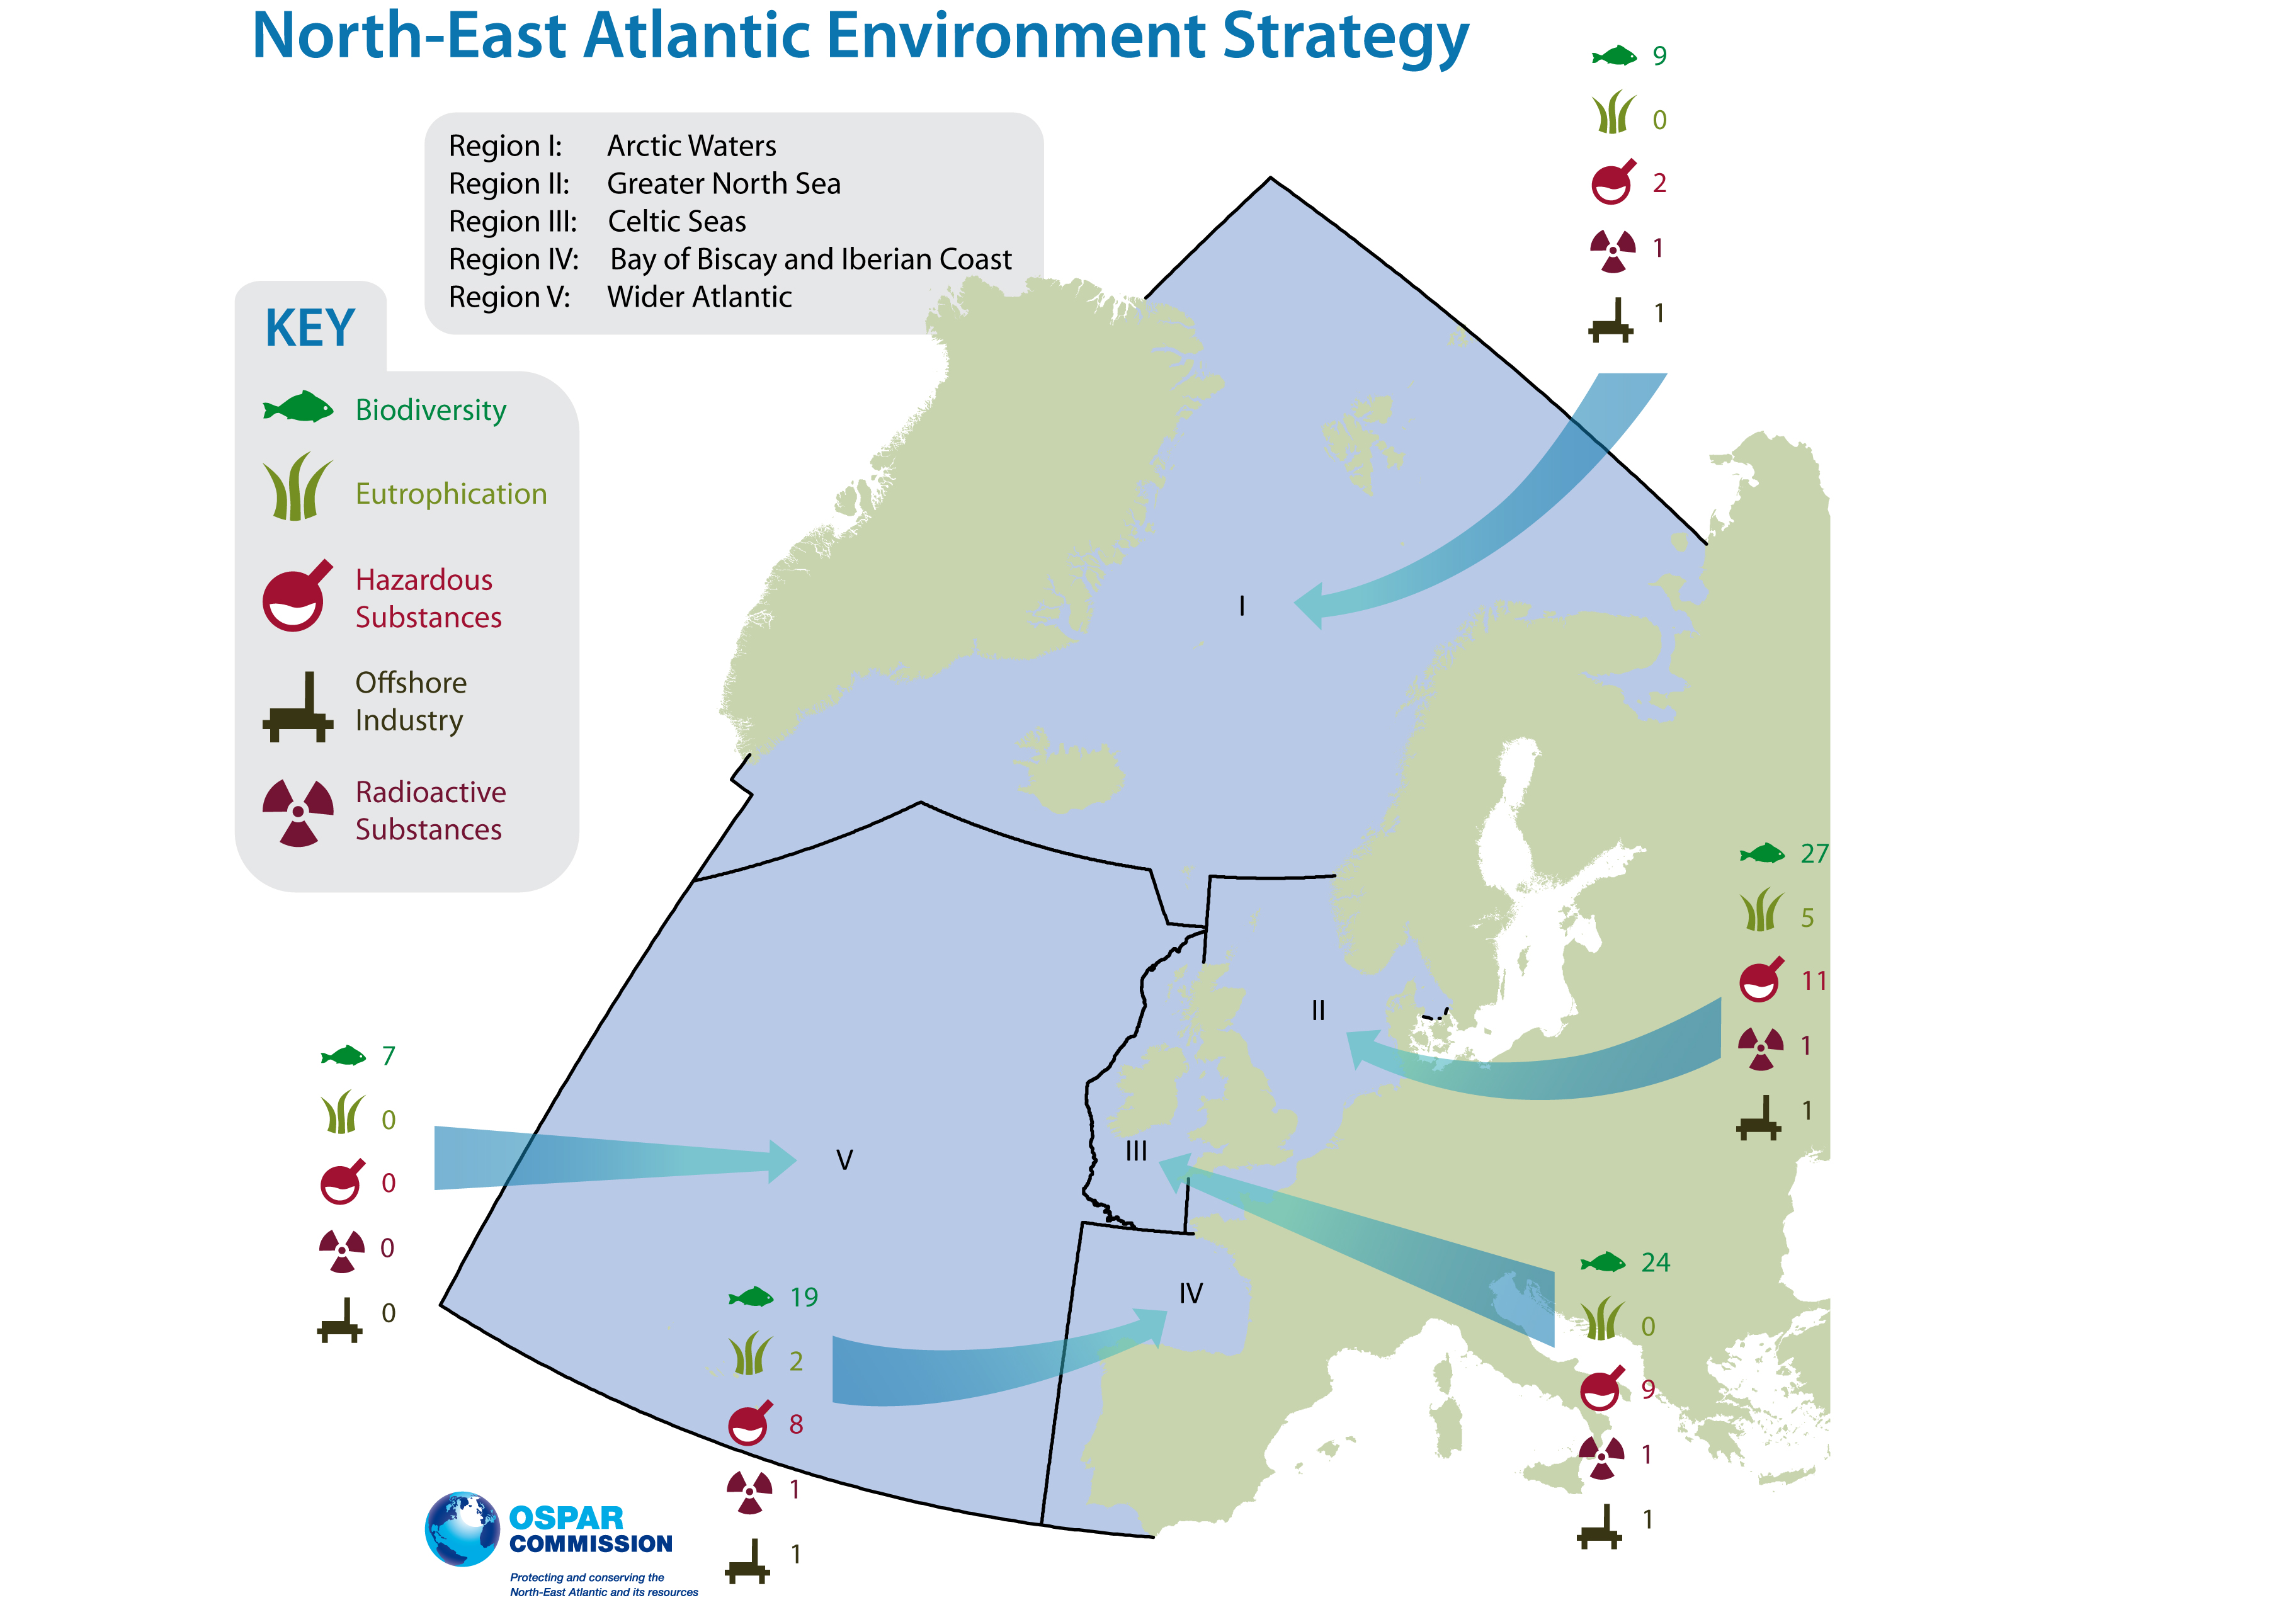
Figure 6: Indicator and Thematic Assessments by OSPAR Region
The number beside each icon correspond to the number of assessments (both standard and/or thematic) by OSPAR Thematic Strategy used in the specific regions. Further information on the OSPAR Strategies can be found in Box 1. Please note for the purposes of the IA 2017 only, the OSPAR boundary between the Greater North Sea and the Celtic Seas in the English Channel has been realigned to reflect the EU MSFD Sub-Region (see Figure 1).
As an OSPAR product, the IA 2017 uses a number of existing OSPAR pressure indicators, some of which have been developed since the QSR 2010. This includes a revision of the Background Assessment Concentrations (BACs) and Environmental Assessment Criteria (EACs). These assessment values are used to investigate the status of the OSPAR area with respect to hazardous substances.
Common indicators and candidate common indicators (common indicators that are under development) have become a recognised terminology within OSPAR. However, for the IA 2017 much has been developed and many of the indicators assessed are not common across all OSPAR Regions. In the IA 2017, there are three types of assessments described:
- Indicator Assessments (also referred to as common indicator assessments);
- Thematic Assessment (those assessments which OSPAR has routinely undertaken, listed in Table 7);
- Pilot Indicator Assessment (a term defined solely for use in the IA 2017 to describe an assessment which needs further development but has been included to test its viability as an indicator of the state of the marine environment).
Furthermore, guidance for appropriate monitoring has been elaborated and implemented. An extra benefit from this process is the overlap with a number of the indicators being developed by HELCOM for the Second Holistic Assessment of the Ecosystem Health of the Baltic Sea (HOLAS II).
The IA 2017 is part of the evolution of OSPAR reporting which is coupled to a development of tools such as the EcoQOs as well as providing an update on reaching key OSPAR Strategic Objectives that are detailed for each of the Thematic Strategies.
The overlap between the MSFD Descriptor assessments with the assessments for the OSPAR Thematic Strategies (Table 2) means that there is a commonality which results in the IA 2017 being both a stepping stone to a full assessment of delivery against The OSPAR Strategy in the early 2020s and a tool for drafting the MSFD Article 8 reporting for the Contracting Parties who are also EU Member States. With the IA 2017, OSPAR offers a ‘roof report’ which EU Member States can use under the MSFD. However, it is important to note that the current assessment values that have been proposed while developing the OSPAR indicators as part of IA 2017, remain exploratory and may be revised in advance of any subsequent OSPAR assessment. Furthermore, such values are not to be regarded as indicative of Good Environmental Status under the MSFD.
The development of indicators relevant to the biodiversity issues addressed by MSFD Descriptors 1 (biodiversity is maintained), 4 (food webs) and 6 (sea-floor integrity) have been a particular focus for OSPAR during this period. This work has built on the OSPAR system of EcoQOs for the North Sea, but the range of issues addressed under the MSFD has required innovation in the development of a number of completely new indicators. These are being assessed under the IA 2017 for the first time (see What Is Assessed).
Sixteen indicators have been developed that build on OSPAR’s long history of addressing hazardous substances (MSFD Descriptor 8) and eutrophication (MSFD Descriptor 5) in the marine environment. These have been developed using OSPAR’s well-established monitoring and assessment protocols for the particular parameters being studied, making for robust assessment outcomes.
Indicator development for pressures from human activities has focused on non-indigenous species (MSFD Descriptor 2), marine litter (MSFD Descriptor 10) and underwater noise (MSFD Descriptor 11). Some of these indicators are based on long-term monitoring and have been previously assessed. However, others have required development and innovation and will be assessed for the first time in the IA 2017.
The Indicators and Thematic Assessments are reported on the basis of the OSPAR Regions for which there is data (Figure 6). Given the geographic extent of the OSPAR Maritime Area, the associated difference in the characteristics or prevailing conditions of the various regions (see Climate and Ocean Acidification) and the differences in size and number of OSPAR Contracting Parties bordering the different regions, the Greater North Sea, Celtic Seas and Bay of Biscay and Iberian Coast are relatively well covered. However, for the Wider Atlantic, only a small number of assessments have been undertaken and they all relate to the OSPAR Biodiversity and Ecosystems Strategy (Figure 6). Assessments in the Arctic Waters region cover all but the OSPAR Eutrophication Strategy (Figure 6) because the Norwegian parts of the Arctic Waters are already classified as no-problem area. However, the actual number of assessments is limited. Future collaboration with the Arctic Council could help improve the level of assessment in Arctic Waters.
As the indicators have been developed, OSPAR Committees have concluded on the appropriate assessment scale for their indicators. The OSPAR Regions (Table 1, Figure 1 and Figure 6) comprise a fundamental component of the reporting. However, as illustrated earlier for phytoplankton, stipulating the geographic relevance of an indicator is a fundamental advance in the overall assessment methodology for the North-East Atlantic. In this context, additional geographic sub-divisions have been included where relevant.
Assessing Confidence in the Results
Confidence ratings are applied to the results of each indicator assessment within the IA 2017. Confidence is assessed by expert judgement on data availability (both spatially and temporally) and on consensus in methodology / maturity of methodology.
Owing to the range of topics assessed (spanning biodiversity, pressures from human activities, and hazardous substances), the way in which the criteria are applied to each assessment varies, such that ‘extensive data’ for one Indicator Assessment (marine mammals) may not be the same for another (polychlorinated biphenyl concentrations). As a result, all confidence ratings provided are done so with an accompanying explanation of how the decision on confidence was reached.
Generic descriptions of high, moderate and low data availability are presented in Table 3 and generic descriptions of high, moderate and low consensus in methodology / maturity of methodology are presented in Table 4. These descriptive criteria provide examples as guidance to enable authors to express confidence in an assessment result in a uniform way. It is not expected that an assessment will meet all criteria in one category to achieve that rating. As stated, all confidence ratings provided are done so with an accompanying explanation of how the decision was reached.
| Data availability(spatially and temporally) | Description |
|---|---|
| High | There are no significant data gaps identified, for example: |
| • The assessment is undertaken using data with sufficient spatial coverage within the area being assessed. | |
| • The assessment is undertaken using sufficient temporal data collected over a period pertinent to the assessment. | |
| Moderate | Some data gaps are evident, but this does not impact the overall outcome of the assessment, for example: |
| • The assessment is undertaken using data with a mostly sufficient spatial coverage for the area assessed, but gaps are apparent in certain areas. | |
| • The assessment is undertaken using data with a mostly sufficient temporal coverage collected over a period pertinent to the assessment. Although some gaps are apparent. | |
| Low | Significant data gaps have been identified (both spatially and temporally), for example: |
| • The assessment is undertaken using limited data with poor spatial coverage within the area assessed. | |
| • The assessment is undertaken using limited data collected over a period that is limited (and therefore not pertinent to the assessment) or the assessment is largely informed by expert judgement. |
| Consensus in methodology / maturity of methodology | Description |
|---|---|
| High | The assessment methodology requires only limited further development and updating for future assessments, for example: |
| • The methodology used is widely accepted and is used in published international assessments. The methodology has been in use for a number of years. | |
| • There is a strong consensus within the scientific community regarding this methodology / approach to assessment. | |
| Moderate | The assessment methodology could benefit from some further development for future assessments, for example: |
| • The methodology presented is often used to assess this indicator and has been used previously in published assessments, but it is acknowledged that one or two aspects require further development. | |
| • There is consensus within the scientific community regarding this methodology, but there remain some questions around the methodology. | |
| Low | The assessment methodology requires further development for future assessments, for example: |
| • The methodology used has been developed specifically for this assessment and has not been used in a previously published assessment. | |
| • There is limited consensus within the scientific community regarding this methodology. |
Towards an Integrated Assessment Approach
OSPAR has operated a series of monitoring and assessment programmes for some time. However, OSPAR adopted the currently used CEMP in 2016. The processes outlined in the revised CEMP, represents a strategic shift towards increased integration of OSPAR’s monitoring programmes. The introduction of new programmes and the extension of existing programmes, for example to include marine litter and underwater noise, mean that OSPAR coordinates a range of monitoring components across the five Thematic Strategies (Figure 7) and the single cross-cutting theme (Theme A). Adapting assessment routines to meet the needs of the Ecosystem Approach requires that the assessments are amenable to synthesis or integration rather than being treated as individual items. However, achieving this remains a challenge as detailed in the section Ecosystem Assessment Outlook .
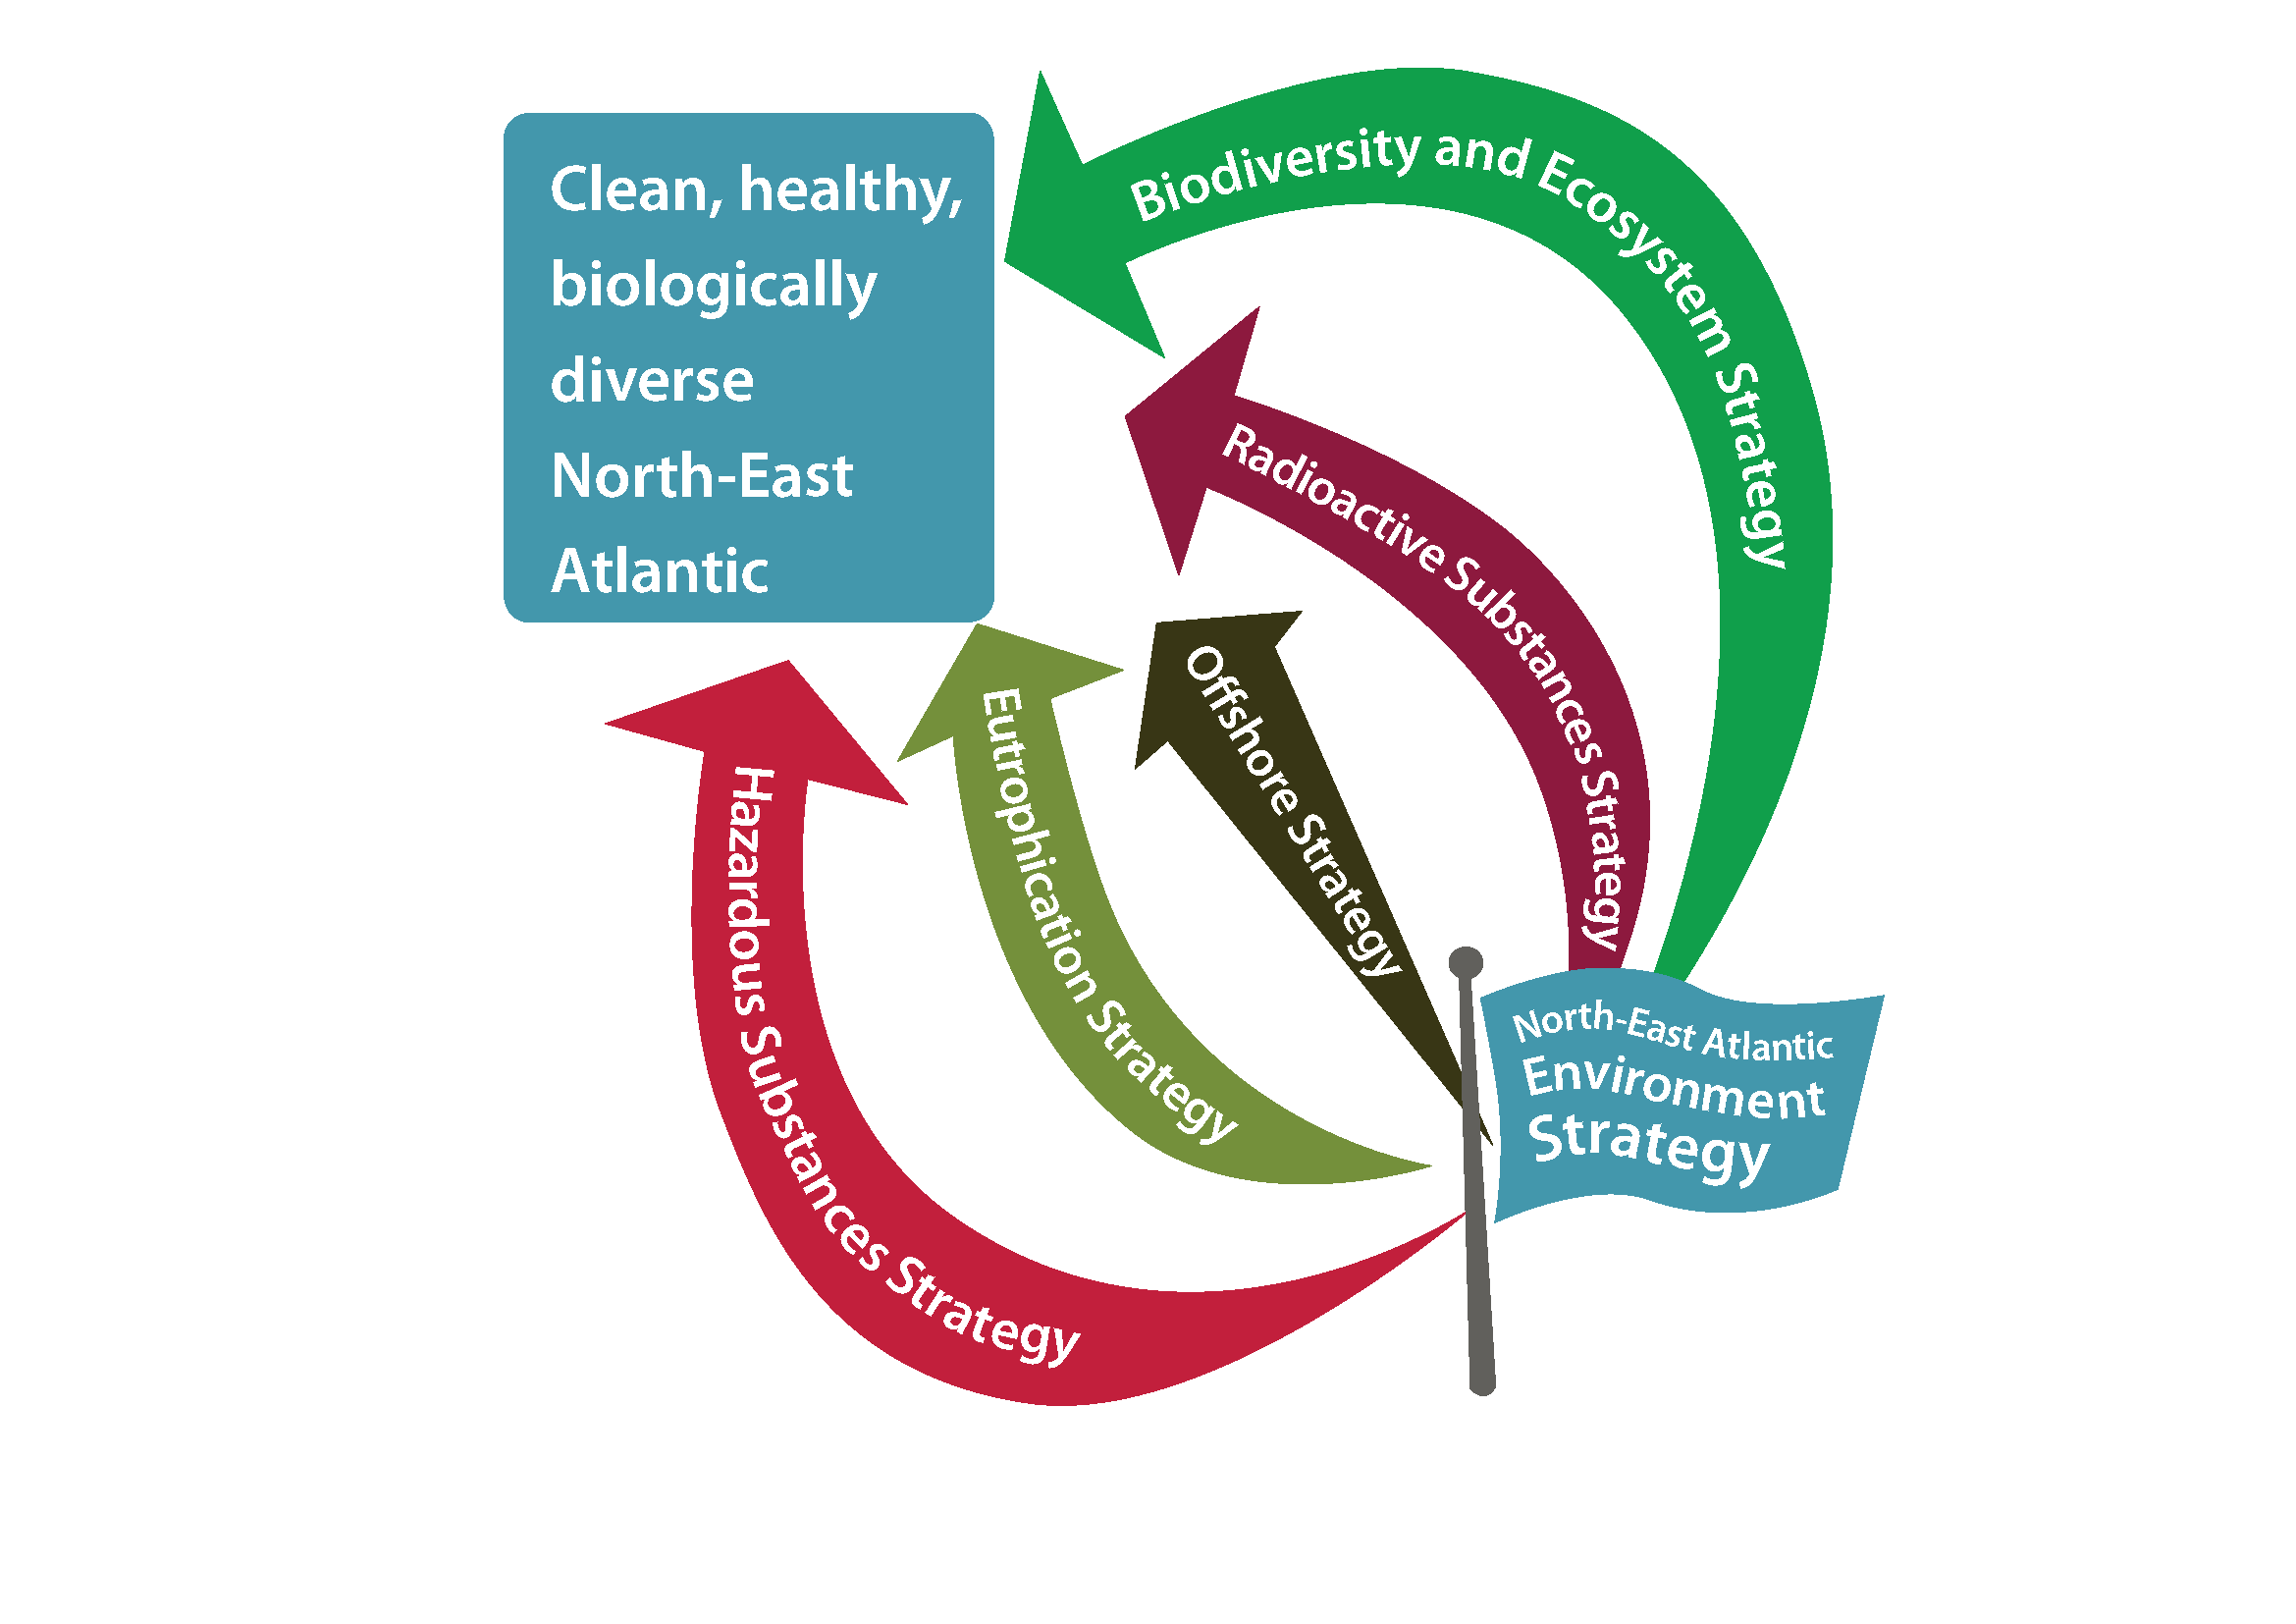
Figure 7: OSPAR Coordinates a wide range of monitoring activities that ultimately are contributing to the IA 2017 and to the delivery of a clean, healthy and biologically diverse North-East Atlantic, used sustainably