

What is Assessed?
The Components of this Assessment
The IA 2017 is made up of various units. In addition to this Introduction, the IA 2017 presents new and developing aspects in the areas of Socio-economics of the OSPAR Region and Ecosystem Assessment Outlook. Both components are of increasing relevance, but the methodology remains developmental. However, illustrating the concepts and ideas provides a strong foundation on which to build for the next OSPAR Quality Status Report (QSR).
The global climate has always been in a state of flux. However, human-driven climate change is resulting in increased rates of warming. The rate of these changes will impact on the biology, physics and chemistry of our seas and oceans as presented in the section entitled Climate and Ocean Acidification.
Given that only human activity can actually be managed, of fundamental importance is the presentation of Pressures from Human Activities . This covers the areas of hazardous substances, eutrophication, marine litter, invasive non-indigenous species and impulsive noise. Presented through a series of indicators, these human pressures are described in detail, covering topics such as the concentration of polycyclic aromatic hydrocarbons (PAHs) in marine sediments, the quantity of beach litter, and nutrient inputs. A full list is presented in Table 5.
Since the QSR 2010, 18 indicators have been developed to assess the state of biological diversity across the OSPAR Maritime Area (see Table 6). While some of these build on OSPAR’s experience in developing EcoQOs for the North Sea, many have been defined and developed only over the last six years and are being assessed for the first time in the IA 2017.
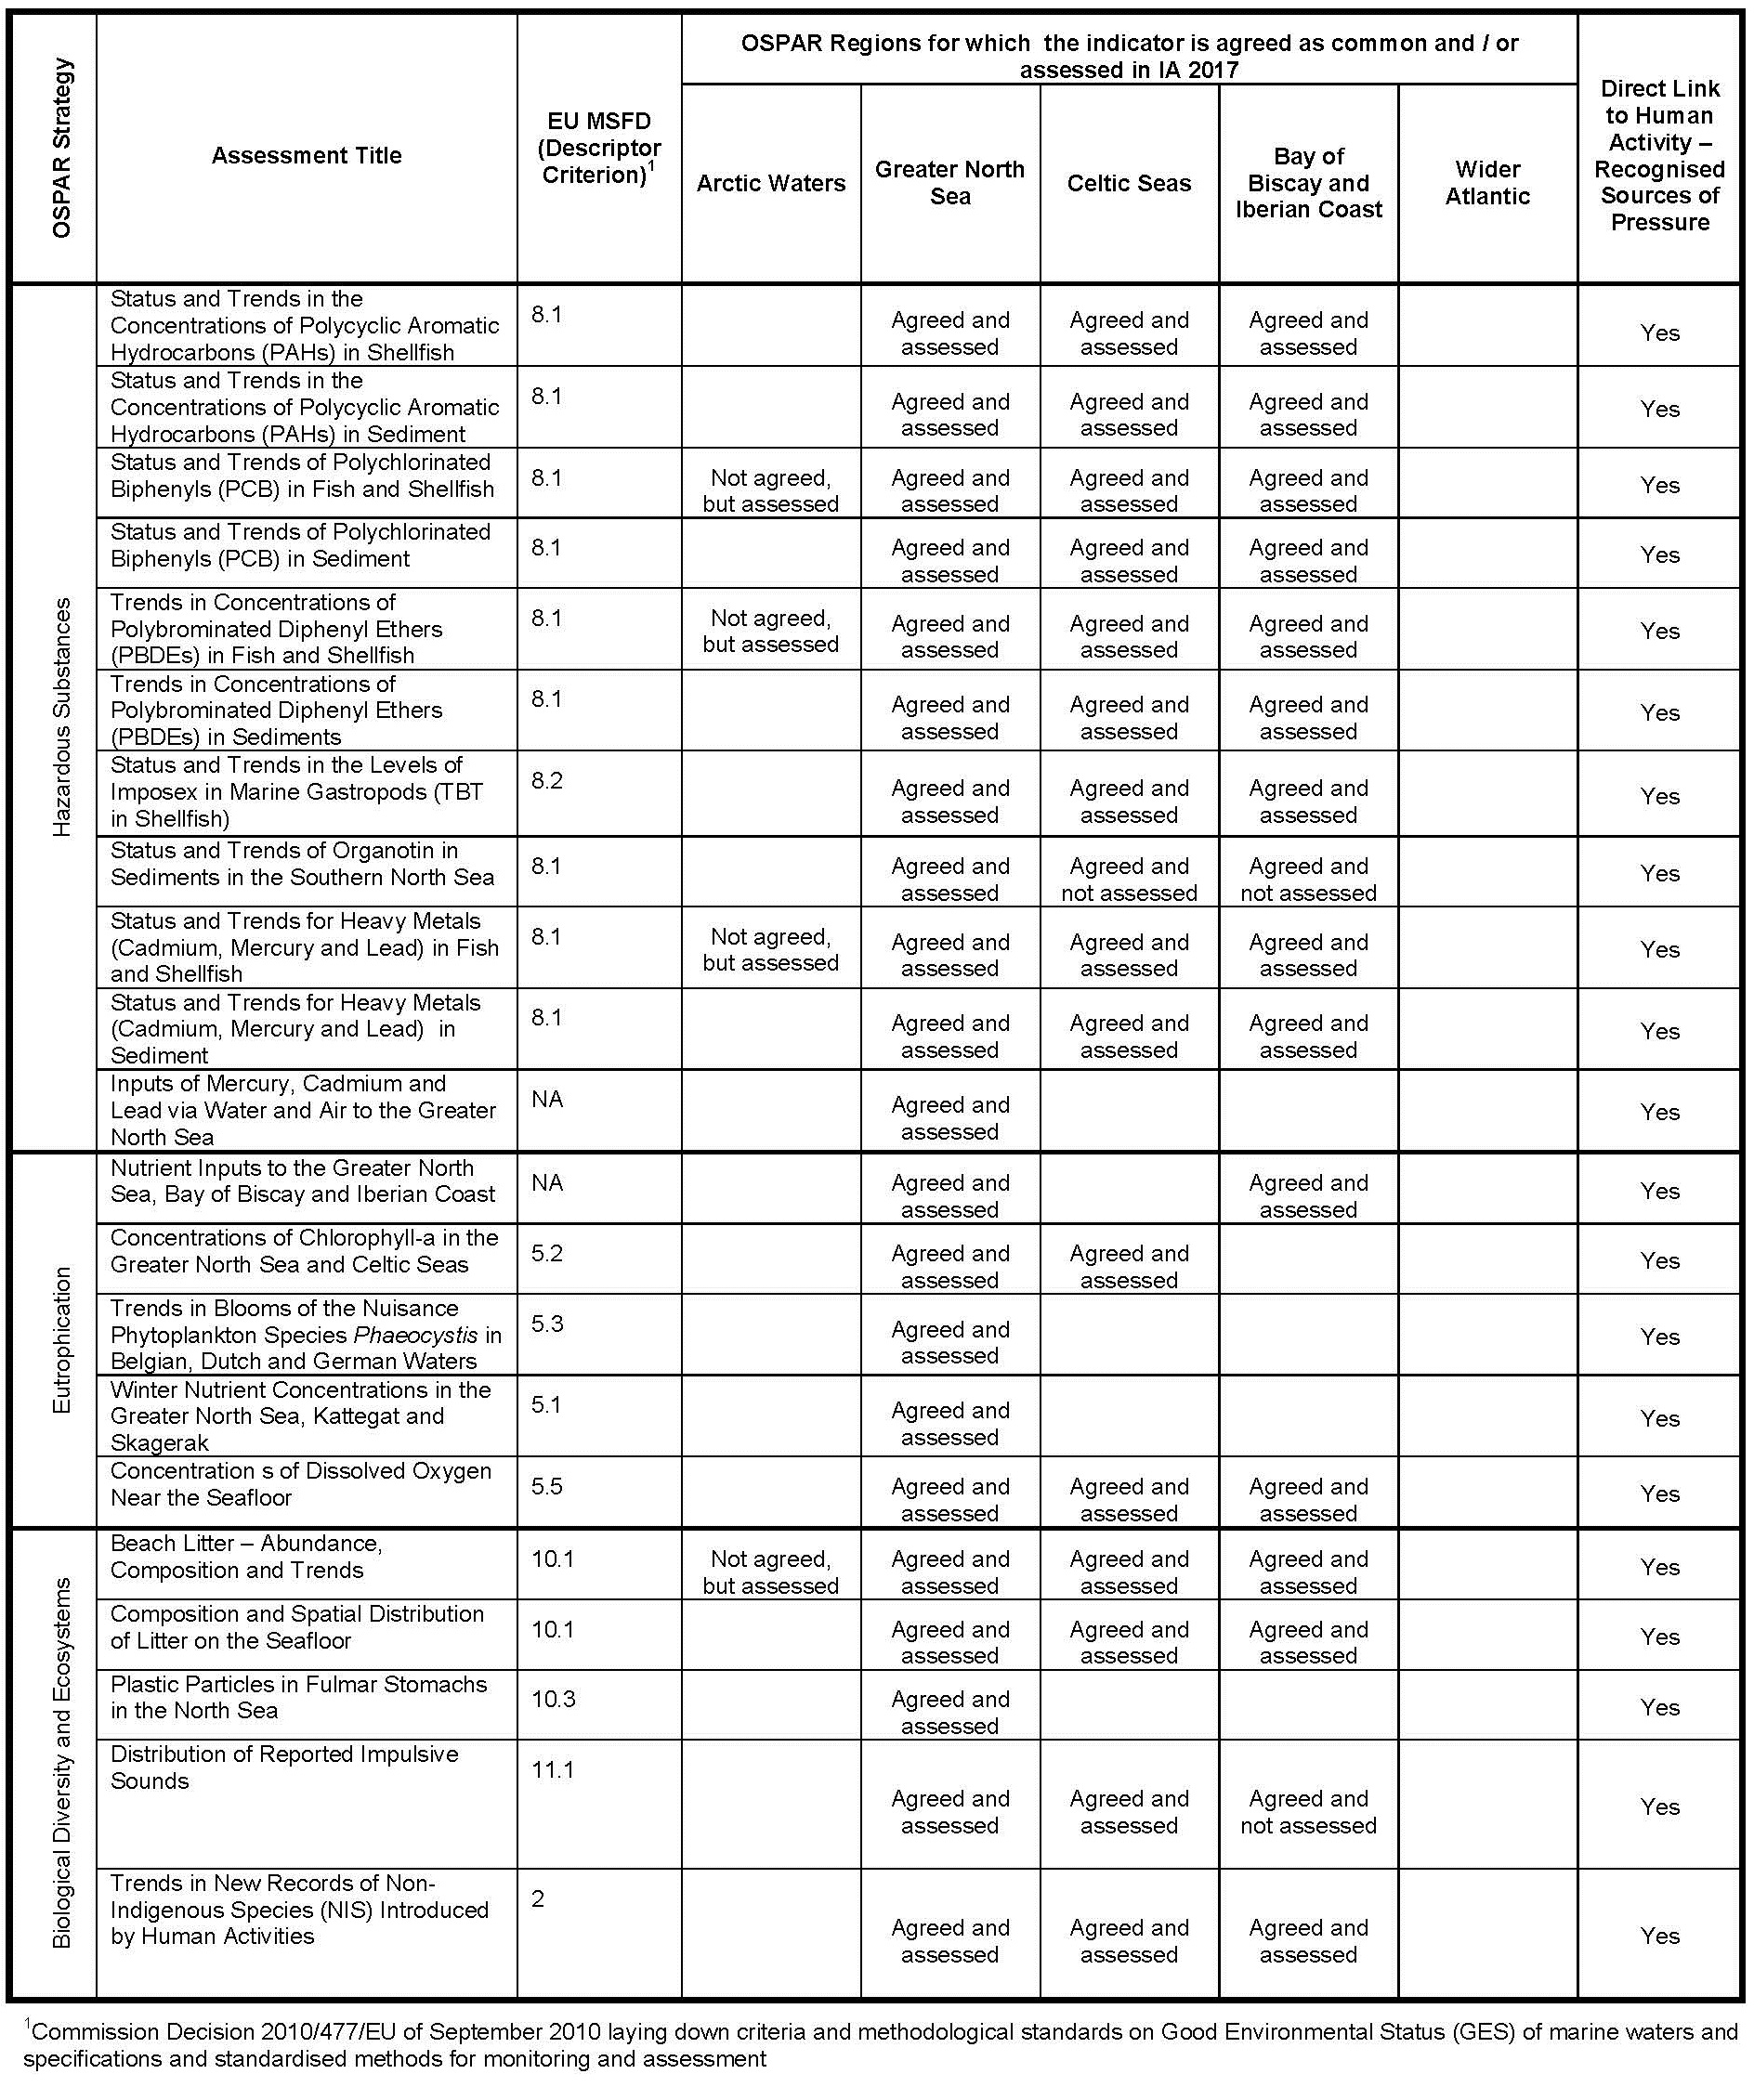
Table 5: An overview of the indicators presented in the IA 2017, used to assess human pressures and resulting impacts in the OSPAR Maritime Area
‘Status’ relates to assessments for which assessment values have been applied. For EU MSFD Descriptor codes see Figure 4. NA, Not Applicable. Y (last column, Yes).
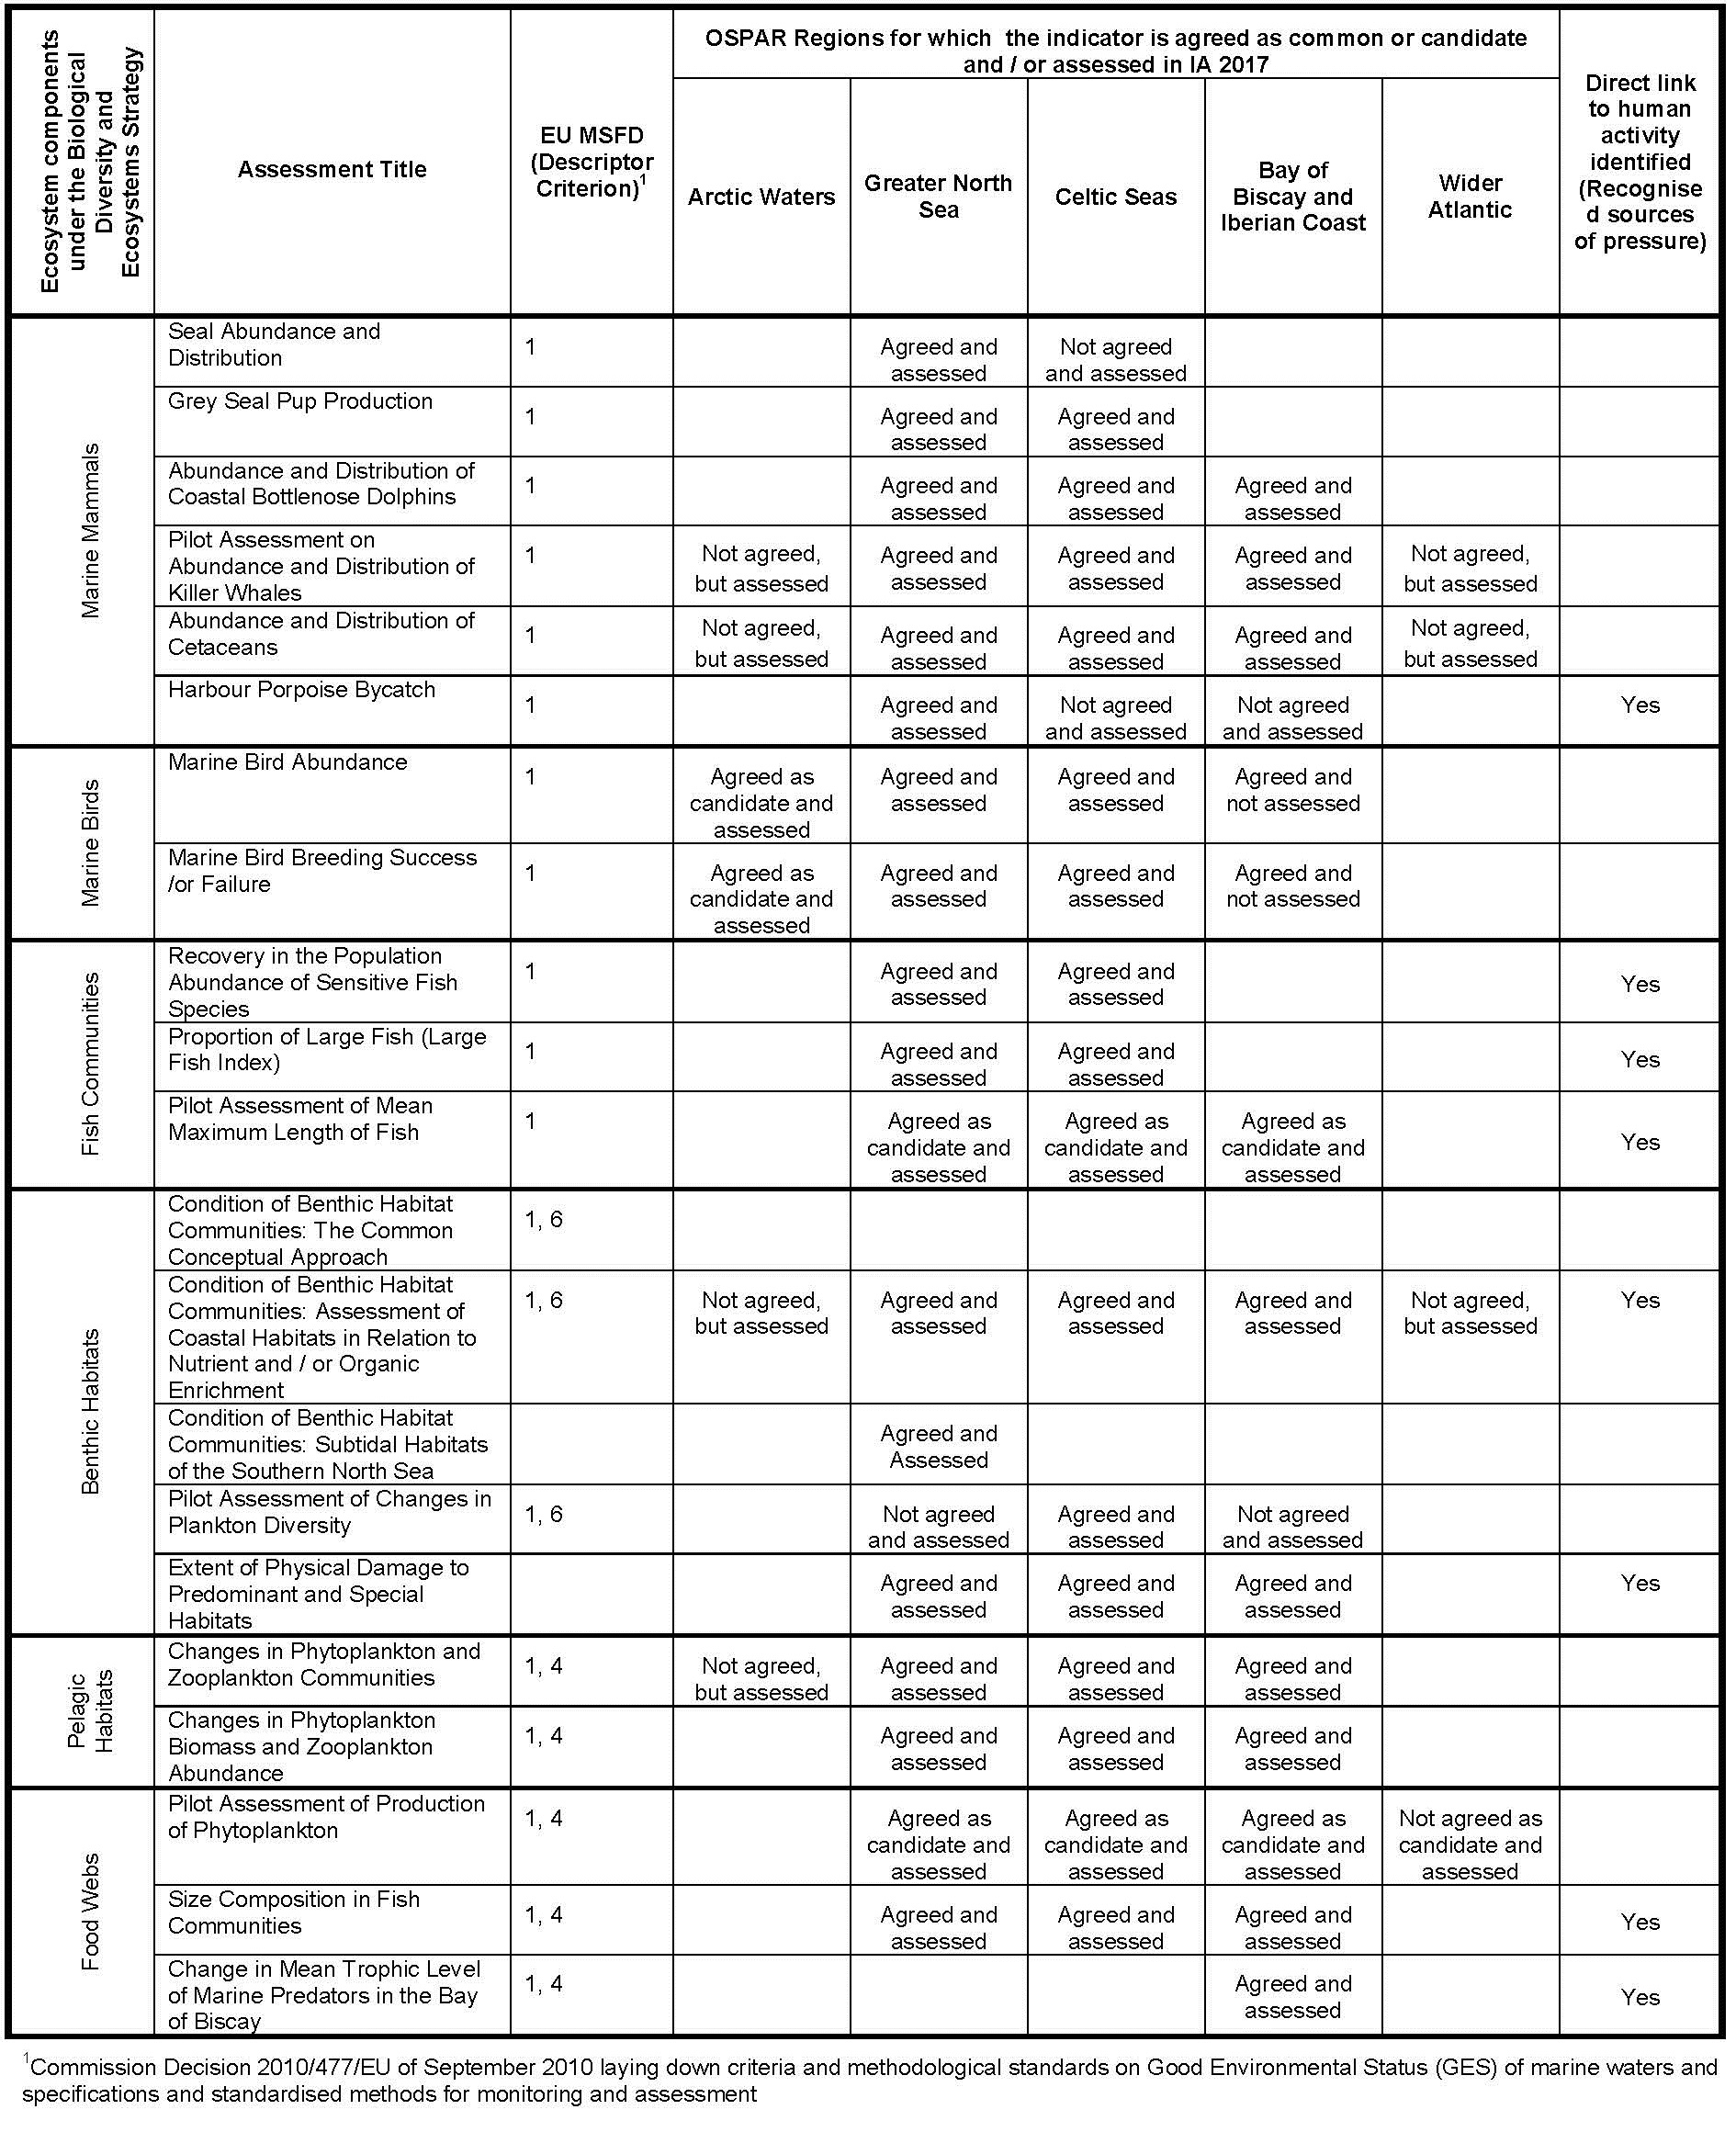
Table 6: An overview of the indicators used to assess biodiversity in the OSPAR maritime area on the basis of ecosystem components as detailed under the OSPAR Biodiversity and Ecosystems Strategy
‘Status’ relates to assessments for which assessment values have been applied. For EU MSFD Descriptor codes see Figure 4.
Assessing biodiversity at the regional scale creates new demands for data and analytical capacity. While existing datasets can be used for some of the indicators, this is not the case for many of them and OSPAR is only just beginning to build up time series of monitoring data. Biological data integrate the cumulative effect of pressures from human activities and the influences of oceanographic and climatic variability and can be inherently more variable than pressure data. While some aspects change rapidly, others change only slowly. Improving confidence in understanding temporal and spatial change may require a higher, and possibly disproportionate, intensity of monitoring.
The level of certainty about a pressure-impacts relationship depends on the intensity of monitoring that is feasible; as such, the level of certainty may range from very high, to a lower level that can be used as a trigger for investigative research. Capacities in interpretation are in development. Some indicators have been developed with the expectation that the information delivered will be enhanced by integrating it with the information used in other indicators, including those developed under other descriptors for GES.
OSPAR has produced, over the years, a series of Thematic Assessments. These continue to be part of OSPAR reporting procedures. Five are summarised in the IA 2017 (Table 7).
There remain gaps in the assessment of pressures and ecosystem components in order to judge whether the objective of clean and healthy seas are achieved or maintained in the OSPAR Maritime Area. Additional indicators (‘candidate indicators’) are under consideration and development in OSPAR with a view to closing gaps for future quality status assessments (Table 8). While further work will need to take account of the latest EU requirements for assessing the status of the marine environment under the MSFD, the work and considerations undertaken by OSPAR to date can inform the further development of assessment tools at EU and regional level in order to meet those requirements in the future.
Presentation of the Indicators
Key to the IA 2017 is making the data available and accessible. As such, the IA 2017 presents all the indicators in two ways:
Brief – this information is clearly presented when the reader first accesses the relevant indicator page and requires the reader to simply scroll through the page. The brief sections incorporate the Key Message, Background, Results, Conclusions, and Knowledge Gaps.
Extended – if the reader is interested in obtaining a more in-depth understanding of the Background to the indicator, or indeed the Results, Conclusions and Knowledge Gaps, then the extended information can be accessed through the bars marked ‘extended’. A description of the assessment method is also presented as an ‘extended’ section.
In addition, references can be accessed using the ‘reference’ bar, and the metadata are also readily accessible.
| OSPAR Strategy | Title | EU MSFD |
|---|---|---|
| Offshore Oil and Gas Industry | Summary of Trends in Discharges, Spills and Emissions from Offshore Oil and Gas Installations | Descriptor 8 |
| Radioactive Substances | Summary of the Fourth Periodic Evaluation of Progress Towards the Objective of the Radioactive Substances Strategy | The introduction of radionuclides is identified as a pressure under Annex III |
| Eutrophication | Summary of the Third OPSAR Integrated Report on the Eutrophication status of the OSPAR Maritime Area, 2006-2014 | Descriptor 5 |
| Biological Diversity and Ecosystems | Dumping and Placement of Dredged Material | Descriptor 8, Activity under Annex III |
| Biological Diversity and Ecosystems | Summary Status of the OSPAR Network of Marine Protected Areas (2016) | Descriptors 1, 4 and 6 |
| OSPAR Strategy / Ecosystem Components | Provisional Title / Topic | EU MSFD Descriptor(s) to which Indicator is Relevant |
|---|---|---|
| Pressures | ||
| Hazardous Substances | Organotin concentrations in biota | 8 |
| Hexachlorobenzene (HCB) concentrations in biota | 8 | |
| Hexachlorobutadiene (HCBD) concentrations in biota | 8 | |
| Hexachlorobutadiene (HCBD) concentrations in sediments | 8 | |
| Externally visible fish diseases | 8 | |
| Lysosomal stability (LMS) | 8 | |
| Bile metabolites (of Polycyclic Aromatic Hydrocarbons) | 8 | |
| Micronuclei (MN) | 8 | |
| EROD | 8 | |
| Biological Diversity and Ecosystems | Extent of area affected – physical | 7 |
| Spatial extent of habitats affected | 7 | |
| Changes in habitat function s | 7 | |
| Microplastics | 10 | |
| Ambient noise | 11 | |
| Biological Diversity and Ecosystems | ||
| Marine birds | Breeding success of kittiwake | 1, 4 |
| Non-native / invasive mammal presence on island seabird colonies | 1 | |
| Marine bird bycatch | 1 | |
| Distribution of marine birds | 1 | |
| Fish communities | By-catch rates of Chondrichthyes | 1 |
| Conservation status of elasmobranch and demersal bony fish species | 1 | |
| Proportion of mature fish | 1, 4 | |
| Distributional range | 1 | |
| Fish distributional pattern | 1 | |
| Benthic habitats | Typical species composition | 1, 6 |
| Area of habitat loss | 1, 6 | |
| Size-frequency distribution of bivalve or other sensitive / indicator species | 1, 6 | |
| Food webs | Reproductive success of marine birds in relation to food availability | 4 |
| Biomass, species composition and spatial distribution of zooplankton | 4 | |
| Fish biomass and abundance of dietary functional groups | 4 | |
| Biomass trophic spectrum | 4 | |
| Ecological Network Analysis of diversity | 4 | |
Hard Copy Presentations
All the brief components have been summarised in a two-page printable summaries more suitable as a quick communication means. This can be viewed by clicking on the relevant thumbnail.
A final thought
The IA 2017 provides an indicator-based assessment that enables users to access and download data behind the assessments using the ‘Metadata’ tab for each assessment. The objective is to make the content and assessments of the IA 2017 accessible to as wide an audience as possible. The multi-level approach will provide information that will be of use to policymakers, academics, students and the wider public. The opportunity to readily obtain more in-depth information if desired will ensure that individuals can assess for themselves the quality and coverage of the underlying data. Data density varies across and between the five OSPAR Regions. Times series are of different lengths. The key is that the direction of travel is towards providing more comprehensive and integrated assessments that will allow the policymakers and regulators to manage the human activities impacting on our seas to the benefit of nature and people.
Back to Introduction Home Page