

Status and Trend for Heavy Metals (Mercury, Cadmium and Lead) in Fish, Shellfish and Sediment
Background
OSPAR’s strategic objective from the North-East Atlantic Environment Strategy 2030 (NEAES 2030) is to prevent pollution by hazardous substances, by eliminating their emissions, discharges and losses, to achieve levels that do not give rise to adverse effects on human health or the marine environment with the ultimate aim of achieving and maintaining concentrations in the marine environment at near background values for naturally occurring hazardous substances and close to zero for human made hazardous substances. Trace metals are ubiquitous hazardous substances in the environment, and are found in sediment, shellfish, and fish in all OSPAR Regions. The most toxic metals to humans and animals are mercury, cadmium, and lead, all of which naturally occur in the environment and are known as trace- or “heavy” metals.
Mercury, cadmium, and lead enter the marine environment from a number of natural, agricultural, and industrial processes, via long-range transport by air, riverine input, or run-off from land ( Heavy metal inputs indicator assessment ). Direct inputs of metals used as antifouling chemicals (mainly copper) and corrosion anodes (mainly zinc) cause hot spots in metal concentrations in and around harbours, marine installations and along shipping routes. Zinc anodes usually also contain traces of lead and cadmium.
All heavy metals have a natural background concentration in water, sediment, and biota. For sediment, background concentrations are related to the grain size of the sediments, with clay minerals containing the highest metal concentrations. Sieving or normalisation of the metal concentrations to 5% aluminium removes most of the difference due to grain size for metals (Kersten & Smedes, 2002; OSPAR, 2018), allowing comparison across time and regions. Mercury is accumulated in the food chain, resulting in higher concentrations of mercury in fish than in lower trophic levels like shellfish. This effect is modelled, and concentration level of shellfish adjusted to fish levels before the EU QSsp assessment threshold is used.
OSPAR’s strategic objective is to prevent pollution of the OSPAR Maritime Area by hazardous substances, by eliminating their emissions, discharges and losses. Metals are ubiquitous hazardous substances that occurs naturally in the environment, and they are found in sediment, shellfish, and fish in all OSPAR Regions. The most toxic metals to humans and animals are mercury, cadmium, and lead, known as heavy or trace metals. The term “heavy” in this context relates to a density limit of 5 g/cm3 often used in metallurgy, while in environmental chemistry, the term is often used to denote toxic elements, not related to the density, and even including the metalloid arsenic. For a discussion on the term “heavy metal” and if/why it is meaningless, see Duffus (2002).
Mercury, cadmium, and lead are emitted through a number of natural, agricultural, and industrial processes. They enter the marine environment via long-range transport by air, riverine input, or run-off from land (covered in the trace metal inputs indicator assessment). In some cases, direct input occurs. For example, some metals used as antifouling chemicals (mainly copper) and corrosion anodes (mainly zinc) are deliberately placed in the marine environment, through their use on ships’ hulls or marine installations. This causes hot spots in metal concentrations in and around harbours.
 © Jakob Strand")
Figure a: Ship yard (Reykjavik) © Jakob Strand
Mercury has the potential to evaporate and be transported as a gas through the air; other trace metals are mainly transported as fine particles or bound to other particles. Trace metals can be trapped in deeper levels of sediment until mining, geological or biological processes release them, at which point they may affect biota. Background concentrations in sediments vary from region to region depending on the local lithologies.
Mercury accumulates in the food chain and is considered the most toxic of the three trace metals. It is found in extremely high concentrations in marine mammals in the Arctic Waters due to a long food chain and long-range transport of mercury. It has been estimated that anthropogenic inputs of mercury to the atmosphere are 7 to 10 times higher than the natural atmospheric levels (Krabbenhoft and Sunderland, 2013). Cadmium accumulates in the lower trophic levels and possibly in benthic food chains, but is bio-diluted in the pelagic food chains (Signa et al., 2017). Lead is usually not accumulated in the marine food chain (EQS substance data sheet for lead, 2005), but in the height of leaded fuels usage in the 1970s, atmospheric level was a factor of 100 above background level, but even after a ban on leaded fuels, the levels in the atmosphere are still a factor of 5 above the expected background levels.
Generally, sediment concentrations capture long-term changes (years), whereas concentrations in soft tissues of fish and shellfish indicate recent exposure (days to months) to the metals from surrounding water and prey.
The effects of high concentrations of trace metals on humans can include: decreased learning ability (lead and mercury); reduced bone strength (cadmium); and damage to the central nervous system (mercury). This has led to restrictions on most uses of cadmium and lead, and strict bans on mercury use.
Mercury has historically been used in medicine as an antibacterial agent and as a liquid anode in electrolysis in the paper industry. It has also been used in dental fillings, thermometers, and other scientific instruments. The main sources of mercury today are the burning of coal and artisan mining for mercury (Streets et al., 2017).
The Minamata Convention is a global treaty to protect human health and the environment from the adverse effects of mercury (https://www.mercuryconvention.org). It was adopted in 2013 and entered into force on 16th August 2017 with 128 parties ratifying the convention by 2021 (https://www.mercuryconvention.org). One main objective of the convention is to stop primary mercury mining by 2032.
The volatility and long-range transport properties of mercury make it particularly sensitive to climate change and effects of climate. Higher temperature increases oxidation rates of mercury in the atmosphere, leading to changes in deposition patterns, more forest fires increase the release of mercury from terrestrial soils, and increased precipitation can lead to higher depositions generally. More oxygen depletion can lead to higher methylmercury production in anoxic sediments, releasing it into the water column. Higher temperatures can also increase the uptake rate in food-webs, and ice-free arctic regions can change food-webs, all leading to higher mercury concentrations in the arctic regions (Krabbenhoft and Sunderland, 2013; AMAP, 2021).
Cadmium is today used in batteries and electronics and has previously been used in some red paints and plastics. It is found in minerals mined for zinc, copper, and lead, and is a minor constituent of all products of these trace metals. Cadmium can be taken up from the soil by plants. Through this process, it can be concentrated in plants, especially tobacco leaves, sunflower, and linseed.
Both mercury and cadmium are suspected carcinogens (Baines et al., 2021; Liu et al., 2009).
In the Roman empire lead was used for water pipes, as sweetener in wine (lead-acetate) and as colouring for skin-cream. In 1921, automotive engineers introduced lead as an engine lubricant to avoid knocking effects, which became the major source of lead pollution in air, water, and sediment during the 1970s until it was banned in different countries during the 1990s (Larsen et al., 2012). African countries were slower to stop using it, and in 2021, Algeria was the last country to ban the sale of leaded fuels, 100 years after its first introduction (UN, 2021). Lead has also been used as a softener in PVC piping, wires, metal alloys, crystal glass and many other industrial uses, and it is still being used in car batteries.

Figure b: The chimneys of the Danish powerplant “Amagerværket” in the background of Kastrup Sea Bath. Previously a coalfired powerplant from 1971, modified in 2020 to accommodate wood-pellets as main source of renewable energy, with gas and coal as backup. The powerplant supplies 650 MJ/s heat and 218 MW electricity to households in the Copenhagen area, supplemented by windmills.
Trace metals do not disappear over time and can be trapped in deeper levels of sediment until mining, geological or biological processes release them, at which point they may affect biota. There are natural concentrations of trace metals in all waters, sediments, shellfish, and fish, referred to as background concentrations. To assess if levels are close to this background, background assessment concentrations (BAC) have been developed, taking into account the levels from remote regions considered to be without anthropogenic inputs (except from long-range transport). OSPAR uses the Environmental Quality Standards for secondary poisoning (QSsp) for mercury set by the European Commission (Directive 2013/39/EU) as an environmental target, for other metals no QSsp have currently been developed. For human health, the maximum permissible concentration in foodstuff for trace metals in fish and shellfish is set by the European Commission (EC, 2006).
Due to the bioaccumulation potential of mercury, the concentration difference between trophic levels is large. A statistical model adjusting the concentrations of shellfish to that of fish was therefore developed based on the monitoring data (i.e., implicitly taking the trophic level into account based on a statistical model). Before this transformation, shellfish and fish concentrations were clearly separated in the regions while less difference was found between fish species.
For sediments, metals are a natural part of different minerals. Higher concentrations are found in fine clay sediments than in sand, and the natural background hence depends on the grain size of the sediments. This is taken into account by normalising (Loring, 1991; Kersten & Smedes, 2002; OSPAR, 2018), to the aluminium or lithium concentration of the sediment samples. For the OSPAR QSR 2023 assessment, “normal” sediment is obtained by recalculating to 5% aluminium contents in all areas, except the most southern subregions of the Iberian Sea and Gulf of Cadiz, where sediments typically are coarser and not related to glacial processes generating the clay minerals1.
1 OSPAR uses the United States National Oceanic and Atmospheric Administration guidelines for assessing the ecological significance of contaminant concentrations in sediment (Effects Range-Low; ERL) as proxy for Environmental Assessment Criteria (EAC).
In assessing trace metals both ‘relative’ and ‘absolute’ aspects have been considered
- ‘Trend assessment’ or spatial distribution assessment to focus on relative differences and changes on spatial and temporal scales – provides information about the rates of change and whether contamination is widespread or confined to specific locations; and
- ‘Status’ assessment of the significance of the (risk of) pollution, defined as the status where trace metals are at a hazardous level, usually requires assessment criteria that take account of the possible severity of the impacts and hence require criteria that take account of the natural conditions (background concentrations) and the ecotoxicology of the trace metals. There is only an environmental quality standard (EQS) available for mercury in fish, not for other metals in biota. Previously the European Commission (EC) maximum concentration limits for trace metals in seafood (fish and shellfish) were used by OSPAR as proxy Environmental Assessment Criteria (EACs), but in this assessment, these are only used as thresholds for human health.
OSPAR has clarified that in assessing the Coordinated Environmental Monitoring Programme (CEMP) data the primary assessment value used in the assessment of trace metal concentrations in sediment and biota, “corresponds to the achievement, or failure to achieve, statutory targets or policy objectives for contaminants in these matrices” (OSPAR, 2009). This set of assessment criteria was specifically compiled for the assessment of CEMP monitoring data on hazardous substances contributing to the QSR 2010. The use of this set was considered an interim solution for the purposes of the QSR 2010 until more appropriate approaches to defining assessment criteria could be agreed and implemented. These criteria have also been used in the annually recurring CEMP assessments since 2010.
For the QSR 2023, trends in trace metal concentrations in biota are presented. Two assessment criteria are used to assess the status of trace metal concentrations in biota: For background, Background Assessment Concentrations (BACs) were used for all metals, for environmental thresholds only mercury has been assessed based on the Water Framework Directive Environmental Quality Standard for secondary poisoning (QSsp) of mercury in fish.
Unfortunately, no such value is currently available for other trace metals. Two alternative thresholds for marine mammals and birds, have been developed by the Arctic Monitoring and Assessment Programme (Dietz et al., 2021) for mercury. These criteria were used for individual time series, but have not been included in regional status assessments presented here, because further work is required to investigate their comparability with the BAC and QSsp. The human health assessment is based on thresholds by the European Commission maximum permissible concentrations (MPC) for fish and seafood (EC, 2006), available for all three metals and individual fish and shellfish species. Data for marine mammals and birds are presented where available (mainly the Arctic Waters Region), but not included in the status assessment in the QSR 2023.
OSPAR’s QSR 2023 Indicator Assessment values are not to be considered as equivalent to proposed European Union Marine Strategy Framework Directive (MSFD) criteria threshold values. However, they can be used for the purposes of their MSFD obligations by those Contracting Parties that wish to do so.
Provenance and limitations of BACs
Background Assessment Concentrations (BACs) were developed by OSPAR for testing whether measured concentrations are near background for naturally occurring substances and close to zero for man-made substances, the ultimate aim of the OSPAR Hazardous Substances Strategy 2010-2020. Mean concentrations significantly below the BAC are said to be near background (naturally occurring concentrations).
Background concentrations (BCs) represent the concentrations of hazardous substances that would be expected in the North-East Atlantic if certain industrial developments had not happened. They represent the concentrations of those substances at ‘remote’ sites, or in ‘pristine’ conditions based on contemporary or historical data, respectively, in the absence of significant mineralisation and/or oceanographic influences. For sediments, dated sediment cores have also been used to establish pre-industrial levels. In this way, they relate to the background values referred to in the OSPAR Hazardous Substances Strategy 2010-2020. It is recognised that natural processes such as geological variability or upwelling of oceanic waters near the coast may lead to significant variations in background concentrations of contaminants, for example, trace metals. The natural variability of background concentrations should be taken into account in the interpretation of CEMP data, and local conditions should be taken into account when assessing the significance of any exceedance.
Low concentrations (LCs) are values used to assist the derivation of BACs where there have been difficulties in assembling a dataset on concentrations in remote or pristine areas from which to derive BCs. LCs have been prepared on the basis of datasets from areas that could generally be considered remote, but which could not be guaranteed to be free from the influence of long-range atmospheric transport of contaminants.
BACs are calculated according to the method set out in Section 4 of the CEMP Assessment Manual (OSPAR, 2008) and updated in OSPAR (MIME 2020, 2021). The outcome is that, on the basis of what is known about variability in observations, there is a 90% probability that the observed mean concentration will be below the BAC when the true mean concentration is at the BC. Where this is the case, the true concentrations can be regarded as ‘near background’ for naturally occurring substances like trace metals.
BACs are calculated on the basis of variability within the CEMP dataset currently available through databases held by the International Council for the Exploration of the Sea (ICES) Data Centre and will be refined by the relevant assessment working group, as further CEMP monitoring data are collected.
Provenance and limitations of EC maximum levels in fish and seafood
To assess the effect of metals on human health, the European Commission’s maximum permissible concentrations (MPC) in fish and seafood (EC, 2006) have been used. EC MPC are applied in European Union Member States’ control of foodstuffs with the aim of protecting public health by excluding the most contaminated food from the market. The limits are set on the basis of the diet of the ‘average’ European consumer and should, according to Regulation 1881/2006, be set at “a strict level which is reasonably achievable by following good agricultural, fishery and manufacturing practices and taking into account the risk related to the consumption of the food”. So, if there are improvements in the practices (i.e., a decrease in the levels of environmental contaminants) the EC MPC may be reviewed. If the EC maximum food levels for fish and shellfish are exceeded, the catch should not be put on the market.
The EC maximum levels for lead, mercury and cadmium in fish muscle and shellfish were previously used as alternatives to EACs for trace metals in both fish and shellfish species for the QSR 2010 and Intermediate Assessment 2017. These values are firmly established by EC regulation but have the disadvantage that the standards for cadmium and lead have not been directly designed for all the matrix/contaminant combinations required for the assessment. In general, it is recognised that the use of dietary standards is not fully satisfactory for assessing environmental risk, and that these values and their use to draw conclusions concerning the common indicator assessment for trace metals in biota should be treated with care. Unfortunately, only one environmentally based threshold (QSsp) is available for mercury in whole fish.
Provenance and limitations QSsp thresholds
The EU Water Framework Directive put forward a method for setting Quality Standards in the EU (2011), and its interpretation for evaluating monitoring in the EU (2014). For mercury, the derivation of the QSsp was thoroughly discussed in OSPAR (2016), and the application of the EU (2011) approach has large uncertainties when defining the trophic bioconcentration, as it is different for methylmercury and inorganic mercury, and the QSsp is mainly derived from methylmercury but applied to total mercury. The QSsp was also used on mussels using a statistical model to transform the concentration levels found in mussels to fish levels, implicitly taking trophic level differences into account.
Provenance and limitations of AMAP NRC and LRC thresholds for marine mammals and birds
The basis for EC, EQS and OSPAR EACs is the protection of top predators, however, the marine mammals and birds are the top predators, so it does not make sense to use the fish or shellfish thresholds for these. Instead, a set of risk-based levels have been established for use in the Arctic Monitoring and Assessment Programme. There is no direct translation of No Risk Concentration (NRC), to “BAC” for marine mammals and birds, and a Low-Risk Concentration (LRC) below which the concentration is unlikely to harm the species, could be taken as the upper threshold for good environmental status, but the link to the EQS for mercury (QSsp) has to be established before use.
Therefore, the mammal and bird data are not included in the status assessment, but only the time trend assessment. The derivation of bird blood is given in Ackerman et al., (2016), for other bird organs and marine mammals. Dietz et al., (2021) summarised the derivation of the NRC and LRC limits in marine mammal hair, marine mammal and bird liver, bird feathers and bird eggs. Marine mammal results are only available for Region I (Arctic Waters), whereas bird data are available both for Region I and Region II, but only from two stations in Region II.
Provenance and limitations of ERLs
OSPAR has not yet established EACs for trace metals in sediment, and there are no EC equivalent firm EQS values for sediments. For some substances, an interim QSsediment has been suggested, but in most cases, the recalculation from water to sediment is considered too uncertain to make this official. Therefore, a proxy means of assessment has been used. ‘Effects range’ values were developed by the United States National Oceanic and Atmospheric Administration (NOAA, 1999) for assessing the ecological significance of contaminant concentrations in sediment, to protect against the potential for adverse biological effects on organisms. Concentrations below the Effects Range-Low (ERL) level rarely cause adverse effects in marine organisms.
The ERL value is defined as the lower tenth percentile of the data set of concentrations in sediments, which were associated with biological effects. Adverse effects on organisms are rarely observed when concentrations fall below the ERL value, and the ERL therefore has some parallels with the philosophy underlying the OSPAR EACs and the Environmental Quality Standards (EQSs) of the European Union Water Framework Directive. The procedure by which ERL criteria are derived is very different from the methods used to derive EACs and EQSs, and so precise equivalence between the two sets of criteria should not be expected. ERL values are used in sediment assessments of trace metals as an interim solution where recommended EACs are not available.
Assessment method
For each trace metal at each monitoring site, the time series of concentration measurements was assessed for trends and status using the methods described in the contaminant’s online assessment tool (https://dome.ices.dk/ohat/?assessmentperiod=2022). The results from these individual time series were then synthesised at the assessment area scale in a series of meta-analyses.
Trend assessments included those monitoring sites that were representative of general conditions or baseline, and excluded those monitoring sites impacted due to a point source. The analysis was also restricted to assessment areas where there were at least three monitoring sites with trend information and where those monitoring sites had reasonable geographic spread.
The trend in each metal at each monitoring site was summarised by the estimated annual change in log concentration, with its associated standard error. The annual change in log concentration was then modelled by a linear mixed model with fixed effects:
~ trace metal: OSPAR contaminants assessment areas
and random effects:
~ monitoring site + metal: monitoring site [biota only] + residual variation
The choice of fixed and random effects was motivated by the assumption that the trace metals could have very different trends as they have different sources and are metabolised differently. Thus, the fixed effects measure the trend in each trace metal in each OSPAR contaminants assessment area and the random effects measure variation in trends:
- between monitoring sites common across trace metals (monitoring site);
- between metals but common across tissues and species within monitoring sites (metal : monitoring site); and
- residual variation.
The residual variation is made up of two terms: the variation associated with the estimate of the trend from the individual time series, which is assumed known (and given by the square of the standard error); and a term which accounts for any additional residual variation not explained by the other fixed and random effects.
Evidence of trends in trace metal concentrations at the assessment area scale was then assessed by plotting the estimated fixed effects with point-wise 95% confidence intervals.
Similar analyses explored status at the assessment area scale. Two summary measures were considered: the log ratio of the fitted concentration in the last monitoring year to the QSsp; and the log ratio of the fitted concentration in the last monitoring year to the BAC. Impacted monitoring sites were also included in these analyses. The analyses using the QSsp also included a term to estimate and adjust for the difference in concentrations between fish and shellfish.
For trace metals, BACs have been developed for mussels, oysters, and fish. An EC Environmental Quality Standard of 20 µg/kg ww for mercury has been developed for whole fish, below the established BAC for mercury of 35 µg/kg ww in fish, but not for shellfish (~18 µg/kg ww), therefore for fish, BACs are not used and QSsp is used directly.
BACs and EC levels are available for three trace metals only, cadmium, mercury, and lead (Table a)
Table a: Assessment criteria used in for trace metals in sediment, fish, and shellfish: BAC is Background Assessment Concentrations developed by OSPAR, QSsp are Environmental Quality Standards for secondary poisoning developed under the Water Framework Directive, MPC are European Commission maximum levels in fish and seafood; ERL, Effects Range-Low (O’Conner, 2004); dw, dry weight. ww, wet weight.
| Sediments (Al = Aluminium) | Biota | |||||||||||
|---|---|---|---|---|---|---|---|---|---|---|---|---|
| Symbol | BAC (5% Al) | BAC | ERL | BAC | QSsp | MPC | ||||||
| All subregions except Iberian Sea and Gulf of Cadiz | Iberian Sea and Gulf of Cadiz | All subregions | mussels | oysters | fish | Whole fish | Fish muscle | Bivalves | Crustaceans | |||
| mg/kg dw | μg/kg dw | μg/kg ww | ||||||||||
| Cadmium | Cd | 0,31 | 0,129 | 1,2 | 960 | 3 000 | 26 | 50 | 1 000 | 500 | ||
| Mercury | Hg | 0,07 | 0,091 | 0,15 | 90 | 180 | 35 | 20 | 500 | 500 | 500 | |
| Lead | Pb | 38 | 22,4 | 47 | 1 300 | 1 300 | 26 | 300 | 1 500 | 500 | ||
Table a notes:
- BAC for sediment is normalised to 5% aluminium except for subregions Iberian Sea and Gulf of Cadiz.
- ERLs are not normalised, but considered valid for 5% aluminium.
- BACs for mussels and oysters are expressed as μg/kg dw (dry weight) and BACs for fish, QSsp and MPC are expressed as μg/kg ww (wet weight); Cadmium BAC for fish is only applied when lipid >3% and mercury BAC for fish was above QSsp so not used.
- BACs and EC levels are converted to other bases (wet, dry or lipid weight) using species-specific conversion factors.
Table b: Number of monitoring sites within each assessment area used in the assessment of regional status and trends. *denotes regions with insufficient stations with sufficient geographic coverage to estimate regional trends or status.
| OSPAR Region | OSPAR Subregion | Sediment | Fish and shellfish | ||
| Trends | Status | Trends | Status | ||
| Arctic Waters | Barents Sea | - | - | 7 | 11 |
| East of Iceland | - | - | 2* | 0* | |
| Greenland-Scotland Ridge | - | - | 14 | 11 | |
| Norwegian Sea | - | - | 5 | 6 | |
| Greater North Sea | Channel | 3 | 41 | 28 | 32 |
| Northern North Sea | 13 | 15 | 29 | 33 | |
| Norwegian Trench | - | - | 11 | 16 | |
| Skagerrak and Kattegat | - | - | 19 | 39 | |
| Southern North Sea | 64 | 71 | 43 | 48 | |
| Celtic Seas | Celtic Sea | 2* | 3 | 28 | 34 |
| Irish and Scottish West Coast | 6 | 6 | 28 | 28 | |
| Irish Sea | 13 | 16 | 41 | 49 | |
| Bay of Biscay and Iberian Coast | Gulf of Cadiz | - | - | 2* | 3 |
| Iberian Sea | 2* | 36 | 32 | 33 | |
| Northern Bay of Biscay | - | - | 37 | 44 | |
Differences in methodology used for the QSR 2023 compared with the Intermediate Assessment 2017 (IA 2017)
For the QSR 2023, a meta-analysis is used to synthesise the individual time series results and provide an assessment of status and temporal trend at the assessment area level. Meta-analyses take into account both the estimate of status or temporal trend in each time series and the uncertainty in that estimate. This method was also used for the IA 2017.
The assessment thresholds in fish and shellfish used in IA 2017 are reported as “human health” thresholds in the QSR 2023, and environment thresholds for mercury have not been used before, either in fish and shellfish or mammals and birds. There were no environmental thresholds for metals other than mercury, whereas background assessment concentrations were available for other metals, but not for mercury in fish, as this was above the QSsp for fish, and hence excluded from the assessment criteria.
Results
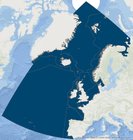
Metals were measured in fish, shellfish, and sediment, collected between 1979 and 2020 from monitoring sites of fish and shellfish throughout Arctic Waters, Greater North Sea, Celtic Seas, and Bay of Biscay and Iberian Coast, with additional data from marine mammals and birds in the Arctic Waters, and some bird in the Greater North Sea (Figure 1). Sediments were less widely sampled, with the main monitoring effort in the Greater North Sea followed by the Celtic Seas and Bay of Biscay and Iberian Coast (Figure 2). Shellfish was always from coastal stations, whereas some fish and sediment sites from the central North Sea are included. The frequency of sampling ranges from annually to every five years.
Figure 1: Monitoring sites used to assess metal concentrations in fish and shellfish with indication of OSPAR Regions (full lines) and subregions (light lines). Purple dots indicate stations with time trend information, blue dots indicate that only status assessments are available. Available at: ODIMS.
Figure 2: Monitoring sites used to assess metal concentrations in sediment with indication of OSPAR Regions (full lines) and subregions (light lines). Purple dots indicate stations with time trend information, blue dots indicate that only status assessments are available. Available at: ODIMS.
For the assessment of status and temporal trends, only areas with at least three monitoring sites and a reasonable geographic spread were included, reducing the number of subregions available to 14 of 15 for fish and shellfish and seven for sediments. Fish and shellfish data were combined to a fish-normalised concentration level for mercury comparison with the QSsp.
Cadmium and lead concentrations in fish and shellfish was found to be statistically significant below the background concentration in the Irish and Scottish West Coast, Celtic Seas and the Bay of Biscay and Iberian Coast, whereas lead was below the background concentration in the Irish and Scottish West Coast, Greenland-Scotland Ridge and Norwegian Sea (Figure 4).
An environmental threshold has only been defined for mercury in fish, marine mammals, and birds. Only the QSsp for fish was used in the regional status assessment. No regions were significantly below these thresholds. For concentrations in sediment, all subregions were statistically significantly below the ERL for cadmium, whereas for mercury and lead, only the Northern North Sea, Irish and Scottish West Coast and the Iberian Sea were below the ERL, all other subregions were above.
As a consequence, in the Channel and Southern North Sea adverse biological effects on marine organisms by trace metals cannot be ruled out, but effects are lower toward the more remote areas of the OSPAR maritime area.

Figure 3: Mean metal concentration in fish and shellfish for mercury relative to QS secondary poisoning. Blue dots indicate below background, green dots indicate below environmental criteria and red dots indicate above environmental criteria.

Figure 5: Mean metal concentration in fish and shellfish for sediment relative to ERL. Blue dots indicate below background, green dots indicate below environmental criteria and red dots indicate above environmental criteria.

Figure 4: Mean metal concentration in fish and shellfish for cadmium, lead and mercury relative to BAC. Blue dots indicate below background, green dots indicate below environmental criteria and red dots indicate above environmental criteria.
Temporal trends for the metal concentrations in fish, shellfish and sediments were modelled between the earliest monitoring dates (1979 or later) and 2020, and the change in concentration calculated as the yearly change between the modelled 2000 (or later if monitoring at region started after 2000) and 2020 concentration, if more than 5 years of data were available. Mammals and birds present in the Arctic only have not been included in this assessment.
For mercury in fish and shellfish, no decreasing trends were observed for any subregions, and for the Southern North Sea, the Channel and Northern Bay of Biscay increasing trends of 2 to 4% yearly change (Figure 6) were observed, whereas the sediment showed decreasing trends in both Northern, Southern North Sea and the Irish Sea and Irish and Scottish West Coast of around -3% yearly change (Figure 7). The increasing trend in fish and shellfish for the Southern North Sea is mainly from increasing levels in the Wadden Sea area, and for the Channel and Northern Bay of Biscay mainly along the coast of France.

Figure 6: Time trend evaluation for cadmium, lead and mercury in fish and shellfish. The trend direction is shown as a triangle upwards or downwards, a circle indicates no trend. The trend is shown as a % yearly change since 2010.

Figure 7: Time trend evaluation for cadmium, lead and mercury in sediments. The trend direction is shown as a triangle upwards or downwards, a circle indicates no trend. The trend is shown as a % yearly change since 2010.
The sediment samples are generally taken further out at sea around the Wadden Sea, but even the coastal stations indicate downward trends, as opposed to the trend in fish and shellfish, maybe indicating release of mercury from the sediments to the water with increasing uptake in shellfish and fish, but this needs further investigation. For the Northern Bay of Biscay, no sediment data are available for time trends.
For lead and cadmium, similar trends are observed in fish and shellfish with increasing concentrations of around 2,5 to 3,5% yearly change for cadmium and 4% yearly change for lead in the Channel and ~1,5% yearly change in the Southern North Sea and Northern Bay of Biscay. In sediment, lead is showing a decreasing trend with –2% yearly change in the Southern North Sea and Irish Sea, but cadmium is increasing in the Channel and Irish and Scottish West Coast at 4-5% yearly change and decreasing with -2,5% yearly change in the Southern North Sea.
Concentrations of trace metals are monitored in the CEMP monitoring programme for 603 to 647 biota monitoring sites of each trace metal, accessible in the OHAT web tool. The assessment in QSR 2023 focused on samples where data was available from 2015 onwards, reducing the number of status stations to 389. The time trends were based on stations with at least 5 years of data (66 to 70 stations for mercury, cadmium, and lead), of which 20 to 22% exhibited a time trend (Figure 1). For sediments, 393 to 401 monitoring sites have been sampled, of which 7 to 10% exhibited a trend. Sediments often have longer intervals between sampling events, and are collected at fewer stations. Sediment data are not available from the Arctic subregions of Region I.
Other metals are monitored under OSPAR’s Coordinated Environmental Monitoring Programme (CEMP), and the results are generally similar to the three prioritised trace metals, with regard to the Southern North Sea, Channel and Northern Bay of Biscay. For biota, zinc and copper were also evaluated using BAC for assessment, and for sediments.
The status for biota samples of zinc and copper are both above background levels in all Regions (Figure c), whereas for sediments, assessments based on BAC and ERL values for zinc, copper and chromium were also possible and showed that, for most of the central North Sea, levels were above the ERL for zinc and chromium, whereas levels for the Northern North Sea and Iberian Sea were below. For copper only the Celtic Seas were above the ERL.

Figure c: Modelled metal concentration and their 95% confidence limit in fish and shellfish mercury, zinc, cadmium, copper and lead relative to BAC.

Figure d: Modelled metal concentration for zinc, copper, lead, mercury, cadmium, and chromium in sediment relative to ERL.
Particularly in sediments the trends are generally the same as for mercury and lead with decreasing trends of nickel, zinc, copper, arsenic, and chromium for the Southern North Sea. For zinc and copper, decreasing trends are also observed for the Northern North Sea, whereas arsenic is increasing in the Northern North Sea. Copper is also decreasing in the Irish Sea sediments (Figure e).
In fish and shellfish, increasing trends are found in the Channel and Southern North Sea for zinc, selenium copper, arsenic, but only in the Channel for nickel and chromium. Also, the Northern Bay of Biscay shows increasing concentrations for zinc, nickel, copper, and chromium (Figure f). This is markedly different from the findings in the IA 2017, where only cadmium in the Southern North Sea indicated an increasing trend, whereas it was decreasing in the Norwegian Trench, the Irish Sea, Celtic Sea and Northern Bay of Biscay. For mercury only a significant decreasing trend was found in the Iberian Sea in the IA 2017, and for lead 7 of the 10 regions examined in the IA 2017 showed a downward trend, with no upward trend.

Figure e: Time trend evaluation for all available metals in fish and shellfish. The trend direction is shown as a triangle upwards or downwards, a circle indicates no trend. The trend is shown as a % yearly change since 2010.

Figure f: Time trend evaluation for all available metals in sediments. The trend direction is shown as a triangle upwards or downwards, a circle indicates no trend. The trend is shown as a % yearly change since 2010.
Ranking the metals in fish and shellfish according to the number of subregions with increasing concentrations, copper is clearly the worst – increasing in five of the 13 subregions, and no subregions show decreasing trends. Chromium and nickel are increasing in four subregions and decreasing in one subregion. Mercury, zinc, cadmium and lead are increasing in 3 subregions, and zinc and cadmium are decreasing in one subregion, whereas lead is decreasing in three subregions.
As the expectations are that inputs are decreasing from air and rivers, the general sediment downward time trends make sense, whereas the generally upward time trends for fish and shellfish point to an internal release from the sediment to the water and marine organisms, or a change in the uptake of metals in fish and shellfish due to higher temperatures (Kibria et al., 2021).
Conclusion
Mercury was found to be problematic in all areas for shellfish and fish, being above both the BAC for mussels and the QSsp assessment criteria. Lead and cadmium were above background levels for shellfish and fish in most areas, except the Irish and Scottish West Coast. The Celtic Seas, Iberian Sea and Northern Bay of Biscay were above background levels for cadmium and the Norwegian Sea and Greenland-Scotland ridge for lead. In sediments, mercury and lead were above the ERL assessment criteria in the Southern North Sea, the Channel, the Irish Sea and the Celtic Seas. For the Irish and Scottish West Coast, background levels were achieved in sediments.
Despite the global convention on mercury, and much legislation on reducing or banning mercury and other metals being in place, time trends are showing increasing levels in many subregions for biota, and less so for sediments. As the input to the marine environment seems to be decreasing, the rise in increasing upward time trends is making the goal of pollution-free oceans difficult to achieve. In general, the status is good for metals except mercury.
Mercury was found to be problematic in all areas for shellfish and fish, being above both the BAC for mussels and the QSsp assessment criteria. Mercury is the only metal with a defined EQS value for biota in the EU Water framework Directive. In sediments, mercury was above the ERL assessement criteria in four of the seven regions with data, with the Irish and Scottish West Coast below background assessment concentrations, and Northern North Sea and Iberian Sea above BAC but below the ERL.
For Lead and cadmium, levels for shellfish and fish were above background in nine or ten of the 13 areas, with both below BAC in the Irish and Scottish West Coast. The Celtic Seas, Iberian Sea and Northern Bay of Biscay were above background levels for cadmium and the Norwegian Sea and Greenland-Scotland ridge for lead. In sediments, lead was similar to mercury compared to ERL. For Cadmium, no areas were above the ERL, and all areas below ERL for mercury and lead was below BAC for mercury, together with the Irish Sea.
The trends for mercury were either upwards (Southern North Sea, English Channel and Northern Bay of Biscay) or not significant in fish and shellfish. For cadmium and lead the same areas exhibited increasing trends, but declining trends was observed in the Norwegian Trench for both cadmium and lead, in the Irish Sea for cadmium and in the Norwegian Sea and Iberian Sea for lead. In the five areas with time trends for sediments, all mercury trends were decreasing, except the English Channel with no trend. Cadmium was increasing in the English Channel and Irish Scottish West Coast, but decreasing in the Southern North Sea, with lead decreasing in both the Southern North Sea and Irish Sea. The discrepancy between the direction of mercury time-trends in biota and sediment could be an indication that mercury is being released from the sediment e.g. due to warming trends increasing oxygen deficit and increasing sediment methylation, or increased influx from the atmosphere, not yet reaching the sediment. More detailed studies of mercury circulation in the North Sea are needed to conclude on this, though. In the Southern North Sea, also lead and cadmium are decreasing in the sediment but increasing in biota, whereas increasing trend of cadmium is observed in both sediment and biota in the English Channel. In the Irish Sea, decreasing trends of cadmium in biota and lead and mercury in sediment is observed, whereas no trend is observed in sediment or biota for the same metals. Most sediment data are from more open areas, whereas shellfish samples are mostly coastal, and fish can be both. The time-trends could therefore also signify a difference between coastal, more directly polluted waters, and open water with large dilution from land-based sources.
Zinc and copper concentrations in shellfish and fish are also above the background concentration all areas, with sediment concentrations in copper only above ERL in the Celtic Sea, but zinc and chromium above ERL in both Southern North Sea, English Channel, Irish Sea and Celtic Sea, including the Irish and Scottish West Coast for chromium. For many other metals, no assessment criteria are available (arsenic, cobalt, nickel, selenium, silver and tin), but time-trends in biota are both showing upward and downward trends, varying from metal to metal and area to area, with some areas mainly increasing (Celtic Sea, Southern North Sea, English Channel) and others decreasing (Irish and Scottish West Coast). Shipping traffic and heavy industry could be the sources of pollution, but for sediments, copper and zinc which would be expected to correlate with shipping intensity are only showing downward trends, indicating more local studies and assessments are probably needed to explain the results. Only Arsenic (Northern North Sea) and cadmium showed increasing trends in sediments, noting that only five areas had enough data for time-trend analysis.
Despite the global convention on mercury, and much legislation on reducing or banning mercury and other metals being in place, time trends are showing increasing levels in many subregions for biota, and less so for sediments. As the input to the marine environment seems to be decreasing, the rise in increasing upward time trends is making the goal of pollution-free oceans difficult to achieve. In general, the status is good for metals except mercury.
Knowledge Gaps
There is a lack of ecotoxicological data for developing new assessment criteria based on the European Union Water Framework Directive or OSPAR Environmental Assessment Criteria (EAC) principles, to replace the current ERL criteria. Thresholds for trace metals in sediments, fish and shellfish should be developed or updated.
The reasons for the increasing concentrations of trace metals in biota, particularly in the Southern North Sea and Channel need to be investigated to identify the sources or environmental processes. Links between metal concentrations and confounding factors like the size of shellfish and fish, the condition of the species analysed, trophic level and dry weight/lipid concentrations should be investigated further.
Missing agreed assessment criteria and conversion factors between organs are the main knowledge gap to improve the assessment and OSPAR area status:
- Development and agreement on assessment criteria (eg. EQS (QSsp)) values in biota for cadmium, lead, and other metals to be used as environmental thresholds in future assessments. Establishing standard distribution factors between liver, muscle, and whole fish for metals in different species for recalculation of concentrations measured in existing monitoring to comparison with the environmental thresholds. Extension of the CEMP to top predator species like marine mammals and bird/bird eggs should be considered, where new information or spatial coverage could be gained from this.
- Development of QSsediment criteria based on the WFD/MSFD principles for reliable assessment of the impact of sediment concentrations on the marine environment, to replace the current ERL thresholds.
- Development of a better understanding of why concentrations of metals in fish and shellfish are increasing, despite perceived decreasing inputs to the marine environment, and decreasing trends in sediments. The increasing concentrations of cadmium in the Southern North Sea found in the IA 2017 seems now to have spread to the Northern North Sea and Channel subregions, and lead and mercury are also showing more upward than downward trends than previously, and for more Regions.
Ackerman JT, Eagles-Smith CA, Herzog MP, Hartman CA. (2006) Maternal transfer of contaminants in birds: mercury and selenium concentrations in parents and their eggs. Environ Poll. 2016;210:145–154
AMAP, 2021. AMAP Assessment 2021: Mercury in the Arctic. Arctic Monitoring and Assessment Programme (AMAP), Tromsø, Norway. 324 pp https://www.amap.no/documents/doc/amap-assessment-2021-mercury-in-the-arctic-uncorrected-proofing-draft/3581
Baines, C.,Lerebours, A, Thomas, F, Fort, J, Kreitsberg, R, Gentes, S, Meitern, R, Saks, L, Ujvari, B, Giraudeau, M, Sepp, T. (2021). "Linking pollution and cancer in aquatic environments: A review." Environment International 149: 106391.
Dietz, R; Fort, J; Sonne, C; Albert, C; Bustnes, J.O; Christensen, T. K.; Ciesielski, T.M; Danielsen, J; Dastnai, S; Eens, M; Erikstad, K.E; Galatius, A; Garbus, S.E.; Gilg, O.; Hanssen, S.A.; Helander, B; Helberg, M; Jaspers, V; Jenssen, B.M.; Jónsson, J.E; Kauhala, K; Kolbeinsson, Y; Kyhn, L A.; Labansen, A.L.; Larsen, M.M.; Lindstrøm, U; Reiertsen, T.K.; Rigét, F.F.; Roos, A; Strand, J; Strøm, H; Søndergaard, J; Sun, J; Teilmann, J; Therkildsen, O. R.; Thórarinsson, T.L.; Tjørnløv, R.S.; Wilson, S; Eulaers, I (2021) A risk assessment of the effects of mercury on Baltic Sea, Greater North Sea and North Atlantic wildlife, fish and bivalves, Environment International,Volume 146, ISSN 0160-4120, https://doi.org/10.1016/j.envint.2020.106178
Duffus J. H. 2002, " 'Heavy metals'—A meaningless term?", Pure and Applied Chemistry, vol. 74, no. 5, pp. 793–807, https://doi.org/10.1351/pac200274050793.
European Commission (EC) (2006). European Union: Commission Regulation (EC) No. 1881/2006 of 19 December 2006 setting maximum levels for certain contaminants in foodstuffs
European Commission (EC) (2011) Guidance Document No. 27 Technical Guidance for Deriving Environmental Quality Standards. Technical Report - 2011 - 055 ISBN: 978-92-79-16228-2 DOI: 10.2779/43816 https://circabc.europa.eu/w/browse/a3c92123-1013-47ff-b832-16e1caaafc9a
European Commission (EC) (2014) Common Implementation Strategy for the Water Framework Directive (2000/60/EC): Guidance Document No. 32 on biota monitoring (the implementation of EQS Biota) under the WFD. Technical Report 2014-083.
Kersten, M., and Smedes, F. (2002) J. Environ. Monit., 4, p 109–115 Normalization procedures for sediment contaminants in spatial and temporal trend monitoring
Kibria, Golam & Nugegoda, Dayanthi & Rose, Gavin & Haroon, A K. (2021). Climate change impacts on pollutants mobilization and interactive effects of climate change and pollutants on toxicity and bioaccumulation of pollutants in estuarine and marine biota and linkage to seafood security. Marine Pollution Bulletin. 167.
Krabbenhoft, D. & Sunderland, E. (2013). Global Change and Mercury. Science (New York, N.Y.). 341. 1457-8. 10.1126/science.1242838.
Larsen M.M., Blusztajn J.S., Andersen O., Dahllöf I. (2012). Lead isotopes in marine surface sediments reveal historical use of leaded fuel. Journal of Environmental Monitoring, 2012:14, 2893-2901. https://doi.org/10.1039/c2em30579h
Liu, J., Qu, W., & Kadiiska, M. B. (2009). "Role of oxidative stress in cadmium toxicity and carcinogenesis." Toxicology and Applied Pharmacology 238(3): 209-214.
Loring, D.H, 1991 ICES Journal of Marine Science 48-1, p 101.-115 Normalization of heavy-metal data from estuarine and coastal sediments
MIME (2020) summary record. https://www.ospar.org/meetings/archive/working-group-on-monitoring-and-on-trends-and-effects-of-substances-in-the-marine-environment-mime-1
MIME (2021) Summary record. https://www.ospar.org/meetings/archive/working-group-on-monitoring-and-on-trends-and-effects-of-substances-in-the-marine-environment-2
NOAA (1999). Sediment Quality Guidelines developed for the National Status and Trends Program. National Oceanic and Atmospheric Administration, US Department of Commerce, United States of America. 12pp
O’Conner, T.P. (2004): Marine Pollution Bulletin 49, 383–385
OSPAR (2009) Agreement on CEMP Assessment Criteria for the QSR 2010. https://qsr2010.ospar.org/media/assessments/p00390_supplements/09-02e_Agreement_CEMP_Assessment_Criteria.pdf
OSPAR (2016) Mercury assessment in the marine environment. Assessment criteria comparison (EAC/EQS) for mercury. Hazardous Substances & Eutrophication series 679. https://www.ospar.org/documents?v=35403
OSPAR (2018). CEMP guidelines for monitoring contaminants in sediments. Revised in 2018. Agreement 2002-16. https://www.ospar.org/documents?d=32743
Signa, G, Mazzola, A, Tramati, C, Vizzini, S. (2017). Diet and habitat use influence Hg and Cd transfer to fish and consequent biomagnification in a highly contaminated area: Augusta Bay (Mediterranean Sea). Environmental Pollution. 230. 394-404. 10.1016/j.envpol.2017.06.027.
Streets, D.G.,Horowitz, H.M, Jacob, D.J., Lu, Z, Levin, L, ter Schure, A, Sunderland, E. (2017) Total Mercury Released to the Environment by Human Activities Environ. Sci. Technol. 51, 11, 5969–5977 DOI: 10.1021/acs.est.7b00451
UN, 2021. Press release: “Era of leaded petrol over, eliminating a major threat to human and planetary health“. https://www.unep.org/news-and-stories/press-release/era-leaded-petrol-over-eliminating-major-threat-human-and-planetary
Contributors
Lead authors: Martin Mørk Larsen and Dag Øystein Hjermann
Supported by: OSPAR Working Group on Monitoring and on Trends and Effects of Substances in the Marine Environment (MIME) and Hazardous Substances and Eutrophication Committee (HASEC).
Citation
Larsen, M. and Hjermann, D. 2022. Status and Trend for Heavy Metals (Mercury, Cadmium and Lead) in Fish, Shellfish and Sediment. In: OSPAR, 2023: The 2023 Quality Status Report for the Northeast Atlantic. OSPAR Commission, London. Available at: https://oap.ospar.org/en/ospar-assessments/quality-status-reports/qsr-2023/indicator-assessments/heavy-metals-biota-sediment
| Assessment type | Indicator Assessment |
|---|---|
| Summary Results | https://odims.ospar.org/en/submissions/ospar_heavy_metals_msfd_2022_06 |
| SDG Indicator | 14.1 By 2025, prevent and significantly reduce marine pollution of all kinds, in particular from land-based activities, including marine debris and nutrient pollution |
| Thematic Activity | Hazardous Substances |
| Relevant OSPAR Documentation | Agreement 2002-16 CEMP Guidelines for Monitoring Contaminants in Sediments. Revised 2018 |
| Linkage | https://www.ospar.org/documents?v=43227 |
| Date of publication | 2022-06-30 |
| Conditions applying to access and use | https://oap.ospar.org/en/data-policy/ |
| Data Results | https://odims.ospar.org/en/submissions/ospar_metals_biota_sed_results_2022_06/ |
| Data Snapshot | https://doi.org/10.17895/ices.data.21229139 |
| Data Snapshot | https://doi.org/10.17895/ices.data.18601820 |
| Data Source | https://dome.ices.dk/ohat/?assessmentperiod=2022 |